Abstract
Protonic ceramic fuel cells (PCFC) have emerged as a promising candidate for distributed power generation. The reduced temperature cells (∼500°C) have the potential to enable faster start-up times, longer life, and lower cost materials compared to oxygen-ion conducting fuel cells. However, the modeling of PCFCs is confounded by several challenges, including estimating open circuit conditions for mixed charged conductors. Here we present the development of a PCFC computational framework for a predictive cell-level, interface charge transfer model capturing mixed conduction, as well as transients. Our approach employs a 1-D heterogeneous channel-level modeling strategy that resolves fuel depletion and flow configuration effects along the length of the channel and is coupled to a semi-empirical electrochemical model. The model is formulated in such a way that allows for easy integration of modeling parameters extracted from button cell experiments and performance scale-up to cell-level predictions. Humidified methane-fueled simulations display power densities above 0.125 W-cm−2 at 500°C, 0.15 A cm−2, and 80% fuel utilization cell conditions. Dynamic simulations indicate that the lower power density PCFCs (relative to solid oxide fuel cells) result in relatively slow thermal transients that could potentially dampen harmful effects of current-based fuel control during load-following operation.
Export citation and abstract BibTeX RIS

This is an open access article distributed under the terms of the Creative Commons Attribution 4.0 License (CC BY, http://creativecommons.org/licenses/by/4.0/), which permits unrestricted reuse of the work in any medium, provided the original work is properly cited.
The use of high temperature fuel cells as highly efficient, distributed generation devices has long been held as a technology capable of early adoption in many stationary markets. However, current fuel cell technologies are challenged by high capital costs (in part driven by lack of economy of production), low durability, and limited market opportunities without incentives.1,2 The ideal distributed energy generation device would have low capital costs, long life, high electrical efficiency, and dynamic load-following capability with the ability to rapidly start-up and shutdown. High temperature fuel cells, such as molten carbonate and solid oxide fuel cells, have demonstrated high efficiency1,2 but still exhibit high capital costs and limited dynamic response capabilities. In general, start-up and shutdown operations can be slow and complex due to the high temperature, ceramic nature of the device, and dynamic load-following capability is limited by both high thermal capacitance and balance-of-plant response. High penetration of variable, renewable energy resourses into the electric grid infrastructure is beginning to alter market application requirements and opportunities for distributed generation. In particular, the diurnal fluctuations in high penetration power generation from renewables is resulting in issues of curtailment and huge ramping requirements (e.g., GW/h) for centralized utility plants.3 To enable large shares of renewables, thus requires smoothing or shifting the net grid load. Several approaches to address the so-called 'duck curve' are being pursued including development of large-scale electrical energy storage,4 concentrating solar power plants with thermal energy storage,5 Power-to-Gas platforms,6–8 and dynamic dispatch of gas turbine plants.9 Regardless of the method, devices that are capable of rapid transient operation and can serve as flexible, dispatchable power generation sources could act as de facto energy storage (or minimally reduce grid storage capacity requirements), increasing the penetration of renewables through load-following operation and grid flexibility, thereby increasing their market value proposition.
Interestingly, emerging protonic ceramic fuel cell (PCFC) technology10–13 may offer some solutions to the high cost and rapid start-up and shutdown limitations of other fuel cell technologies. PCFCs are a novel electrochemical energy conversion device, which bridges the gap between high temperature solid oxide fuel cells (SOFCs) and low temperature proton exchange membrane (PEM) fuel cells while using a solid state electrolyte.12 The intermediate temperature nature of PCFCs, enabled by the high mobility of proton defects relative to oxygen vacancies, combined with the potential for low stack and system costs,14 make them attractive for distributed energy generation applications. A reduced operating temperature also facilitates lower system capital costs due to both a reduction in heat exchanger capacity requirements and lower materials costs by reducing the need for expensive high temperature alloys. Furthermore, start-up and shutdown transients can be substantially minimized if the difference between the operating and ambient temperature is reduced. Protonic ceramic devices have also been shown to be capable of high per-pass utilization without performance loss.15 Direct operation on humidified methane,12 higher hydrocarbons, and alcohols13 where the restrictive nature of high purity hydrogen fuel sources or complex fuel processing is not a concern. Thus, PCFCs could provide a path to high efficiency distributed energy generation while simultaneously increasing the grid penetration of renewable resources.
In the present work we develop new engineering models of protonic ceramic fuel cells and investigate their steady-state and dynamic performance characteristics using the latest advancements in PCFC technology. We first present an overview of the operational characteristics of mixed ionic/electronic charge conducting PCFCs and review prior modeling efforts for such devices. The modeling approach for predicting cell performance is given next and follows a one-dimensional, dynamic cell model formulation using heterogeneous mass and energy balances coupled with a semi-empirical, electrochemical interface charge transfer model for multiple charged defects derived from button cell data. Because the proton-conducting cell is envisioned to be supplied with carbonaceous fuels,13 multi-dimensional operational windows that avoid coke formation are explored through variation in the oxygen-to-carbon ratio, temperature, and fuel utilization parameter space. Model calibration and simulation results for planar, co- and counter-flow configured cells are presented next, followed by a brief summary of the expected dynamic response for PCFCs. The paper concludes with a summary of findings.
Theory of operation
Protonic ceramic fuel cells employ material sets, such as yttrium doped barium zirconate (BZY) or BZY-doped with cerium and ytterbium (BCZYYb), which exhibit conduction of multiple charged defects and are, therefore, fundamentally different than oxygen-ion conducting SOFCs or MCFCs. The BZY perovskite material exhibits both non-stoichiometry and hydration where oxygen transport is possible via oxygen vacancies and proton conductivity occurs due to protonic defects. The material also exhibits a small amount of electronic conductivity (via small polarons) in which fuel and air can be consumed without electrons being conducted through the external circuit. The anode is constructed from a BZY-Ni cermet which promotes separate electronic and ionic conducting phases and charge transfer reactions at the three phase boundary (TPB) as shown in Fig. 1. The nickel surface can participate in the heterogeneous steam methane reforming and water-gas shift reactions such that operation on a humidified methane fuel source is possible. Cathode materials have recently received increased attention and compositions giving rise to 'triple conductivity' have been tested which substantially reduce cell polarization and enable high power densities at practical voltage and current density conditions.12 This model considers a cobalt and iron-doped BZY cathode material, however, double perovskites16 have been investigated as well.
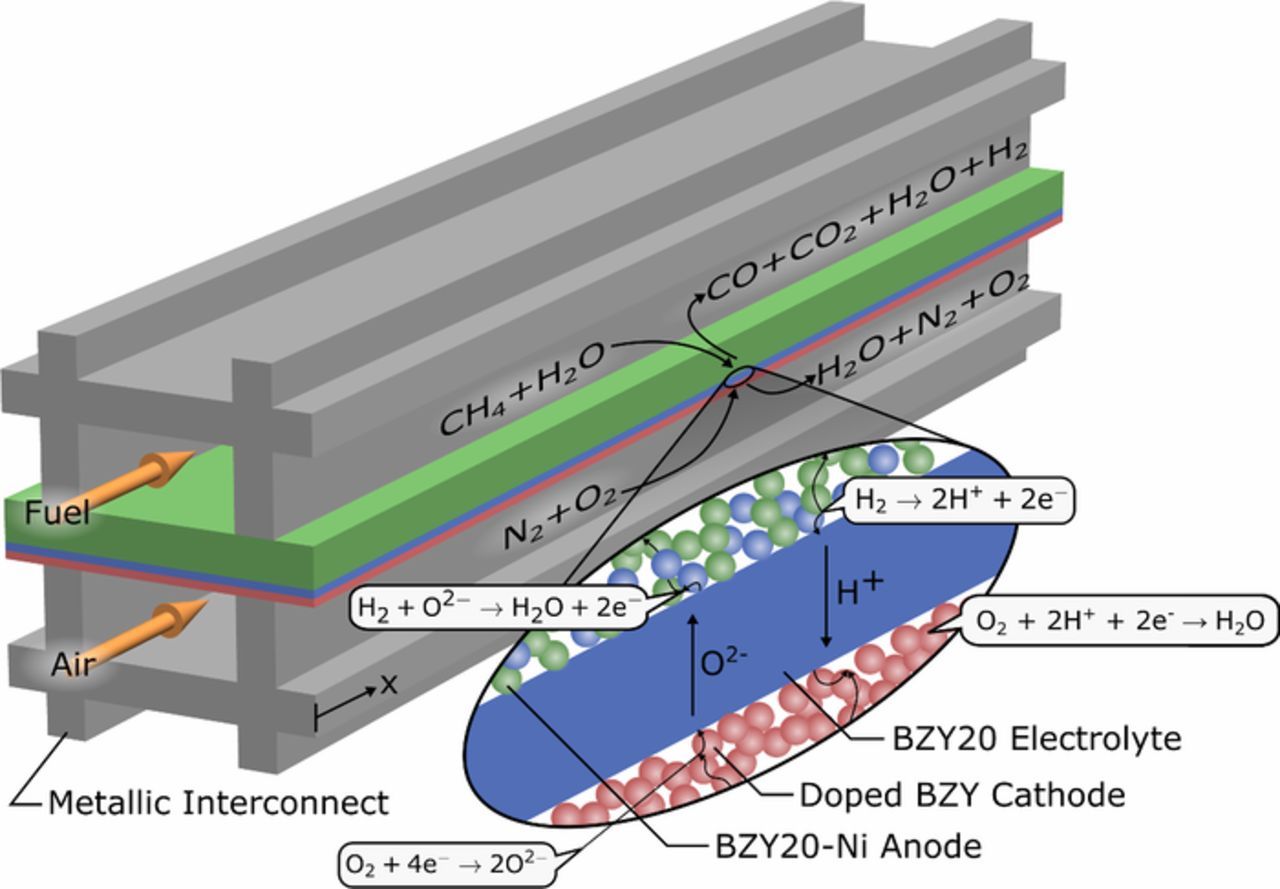
Figure 1. Illustration of the operation of an internal reforming, co-flow, planar protonic ceramic fuel cell.
The transport of multiple-charged defect species during both operation and at open circuit conditions complicates the electrochemical analysis of the device.17 Recently developed membrane models have tried to resolve the highly coupled transport processes, however, the models have yet to be coupled with electrodes to predict the open circuit voltage and current voltage characteristics. Typically, PCFCs exhibit an open circuit voltage (OCV) which is lower than the theoretical Nernst potential due to the dynamic nature of equilibrium where thermodynamic and transport properties influence the result. Additionally, protons as well as oxygen ions can contribute to the charge transfer which can result in the formation of water at both the anode and cathode. The reactions associated with proton transfer are given as Eqs. 1 and 2 below. PCFCs also exhibit a small amount of oxygen ion conduction, and the resulting electrochemical reactions for the mobile oxygen ion are given as Eqs. 3 and 4.
![Equation ([1])](https://content.cld.iop.org/journals/1945-7111/166/10/F687/revision1/d0001.gif)
![Equation ([2])](https://content.cld.iop.org/journals/1945-7111/166/10/F687/revision1/d0002.gif)
![Equation ([3])](https://content.cld.iop.org/journals/1945-7111/166/10/F687/revision1/d0003.gif)
![Equation ([4])](https://content.cld.iop.org/journals/1945-7111/166/10/F687/revision1/d0004.gif)
The overall global oxidation reaction ( ) is permissable at either anode or cathode electrodes for mixed ion conductors. However, since the calculation of a Nernst potential can proceed using the water partial pressure in either the anode or cathode channels, a unique value for OCV cannot be established given the variation in these respective water concentrations. Thus, any modeling effort necessarily needs to provide a means for accurate estimation of the open circuit potential for cells involving appreciable mixed ionic conduction.
Prior modeling efforts
Even considering the complicated nature of PCFCs, significant efforts have already been undertaken in modeling devices of this nature. However, the majority of the models are restrictive due to one or more of the following limitations: only consideration of proton transport in the electrolyte; operation on only a hydrogen fuel source; assumption of either isothermal operation or a lumped analysis; and neglect of OCV reduction due to non-equilibrium conditions at open circuit. All of these limitations become important when considering an engineering model to be integrated into system-level analysis.
Historically, reduced-order modeling of SOFCs in either one or two dimensions has been thoroughly investigated and reported in the literature.18–24 Both steady-state and dynamic models have been developed and verified against experimental results for both planar and tubular devices. In this study, the modeling methodologies commonly employed for SOFCs are extended to the physicochemical phenomena unique to PCFCs in order to develop a planar, interface charge-transfer channel model that can represent the expected performance of a single cell.
Several modeling efforts for PCFCs have been undertaken,25–30 however, these models have only considered high temperature cells (>700°C) with exclusively proton flux in the electrolyte. Additionally, several of the studies only consider a lumped geometry while others only consider a hydrogen fuel source. Recently several BZY20 membrane modeling studies17,31 have considered multicomponent charge transfer; however, electrodes have yet to be modeled where equilibrium boundary conditions are employed and a resulting full PCFC model based on first principles is posed. Overall, practical engineering models of PCFCs which enable cell operating parameter selection, system design, and performance estimation are needed.
Prior modeling efforts from the extant literature which provide context to the present work are highlighted here. Ni et al. has presented several modeling studies26–29 on both 1-D and 2-D channel-level models for planar PCFC devices. The majority of this work focused on the modeling of concentration overpotentials with proton conduction only and comparisons to SOFC devices. More recent work has focused on modeling hydrocarbon fuel sources and the effect of internal reforming reactions on PCFCs, however, these studies have all been at higher temperatures with only proton transport. The more rigorous problems of charge transfer and mixed conduction have yet to be addressed.
Patcharavorachot et al.30 developed an electrochemical model for a cell operating on a hydrogen fuel source; the model was verified against high temperature button cell data. The model considered proton transport across the electrolyte and a global form of the Butler-Volmer equation. Concentration overpotentials were captured through a Fickian model, which was stated to be a better approach due to the explicit nature of the formulation in comparison to the dusty gas model. In their work the cell geometry was varied through the support structure of anode, cathode, and electrolyte, concluding that the anode supported design is the best. Dumortier (2012) et al. used commercial CFD tools to model a proton-conducting electrolysis cell which considered gas transport along the length of a channel and through the porous electrodes, however, thermal effects and carbonaceous byproducts were not considered. The model development focused on the charge and mass transport through the porous electrode materials and a parametric study was conducted to determine the effect of porous media design parameters on cell performance. Zheng et al.32 developed an electrochemical modeling approach which considered both proton and oxygen ion transport through the electrolyte which was termed 'co-ionic'. The model incorporated two Nernst potential calculations which were reduced by individual activation overpotentials, ohmic overpotential, and concentration overpotential. The contribution of the current density from protons and oxygen ions was determined by requiring that the potential of each electrochemical reaction was equal. The model was solved by a unique, iterative approach that varies proton current and oxide ion current until the net potential of each electrochemical reaction was equal to the desired cell operating voltage. A concern with this approach is defining and measuring exchange current densities for the electrodes that conduct multiple ions as well as electrons. Furthermore, Zheng et al. only used a single ionic conductivity for the co-ionic membrane when quantifying ohmic polarization in the fuel cell, even though multiple ions are mobile. Another concern is that the model does not take into account the loss of potential due to multiple charged defects being mobile under a zero current condition, and thus results in an over prediction of open-circuit potential.
Huang et al.33 used fundamental charged defect chemistry to derive an expression for the open-circuit voltage (OCV) of a co-ionic SOFC. The mobile species considered were protons, oxide ions, and electrons. The model focused on the effect of multiple mobile species in the electrolyte and neglected losses that occur in the electrodes or the transport of reactants to the reaction zone. The resulting OCV becomes a function of the potentials of each electrochemical reaction (Eqs. 1–4) and the ionic conductivities of the two mobile ions in the membrane. The main difficulty with this approach is measuring or obtaining the individual ion conductivities in the electrolyte. There are multiple mobile charged species, so careful experiments must be performed to distinguish the conductivity of one ion from another in the electrolyte membrane.
More recently, Menon et al.34 developed a 'quasi' 2-D channel-level model of a proton-conducting SOFC including internal reforming of methane to resolve temperature and species profiles over the length of the cell. However, the electrochemical model was based on pure proton conductivity and did not capture the deviation from experimentally measured OCV and theoretical Nernst potentials which led to overpredictions of the model voltage at low current densities. To correct for the over-predicted voltage at low current densities, a Butler-Volmer formulation for predicting activation overpotentials was implemented which led to concavity in the voltage-current model predictions not observed in the experimental data. Additionally, the simulations focused on higher temperature operation (>700°C) where internal reforming of methane is highly favored. Zhu and Kee35 present a mixed ionic-electronic conductor model for a BZY10-type cell in a button cell configuration. Defect transport of protons, oxygen anions (vacancies), O-site polarons (~electrons), and lattice oxygen are captured. This model includes transport and reaction in the porous gas diffusion electrodes including on-anode reforming kinetics, mixed conduction in the membrane itself, and is a distributed charge transfer model that quantifies the electrostatic potential gradient across the membrane electrode assembly. However, while capturing oxygen anion transport, this model does not consider the possibility of electrochemical oxidation of hydrogen at the anode due to oxygen vacancy transport (anions) into the triple-phase boundary.
Unlike prior work, the present modeling effort is focused on an interface charge transfer model (i.e., no electrostatic potential gradients normal to gas flow) for intermediate-temperature ranges (∼450-600°C) that includes internal-reforming, multiple charged defect transport, and spatially resolves species and temperature profiles and their associated effect on ohmic and activation overpotentials in the gas streamwise direction. Electrochemistry within the model considers the electrochemical oxidation of hydrogen by oxygen anions in the anode-side triple-phase boundary as well. The electrochemical model is semi-empirical in nature, however, it has been formulated in such a way that allows for calibration from button-cell experimental data and rapid scale-up to cell-level model predictions. The resulting cell-level performance prediction accounts for the coupled effects of mixed proton and anion transport, reactant flow configuration, fuel depletion, non-isothermal behavior, and finite-rate reforming kinetics.
Modeling Methodology
One of the primary goals of developing an engineering cell-level model for devices based on protonic ceramics is to provide a tool that can scale the results obtained from button cell experimentation to predict full-scale cell performance in the presence of high fuel utilization, temperature gradients (arising from quasi-adiabatic operation), and finite hydrocarbon reforming kinetics. The highly coupled physics of the processes create distributions over the cell length, which must be resolved to accurately predict cell performance. The cell model presented here was developed with the purpose of being computationally efficient enough to run stack and system simulations that can support experimental cell/stack testing, process systems design and analysis, and control strategy development, while still retaining a high enough resolution to resolve all of the gradients along the flow channel.
However, there are additional considerations that need to be made when extending this model to a stack level simulation. There are recent literature on new approaches to stack modeling in which decoupling the cell electrochemical and mass transport dynamics (fast transients) from the stack thermal effects (slow transients) is exploited.36 This enables large differences in time scales for each physical phenomena that simplifies the dynamic problem and allows for fast stack computation times while retaining modeling fidelity for the cell electrochemistry.
One-dimensional, plug flow, interface charge transfer models have been thoroughly investigated in the SOFC literature18,19,22,23,37,38 and calibrated against button cell experiments to develop computational modeling tools capable of aiding in the system design process. A similar approach is adopted here, however, some of the modeling assumptions typically employed in SOFC modeling are not valid for PCFCs, particularly in the lower temperature operating regime. A 1-D, dynamic heterogeneous cell model has been developed where the fuel and air channels are modeled as plug flow reactors and are coupled to an electrochemical submodel which captures the coupled effects of gas diffusion through the porous electrodes and the associated concentration polarization. The complicated nature of the transport of multiple charged species in the electrolyte, even under open circuit conditions,39 led to a semi-empirical electrochemical modeling approach. The detailed modeling equations are developed in the following sections.
Dynamic conservation equations
The modeling approach requires the solution of 1-D plug flow conservation equations for the anode and cathode gas channel mass, species, momentum, and energy balances. The equations have been written in their conservative form applying the product rule of differentiation to the temporal terms such that derivatives of state-space variables are isolated. The fuel and air gas channel mass balance equations are given by Eqs. 5 and 6, respectively. The equations capture the transient mass holdup, convective transport, and source term  due to the electrochemical reactions.
![Equation ([5])](https://content.cld.iop.org/journals/1945-7111/166/10/F687/revision1/d0005.gif)
![Equation ([6])](https://content.cld.iop.org/journals/1945-7111/166/10/F687/revision1/d0006.gif)
where ρ is fuel or air density,  is the gas velocity, Mi is the molecular weight of species i, and H is the height of the anode or cathode gas channel. The mass source term can be related to the local current density as,
![Equation ([7])](https://content.cld.iop.org/journals/1945-7111/166/10/F687/revision1/d0007.gif)
where jk is the current attributed to the kth charge transfer reaction, F is Faraday's constant, and ν are the molar stoichiometric coefficients.
The species balance equations for the fuel and air gas channels are given by Eqs. 8 and 9, respectively. In addition to the terms captured in the mass balance equations, the mass species balance captures the consumption and production of mass species (yi) via heterogeneous chemical reaction rates  that are discussed in the fuel reforming section and in Eqs. 29−31.
![Equation ([8])](https://content.cld.iop.org/journals/1945-7111/166/10/F687/revision1/d0008.gif)
![Equation ([9])](https://content.cld.iop.org/journals/1945-7111/166/10/F687/revision1/d0009.gif)
The momentum balance equations for the fuel and air gas channels are not dynamic and are given by Eqs. 10 and 11, respectively. The momentum balance captures the pressure gradient ( ), wall shear stress (τw), and convective momentum transport. The shear stress experienced at the channel walls is determined from empirical correlations for rectangular ducts as given in Ref. 47.
![Equation ([10])](https://content.cld.iop.org/journals/1945-7111/166/10/F687/revision1/d0010.gif)
![Equation ([11])](https://content.cld.iop.org/journals/1945-7111/166/10/F687/revision1/d0011.gif)
Thermal energy equations for the fuel and air gas channels are necessary for resolving the temperature distribution. Terms associated with convective energy transport, heterogeneous reaction, electrochemical reaction, and gas-solid convection with the PEN and interconnect surfaces are included.
![Equation ([12])](https://content.cld.iop.org/journals/1945-7111/166/10/F687/revision1/d0012.gif)
![Equation ([13])](https://content.cld.iop.org/journals/1945-7111/166/10/F687/revision1/d0013.gif)
where λpen, int are the convective heat transfer coefficients between the respective gases and the solid surfaces of either the PEN or the interconnects of the cell, respectively. The terms associated with heterogeneous chemical reaction have been specified as heat fluxes which relate to the reaction rate and species enthalpy (hf, i) as
![Equation ([14])](https://content.cld.iop.org/journals/1945-7111/166/10/F687/revision1/d0014.gif)
The gas phase conservation equations must be coupled with the energy balances for the PEN and interconnect solid structures. Here a lumped analysis has been assumed where the PEN and interconnect temperatures are only resolved in the channel direction. The PEN energy balance captures terms associated with axial conduction, internal reforming, electrochemical oxidation and gas-solid convection via convective coefficients (λpen).
![Equation ([15])](https://content.cld.iop.org/journals/1945-7111/166/10/F687/revision1/d0015.gif)
where tpen is the thickness of the PEN repeating layer and tpen = tan + tca + tel. The interconnect energy balance only captures the terms of axial conduction and gas-solid convection and is expressed as,
![Equation ([16])](https://content.cld.iop.org/journals/1945-7111/166/10/F687/revision1/d0016.gif)
Electrochemical submodel
Performance of the electrochemical conversion device requires the channel-level conservation equations to be coupled to a submodel which is predictive of the current-voltage relationship of the device. Importantly, a fundamental difference between SOFC and PCFC modeling is that protonic ceramics exhibit continual charge defect transport even under zero electronic current (i.e., open circuit) conditions. The three mobile charged defects (protons, oxygen vacancies, and polarons) in the BZY electrolyte can exhibit a charge-balanced ionic current while still incurring no net electronic current39. That is, oxygen and hydrogen are transported across the ceramic membrane even when the cell is not polarized. In an SOFC or PEMFC, there is only one mobile charge carrier in the electrolyte, so there can be no charged-balanced ionic current without there being a non-zero electronic current. Unlike SOFCs, PCFCs at open circuit are in a state of non-equilibrium, and as a result, the energy required to sustain defect transport effectively lowers the actual OCV below the theoretical value that is based on equilibrium thermodynamics.17 To properly capture this effect, an electrochemical model which has provisions for both reduced OCV and transport of multiple charge carriers is required. In particular, it is necessary to have transport properties (ion conductivities) to distinguish between the amount of charge transferred via oxygen ions and hydrogen protons. However, proton and anion conductivity in protonic ceramic materials is notoriously difficult to measure.
To address these challenges, the approach taken here leverages the work of Shimada et al.40 who used the definition of the ionic transference number (tion) to reduce the cell OCV from the Nernst potential calculation of both global electrochemical reactions from Eqs. (1–4). The Nernst potential for each electrochemical oxidation reaction is calculated by Eqs. 17 and 18, where the subscript "O" means the term is in reference to Reactions 3 and 4 where the oxygen anion is transported through the membrane. The subscript "H" means the term is in reference to Reactions 1 and 2 where a proton is the charge carrier. The species partial pressures, pk, an and pk, ca are the partial pressures of the species at the fuel side triple phase boundary and air side triple phase boundary, respectively. The ionic transference number is the sum of the individual proton and oxide ion transport numbers ( and
and  ), and it can also be represented using Eq. 19. The true value of tion is inherently a function of proton and oxide ion conductivities in the electrolyte. However, open circuit button cell experiments can be used to empirically determine a tion for a given cell assembly. Eq. 20 adjusts the calculated Nernst potential associated with each global electrochemical reaction to a lower OCV value that takes into account the state of non-equilibrium at open circuit of PCFCs using tion. The Nernst potential of each oxidation reaction is weighted according to the amount of current contributed to the total current from each reaction. The parameter xO/T represents the ratio of current coming from the transport of oxygen anions to the total current. It has been shown to be temperature dependent and ranges from 0.024 to 0.046 under reduced atmosphere at normal cell operating conditions.41 The fraction of current due to oxygen ion transport is calculated at any discrete position in the cell channel using Eq. 21.
![Equation ([17])](https://content.cld.iop.org/journals/1945-7111/166/10/F687/revision1/d0017.gif)
![Equation ([18])](https://content.cld.iop.org/journals/1945-7111/166/10/F687/revision1/d0018.gif)
![Equation ([19])](https://content.cld.iop.org/journals/1945-7111/166/10/F687/revision1/d0019.gif)
![Equation ([20])](https://content.cld.iop.org/journals/1945-7111/166/10/F687/revision1/d0020.gif)
![Equation ([21])](https://content.cld.iop.org/journals/1945-7111/166/10/F687/revision1/d0021.gif)
At this point, the open circuit potential of the cell has been established after accounting for the losses due to sustaining the transport of multiple charge carriers. Next, much like a typical SOFC, the calculated OCV is reduced by the activation polarization and ohmic overpotentials through the area specific resistance (ASR), which yields the cell operating voltage at a given current density (j) using Eq. 22. EIS measurements at OCV with various gas compositions and temperatures allow for the extraction of ohmic and electrode polarization resistance parameters that depend on cell temperature and key partial pressures at the anode and cathode. The derived functional form of the ASR equation allows for both Arrhenius temperature dependence in the form of an activation energy in the exponential term and gas composition dependence in the pre-exponential term. Button cell experiments show that ohmic resistance of the cell is not dependent on gas composition, but the polarization resistance is dependent on the hydrogen pressure in the anode and the water pressure in the cathode. These are presented as Eqs. 23 and 24. The use of a semi-empirical electrochemical model relies on the calibration of several modeling parameters to experimental data which can be extracted from button cell experiments; this is discussed further in the button cell model calibration section. The cell operating voltage, calculated in Eq. 22, accounts for four losses occurring in the PCFC; multiple ion transport losses at open circuit with tion, concentration losses that are incorporated into the Nernst potential via Dusty Gas transport to the TPB, ohmic resistance losses, and activation (kinetic) losses.
![Equation ([22])](https://content.cld.iop.org/journals/1945-7111/166/10/F687/revision1/d0022.gif)
![Equation ([23])](https://content.cld.iop.org/journals/1945-7111/166/10/F687/revision1/d0023.gif)
![Equation ([24])](https://content.cld.iop.org/journals/1945-7111/166/10/F687/revision1/d0024.gif)
![Equation ([25])](https://content.cld.iop.org/journals/1945-7111/166/10/F687/revision1/d0025.gif)
Although the fundamental theory to capture transport in multiple charged defect conductors (MCDCs) has been developed,17 it relies on transport and thermodynamic parameters which are material specific and must be determined from experimental measurements.42 Coupled experimental approaches are needed, such as thermogravimetric analysis, and conductivity and conductivity relaxation experiments. Since the determination of thermodynamic and transport parameters for a given MCDC is a prohibitively rigorous task, the development of a semi-empirical method for the scale-up of button cell results to commercial-scale cell platforms provides an immediately useful tool while the basic composition of the cell is still being investigated. For example, the use of various sintering aids in the electrolyte material have shown increased conductivity leading to improvements in power density; however, as noted, above the observed OCV is reduced due to energy requirements in supporting the increased charged defect transport under net zero conditions.12 As cell-level performance is typically determined by the characteristic of the polarization curve between OCV and maximum power density, the implication of different sintering aids on cell performance is not obvious. Thus, a rapid approach which uses button cell experimental results to perform cell-level studies would provide a useful engineering tool.
To predict the gas phase composition at the TPB, necessary for resolving the OCV and ASR variables, a transport model is used to capture the concentration overpotential of gas phase mass transport through the porous anode and cathode from the bulk channel gas flow. Since the gas phase mass transport from the bulk channel to the TPB does not occur by equimolar counter diffusion in the anode as it does in an SOFC, the general form of the Dusty-Gas model43 is used to provide the functional relationship between the species concentration profile and molar flux. The relationship is given as,
![Equation ([26])](https://content.cld.iop.org/journals/1945-7111/166/10/F687/revision1/d0026.gif)
where Dek, Kn is the effective Knudsen diffusion coefficient for species k, Dekl is the effective binary diffusion coefficient, Bg is the permeability of the anode/cathode, μ is the vapor viscosity of the fuel/air gas stream,  is the driving force for diffusion, [Xk] and [Xl] are the molar concentrations of the species in the gas stream, [XT] is the total concentration, and Jk and Jl are the molar fluxes of species k and l.
While the dusty gas model (DGM) is used to describe gas diffusion in the porous electrodes, being a constitutive relation, the DGM itself does not include a transient term. It should be clear that gas diffusion dynamics within the porous electrodes are, therefore, not captured within the present model. It has been shown that time constants associated with gas transport dynamics within porous electrodes, being on the order of 10−1 s, are simply much faster than thermal transport dynamics (order 102 -103 s).17,23,44–46 As shown in subsequent sections, the transient simulation studies reported here were conducted with current density ramps over 1s intervals; the effects of electrode gas dynamics will thus not be resolved due to the faster timescales for gas diffusion. Nevertheless, not including the transient effects of mass transport through the porous electrodes does not alter the predicted transient response of cells and stacks in terms of voltage, temperature, and power output, which are driven by the thermal response of the solid cell layers. Given that this interface charge-transport, channel model was developed for engineering-level simulations that can support experimental cell/stack testing, process systems design and analysis, and control strategy development, inclusion of dynamic mass transport within gas diffusion electrodes is an appropriate model simplification and increases computational efficiency. Applications for which including dynamic mass diffusion terms are necessary include modeling electrochemical impedance spectra and electrode microstructural design.44,45
Closure relationships
In addition to the electrochemical submodel, closure relationships for the friction factors, convection coefficients, gas properties, and chemical reaction rates are necessary. The friction factor and convection coefficients are taken from Ref. 47 for laminar flow in rectangular ducts. The physical properties of the gas phase are based on the ideal gas equations of state and use MultiFlash48 to determine thermodynamic and transport properties assuming ideal mixing. The internal reforming reaction kinetics are based on the work of Timmermann et al.49
Boundary conditions and solution method
The solution of the partial differential and algebraic equations is obtained numerically through implementation in gPROMS modelbuilder.48 The transient conservation equations, which take the form of partial differential equations, have been spatially discretized through a finite volume method and the temporal terms are resolved through an ordinary differential equation time stepping algorithm (i.e., method-of-lines). Coupling the differential equations to the electrochemical submodel results in a system of differential-algebraic equations, which can be solved through the backward differentiation formula (BDF) method available in gPROMS.
The solution also requires the definition of boundary conditions to specify the inlet fuel and air composition and flowrate as well as coupling gas channel conservation equations and electrochemical submodel to the electrode conservation equations. The inlet mass flow rate of the fuel and air are specified by the fuel utilization (FU) and air ratio (AR), respectively, given,
![Equation ([27])](https://content.cld.iop.org/journals/1945-7111/166/10/F687/revision1/d0027.gif)
![Equation ([28])](https://content.cld.iop.org/journals/1945-7111/166/10/F687/revision1/d0028.gif)
 is the molar flow rate of fuel supplied to the cell; Icell is the current of the cell; and
  , and xf, CO are the mole fractions of those components supplied to the fuel inlet. In calculating the air ratio,
  is the molar flow rate of air supplied to the cell and
  is the mole fraction of oxygen at the air inlet.
Selection of Operating Conditions
The specification of the inlet fuel composition and utilization is constrained by the need to both avoid solid carbon deposition and to identify the desired degree of internal reforming within the anode. Unlike SOFC operation, PCFCs remove hydrogen from the anode gases and therefore, operate at fixed oxygen-to-carbon ratio and variable hydrogen-to-carbon ratio in the anode compartment. This characteristic means that as reactants are consumed along the cell, the tendency for carbon deposition increases under isothermal operation and becomes a maximum at the cell outlet. Thus, the desired operational conditions in terms of temperature, fuel utilization, and steam-to-carbon ratio (S/C) when operating on fuel mixtures of steam and hydrocarbons need to be determined. The addition of a small amount of pure oxygen to decrease the propensity for solid carbon deposition via partial oxidation could be considered -although, this comes at the expense of oxidizing a portion of the fuel stream.
Suppression of solid carbon deposition
Determining operating conditions which do not result in solid carbon formation can be obtained through thermodynamic equilibrium calculations. A Gibbs ternary diagram in the C-H-O compositional space is a useful graphic for the display of these calculations and is given for different temperatures in Fig. 2. Carbon deposition analysis has been previously presented for the operating regime of SOFC devices by Sasaki et al.;50,51 however, as noted above, operation of PCFCs is fundamentally different where protons are removed from the fuel channel rather than the addition of oxygen. This difference results in moving the fuel composition of PCFCs toward the solid carbon deposition boundary with increasing fuel utilization. This result is evident from the C-H-O ternary diagram (Fig. 2) where the solid carbon deposition boundary is plotted in compositional space for operating cell temperatures ranging from 400 to 600°C. The inlet fuel composition for humidified methane lies on the CH4-H2O line and removing protons will result in the composition moving directly away from the pure hydrogen vertex, which is toward the deposition boundary. However, crossing the boundary will only occur if fuel utilization is sufficiently high. Beginning with the same inlet composition for SOFC operation, the movement is toward the pure oxygen vertex and away from the deposition boundary, which is the reason only inlet compositions for SOFC operation need to be investigated.
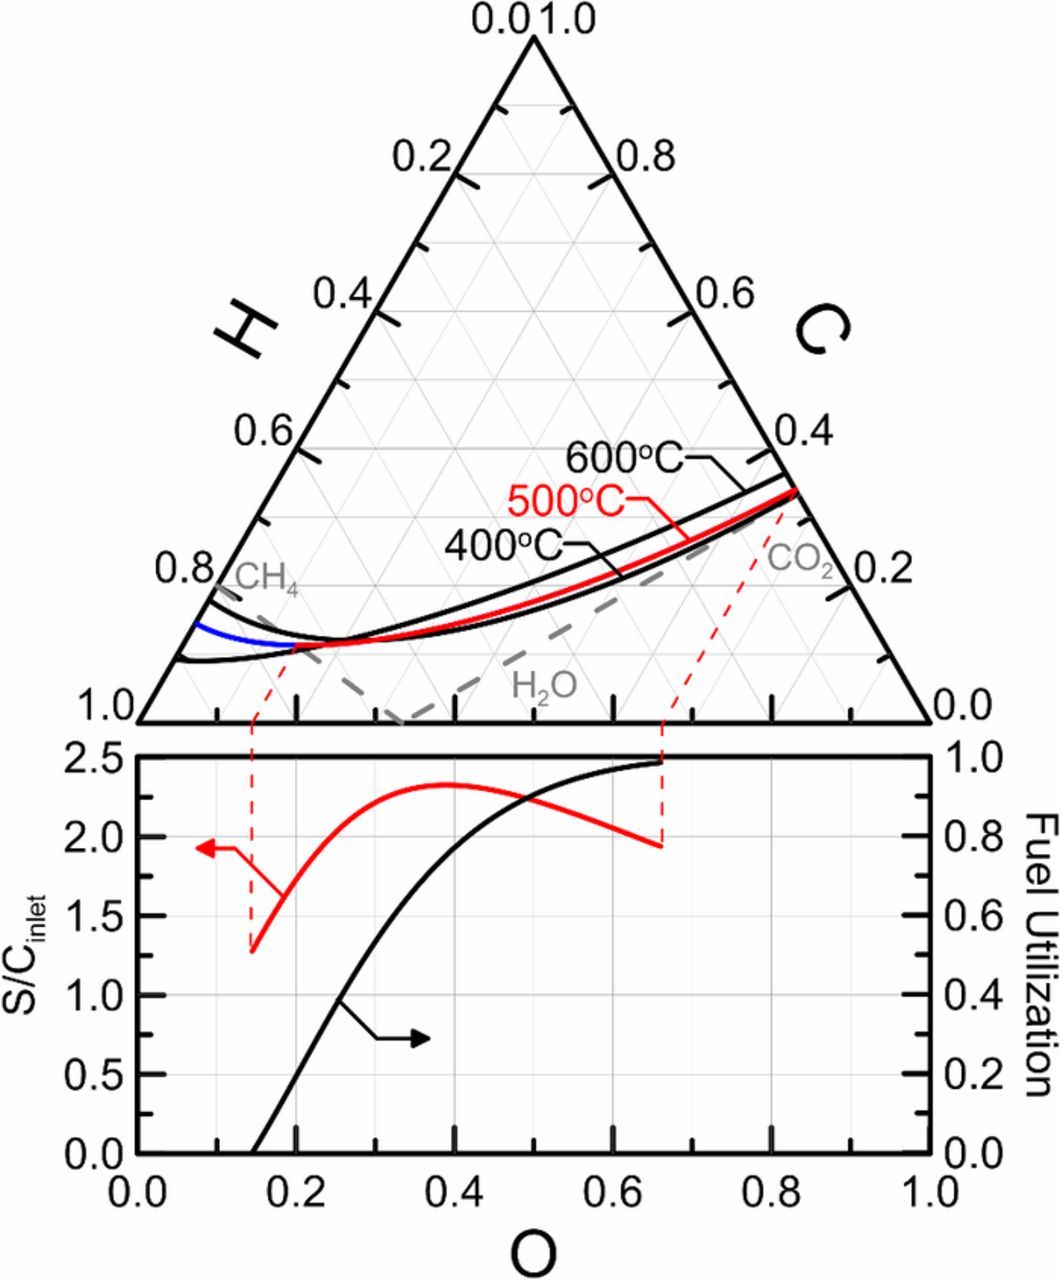
Figure 2. C-H-O ternary diagram displaying the boundary of solid carbon deposition at various temperatures and the steam-to-carbon (S/C) ratio required at a given fuel utilization.
The calculations for the solid carbon deposition boundary implements the LaGrange Method of Undetermined Multipliers to minimize the Gibbs free energy of the gas composition when solid carbon is formed.52 The method requires specification of the gas phase species in the mixture and solves a set of algebraic equations to determine the composition. The analysis was performed using Engineering Equation Solver53 and the internal ideal gas and graphitic carbon thermodynamic properties. The solid carbon deposition boundaries for three temperatures in the operating range of intermediate temperature PCFCs are plotted in Fig. 2, in which decreasing temperature is shown to have restrictive effects on the compositional space available for operation. In addition to solving for the solid carbon deposition boundary, the inlet S/C ratio needed to avoid deposition for a given fuel utilization can be determined. The required S/C at 500°C for a fuel utilization between 0 and 100% are also plotted below the ternary diagram in Fig. 2. Interestingly, the S/C ratio is shown to peak at a value of 2.325 at nearly 80% utilization where operation above this point will result in avoiding solid carbon deposition at all fuel utilizations at 500oC. As fuel utilization is increased from 0 to almost 80%, the required S/C increases from about 1.3 to 2.3. Further increases in operating fuel utilization lower the required S/C ratio as the red curve in the lower portion of the figure illustrates. This lowering of the required S/C ratio corresponds to the point of inflection in the 500°C isotherm plotted on the ternary diagram. As fuel utilization approaches 100%, hydrogen is nearly completely removed from the anode gas and the gas mixture approaches pure carbon dioxide as shown by the dashed red-lines in both upper and lower diagrams. However, the required S/C ratio to avoid solid carbon deposition will vary with temperature.
Figure 3 plots the required S/C ratio to avoid solid carbon deposition over the entire temperature and fuel utilization space. The desired operating regime of PCFCs is highlighted within the figure for the temperature range of 500 ± 25°C and utilizations of 80−85% which are desired to maintain the benefits of low temperature and high electric efficiency. Ratios of S/C greater than about 2.4 are necessary to avoid solid carbon deposition in the desired temperature range for any utilization. It is important that the device avoids solid carbon deposition over all utilizations since all compositions in between will be observed over the length of the fuel channel. Additionally, concentration polarizations could lead to apparent local utilizations above the cell utilization such that solid carbon deposition can occur unless solid carbon deposition is suppressed at all utilizations, including for those above the cell utilization.

Figure 3. Contour plot of steam-to-carbon ratio (S/C) (a) and oxygen-to-carbon ratio (O/C) with fixed steam-to-carbon ratio (S/C=1.8) (b) at the solid carbon deposition boundary in temperature and fuel-utilization space.
In addition to humidifying the methane fuel source, a small amount of oxygen can be added to move the inlet composition away from the solid carbon deposition boundary. The addition of oxygen can serve as a substitute for a portion of the steam required to avoid solid carbon deposition, however, a portion of the methane fuel source will be directly oxidized and not available for electrochemical conversion. The required oxygen-to-carbon (O/C) ratio needed to avoid solid carbon deposition in temperature fuel utilization space at a fixed S/C of 1.8 are plotted in Fig. 3. The required O/C to avoid solid carbon deposition at any PCFC fuel utilization in the temperature operating regime is 1.1. An O/C of 4.0 would result in complete oxidation of the methane fuel to carbon dioxide and water leaving none of the methane able to be converted to hydrogen and electrochemically oxidized. Thus, the required O/C ratio of 1.1 would result in greater than 25% of the methane fuel source being oxidized to suppress solid carbon formation, which would greatly reduce system electrical efficiency. It should be further noted that the results presented in Figs. 2–3 are for pure hydrogen proton conduction in PCFCs, and do not include the 1−3% of total cell current that may be expected to occur via oxygen anion conduction in the 500−600°C operating temperature range. As oxygen conduction will mitigate carbon deposition, the results discussed thus far represent an upper bound to the required S/C ratios determined from the parameter space explored herein.
Possibility of external reforming
The electrochemical performance of high temperature fuel cells is typically improved by higher hydrogen content in the fuel supply gas. When the system is operating on a humidified methane fuel source, this would be achieved through some portion of external steam methane reforming. However, the amount of external steam-methane reformation is fundamentally limited by reactor operating temperature. Tight thermal integration between fuel processing and fuel cell stack generally translates into closely matched operating temperatures between these unit operations. The global fuel reforming reactions, steam methane reforming (SMR) and water-gas shift (WGS) reactions, and rate expression are provided in Eqs. 29−31. The global reaction rate for methane reforming over a nickel catalyst is developed in Ref. 49, and is used over a detailed micro-kinetic model because the global reaction model gives sufficiently accurate results while still remaining computationally efficient. Furthermore, the global reforming model requires fewer cell parameters, such as active catalyst area, anode porosity, or anode pore size to give an accurate representation of PCFC system performance.
![Equation ([29])](https://content.cld.iop.org/journals/1945-7111/166/10/F687/revision1/d0029.gif)
![Equation ([30])](https://content.cld.iop.org/journals/1945-7111/166/10/F687/revision1/d0030.gif)
![Equation ([31])](https://content.cld.iop.org/journals/1945-7111/166/10/F687/revision1/d0031.gif)
In Eq. 31, k is the temperature dependent rate constant, pi are the partial pressures of the relevant species, and Keq is the global equilibrium constant for the SMR reaction. The WGS reaction is fast under normal PCFC operating conditions, so the rate is assumed to be infinite, and the reaction progress is then limited by equilibrium. The rate of hydrogen production from the WGS reaction is determined by the reaction equilibrium constant under local cell conditions.
Sensitivity studies on the reforming within the PCFC anode suggest that the conversion of methane is not a strong function of the rate parameter at normal operating conditions (i.e., high fuel utilization). Figure 4 below depicts the model-predicted methane concentration at the anode channel exit under two different fuel utilization conditions. The steam-to-carbon ratio was fixed at 2.4, leading to an inlet methane concentration of 29.1 mol%. The average cell temperature was varied so that temperature effects could also be analyzed. At low fuel utilization (5% FU), the steam reforming is kinetically limited as shown by the deviation of predicted methane concentration at the cell outlet (i.e., a form of conversion) versus the equilibrium amount. Doubling the reaction rate constant leads to an increase in internal reforming of methane, and a halving of the rate constant dramatically reduces it. Under these conditions, the hydrogen produced is substantially greater than that electrochemically consumed from the anode gas, thereby reducing the shifting equilibrium driving force along the cell to produce more hydrogen. Thus, the fuel channel is kinetically limited and therefore, sensitive to the kinetic rate parameters at low fuel utilization. However, at high utilization (80% FU)–a more likely operating point–the rate constant has little-to-no effect on the methane conversion in the anode fuel channel. Under high fuel utilization situations, a low hydrogen concentration occurs, which improves the equilibrium conversion, consequently enhancing methane reforming by maintaining a condition of shifting equilibrium along the channel. Under conditions of either doubled or halved reaction rate constants, the methane concentrations leaving the anode are very close to equilibrium across all potential PCFC operating temperatures. The authors conclude that the PCFC model is not highly sensitive to the rate of methane reforming at normal operating conditions due to the more dominant effect of shifting equilibrium in the channel rather than the value of reaction rate parameters.
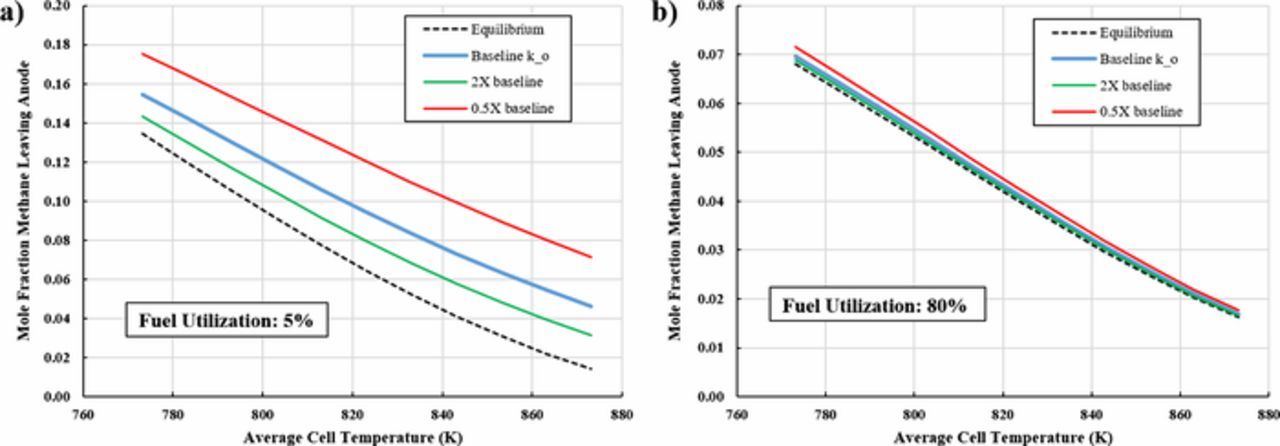
Figure 4. The mole fraction of methane leaving the anode channel as a function of average cell temperature and fuel reforming kinetic rate parameter, ko. Each study run at constant 0.15Acm− 2. 6.0 molar air ratio, and 2.4 inlet steam-to-carbon ratio.
The equilibrium distribution of species for a S/C of 2.4 are plotted in Fig. 5 as a function of operating reactor temperature where the PCFC and SOFC temperature ranges have been denoted. Methane conversion is shown to approach 100% in the SOFC temperature range, however, in the PCFC temperature range methane conversion is limited to 30−40%. This result suggests that external methane reforming to improve cell performance is limited by the operating temperature range and only partial external reforming is possible. Indeed, given the catalytic properties of nickel-based PCFC anodes, attempts to supply a fully reformed steam-methane mixture at temperatures significantly higher than that of PCFC operation could easily be undone once introduced to the cell via the opposite of steam reforming (i.e., methanation).
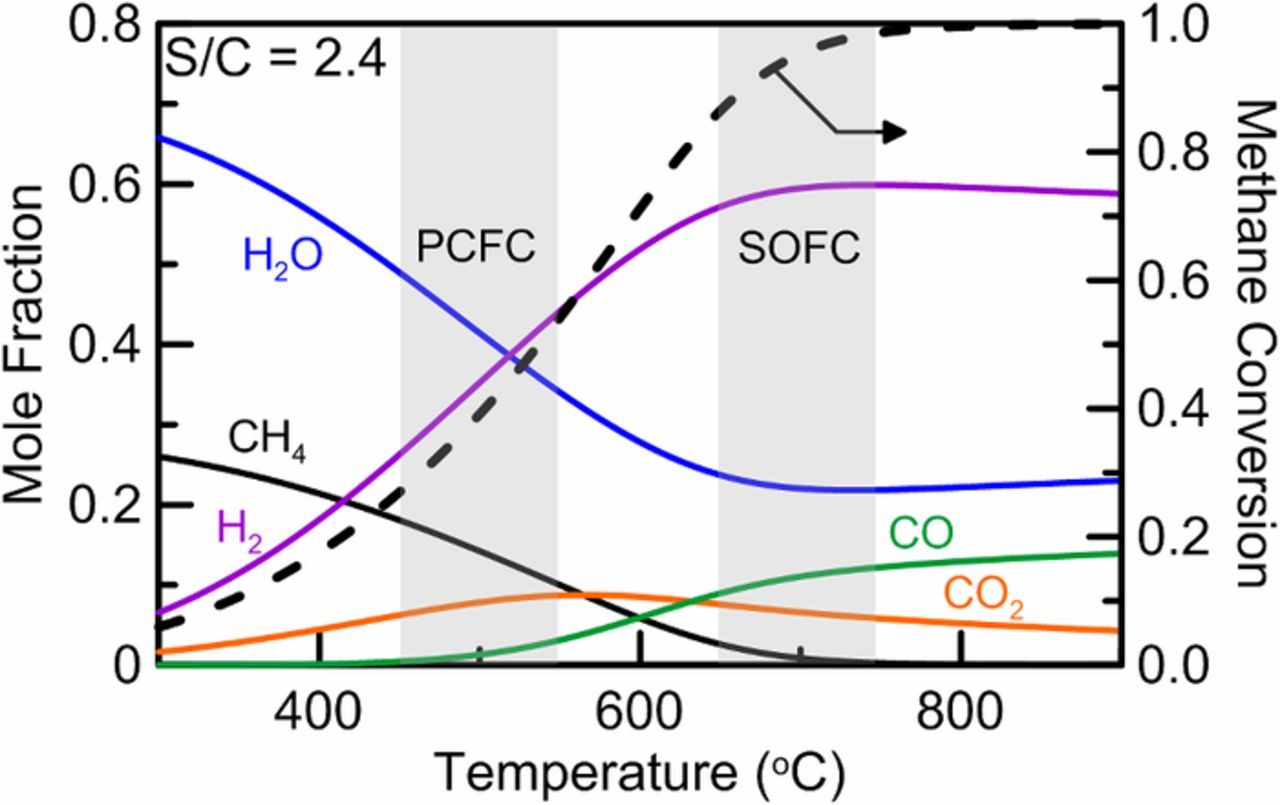
Figure 5. Equilibrium inlet fuel composition (0% fuel utilization) varying temperature for a steam-to-carbon ratio of 2.4 showing the possibility of external fuel reforming.
Button Cell Model Calibration
The calibration of the model is based on an anode-supported BZY20 button cell. The button cell consists of a porous BZY-Ni cermet anode, followed by a dense BZY20 electrolyte layer, and a porous cobalt and iron doped BZY cathode. An SEM image of a cross section of the cell is provided as Fig. 6, and information about the fabrication of BZY based cells is further discussed in Ref. 12.
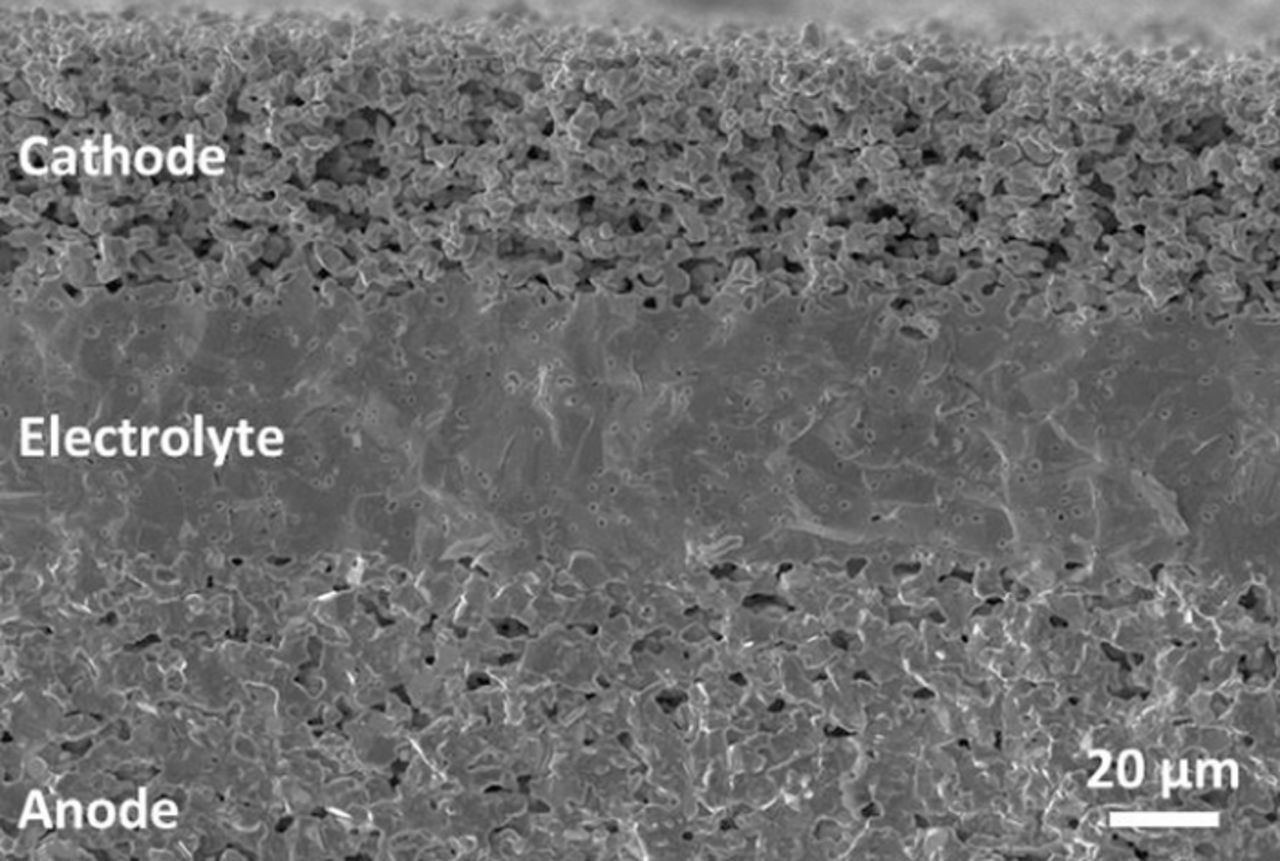
Figure 6. SEM image of the BZY20 button cell.
Model calibration
The calibration of the parameters needed for the semi-empirical electrochemistry model can be obtained from experimental button cell data. The model has been specifically formulated in such a way that the unknown modeling parameters can be easily extracted from button cell experimental data. Polarization curves as well as electrochemical impedance spectroscopy (EIS) measurements can be used to fit the ionic transference number and ASR parameters. The button cell preparation and experimental procedure are documented elsewhere12 and only the parameters resulting from the calibration of the data set are given here.
The ionic transference number (tion) can be determined by the ratio of the experimental OCV to the theoretical Nernst potential. Plotting the button cell data as a function of temperature is shown in Figure 7 below. In order to impose the physical limitations of the transference number being between zero and one, the data points were fit to a sigmoid function (Eq. 32). The resulting parameters (β, To) are listed in Table I.
![Equation ([32])](https://content.cld.iop.org/journals/1945-7111/166/10/F687/revision1/d0032.gif)

Figure 7. Calibration of the ionic transference number (tion) based on experimental measurements of OCV and theoretical calculations of Nernst potential.
Table I. Semi-empirical electrochemical submodel parameters calibrated from experimental data.
| Parameter | Value | Units |
|---|---|---|
| β | −1648.5 | K |
| T○ | 75.17 | K |
| Apol | 8.485E-6 | Ω cm2 |
| npol | 0.030 | - |
| mpol | 0.110 | - |
| Ea, pol | 69.16 | kJ mol− 1 |
| Aohm | 8.656E-3 | Ω cm2 |
| Ea, ohm | 27.77 | kJ mol− 1 |
EIS measurements were performed under OCV conditions and allowed for the separate measurement of polarization and ohmic resistances which have been reported for various anode and cathode gas compositions in Fig. 8. Plotting the resistance terms in Arrhenius form allows for the calculation of the activation energies and pre-exponentials from linear fits. The known gas composition variations in the anode and cathode compartments of the button cell have been varied such that the partial pressure dependence can be established. The button cell experiments showed that ohmic resistance in the cell is not dependent on gas partial pressures, but the polarization resistance is dependent the hydrogen partial pressure in the anode and the water partial pressure in the cathode. The resistances are shown to be dependent on key gas phase compositions in the anode and cathode as well as temperature, which have been built into the semi-empirical electrochemical model as given in Eqs. 23−25. All of the parameters obtained from the button cell testing for the semi-empirical electrochemical submodel are reported in Table I below.
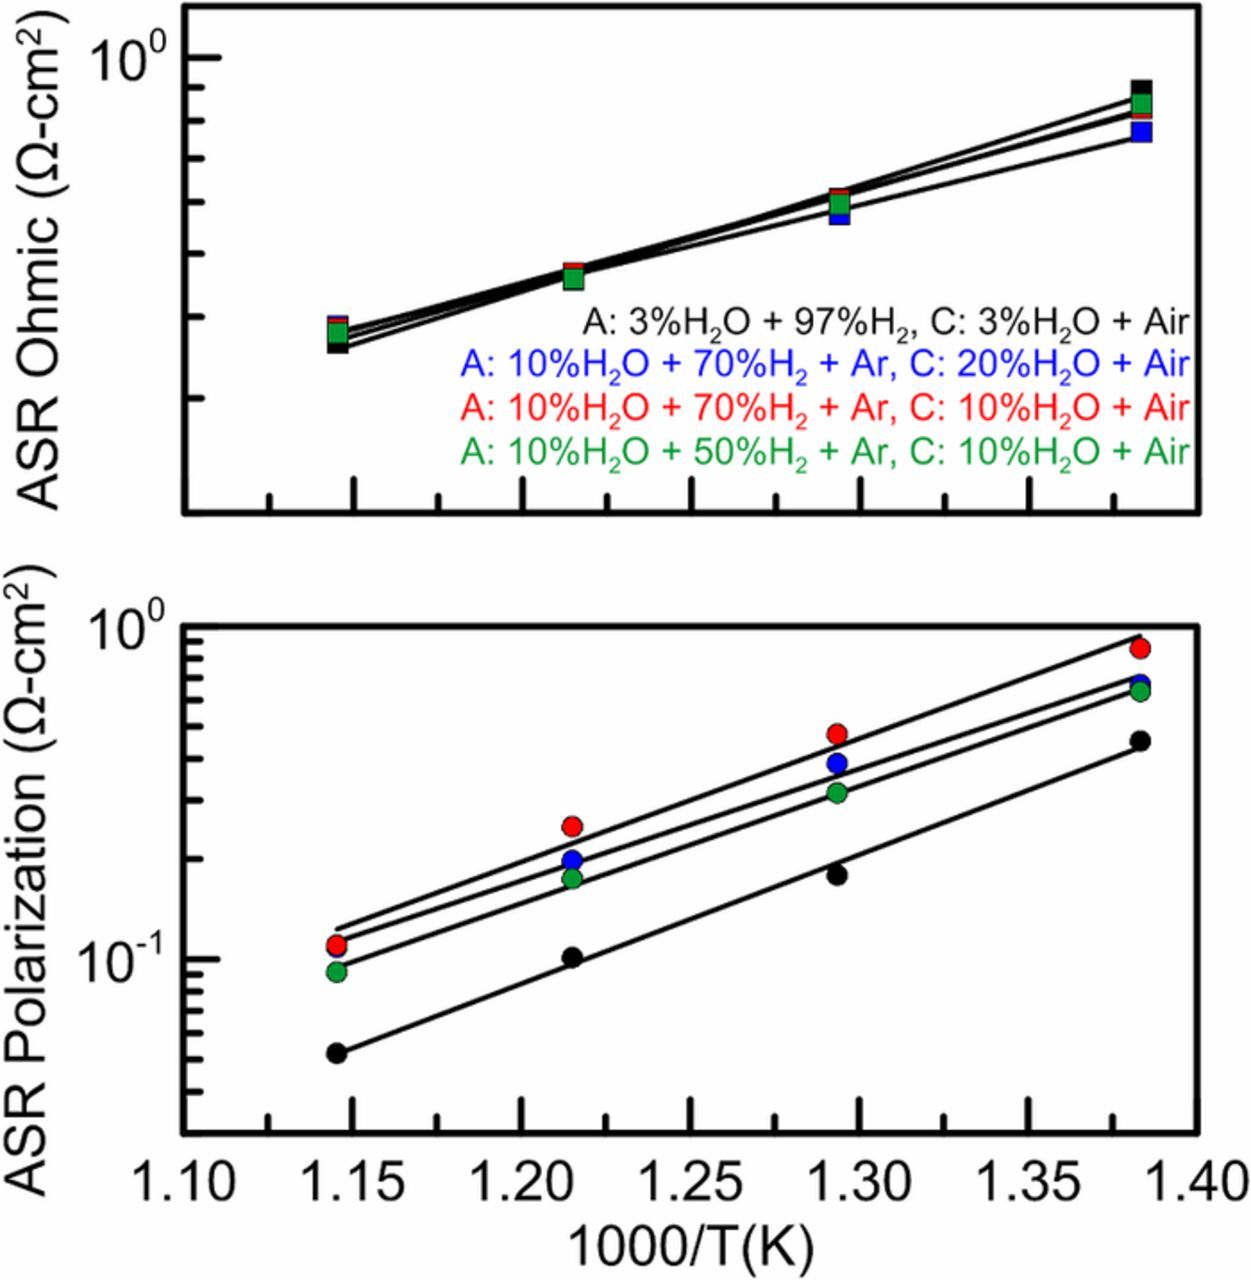
Figure 8. Arrhenius plot of the polarization and ohmic area specific resistance measured through electrochemical impedance spectroscopy under open circuit voltage conditions with variations in fuel composition.
Button cell model results
Button cell experiments are performed under a wide variety of test conditions in order to properly calibrate the modeling parameters, and then a button cell model is compared to button cell data that is collected under conditions mimicking potential operating conditions for validation. In this case, a button cell was tested at three temperatures, a steam-to-carbon ratio of 2.5, and current densities ranging from 0.0 to 0.6 Acm− 2. The tests were performed in a temperature controlled furnace under flooded fuel and air conditions, so fuel depletion and temperature variation effects were neglected in the model. The results of the button cell test and model prediction are displayed in Fig. 9. The model error is calculated as the relative error between the experimental voltage and the model predicted voltage at each current density, and is then plotted below the polarization curve. The model prediction maintained an error of less than 5% at low current densities, and trended toward higher error at higher current densities at all temperatures tested; with the error at 600°C being the highest. Studies have shown that PCFC system optimal operating conditions usually fall in the 0.75–0.85 V range because this area reduces balance-of-plant size and cost as well as increases efficiency.54 The model had low error in this voltage/current range, thus indicating that the model is sufficiently calibrated and ready to be scaled up to simulate larger systems than just a button cell.
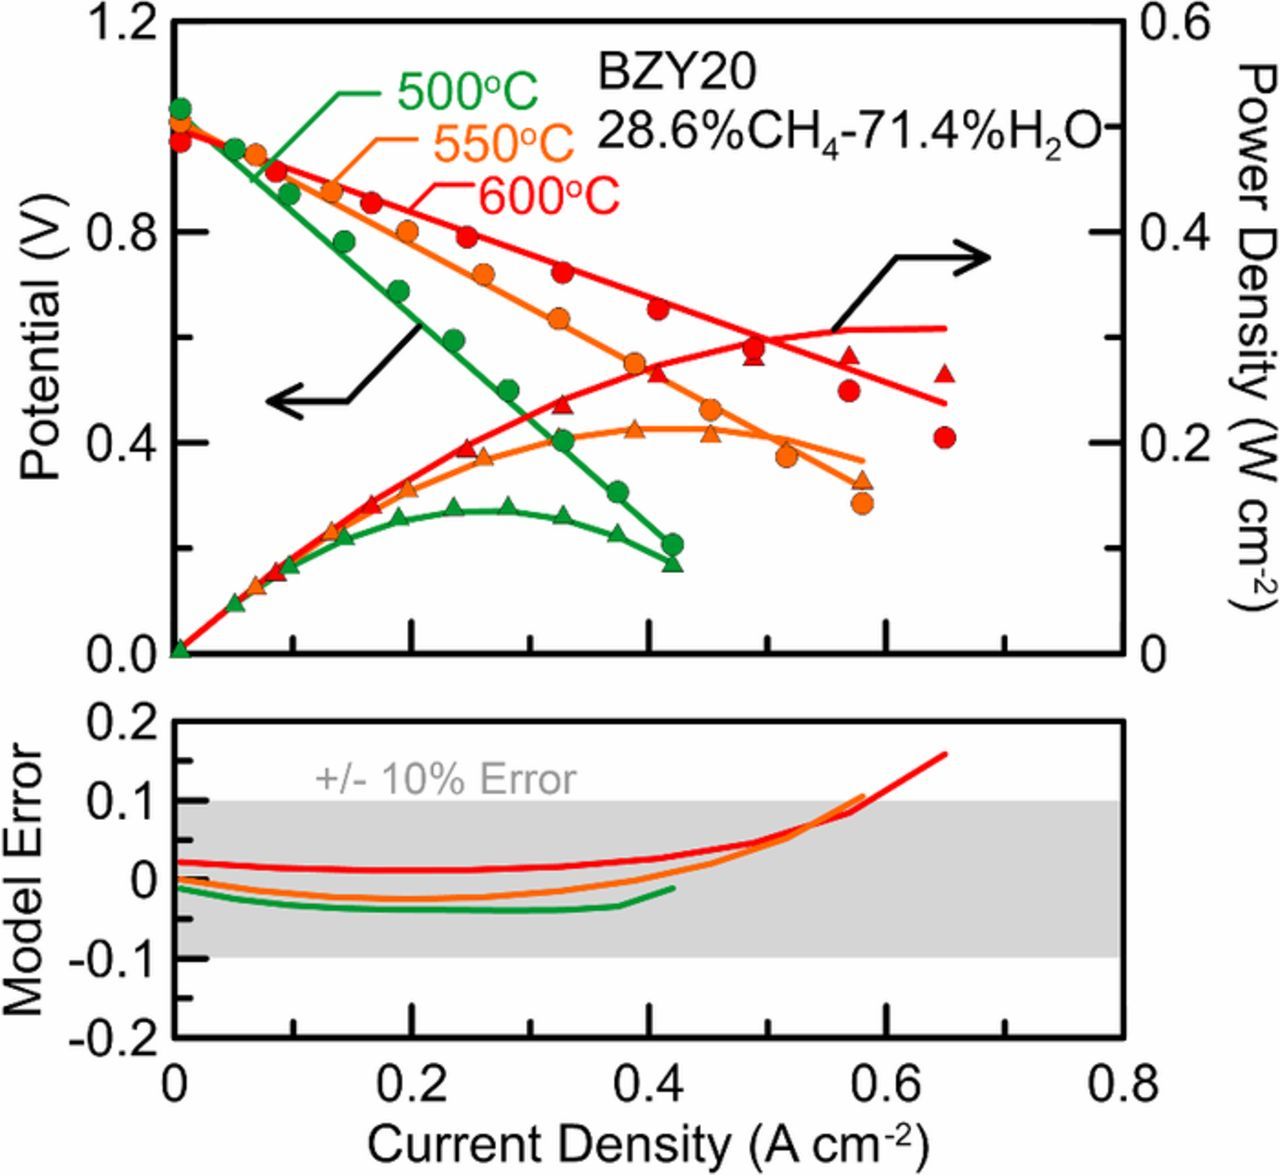
Figure 9. Button cell voltage and power density at three different temperatures. The fuel was fed in excess and at a 2.5 S/C ratio. Button cell experimental data plotted as points, model predictions plotted as lines.
Channel-Level Modeling Results
The button cell experimental results provide a performance map, however, the sub-scale performance is based on highly idealized operation where the effects of fuel utilization, air depletion, and temperature gradients are not present. To predict performance of commercial-scale cell-level operation, the electrochemical submodel is calibrated against button cell data and coupled with the cell conservation equations (Eqs. 5–16). In order to solve the model, a cell geometry must be imposed which is given in Table II. An anode-supported cell with a nominal 10x10 cm platform is chosen where standard material properties and electrode parameters are implemented.
Table II. Channel-level modeling parameters.
| Parameter | Value | Units |
|---|---|---|
| Lcell | 10 | cm |
| Wcell | 10 | cm |
| Han | 1 | mm |
| Hca | 1 | mm |
| tan | 0.5 | mm |
| tca | 40 | mm |
| tel | 20 | mm |
| tint | 0.5 | mm |
| cp, pen | 500 | J kg− 1 K− 1 |
| cp, int | 500 | J kg− 1 K− 1 |
| ρpen | 5900 | kg m− 3 |
| ρint | 8000 | kg m− 3 |
| ϕan | 0.4 | - |
| ϕca | 0.4 | - |
| τan | 3.0 | - |
| τca | 3.0 | - |
Steady-state cell operation
Simulation results for the 10 cm channel are displayed below. The PEN consists of a 0.5 mm Ni-BZY20 anode, 20 µm BZY20 electrolyte, and 40 µm doped BZY cathode. Species, temperature, current density, and velocity profiles are given for simulation results and are reported for co- and counter-flow reactant gas configurations. The simulations are performed at nominal 500°C, 80% fuel utilization, and an air ratio of 6.0. The average cell temperature of 500°C is maintained by varying the gas inlet temperatures, which will be different in co- and counter-flow configurations. The fuel composition is taken to be steam and methane at a S/C ratio of 2.4 with a small amount of hydrogen  and the air composition is taken to be nitrogen and oxygen in the ratio of ambient air with the a small amount of water vapor
  which enhances the numerical stability of the electrochemical submodel.
The co-flow configuration modeling results displaying anode and cathode channel composition, temperature, and current density distributions are given in Fig. 10. The anode gas composition distribution over the length of the cell provides insight into the coupled processes of internal reforming and electrochemical oxidation of the hydrogen. The inlet compositions are shown to consist of humidified methane followed by equilibrium-limited reforming over the inlet region of the cell. The lower PCFC operating temperature of 500°C tends to promote the water-gas shift reaction but limits methane reforming. The gradual conversion of methane over the length of the cell is different than that typically experienced in higher temperature SOFC operation where equilibrium conversion to carbon monoxide and hydrogen is rapid and nearly complete in the first 30% of fuel gas transit in the streamwise direction over the cell. As previously noted, appreciable methane conversion in PCFCs is accomplished by a shifting equilibrium process whereby the hydrogen product is electrochemically oxidized, promoting the forward direction of the steam reforming reaction (Eqs. 29 and 30).

Figure 10. Spatially dependent variable profiles for co-flow (a) and counter-flow (b) configuration resulting from PCFC channel-level model simulation at 0.15 A cm− 2, Tcell=500°C, FU=80%, AR=6.0, and S/C=2.4.
Additionally, the increasing cell temperature over the length promotes additional methane reforming such that the highest hydrogen mole fractions are observed near the outlet. At 80% utilization, the exit methane and hydrogen concentrations are less than about 4% and 17%, respectively. Due to the equilibrium limitations of the internal reforming reactions at the low temperature inlet region of the cell, the hydrogen mole fraction in the anode channel never achieves a value above 30%. The effect of low hydrogen partial pressures on cell performance is two-fold: it increases ASR and decreases OCV–both of which contribute to the operating voltage and power density of the cell at a given current. The co-flow cell temperature distribution is shown to increase approximately linearly with streamwise position; a characteristic which arises from the competing effects of the exothermic processes of electrochemical oxidation and irreversible heat generation from i2R losses (i.e., Joule heating), and endothermic reforming reactions. The equilibrium constrained reforming reactions have a beneficial effect on the cell by reducing the temperature gradients in the PEN structure (∼1°C/mm) to values lower than that estimated for internally reforming SOFC devices (e.g., typically 1.5 to 2.5°C/mm). A full-scale PCFC in a co-flow configuration is estimated to obtain a single-cell nominal operating voltage of 0.846 V for the operating conditions of Fig. 10.
A PCFC in counter-flow configuration has a slight performance advantage over the co-flow operation as displayed in Fig. 10, obtaining an operating voltage of 0.849 V for the same operating conditions. Additionally, the counter-flow configuration has a significantly lower inlet gas temperatures at 706 K compared to 739 K for co-flow operation. This result is due to the recuperative effect of counter-flow cell operation which can maintain a nominal cell operating temperature of 500°C with lower gas inlet temperatures. The recuperative nature of the counter-flow cell operation also leads to a more uniform cell operating temperature and a lower peak temperature located near the cell inlet. The presence of the high temperature inlet region leads to increased internal reforming at the inlet and higher peak hydrogen concentration. The higher localized hydrogen mole fractions result in large variations in current density generating higher average local Nernst potentials and a decrease in cell ASR. At 80% utilization, the exit methane and hydrogen concentrations approach 7% and 11%, respectively. Although the counter-flow cell is shown to have better performance, the peak current density is 2.6% higher than the co-flow cell which could negatively impact cell degradation.
The 1-D channel model is also used to evaluate the local rate of the reforming reactions for a counter-flow configuration. As summarized in Fig. 11, methane reforming is quickly initiated at the channel inlet with a reaction rate nearly 4X that of the mildly exothermic WGS reaction. The rate of methane reforming rapidly reduces as the fuel gas proceeds along the channel. A similar trend occurs for the WGS reaction where there is a slight delay while carbon monoxide is produced in the steam-methane reforming reaction; but then after a rapid increase, the reaction rate decreases in the gas flow direction. After about 2.5 cm, the reaction rates for the SMR and WGS reactions are approximately equal and the fuel gas quickly approaches a condition of chemical equilibrium. This simulation was conducted at high fuel utilization, and the shifting equilibrium greatly contributes to favoring the fuel reforming reactions. The rate of electrochemical oxidation of hydrogen is also plotted and registers a nearly constant value with position at a rate about 3.5 to 4 times that of the reforming rates.

Figure 11. The fuel reforming reaction rate for both the SMR and WGS reactions as a function of anode channel position. The electrochemical oxidation flux of hydrogen is also included, this is another representation of current density as a function of channel position. The conditions for this simulation are identical to those that produced Fig. 10b.
Fig. 12a illustrates the magnitude of the rate of various heat source and sink terms in the PEN assembly energy balance as a function of position in the channel. All of the energy flows within the PEN assembly are shown in the control volume diagram of Fig. 12b. Positive values are associated with energy addition to the cell assembly and negative terms with energy rejected to either the bulk gas flows or leaving by conduction or power production. At the channel inlet, the endothermic reforming reactions and power production account for over 80% of the energy leaving the MEA, with electrochemical oxidation and some convective heat addition by the cathode gas balancing the energy flows. From Figs. 11 and 12, it is evident that as the rate of the reforming reactions decreases along the length of the channel, the local endotherm from the heterogeneous reactions decreases. Axial conduction is also significant at the channel inlet because larger temperature gradients in the PEN assembly are established from exposure to the cooler reactant gas flows. Other locations have minimal energy transfer via conduction because there is a minimal cell temperature gradient in the counter-flow configuration. This analysis illustrates several important aspects of PCFC operation, yet the choice of flow configuration in stack design will still be influenced by the overall system configuration and application (e.g., gas recycle and load-following). Nevertheless, the methodology developed here is capable of being implemented alongside balance-of-plant (BOP) components to simulate system-level performance.
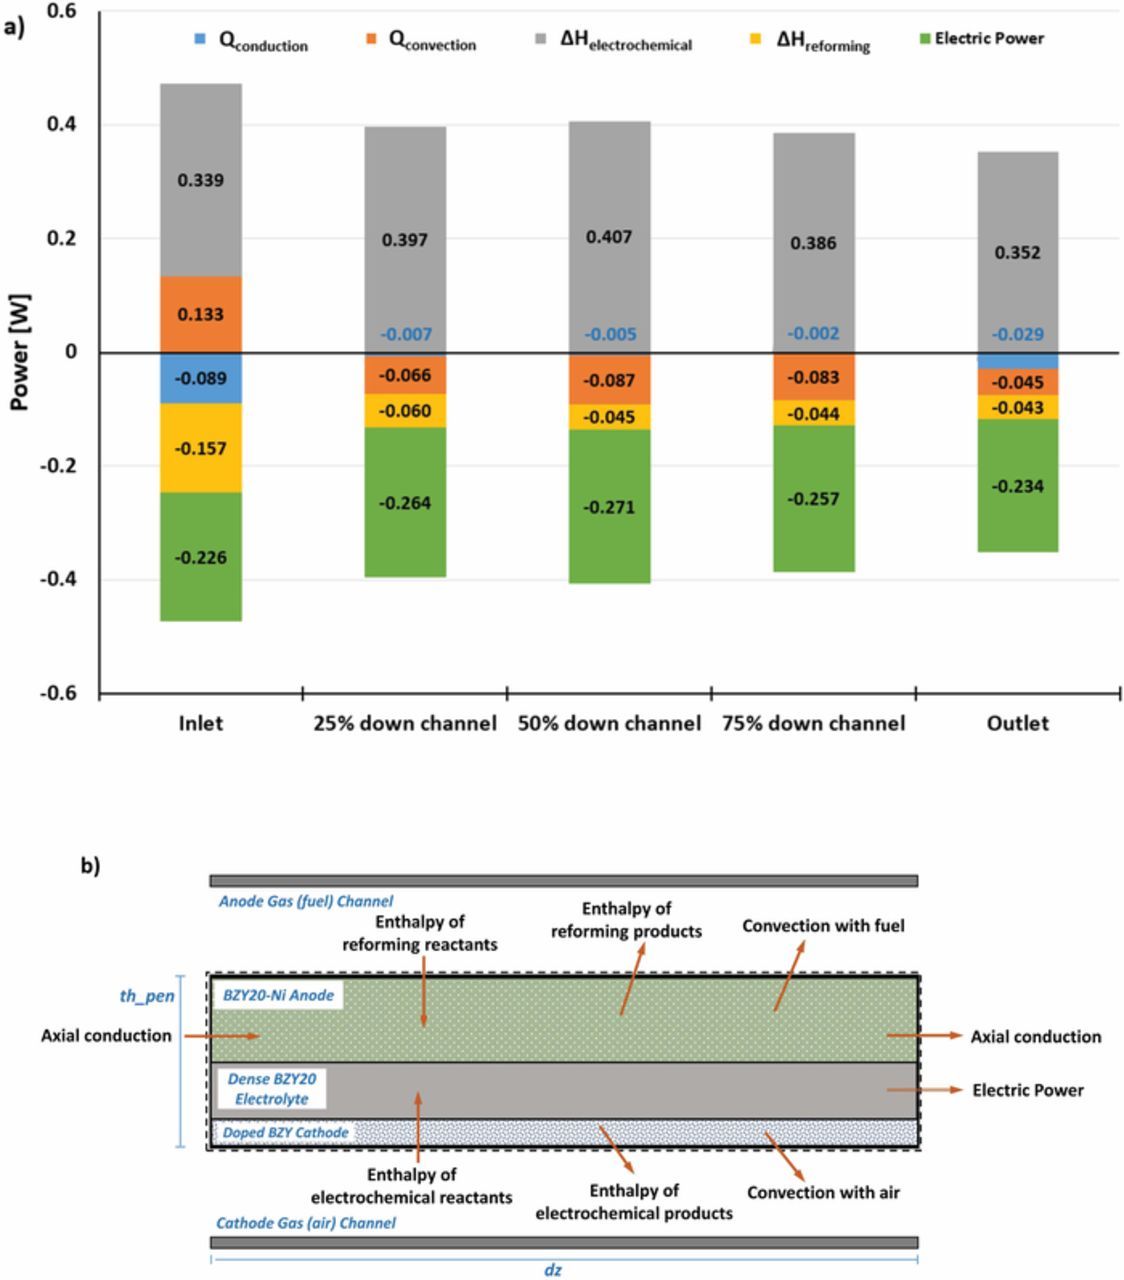
Figure 12. (a) The heat balance for the PEN assembly at select points along the length of the cell. (b) A schematic of the sources of heat that enter and leave the PEN assembly. The conditions for this simulation are identical to those that produced Fig. 10b.
Dynamic cell response
The dynamic response of the PCFC is of great importance when discussing its role in a distributed power generation application since high economic value is placed on dispatchable devices capable of large turndown and rapid load-following dynamics. The cell-only dynamic response for steps in current density under constant fuel utilization and air ratio control55 is plotted in Fig. 13. The PCFC electrochemical response is observed to occur over a time scale of seconds, however, it is followed by a longer thermal transient due to the evolving temperature distribution in the cell. Overall, the transient response of the device is observed to be very rapid where low power density operation causes thermal transients of the device to occur over a much longer time scale. However, the temperature variations are shown to be slight (<7°C) for large load steps due to the low power density where the stack size will be approximately twice the size of a typical SOFC producing the same power. Additionally, the high heat capacity of the cell relative to the gas flow rates reduces the possibility of thermal shock due to the reduction of rapid temperature fluctuations and high temperature gradients. However, the dynamic response of a distributed generation device requires system-level simulation where the coupled interactions of the cell and BOP must be resolved. The model developed here is capable of being incorporated in such a system-level analysis, however, it is outside the scope of the present work.
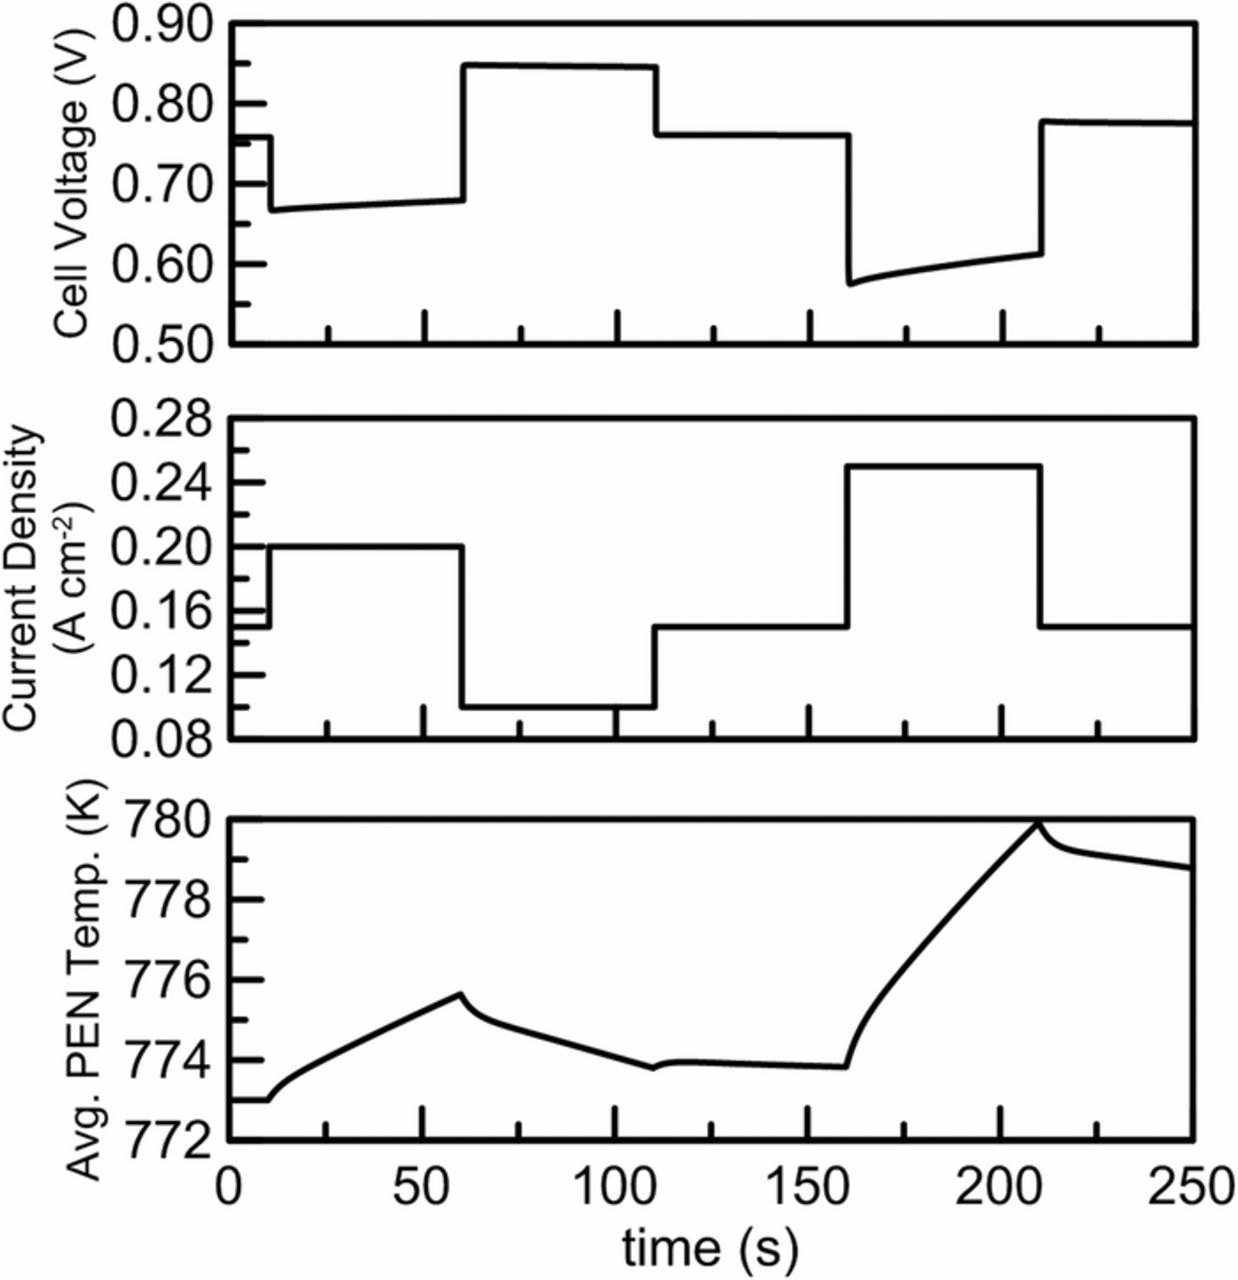
Figure 13. Figure indicating the transient response of step changes in average current density and response in voltage and average cell temperature for counter-flow configuration and nominal operating conditions.
Conclusions
A modeling approach for steady-state and dynamic simulation of an internally reforming protonic ceramic fuel cell with mixed ion conduction was presented. The model is capable of calibration against button cell experimental results. A new formulation for a semi-empirical electrochemical model is given such that fundamental and time-consuming experiments for the establishment of transport properties of mixed conductors are not necessary. The electrochemistry is coupled to dynamic, spatially resolved conservation equations over the cell length enabling transient and steady state simulation.
Steady-state simulations comparing reactant gas flow configurations were presented that indicate counter-flow demonstrates slightly superior electrochemical performance. However, the more uniform current density distribution of the co-flow configuration may be desirable from a degradation perspective. Both cells obtain performance of approximately 0.75 V at current densities of 0.15 A cm−2, which gives a power density of 0.113 W cm−2. The resulting low power density compared to SOFCs leads to interesting dynamics during load-following operation. The electrochemical response due to variations in the gas channel composition was shown to be rapid (∼100 s), however, the large relative heat capacity of the cell at low power density results in long thermal transients (∼102 s). Although the thermal transient is not beneficial from the perspective of startup and shutdown, it could be beneficial for avoiding rapid thermal transients which could damage the cell. Further investigations involving system-level models considering BOP devices are necessary to properly assess dispatchability. Nevertheless, the increased need for dispatchable power to enable grid flexibility in an environment of increasing renewables penetration places a premium on energy conversion devices capable of turndown and load-following. High efficiency PCFC technology could eventually accelerate the implementation of fuel cells as dispatchable, distributed power generation devices given their lower operating temperature and hence, more rapid startup, shutdown and load-following capabilities.
List of Symbols
| AR | Air ratio |
| ASR | Area specific resistance |
| cp | Specific heat capacity |
| D | Diffusion coefficient |
| Ea | Activation energy |
| EN | Nernst potential |
| FU | Fuel utilization |
| h | Component height |
| h | Enthalpy |
| j | Current density |
| j | Mass flux |
| J | Mole flux |
| k | Thermal conductivity |
| M | Molar mass |
| p | Pressure |
 |
Heat flux |
 |
Molar production rate |
| r | Chemical reaction rate |
| R | Ideal gas constant |
 |
Mass source |
| t | Component thickness |
| T | Temperature |
| tion | Ionic transference number |
| v | Velocity |
| V | Voltage |
| [X] | Molar concentration |
| y | Mass fraction |
Greek
| λ | Convection coefficient |
| μ | Viscosity |
| ν | Stoichiometric coefficient |
| ρ | Density |
| τw | Wall shear stress |
| τ | Tortuosity |
| ϕ | Porosity |
Subscripts
| a | Air |
| an | Anode |
| ca | Cathode |
| e | electron |
| f | Fuel |
| i | Species index |
| int | Interconnect |
| k | Reaction index, species |
| Kn | Knudsen |
| l | species |
| OC | Open circuit |
| pen | PEN structure |
| T | Total |
Superscripts
| e | Effective |
Acknowledgments
This research was preformed under a grant from the Department of Energy ARPA-e REBELS program under award #DE-AR0000493. The authors would also like to thank Drs. Chris Wendel and Jianhua Tong for helpful discussions on equilibrium calculations involving solid carbon formation and PCFC materials.
ORCID
R. J. Braun 0000-0001-5319-3350