Abstract
Impedance measurements of lithium-ion batteries are a powerful tool to investigate the electrolyte/electrode interface. To separate the contributions of anode and cathode to the full-cell impedance, a reference electrode is required. However, if the reference electrode is placed inappropriately, the impedance response can easily be biased and lead to erroneous conclusions. In this study, we present a novel micro-reference electrode for Swagelok-type T-cells which is suitable for long-term impedance and reference potential measurements. The reference electrode consists of a thin insulated gold wire, which is placed centrally between cathode and anode and is in-situ electrochemically alloyed with lithium. The resulting lithium-gold alloy reference electrode shows remarkable stability (>500 h) even during cycling or at elevated temperatures (40°C). The accuracy of impedance measurements with this novel reference electrode is carefully validated. Further, we investigate the effect of different vinylene carbonate (VC) contents in the electrolyte on the charge transfer resistance of LFP/graphite full cells and demonstrate that the ratio of VC to active material, rather than the VC concentration, determines the impedance of the anode SEI.
Export citation and abstract BibTeX RIS

This is an open access article distributed under the terms of the Creative Commons Attribution 4.0 License (CC BY, http://creativecommons.org/licenses/by/4.0/), which permits unrestricted reuse of the work in any medium, provided the original work is properly cited.
The lifetime of lithium-ion batteries strongly depends on the properties of the interfaces between each electrode and the electrolyte. Electrochemical impedance spectroscopy (EIS) is a simple and non-destructive method to investigate the kinetics of active materials, the resistance of electrode/electrolyte interfaces, and the effect of electrolyte additives.1,2 As impedance measurements of full-cells always reflect the sum of both electrodes, it is difficult to deconvolute the individual contributions by the cathode and the anode. To gain insight into the impedance of individual electrodes, measurements on symmetric cells have been proposed, where two cathodes or two anodes from nominally identical cells are reassembled to symmetric cells.3,4 While this method leads to reliable results, it requires the disassembly and destruction of the original cells. Hence, for the impedance investigation of cells at different state-of-charge (SOC) values or at different points in their cycle life, a large number of nominally identical cells operated or aged at identical conditions is required.
An alternative approach is the use of a reference electrode, where the AC potential perturbation is measured between working and reference electrode, while the current is applied between working and counter electrode. A number of cell designs for impedance measurements with a reference electrode have been suggested, with the reference electrode either placed between anode and cathode,5–9 or placed in-plane with anode or cathode through a central hole (also referred to as co-axial arrangement).10–12 The more commonly used design, however, is a Swagelok T-cell design with the reference electrode (typically consisting of a lithium metal disc) being placed perpendicularly to the anode and cathode, outside the active area.13 Yet, experiments and numerical simulations by Ender et al.14 showed that the impedance measurements with the latter reference electrode placement can display significant distortions caused by small in-plane offsets between anode and cathode (referred to as geometrical asymmetry) and/or by large differences in the impedance response of anode and cathode (referred to as electrical asymmetry), consistent with earlier work by Dees et al.15 This is also the case for coaxially located reference electrodes, for which the measured anode or cathode impedance is shown to be highly sensitive toward misplacements of the electrodes.10,12,16 The impedance artefacts in both of these designs stem from the location of the reference electrode being at the edge of the working and the counter electrodes, where the current density is not homogeneous. If one electrode is now shifted slightly toward the reference electrode, the potential field around the reference electrode is dominated by this electrode, which leads to a biased impedance response. In contrast, if the reference electrode is placed centrally between the electrodes far away from their edges, small relative shifts of the electrodes do not affect the impedance response.15 This geometry is typically realized by using a thin wire with an electronic insulator around its perimeter, being exposed only at its end, which is placed well inside the active area.6–8 Yet, this location of the reference electrode can block parts of the working electrodes and thus alter the potential field between them. In order to minimize this effect, the reference electrode needs to be small compared to the size of the electrodes and the distance between them. Dees et al.15 showed that a 25 μm thick reference electrode, between two electrodes separated by 100 μm, delivered sufficiently accurate potential and impedance measurements.
Unfortunately, the design of a micro-reference electrode, i.e., an insulated wire with small diameter (25–50 μm) imposes difficult requirements on the choice of material. Lithium metal, which is typically used as reference electrode in lithium ion cells, is difficult to accurately produce and handle in micron-sized dimensions. On the other hand, the potential of the reference electrode should be well-defined and stable in a lithium-ion electrolyte, as the reference electrode should (ideally) also be able to record the absolute potential of both electrodes during cycling. Additionally, potential drifts during impedance measurements can lead to a biased impedance response.17 Zhou et al.7 successfully plated lithium in-situ onto a thin, insulated copper wire as reference electrode. As the wire insulation was only removed at the very tip of the wire, the reference electrode active area was small and located far away from the electrode edges. However, they also showed that the potential stability of the reference electrode depends strongly on the plating parameters, as thin films of high surface area lithium can be completely dissolved or disconnected due to continuous SEI growth.
A similar approach has been followed by Abraham et al.6 using an insulated tin-coated copper wire. Yet, instead of plating metallic lithium on a non-alloying copper wire like Zhou et al.,7 lithium was in-situ electrochemically alloyed with the tin coating at the wire tip, where the insulation had been removed. While the long-term potential stability of this reference electrode is also limited, it can nevertheless be used for impedance measurements of individual electrodes during long-term cycling studies by short re-lithiation prior to the measurement.8,18 The use of lithium alloys as reference electrode brings – in theory – a number of advantages: i) lithium forms alloys with a large number of metals, which are readily available as thin wires and at high purity;19,20 and ii) the volume expansion and thus the specific surface area of lithium alloys is smaller compared to in-situ plated lithium, which means that the alloy should be less prone to self-delithiation surface reactions. Yet, only few lithium alloys have been employed as reference electrodes apart from Li-Sn:6,8,18 a lithiated aluminum wire has been used as reference electrode by Verbrugge et al.;9 and Gómez-Cámer and Novák21 recently demonstrated the use of a lithium-bismuth alloy as reference electrode in their specifically designed impedance cell with a coaxial reference electrode.
So far, the viability of lithium-gold alloys as reference electrodes has not yet been examined. Studies on the electrochemical lithiation of gold are limited, as its poor capacity retention, high cost and low specific capacity compared to other alloys disqualify gold as a potential anode material. The Li3Au phase is the most lithium-rich composition which can be obtained electrochemically, corresponding to a specific capacity of 408 mAh/gAu.19,22–26 The lithiation of gold proceeds in two main potential plateaus, with the first stage having an OCV potential of ∼0.3 V vs. Li/Li+, and the second ∼0.2 V vs. Li/Li+.25 Surprisingly, the intermediate phases detected between α-Au and Li3Au during electrochemical alloying could not be assigned to any of the known thermodynamic Li-Au phases.27–30 Bach et al.30 recently identified the metastable Li3Au2, Li5Au3, Li3Au5 and LiAu2 phases by in-situ high energy X-ray diffraction during the electrochemical lithiation and delithiation of gold thin film electrodes.
Despite its drawbacks as an anode, several properties of the lithium-gold alloy make it an interesting reference electrode material: i) the potentials of both stages are very flat, and already low degrees of lithiation will result in an OCV of around 0.31 V vs. Li/Li+; ii) it is difficult to completely delithiate a lithium-gold alloy by electrochemical or chemical means;24,26 iii) gold is chemically resistant against HF and does not form any substantial surface oxide films;31 and, iv) the high electrical conductivity of gold means that the potential drop along the length of the reference electrode wire is negligible.
In this study, we developed a novel micro-reference electrode based on a 50 μm thick, insulated gold wire, which we integrated into a conventional T-cell design. This gold wire reference electrode (GWRE) is placed centrally between both electrodes and two 200 μm thick glass fiber separators. Analogous to the approach used by Abraham et al.6 for a tin-based reference electrode, we achieve a stable potential of the gold wire by in-cell electrochemical alloying with lithium. We show that the potential of the lithiated GWRE is stable for several weeks, even under elevated temperatures (40°C). With this lithiated GWRE, we are able to record the potential of both electrodes in LFP/graphite full-cells for more than 200 cycles. Further, we evaluate the capabilities of the lithiated GWRE to accurately measure the impedance of individual electrodes in full-cells, which we verify by symmetric cell measurements. As a proof of concept, we conduct a similar study as Burns et al.32 on the impedance growth of anode and cathode in the presence of different concentrations of vinylene carbonate (VC) in LFP/graphite full-cells, using however our lithiated GWRE instead of a symmetric cell approach. We can reproduce the findings by Burns et al.32 and further demonstrate that the total amount of VC per active material, rather than its concentration, is the key parameter for the electrolyte/anode interface resistance. This result is important when electrolyte additives are tested in laboratory cells, as these cells typically have a higher electrolyte to active material ratio than commercial lithium-ion cells.
Experimental
Electrode preparation
Lithium iron phosphate (LiFePO4, LFP) electrodes were prepared by mixing LFP (BASF SE, Germany), carbon black (Super C65, Timcal), and polyvinylene diflouride (PVDF, Kynar) in a mass ratio of 93:3:4 with NMP (N-methyl pyrrolidone, anhydrous, Sigma-Aldrich, Germany) in a planetary mixer (Thinky Corp.) for 15 min. The resulting ink was coated on carbon-coated aluminum foil (MTI) with a doctor blade mounted on an automatic coater and dried at 50°C in a convection oven for at least 3 h. The final LFP coating had a loading of 11.7 mgLFP/cm2 (≡ 2.0 mAh/cm² based on 170 mAh/gLFP). Electrodes with a diameter of 11 mm were punched out and pressed to 35% porosity (2 × 60 s at 260 MPa) with a KBr press (Mauthe, PE-011). Graphite electrodes were prepared by mixing graphite (T311, SGL Carbon GmbH) and PVDF in a mass ratio of 95:5 with NMP, following the same procedure. The graphite ink was doctor-blade coated on copper foil (MTI) and dried in a convection oven at 50°C for at least 3 h. The final loading of the graphite coating was 5.9 mggraphite/cm2 (≡ 2.2 mAh/cm² based on 372 mAh/ggraphite) at a porosity of 40%. Both types of electrodes were dried under dynamic vacuum at 120°C overnight and transferred to an Argon-filled glove box (MBraun, Germany) without exposure to air.
Cell design and assembly
The reference electrode current collector of a 3-electrode Swagelok T-cell (see Figure 1a) was modified to be able to host the GWRE. To this purpose, a small hole (1 mm diameter, 2.5 mm depth) was drilled into the flat front side of the reference current collector. To fix the GWRE wire, a thread was cut into the side of the reference current collector at approximately 2 mm distance from the front edge. For the actual reference electrode, a gold wire with a core diameter of 50 μm, coated with a 7 μm thick polyimide insulation (Goodfellow Cambridge Ltd., United Kingdom), was cut into pieces of ∼1.5 cm. The last 3 mm of one end of the wire was slightly scratched with a scalpel to allow good electrical contact of the wire to the reference electrode current collector. The scratched end of the wire was then inserted into the hole of the reference current collector and fixed with a small set screw. During cell assembly, the GWRE was inserted through a hole in the polymer lining of the T-cell (green lines in Fig. 1) and cushioned between two glassfiber separators (see Figure 1b); note that the insulation at the wire perimeter was not removed and that the only segment of the wire accessible to the electrolyte is the cut cross-section at the tip of the wire (see Figure 1c). The SEM image of the wire tip in Figure 1c shows that the polyimide insulation is almost completely intact around the edge of the cut cross-section, and that the exposed gold surface is relatively smooth. As the sealing and all other cell components are left unchanged compared to the conventional T-cell design, we could omit any benchmarking and air permeation tests that are normally required when developing a new electrochemical cell for the lithium ion chemistry. T-cells with GWRE were assembled with graphite as anode, LFP as cathode, and 2 glassfiber sheets (Whatman) as separator soaked with 60 μL electrolyte.
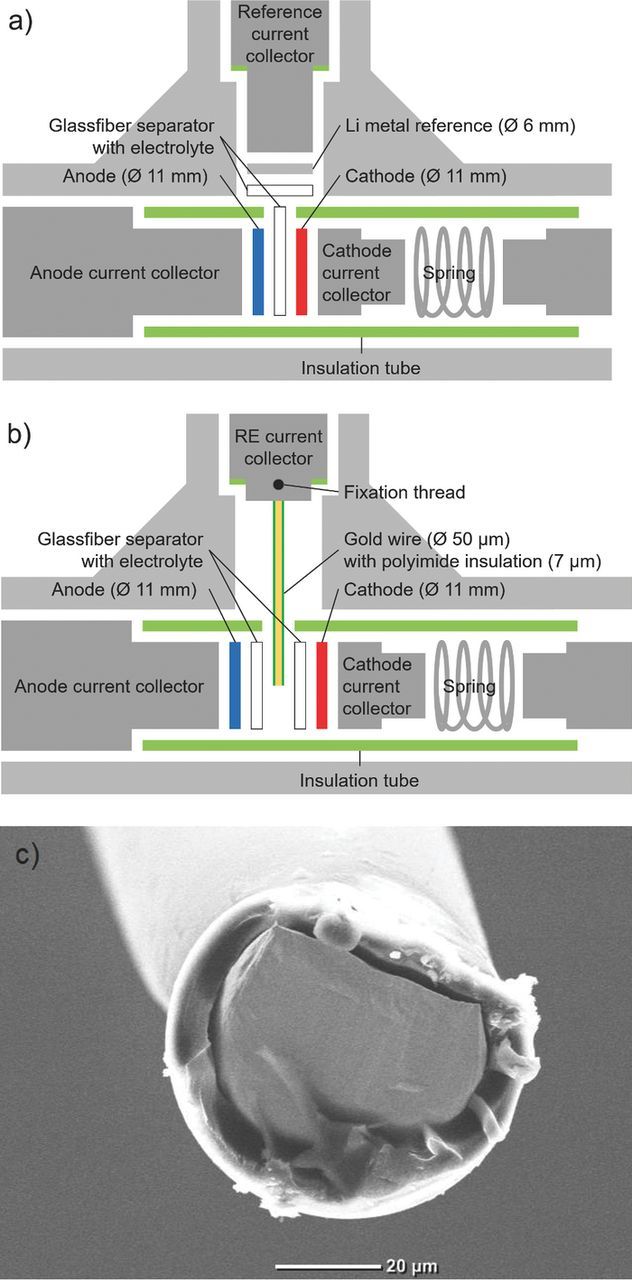
Figure 1. a) Conventional Swagelok T-cell design, b) modified T-cell design with gold wire reference electrode (GWRE), c) SEM image of the cut cross-section of gold wire tip prior to lithiation.
As standard electrolyte, 1 M lithium hexafluorophosphate (LiPF6) in a mixture of ethylene carbonate (EC) and ethyl methyl carbonate (EMC) at a weight ratio of 3:7 was used (LP57, BASF SE, Germany). The water content of this electrolyte was determined via Karl-Fischer-Titration to be <10 ppm. Vinylene carbonate (VC, BASF SE, Germany) was added in weight ratios of 0.17% and 0.52% to the standard electrolyte. These concentrations were chosen as they yielded gVC/AhCell ratios equal to 2% and 6% VC additive (same solvent/salt) in 225 mAh full-cells used in a study on the anode and cathode impedance growth in the presence and absence of VC by Burns et al.32 For stability measurements of the gold wire electrode, symmetrical lithium/lithium cells with a GWRE were built using 11 mm lithium discs (450 μm thickness, Rockwood, USA) as both cathode and anode.
Cell cycling and impedance measurements
The gold wire reference was lithiated by applying a current of 150 nA between the working electrode (LFP or lithium) and the gold wire reference electrode using a potentiostat (VMP300, BioLogic, France). Please note that the selected current range of 10 μA has an accuracy of 0.1%, which leads to an error of ∼10 nA. LFP/graphite cells were cycled between cell voltages of 2 and 4 V using a BioLogic potentiostat and a CCCV charge/CC discharge procedure with a C/20 current cutoff to end the CV phase. During cycling, the cells were placed inside a climatic chamber with a constant temperature of 25°C or 40°C. Electrochemical impedance spectroscopy (EIS) measurements were conducted either potential controlled with a perturbation of 5 mV at OCV (referred to as PEIS, with the AC voltage perturbation applied between working and reference electrode) or current controlled with a perturbation of 0.5 mA (referred to as GEIS), both in a frequency range of 100 kHz–0.1 Hz. The impedance measurements were conducted at 50% SOC and 25°C or 10°C. Prior to the measurement, the cells were allowed to rest at OCV and thermally equilibrate for 15 min.
Results and Discussion
Suitability of the GWRE to quantify individual electrode impedance in full-cells
As a first step, the potential stability of a lithiated GWRE was investigated in symmetric lithium-lithium T-cells with our modified design (see Fig. 1b). The GWRE was lithiated by applying a current of 150 nA for 1 h between one of the lithium electrodes and the GWRE. The black curve in Figure 2a shows the potential of the GWRE vs. Li/Li+ during galvanostatic lithiation at 25°C. The potential drops briefly below 0 V vs. Li/Li+ and then stays constant at ∼0.2 V vs. Li/Li+ during the entire lithiation procedure, which is similar to the first potential plateau observed during the electrochemical lithiation of gold thin films.25 The overpotential at the first moments of lithiation have been attributed to the reduction of surface oxides19 or the nucleation of the lithium-gold alloy phase.25 During the subsequent OCV at 25°C (see black curve in Figure 2b), the potential of the GWRE shoots up to 0.318 V and then quickly relaxes to ∼0.311 V vs. Li/Li+, which corresponds to the OCV potential of a LixAu alloy with 0 < x < ∼1.2.25 The lithiated GWRE potential remains stable for more than 500 h, varying by less than 2 mV after the initial 20 h of the OCV period. This means that the lithiated GWRE might not be suitable for highly accurate potential measurements during initial cycles, but is sufficient for tracking electrode potentials during prolonged cycling. Further, no morphological changes of the wire could be observed visually after disassembly of the cells.
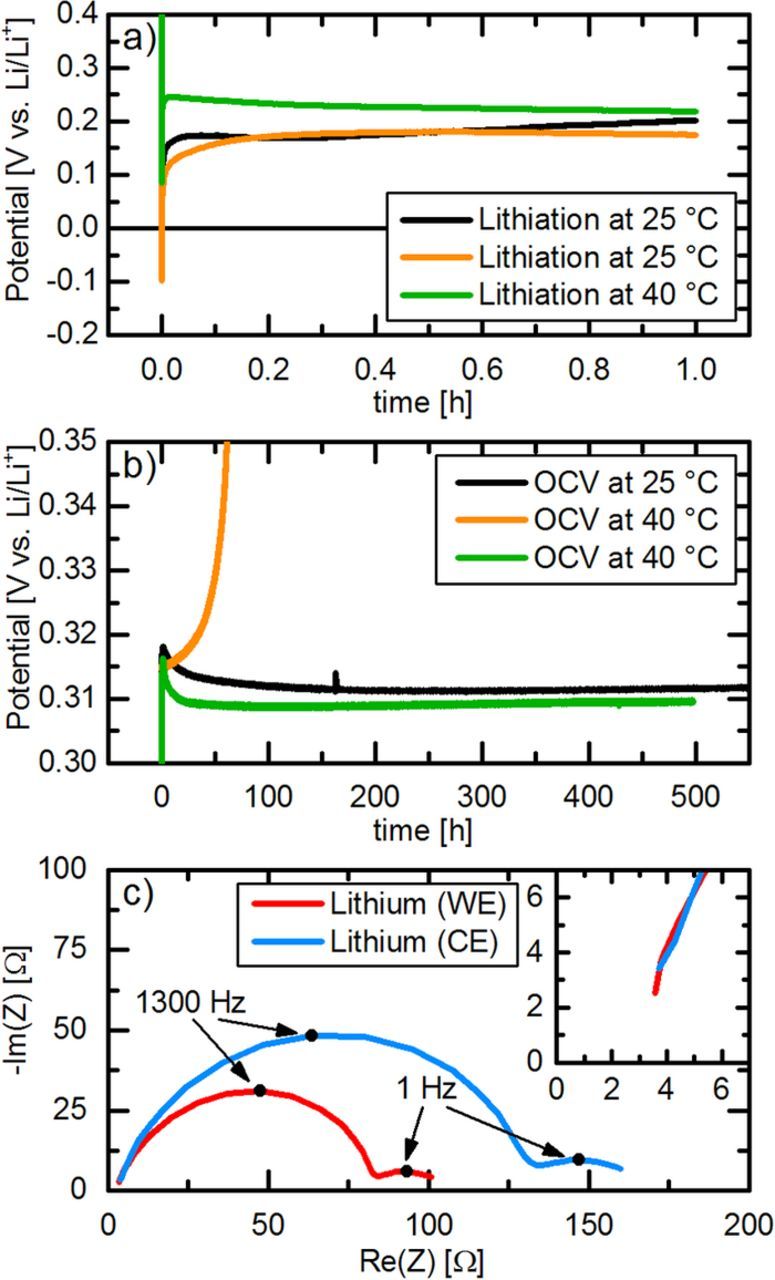
Figure 2. a) Potential of two GWREs during lithiation at 25°C (black and orange lines) and of one GWRE during lithiation at 40°C (green line) with 150 nA for 1 h. b) Potential of GWREs lithiated at 25°C during subsequent OCV at 25°C (black line) or at 40°C (orange line) as well as of the GWRE lithiated at 40°C during subsequent OCV at 40°C (green line). c) Nyquist plot of the lithium electrodes in a lithium/lithium cell at OCV at 25°C after lithiation of the GWRE at 25°C (PEIS, 100 kHz to 0.1 Hz, 5 mV AC perturbation). All potentials are given vs. Li/Li+ and experiments were conducted in LP57 electrolyte.
As many battery cycling tests are performed at higher temperatures to accelerate aging and to reflect more realistic operating conditions, it is desirable that the GWRE also functions at higher temperatures. However, if the GWRE is lithiated at 25°C and the cell temperature is then increased to 40°C for OCV measurements, the gold wire potential starts to drift to more positive values after less than 10 hours (see orange curve in Figures 2a and 2b). This is in accordance with Abraham et al.,6 who reported that the potential of a lithiated tin wire is substantially less stable at elevated temperatures, where the rate of SEI growth and the concomitant self-delithiation is generally enhanced. Once the cell is heated to 40°C, this effect must lead to a rather rapid depletion of lithium at the wire's tip, resulting in the observed potential drift. Interestingly, a re-lithiation of the wire with the same procedure at 25°C restored a stable GWRE potential of 0.311 V vs. Li/Li+, as long as the cell was kept at 25°C. We also observed that the GWRE potential stability over long time was limited in combination with high voltage cathodes (>4.7 V vs. Li/Li+), and also here the GWRE could be relithiated.33
After further investigations, we found that if the gold wire lithiation is conducted at 40°C (see green curve in Figures 2a and 2b), the GWRE shows the same stability during OCV at 40°C as was observed at 25°C, only shifted downwards by 1–2 mV. It is reported that an SEI formed at higher temperatures contains more inorganic species,34 which we hypothesize might form a more effective surface film on the lithium-gold alloy. While high temperature SEI formation was shown to lead to inferior capacity retention on graphite anodes during cycling,34 the more inorganic SEI could be advantageous in the absence of cycling-induced volume changes, i.e., for reference electrodes. However, the exact mechanism behind this enhanced stability by lithiation at higher temperatures is not clear at this point. We further believe that the stable potential of the GWRE for over hundreds of hours at up to 40°C is partly due to the fact that, contrary to previous micro-electrode designs,6,7 the reference electrode area exposed to the electrolyte is limited to the cross-sectional area of the tip (see Figure 1c), minimizing side reactions with the electrolyte. The stable potential over 500 h indicates that the lithium diffusion along the wire (i.e., away from the tip) must be sufficiently slow to prevent a significant depletion of lithium at the tip.
To evaluate if the GWRE in the modified T-cell design is suitable for impedance measurements of individual electrodes, we also measured the impedance of a symmetrical lithium/lithium cell with a GWRE (see Figure 2c). Arbitrarily, one of the lithium electrodes was designated as working electrode (WE), while the other was designated as counter electrode (CE). Prior to the impedance measurement in the lithium/lithium cell, the GWRE was lithiated at 25°C as described above from the lithium electrode designated as WE. The high frequency resistance (see inset) is identical for both lithium electrodes, which indicates that the GWRE is located centrally between the electrodes. Hence, a first precondition for an artefact-free measurement is fulfilled.14 Both lithium electrodes show a large semicircle in the high-frequency region (100 kHz–20 Hz, with the apex at ≈1.3 kHz), followed by a smaller semicircle at frequencies between 20 and 0.1 Hz (with the apex at ≈1 Hz), as reported previously for lithium metal electrodes.35,36 While the high-frequency semicircle has been ascribed to the SEI resistance, the semicircle in the low-frequency region is thought to represent the charge transfer resistance.36 Interestingly, both semicircles of the electrode used for the lithiation of the GWRE (designated as WE, see red line in Figure 2c) are about 35% smaller compared to the other electrode (≡ CE, s. blue line). We believe that this originates from the stripping of lithium from the WE electrode during lithiation of the GWRE, as this would cause a roughening of the lithium surface, leading to higher surface area and thus smaller impedance.
As a next step, the use of the GWRE in a LFP/graphite full-cell is tested and evaluated. Here, we also want to assess whether lithiation of the reference electrode is necessary for impedance measurements, i.e., whether the non-lithiated Au wire can be used as pseudo-GWRE. To this purpose, we built identical LFP/graphite cells with GWRE: in one case, we lithiated the GWRE with 150 nA for 1 h at 25°C from the LFP electrode (note that the 150 nAh needed for lithiation of the GWRE are negligible compared to the LFP cathode capacity of 1.95 mAh); in the other case, we did not lithiate the GWRE. Subsequently, both cells underwent one formation cycle (at a rate of C/10) at 25°C and then were charged to 50% SOC. Figure 3a shows the potential of the LFP cathodes vs. the non-lithiated pseudo-GWRE and vs. the lithiated GWRE during 30 seconds of OCV prior to the impedance measurement. As the potential of the LFP electrode does not change significantly during the measurement, all potential changes can be ascribed to changes in the GWRE potential. While the LFP potential vs. the non-lithiated GWRE drifts about 20 mV during 30 seconds (black curve in Figure 3a), the LFP potential vs. lithiated GWRE remains stable within 0.3 mV (green curve in Figure 3a). In the subsequent potential-controlled impedance measurement (PEIS; 5 mV amplitude, 100 kHz–0.1 Hz) at OCV, the cell with the non-lithiated GWRE (see Figure 3b) shows significant distortions at frequencies near/below 1 Hz: i) the graphite impedance (blue line) displays an inductive loop; ii) the LFP impedance (red line) bends toward lower Re(Z) values; and, iii) even the full-cell impedance (black line) shows an irregular sharp peak. These distortions appear at frequencies near or below 1 Hz, where the average potential drift of 0.67 mV/s of the non-lithiated pseudo-GWRE (see black line in Figure 3a) is no longer significantly lower than the change of the AC voltage amplitude of 5 mV. In contrast, the impedance spectra of the cell with the lithiated GWRE (Figure 3c) do not show these distortions, as the reference potential drift is almost two orders of magnitude lower in this case (0.01 mV/s). Our measurements are in agreement with simulations by Victoria et al.,17 who showed that linear potential drifts on the order of 0.1 mV/s during impedance measurements can lead to these types of artefacts below 1 to 0.1 Hz, depending on the excitation amplitude. The potentiostatic impedance measurement mode used here (see Figure 4a), where the potential between WE and RE is controlled, leads to a particularly detrimental effect: As the base potential between RE and WE is fixed, the WE potential has to drift in the same way as the RE, which leads to a bias current between WE and CE. This continuously increasing current renders the full system nonlinear and time-variant, leading to the full cell impedance artefacts observed at low frequencies. While normally the full cell impedance should be unaffected by artefacts related to the reference electrode,14 this comparison shows that it is crucial to use a reference electrode with a stable and defined potential for WE - RE potential controlled impedance measurements at low frequencies. To avoid the effects of a drifting pseudo-reference electrodes on the full cell impedance, one could either use a current-controlled measurement mode (GEIS, see Figure 4b), or control the potential between WE and CE during the impedance measurement (Figure 4c). Yet, artefacts of a non-stable RE will still be visible in the half cell impedance in these measurement setups.
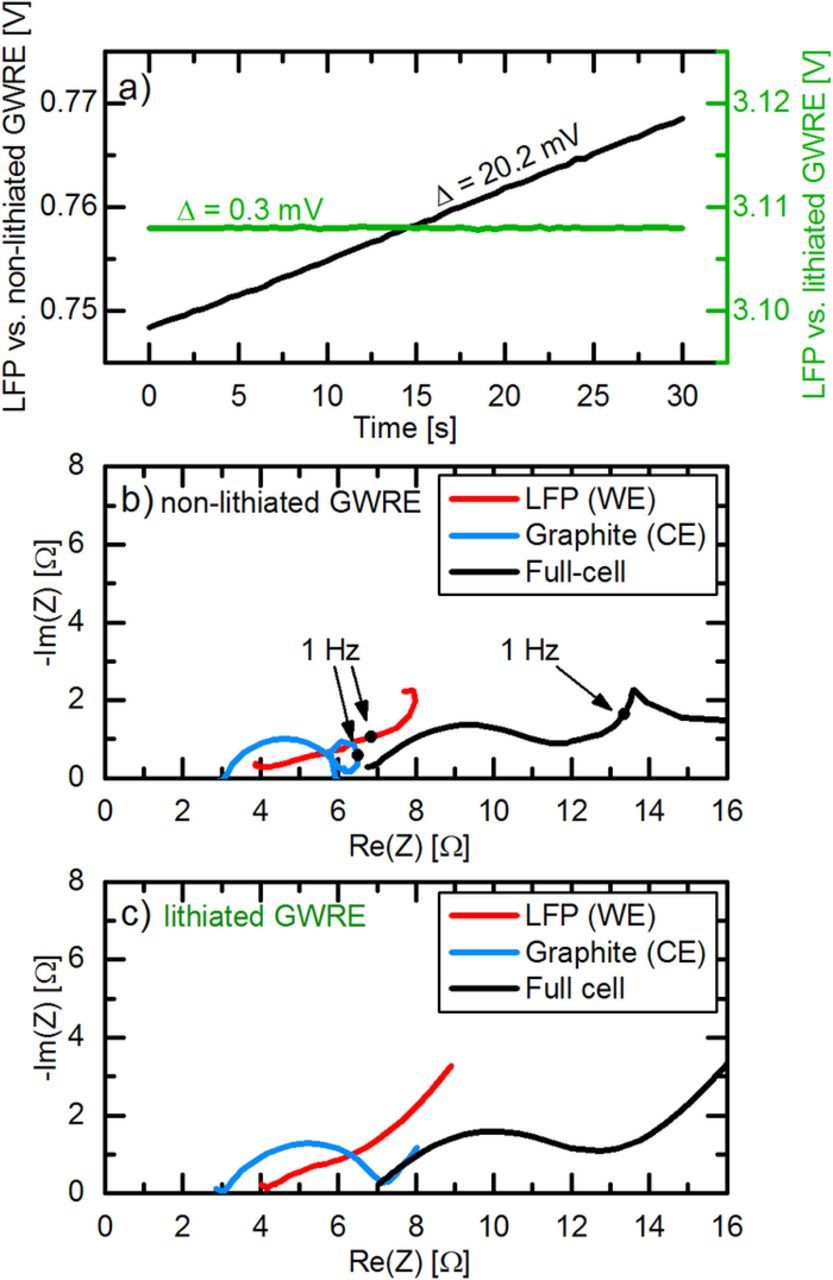
Figure 3. Comparison of voltage drift and impedance quality for a lithiated GWRE and a non-litiated pseudo-GWRE in LFP/graphite full-cells. a) Measured potential between the LFP working electrode (WE) and either the non-lithiated pseudo-GWRE (black line) or the lithiated GWRE (green line). b) Nyquist plot of an LFP/graphite full-cell obtained with a non-lithiated pseudo- GWRE before lithiation. c) Nyquist plot of an LFP/graphite full-cell obtained with a lithiated GWRE. Conditions: 25°C, LP57 electrolyte, PEIS with 5 mV amplitude at OCV (100 kHz–0.1 Hz).
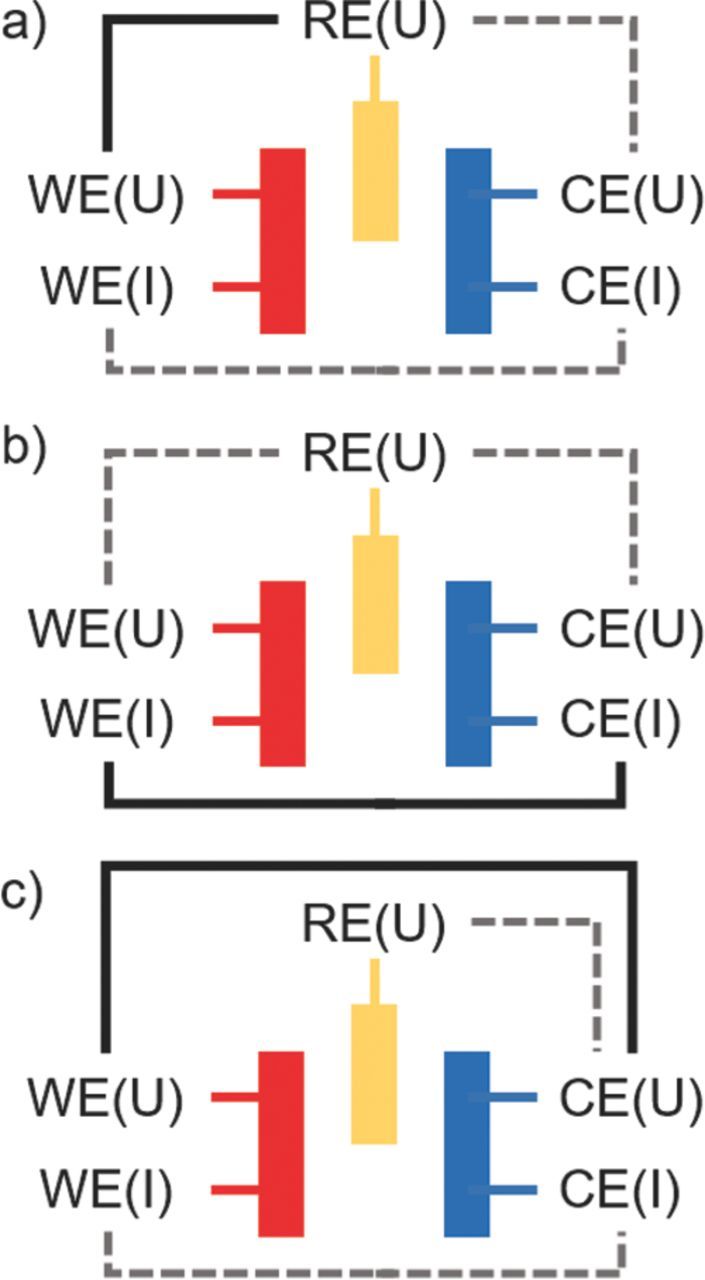
Figure 4. Systematic scheme of impedance measurements modes. a) Potential-controlled impedance spectroscopy (PEIS): The potential perturbation is controlled between WE and RE (black solid line), while current and potential between WE - CE are measured (gray dotted lines). A drift of the RE will lead to bias current between WE and CE. b) Current-controlled impedance spectroscopy (GEIS): The current perturbation is applied between WE and CE (black solid line), while potentials between WE - RE and CE - RE are measured. c) Modified potential-controlled impedance spectroscopy (PEIS): The potential perturbation is controlled between WE and CE (black solid line), while current between WE - CE and potential between RE - CE are measured (gray dotted lines).
Next, we take a closer look at the impedance spectra of the LFP and graphite electrodes recorded with a lithiated GWRE (Figure 3c). In contrast to the previous setup with two lithium electrodes, the HFR of both electrodes is not identical here. Gaberscek et al.37 showed that the contact resistance between an aluminum current collector and an LFP electrode composite can be on the order of several Ωcm². Our own measurements confirm that the through-plane resistance of the used LFP electrodes is about 1 Ωcm² higher compared to the graphite electrodes (data not shown). Thus, the ≈1 Ω difference in HFR originates from the higher contact resistance between the LFP coating and the current collector (1 Ωcm² corresponds to ≈1 Ω for our electrode area of 0.95 cm2). The charge transfer semicircle of the LFP electrode is small and almost invisible, which suggests the lack of a resistive cathode film.38,39 At the same time, the graphite anode shows a clearly distinguishable semicircle. As this semicircle is not visible in graphite electrodes prior to cycling, we attribute it to a combined SEI/charge transfer resistance on the graphite surface.
To further validate the impedance data measured in a full-cell with a lithiated GWRE, we compare its impedance response with that of symmetric cells, which are commonly used for accurate impedance measurements.4 Figures 5a and 5b show the comparison of the impedance spectra of a graphite and a LFP electrode measured in a full-cell with lithiated GWRE and in reassembled symmetric LFP/LFP and graphite/graphite cells, all after one C/10 formation cycle at 25°C and subsequent charge to 50% SOC. Note that the impedances of the symmetric cells have been divided by 2 in order to account for the two nominally identical electrodes in the symmetric cells. Apart from a slight shift in HFR, the impedance response of the symmetric cells and the full-cell with the lithiated GWRE are essentially identical for both graphite (Figure 5a) and LFP (Figure 5b) electrodes. The HFR shift is probably introduced by a weaker compression of the glassfiber seperators in the symmetric cells, caused by the slightly different assembly procedure for cells with and without GWRE. The additional high frequency contact resistance feature visible in the impedance spectra of symmetric cells by Dahn's group,4 which results from the contact resistance between the cell housing and the electrode coating on the back side, does not appear in our symmetric cell impedance spectra (see Figures 5a and 5b), as we use single-side coated electrodes for both symmetric cells and full cells.
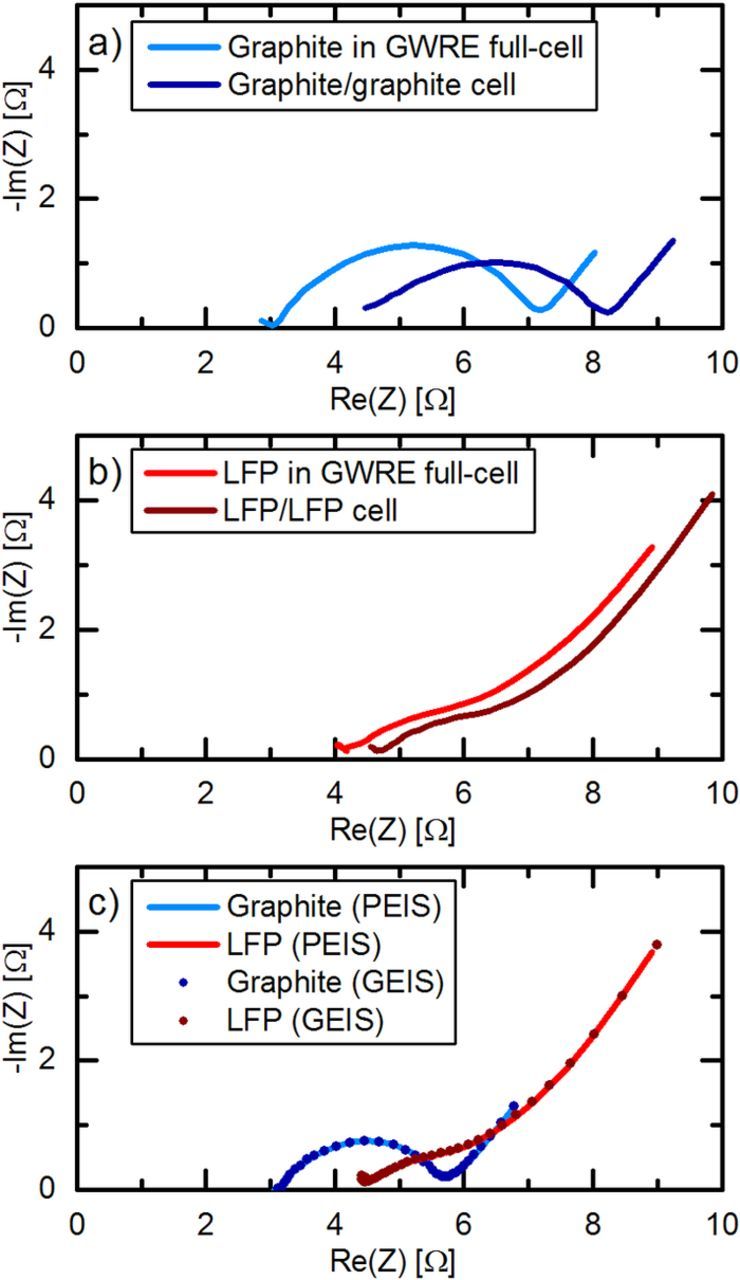
Figure 5. Impedance measurements on LFP and graphite electrodes after one C/10 formation cycle at 25°C and subsequent charge to 50% SOC. a) Nyquist plot of the graphite electrode of an LFP/graphite full-cell with lithiated GWRE (blue line) and of a symmetrical graphite/graphite cell divided by 2 (dark blue). b) Nyquist plot of the LFP electrode of an LFP/graphite full-cell with lithiated GWRE (red line) and of a symmetrical LFP/LFP cell divided by 2 (dark red). c) Comparison of the impedance response (100 kHz–0.1 Hz) of graphite and LFP electrodes under potential-controlled (PEIS at 5 mV amplitude, straight lines) and current-controlled (GEIS at 0.5 mA amplitude, dotted lines) conditions. All impedance measurements were conducted at 25°C.
As a final consistency check, we performed a potential-controlled impedance measurement (PEIS) followed by a current-controlled impedance measurement (GEIS) on the same LFP/graphite full-cell with a lithiated GWRE (see Figure 5c). Mathematically speaking, both measurements should give identical results in a Nyquist plot; hence any differences between them would indicate a biased impedance response.21 However, Figure 5c shows that the two methods deliver completely identical impedance spectra. These results confirm that the presented cell setup with the lithiated GWRE is free of measurement artefacts and is suitable for the impedance investigation of individual electrodes in full-cells. In summary, our modified T-cell design with a lithiated GWRE is able to provide accurate impedance measurements of individual electrodes in full-cells in a wide frequency range (100 kHz–0.1 Hz). A stable potential of the GWRE is especially crucial for measurements at low frequencies. If lithiated at elevated temperature, the potential of the GWRE is stable for several weeks at up to 40°C, which we partially attribute to the small area exposed to the electrolyte.
Anode & cathode impedances during cycling in full-cells with GWRE
In the following, we want to demonstrate the suitability of the lithiated GWRE to investigate the evolution of anode and cathode impedances during extended charge/discharge cycle tests in full-cells. To this purpose, LFP/graphite full-cells with lithiated GWRE were cycled at 25°C for 200 cycles at a rate of 1C after two initial formation cycles at C/10. Impedance measurements were performed at 50% SOC after 5, 10, and each subsequent 10th cycle at 25°C. Figures 6a and 6b show the potential of the cathode and anode vs. the lithiated GWRE potential (left y-axis) during cycles 10, 50, 100 and 200 (for the sake of clarity, cycles in between were omitted), which can easily be converted into the Li/Li+ scale by adding 0.311 V (right y-axis). The LFP charge and discharge plateaus are centered around 3.11 V vs. the lithiated GWRE (see Figure 6a and also Figure 3a), corresponding to a calculated value of 3.42 V vs. Li/Li+, which matches well with the true LFP equilibrium potential.40 The LFP potential center vs. lithiated GWRE remains constant during cycling, meaning that the lithiated GWRE maintains its stable potential of 0.311 V vs. Li/Li+. Throughout cycling, the overpotentials of both electrodes do not change, yet the maximum potential of the graphite anode at the discharge end point moves upwards (see dark blue to light blue lines in Figure 6b). At the same time, the minimum potential of the cathode also moves upwards (see dark red to light red lines in Figure 6a), which indicates that the SOC of both electrodes slip against each other. Figure 6c shows the impedance spectra of both cathode and anode after 10, 50, 100 and 200 cycles. Note that both the cathode and anode impedance decrease slightly from cycle 5 (data not shown) to cycle 10, which could be related to the dissolution of gasses evolved during formation and/or improved wetting over the first cycles. Between cycle 10 and 200, the high frequency resistance of both electrodes increases slightly by about 0.1–0.2 Ω. This could be due to an increased electrical resistance between the electrode coatings and the current collectors, implying a very slow delamination of the composite electrodes, or a higher ionic resistance within the bulk electrolyte. While the cathode impedance shows no further changes during cycling, the anode semicircle increases slightly from ∼1.9 Ω after cycle 10 to ∼2.2 Ω after cycle 200, which indicates a very slow SEI growth. Overall, the potential changes of both electrodes during cycling and the small but measureable impedance growth of the anode can be related to the loss of active lithium due to a slow but steady SEI growth, which has been identified as the dominant aging mechanism in LFP/graphite cells.41–45
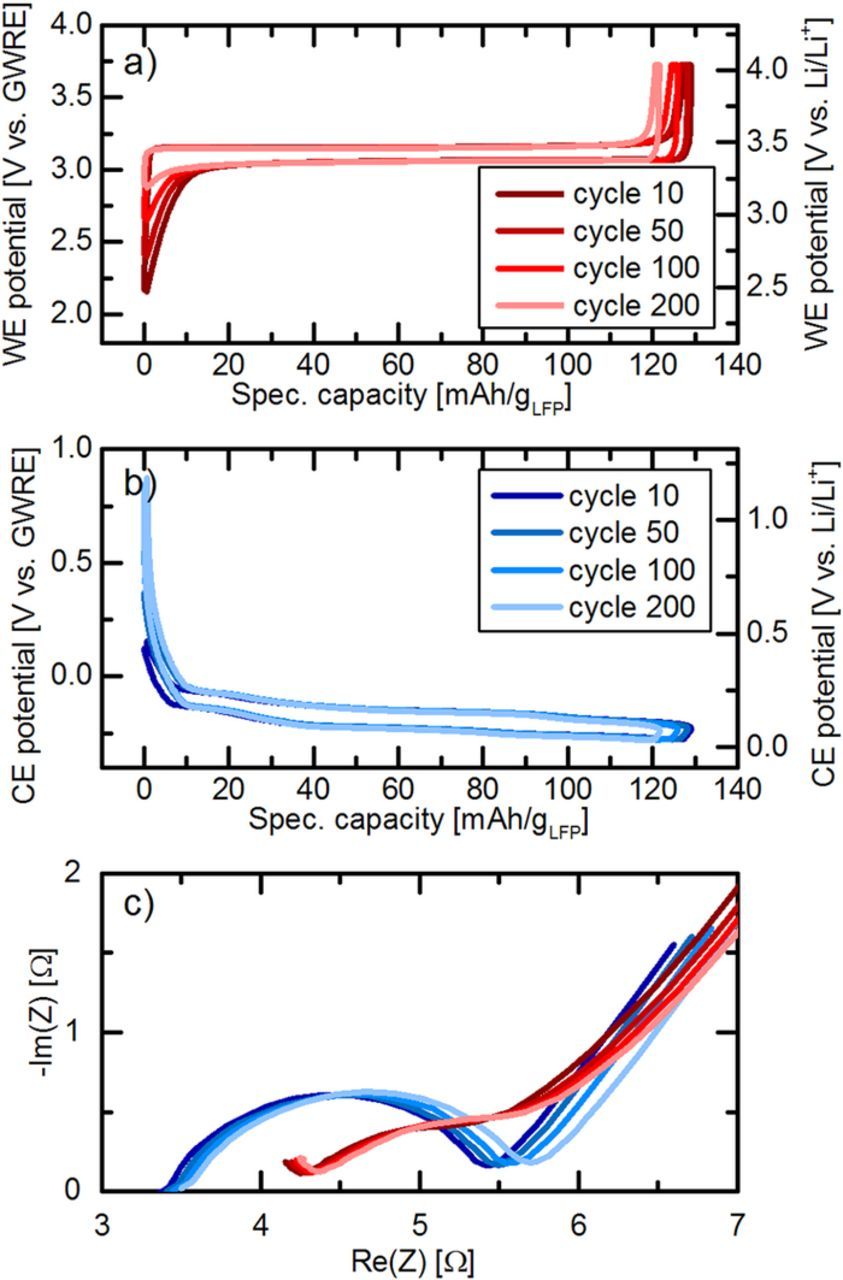
Figure 6. Charge/discharge of an LFP/graphite full-cell with a lithiated GWRE at a rate of 1C after two initial formation cycles at C/10 (LP57 electrolyte, 25°C). a) Cathode potential vs. the lithiated GWRE of cycles 10, 50, 100 and 200. b) Anode potential vs. the lithiated GWRE of cycles 10, 50, 100 and 200. The conversion to the Li/Li+ scale (right axis in a and b) was done by adding 0.311 V to the GWRE potential. c) Nyquist plot of the PEIS (5 mV amplitude, 25°C) at 50% SOC of both the graphite anode (shown in the range from 100 kHz to 0.1 Hz) and the LFP cathode (shown in the range from 100 kHz to 0.3 Hz) after cycle number 10, 50, 100 and 200.
Application of the GWRE to anode & cathode impedance growth during full-cell formation
Vinylene carbonate (VC) is one of the most commonly used electrolyte additives, as it leads to improved SEI stability at elevated temperatures and thus enhanced cycle life of lithium ion cells.46,47 However, high concentrations of VC have shown to increase the impedance of both anode and cathode,32 which in turn leads to higher overpotentials and heat generation during cycling. Freiberg et al.48 recently indicated that the absolute amount of an additive per active material, instead of its concentration, is the crucial parameter when comparing larger cells (e.g. commercial cells) and small lab-scale cells (e.g. coin cells). Therefore, we want to compare the effect of different amounts of VC in LP57 electrolyte on both anode and cathode impedance in LFP/graphite full-cells obtained with a lithiated GWRE to the study by Burns et al.,32 who used 225 mAh LCO/graphite pouch cells with the same electrolyte and examined the effect of VC on the impedance of the individual electrodes via symmetric cell measurements. In Burns' study, it was shown that the charge transfer resistance of a graphite anode decreases slightly from 0% to 0.5% VC in the electrolyte and increases roughly linearly with VC concentration between 1% and 6% VC (see Figure 9b in Ref. 32). At the same time, the impedance of the LCO cathode from Burns' study (see Figure 9a in Ref. 32) decreases about 50% from 0% to 2% VC and then gradually increases again up to VC concentrations of 6% to a value which is still below the 0% VC case. Unfortunately, the exact amount of active material in the cells used by Burns et al. was not given. However, the specific capacities of LCO and LFP are similar, and our anode to cathode capacity ratio of 1.1 is close to a commercial balancing. Hence, we think it is reasonable to assume that the masses of both anode and cathode active materials are proportional to the respective cell capacity. As the ratio of electrolyte to cell capacity (and thus active material) in our lab-scale T-cell design is 11.6 times higher compared to Burns et al.32 (38 gelectrolyte/AhCell vs. 3.3 gelectrolyte/AhCell), we adjusted the amount of VC in the electrolyte accordingly. Thus, our chosen concentrations of 0.17% and 0.52% VC represent the same gVC/AhCell ratio, namely 0.06 gVC/AhCell and 0.2 gVC/AhCell, as cells with 2% and 6% VC in the study by Burns et al.32 After lithiation of the GWRE and one formation cycle at 40°C, the LFP/graphite cells were charged to 50% SOC and the impedance measurements were then conducted at 10°C, i.e., under the same conditions as reported by Burns et al.32
Figure 7 shows the Nyquist plot of graphite electrodes after formation with different concentrations of VC. For each concentration, two cells are shown to assess the cell to cell variation. Quite clearly, the cells with 0.17% and 0.52% VC show an increased charge transfer resistance of the graphite anodes. These results already indicate that electrolytes cannot be compared without considering the amount of active material, as the anode charge transfer resistance decreases up to a VC concentration of 0.5% in the study by Burns et al.,32 while Figure 7 shows that the anode charge transfer resistance increases substantially within the same VC concentration range.
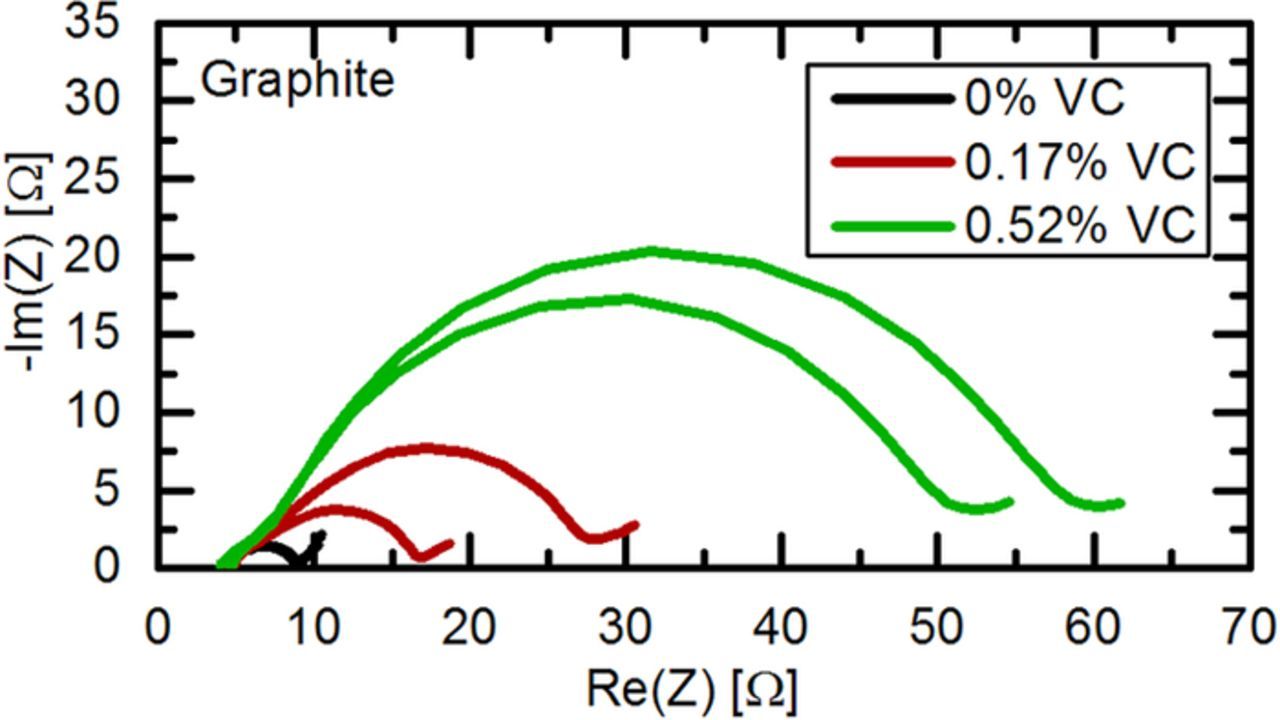
Figure 7. Nyquist plot of the graphite anode impedance after one formation cycle and recharge to 50% SOC at 40°C of LFP/graphite full-cells with a lithiated GWRE in LP57 electrolyte containing 0%, 0.17%, and 0.52% VC in the electrolyte. PEIS was measured at 10°C between 100 kHz–0.1 Hz with an amplitude of 5 mV.
To quantify the charge transfer resistances, the impedance spectra of cathode and anode of each cell were fitted using a simple electrochemical equivalent circuit composed of: i) a resistor for the electrolyte, ii) a resistor and a constant phase element in parallel to describe the electrolyte/electrode interface resistance, and, iii) a Warburg-type diffusion element in series representing solid state diffusion. This circuit is a simplified version of a model used by Illig et al.35 for LFP electrodes; we omitted the electrode contact resistance and the low frequency capacitor, as both are not visible within our measurement range. Figure 8 shows the average fitted charge transfer resistances (left y-axis), normalized to the geometrical electrode area, of both electrodes at different gVC/AhCell ratios (lower x-axis). The anode charge transfer resistance is ∼5 Ωcm² for cells without VC and increases to ∼16 Ωcm² and ∼47 Ωcm² for cells with 0.06 gVC/AhCell (≡0.17% VC) and 0.2 gVC/AhCell (≡0.52% VC), respectively. In comparison, Burns et al.32 showed an anode charge transfer resistance of ∼30 Ωcm², ∼60 Ωcm² and ∼150 Ωcm² for cells with identical gVC/AhCell ratios (0%, 2% and 6% VC in their study). The linear increase in charge transfer resistance from 0.033 to 0.2 gVC/AhCell that has been observed by Burns et al.32 (corresponding to 1%-6% VC in their study) is also found in our results within the same gVC/AhCell range, although our absolute VC concentrations are completely different (0–0.52% VC). This further proves that the amount of additive per active material (here corresponding to the gVC/AhCell ratio) determines the effect of an additive on the surface of an electrode, and not its concentration. The differences in absolute resistance values between Burns' study32 and ours could be explained by differences in active material loading and BET surface area of the used electrodes: As the impedance of an electrode is inversely proportional to the electrochemical active area, a higher roughness factor (i.e., electrode surface area per geometric area) will result in an overall lower impedance, even if the surface chemistry is identical. While our electrodes are loaded with 5.9 mg/cm² graphite having a BET surface area of ∼5 m²/g, we can estimate the anodes investigated by Burns et al.32 to have a loading of ∼10 mg/cm² graphite49 with a BET surface area of ∼0.7 m²/g.50,51 In total, this would give a ∼5-fold higher roughness factor in our study, which would fit with the measured ∼4 times lower absolute charge transfer resistance values. However, it is to note that the assumed values for loading and BET were taken from other publications by the Dahn group and not directly from Burns et al.,32 and hence this is only an estimate. A different BET surface area would also affect the amount of additive per unit surface, and thus result in a different charge transfer resistance. To make our data more comparable to future studies, we therefore included the amount of VC per graphite BET surface area (mgVC/m²Graphite, upper x-axis) and the charge transfer resistance normalized to the graphite BET surface area (Ω m²Graphite, right y-axis) in Figure 8. An additional difference between our cells and the study by Burns et al.32 is the different cycling protocol: Our impedance data was recorded after one formation cycle, whereas the cells by Burns et al.32 were disassembled for impedance measurements of symmetric cells after 23 cycles. However, further cycling and impedance measurements of our LFP/graphite cells showed that the impedances of both electrodes does not change significantly with cycle number once the formation cycle is completed.
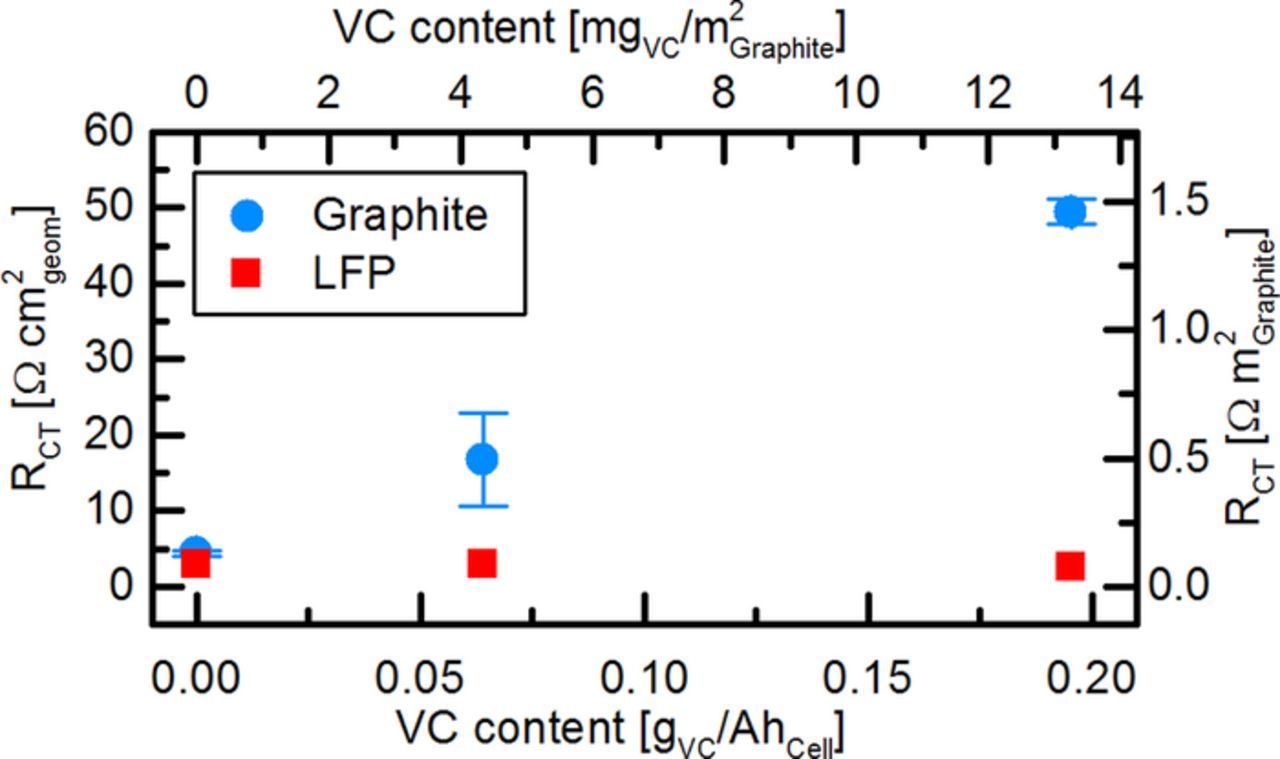
Figure 8. Rct of the graphite anode and the LFP cathode after formation in LFP/graphite full-cells with different VC amounts added to LP57 electrolyte. Impedance data were obtained with a lithiated GWRE (PEIS at 5 mV amplitude and 10°C between 100 kHz and 0.1 Hz) and fitted by an equivalent circuit consisting of a resistor for the electrolyte, an RQ-element for the electrolyte/electrode interface resistance, and a Warburg element for solid-state diffusion. Note that the upper x-axis and the right y-axis display the VC content and charge transfer resistance normalized to the graphite BET surface area.
The charge transfer resistance of the LFP cathode in our study does not show any dependency on the VC content (see Figure 8). In contrast, Burns et al.32 found that the impedance of an LCO cathode decreases about half by the addition of low concentrations of VC (0.5–2%) and increases again slightly at higher VC concentrations (4–6%). This discrepancy can be understood considering the studies by El Ouatani et al.,52,53 which showed that LCO cathodes form a surface film of poly(VC) in VC-containing electrolytes, while this film is lacking on LFP cathodes. Thus, the cathode charge transfer resistance remains constant and independent from the VC content in LFP/graphite cells. As VC reacts on the LCO surface,52,53 one can imagine that slightly less VC is available for SEI formation in LCO/graphite than in LFP/graphite cells. This could in turn also partially explain the deviations of the absolute values for the anode charge transfer resistance at points of equal gVC/AhCell in our study compared to Burns et al.32 Hence, we can conclude that not only the ratio of additive to active material, but also the cell chemistry of cathode and anode and their reactivity toward the additive is an important aspect to consider when comparing additives across different cell types.
Conclusions
In this study, we introduce a novel micro-reference electrode in a Swagelok T-cell design, which is suitable for impedance and potential measurements of both working and counter electrode individually. The reference electrode consists of a thin, insulated gold wire and is placed centrally between both electrodes and two 200 μm thick glass fiber separators. By electrochemical alloying with lithium, we achieve a defined potential of 0.311 V vs. Li/Li+ of the gold wire reference electrode (GWRE), which is stable for several weeks during cycling and even under elevated temperatures (40°C). In contrast to previous micro-reference designs, only the cut cross-section of the wire's tip is the electrochemically active area, which supposedly minimizes side reactions with the electrolyte and contributes to the long-term stable potential of the GWRE. The cell setup with GWRE was validated by impedance measurements of the corresponding symmetrical cells. Further, we demonstrated the suitability of the lithiated GWRE for impedance and potential measurements in LFP/graphite full-cells for up to 200 cycles. Based on these measurements, we could identify lithium inventory loss due to SEI growth as the dominant aging mechanism in LFP/graphite cells at room temperature, in agreement with literature.
As a proof of concept, we investigated LFP/graphite full-cells with a lithiated GWRE and different VC contents in the electrolyte. Using symmetrical cells, Burns et al.32 showed that the charge transfer of a graphite anode depends almost linearly on the concentration of vinylene carbonate (VC) in the electrolyte. We can reproduce the findings by Burns et al.32 using a lithiated GWRE, and further demonstrate that the ratio of mass VC to active material, rather than the VC concentration, is the key parameter for the electrolyte/anode interface resistance. This result needs to be considered when electrolyte additives are tested in laboratory cells, as these cells typically have a higher electrolyte to active material ratio than commercial lithium-ion cells.
Acknowledgment
This work is financially supported by the BASF SE Battery Research Network. J. L. gratefully acknowledges the funding by the Bavarian Ministry of Economic Affairs and Media, Energy, and Technology for its financial support under the auspices of the EEBatt project.