Abstract
The increasing rate of hydrogen evolving from magnesium (Mg) surfaces under anodic polarization was characterized through simultaneous hydrogen volume collection, mass loss, potentiostatic and potentiodynamic polarization, and inductively coupled plasma optical emission spectroscopy (ICP-OES). This is distinct from the literature in that all four techniques are not often performed in the same test. Results indicate Mg dissolves as Mg2+ with anodically induced increases in hydrogen evolution rates due to increases in the water reduction reaction rate. In order to contribute to a mechanistic understanding of the cause for anodically induced increases in hydrogen evolution, quantitative surface spectroscopy for accurate chemical analyses of the Mg surface subject to dissolution was carried out via post exposure Rutherford Backscattering Spectrometry. Surface enrichment of transition elements other than Mg were confirmed, which provides a foundation for understanding the origin of enhanced hydrogen evolution. The selection of this technique was necessitated by limitations of near surface analysis by more conventional methods.
Export citation and abstract BibTeX RIS

This is an open access article distributed under the terms of the Creative Commons Attribution Non-Commercial No Derivatives 4.0 License (CC BY-NC-ND, http://creativecommons.org/licenses/by-nc-nd/4.0/), which permits non-commercial reuse, distribution, and reproduction in any medium, provided the original work is not changed in any way and is properly cited. For permission for commercial reuse, please email: oa@electrochem.org.
Magnesium (Mg) alloys remain attractive for potential weight reduction in the automotive and aerospace industries.1–3 With the growing demand for Mg products, the corrosion of Mg in aqueous electrolytes remains an important technological issue.4 Commercial Mg alloys possess corrosion potentials less than −1.4 VSCE in a wide variety aqueous environments, where the hydrogen evolution reaction (HER) is the primary cathodic reaction and any transition metal (TM) contaminants can support HER without the thermodynamic tendency for dissolution.5
Rapid rates of Mg corrosion occur in aqueous environments of near-neutral pH compared to other engineering metals on the basis that: (1) Mg is not thermodynamically stable below pH ∼11, (2) there is no mass transport limitation on the cathodic reaction (since water, which is available in abundance, is being reduced, not oxygen), (3) the lack of a protective (passive) film, and (4) the non-polarizable nature of Mg also contributes to very high rates of anodic dissolution, since low overpotentials correspond to high current densities. This latter point is the kinetic reason why galvanic coupling of Mg to other, more noble, engineering metals such as steels is particularly detrimental. Several attempts have been made to increase the intrinsic corrosion resistance of Mg alloys,6–14 however design of improved Mg alloys requires a fundamental understanding of the corrosion mechanisms. One widely studied phenomenon of Mg corrosion is the so called negative difference effect or NDE (i.e., increased rates of the HER at increasing anodic polarization) which confounds the understanding of dissolution mechanisms, establishment of the Tafel law, and other issues.8,15–27
Several explanations of this anomalous behavior have been proposed among which include impurity element enrichment, formation (and disruption) of a partially protective film, metal spalling, univalent Mg based anodic dissolution, and magnesium hydride based models as reviewed elsewhere.28,29 Recently it has been proposed by Frankel et al.15 that the exchange current density for the HER increases as the rate of Mg dissolution increases as a result of enhanced cathodic activity on the magnesium surface (i.e., the anode). Supporting evidence for the HER rate increasing due to an enhanced cathodic process during anodic polarization has been reported by many, but in particular Williams et al.16–19 The persistence of cathodic reactions on an anodically polarized Mg surface has been studied by the scanning vibrating electrode technique (SVET), which has been able to image the temporal evolution of so called "cathodic activation", in particular revealing that cathodically active sites form preferentially at prior anodic sites on 99.9%16 and 99.99%17 pure Mg, Mg-Nd binary alloys,18 and AZ3119 surfaces. An important aspect of the SVET work was that the measured cathodic current density at these cathodic sites increased as the anodic current density became greater. Further electrochemical evidence for cathodic activation was reported by Birbilis et al.20 who employed anodic galvanostatic polarization of 99.9% pure Mg samples at increasing currents to accelerate dissolution of Mg followed by potentiostatic polarization at −1.9 VSCE to assess the cathodic reaction rate as a function of the extent of prior dissolution. The resulting potentiostatic polarization revealed a considerable increase in net cathodic current density beyond expectations from surface roughness. A potentiostatic test from this study also revealed a polarity reversal from net anodic current to net cathodic current with time, thus supporting the theory of enhanced cathodic activity.
Cathodic enhancement was also measured by Ogle and co-workers21,22,30 using downstream inductively coupled plasma atomic emission spectroscopy (ICP-AES) with an electrochemical flow cell. In addition to evidence of more facile HER, their studies revealed that Mg dissolution occurred via the anodic half-cell reaction of Mg → Mg2+ + 2e− with no need to invoke univalent (Mg+) based dissolution. While many independent groups have observed enhanced cathodic behavior, relatively little work has been performed on determining the basis for such activation.
The simplest of assumptions in regards to ascribing a mechanism for anodically induced increases in HER would be to assume that metals other than Mg (with such other metals in isolation being polarized cathodically at the open circuit potential of Mg, as well as during anodic dissolution of Mg) are either not dissolved at the potentials of Mg dissolution and are collected within the corrosion film or at the film/metal interface, or that such other metals redeposit on the surface. This basic premise has been alluded to in early reports by Hanawalt and co-workers12,31 who established tolerance limits of impurity elements above which the corrosion rate of Mg drastically increases. The limits were defined as 170 for ppm Fe, 1000 ppm for Cu, and 5 ppm for Ni. In addition, they observed initially high hydrogen evolution rates which decreased by an order of magnitude during 24 hours immersion in 3 wt% NaCl. The initially high rate of hydrogen evolution was attributed to the exposure of noble impurity elements to the electrolyte while subsequent decreased rates were due to a dense film sufficiently covering cathodes. Taheri et al.32 has shown the most convincing (physical) evidence to date for enrichment of other elements on a pure Mg anode using transmission electron microscopy (TEM) of focused ion beam (FIB) prepared cross-sections of the dark film formed regions on a corroding Mg surface that exhibited hydrogen evolution. Their study revealed a bi-layered structure consisting of a crystalline mixed MgO-Mg(OH)2 outer layer and a crystalline MgO inner layer with Fe-rich particles embedded in the columnar outer layer. Enrichment of elements has been noted in other TEM studies on commercial Mg alloy AZ31B33 as well as AM5034 and E717,35 albeit not in the context of the enhanced catalytic response.
The present study aims to systematically explore the enhanced catalytic activity of Mg by investigating the cathodic behavior of 99.9% Mg which was subjected to prior anodic potentiostatic polarization for 24 hours. Specifically, Rutherford Backscattering Spectrometry (RBS) was performed on selected sample surfaces after 24 hour potentiostatic holds to evaluate the composition of the sample surface. RBS is a highly sensitive non-destructive surface analysis technique which can accurately quantify the surface composition as small as 10−6 at% for layers up to 1–2 μm in thickness depending on the atomic number. In addition, RBS is ideal for detection of high atomic number elements in a low atomic number matrix.36 It merits comment here, that there are a number of more common surface analysis methods – other than RBS - by which researchers study surface compositions. However, in spite of such other methods being more readily available, their application and reportage to the problem of noble metal enrichment on Mg has not been widely reported. This is likely due to the unique nature of Mg being found to be incompatible with the goal of heavy (i.e., transition) element detection, in trace concentrations, in a light atom matrix on the basis that the signal to noise ratio is very low using energy dispersive X-ray spectroscopy (EDXS), where the interaction volume (nominally hundreds of μm3) is too large to detect surface enrichment in a nanometer scale zone. Furthermore, detection limits for EDXS,37 X-ray photoelectron spectroscopy (XPS),38 and Auger electron spectroscopy39 are typically between 0.1–1 at%. Glow discharge optical emission spectroscopy (GDOES) has also been attempted, as surface composition profiles on the order to tens of micrometers are possible with GDOES. However the results from GDOES were erratic on the basis that the surface roughness of dissolved Mg created issues with establishing true profiles.40 This is because the surface of dissolved Mg includes an un-smooth film that could be several micrometers in thickness, meaning that any leak in sample sealing (via the sample placement o-ring) results in excessively high O and N detection masking true composition. The comparatively thick surface film is also an issue for the use of XPS; whilst XPS has excellent surface sensitive (depth) resolution, the use of XPS (and even XPS profiling) is not readily possible, or tenable, for profile depths of several micrometers. This is not to say that such methods described are not useful, as they have been very well applied to metallographically prepared Mg specimens, including the detection of surface Fe contamination in mechanical shot peening of Mg.41 However, as described, the application of the aforementioned methods to the study of previously polarized Mg presents some challenges that merit the exploration of RBS as an additional characterization method capable of the unique resolution and unique depths of analysis required. This investigation represents the first study to combine hydrogen evolution, mass loss, DC electrochemistry, and ICP-OES followed by RBS in an effort to determine the effects of element enrichment on the NDE.
Experimental
Materials and sample preparation
99.9% pure Mg was used in this investigation as supplied by Alfa Aesar (Table I). Each sample was cold mounted in epoxy resin and mechanically ground to a 1200 grit SiC finish using ethanol (C2H6O) as lubricant. Sample surfaces were cleaned with ethanol and dried using compressed air after each grinding step.
Table I. Composition of high purity Mg used in this study in weight ppm (μg/g). Compositional analysis was performed by QUANT (Quality Analysis and Testing Corporation), USA.
| Element | Mg | Al | Zn | Mn | Fe | Zr | Ni | Cu |
|---|---|---|---|---|---|---|---|---|
| ppmw | Bal. | 200 | 300 | < 100 | 80 | < 100 | < 10 | 30 |
Electrochemical methods
Electrochemical testing was performed using a three electrode vertical cell with a platinum mesh counter electrode and saturated calomel reference electrode (SCE). An electrolyte filled burette with an inverted funnel attached was centered over the sample to aid in collection of H2 as described elsewhere42 emphasizing the important aspect that the electrolytes were pre-saturated with hydrogen prior to commencement of testing. This setup provided an exposed area of 0.5 cm2 for each test specimen. Potentiostatic polarization was performed at various net anodic and cathodic potentials ranging from −1.4 VSCE to −1.8 VSCE for 24 hours in quiescent 0.6 M NaCl solution using 18.2 MΩ deionized water at 25°C; the initial pH of each solution was in the range 8–9 as a result of water reduction when pre-saturating the solution with hydrogen. Following testing, samples were cleaned using 200 g/L CrO3 according to ASTM G143 to remove all corrosion products for determination of mass loss and evaluation using optical microscopy. Negligible mass loss was recorded on as-polished samples as seen elsewhere verifying this method.44
Under anodic polarization the total charge consumed is described by:
![Equation ([1])](https://content.cld.iop.org/journals/1945-7111/162/6/C228/revision1/jes_162_6_C228eqn1.jpg)
following fundamental mixed potential theory45 where QΔm is the anodic charge consumed from metal dissolution which can be accessed from gravimetric mass loss after removing corrosion products,  is the cathodic charge consumed on the anode due to hydrogen evolution, and QI net anodic is the charge measured by the potentiostat as the applied anodic current over time. The gravimetric mass loss for each sample with ± 0.1 mg resolution was converted to consumed anodic charge (QΔm) via Equation 2:
![Equation ([2])](https://content.cld.iop.org/journals/1945-7111/162/6/C228/revision1/jes_162_6_C228eqn2.jpg)
where z is the equivalent electrons per mole of Mg oxidized, Δm is the change in mass, F is Faraday's constant, and a is the molar mass of Mg. In this study, z is assumed to be 2 following the half-cell reaction Mg → Mg2+ + 2e−. The hydrogen captured during testing of pre-saturated solutions can be converted to a corresponding cathodic charge using the ideal gas law in combination with Faraday's Law:42
![Equation ([3])](https://content.cld.iop.org/journals/1945-7111/162/6/C228/revision1/jes_162_6_C228eqn3.jpg)
where z = 2 (i.e., 2e− + 2H+ → H2), P is the pressure inside the burette (1 atm), n is the number of moles of H2 gas given by the ideal gas law, V is the volume of gas in the burette, F is Faraday's constant, R is the ideal gas constant, and T is temperature. The net charge from the measured or applied current was determined from the integrated signal of current vs. time transient at each potential:
![Equation ([4])](https://content.cld.iop.org/journals/1945-7111/162/6/C228/revision1/jes_162_6_C228eqn4.jpg)
In additional electrochemical testing, cathodic potentiodynamic polarization scans were performed after 24 hour anodic and cathodic potentiostatic holds. These samples were not cleaned or removed from the electrochemical cell. Immediately following the potentiostatic hold, samples were allowed to stabilize at their open circuit potential (OCP) for 10 minutes before scanning from +0.05 V above OCP to a potential of −2.3 VSCE at a rate of 1 mV/s. A Bio-Logic VMP multi-channel potentiostat was used for all electrochemical testing. Each potential was tested a minimum of three times showing limited scatter. Additionally, control samples were polished, cleaned in CrO3, and tested as is or subjected to the same cathodic polarization test after 10 min hold at OCP. A second control sample was subjected to the anodic potentiostatic hold, cleaned in CrO3, and tested in a film free condition but with the possible surface enrichment of TM elements.
Inductively coupled plasma optical emission spectroscopy (ICP-OES)
All solutions were retrieved and analyzed using ICP-OES. A Thermo Scientific iCAP 7200 ICP-OES was used for analysis. Samples were acidified by adding 1 M HCl into each solution after electrochemical testing in order to dissolve any insoluble corrosion products suspended in solution. The acidified solutions were then subjected to a 10 part dilution prior to testing to minimize interferences and the background signal as a result of the NaCl content in solution. Corrosion products remaining on the surface could not be analyzed because of Cr interferences with Fe emission signals due to the CrO3 cleaning. In this work, the emission intensity of Mg (279.553 nm), Mg (280.270 nm), Al (226.910 nm), Al (308.215 nm), Al (396.152 nm), Fe (238.204 nm), Fe (239.562 nm), Mn (257.610 nm), Mn (259.373 nm), Zn (206.200 nm), Zn (213.856 nm), Zr (339.98 nm) and Zr (343.823 nm) were recorded and used for the calculation of charge consumed and percent of elements in solution using solution analysis. The approximate detection limit for each element is shown in Table II.
Table II. Approximate elemental detection limits for the ICP-OES used in this investigation in ppm (mg/l).
| Element | Mg | Al | Zn | Mn | Fe | Zr | Ni | Cu |
|---|---|---|---|---|---|---|---|---|
| ppm | 0.005 | 0.030 | 0.005 | 0.005 | 0.005 | 0.020 | 0.005 | 0.010 |
Rutherford backscattering spectrometry (RBS)
RBS was carried out at the University of Western Ontario, using a 1.7 MeV Tandetron, solid state, gas insulated, high frequency accelerator. The incident ion used for RBS was 4He (referred to as an α particle hereafter) accelerated to an energy of 3050 keV. This energy was used in order to take advantage of the resonance of the elastic 16O(α,α)16O scattering cross-section near 3040 keV which results in enhancement of the oxygen signal up to 29 times greater than that of the Rutherford cross-section depending on the scattering angle.46 The energy of scattered particles without energy loss is defined by Equation 5:36
![Equation ([5])](https://content.cld.iop.org/journals/1945-7111/162/6/C228/revision1/jes_162_6_C228eqn5.jpg)
where E is the energy of the 4He projectile after collision with the substrate, K is the kinematic factor, and Eo is the incident projectile energy. The kinematic factor is defined by Equation 6:36
![Equation ([6])](https://content.cld.iop.org/journals/1945-7111/162/6/C228/revision1/jes_162_6_C228eqn6.jpg)
where M1 is the mass of the projectile, M2 is the target mass, and θ is the scattering angle. The energy resolution, ΔE, between two masses on the same target that differ by a small amount ΔM2 is therefore:
![Equation ([7])](https://content.cld.iop.org/journals/1945-7111/162/6/C228/revision1/jes_162_6_C228eqn7.jpg)
The values of K and E used for the elements detected in this study are given in Table III. The energy loss of an alpha particle after passing through a layer with thickness x (atoms/cm2) is given by the equation:
![Equation ([8])](https://content.cld.iop.org/journals/1945-7111/162/6/C228/revision1/jes_162_6_C228eqn8.jpg)
where x is the depth into the sample layer and S(E) is the specific energy dependent stopping cross section of an alpha particle for the elements considered in the α particle-substrate collision.
Table III. The scattering factor K and energy E of 4He projectiles after collision with the substrate under the conditions used in this experiment.
| Element | K | E (keV) |
|---|---|---|
| 16O | 0.3710 | 1132 |
| 24Mg | 0.5206 | 1588 |
| 25Mg | 0.5346 | 1631 |
| 26Mg | 0.5479 | 1671 |
| 28Si | 0.5723 | 1745 |
| 52Cr | 0.7415 | 2262 |
| 56Fe | 0.7576 | 2311 |
The geometry and design of the RBS experiments was as follows: the incident angle was 0 degrees with an exit angle of 20 degrees resulting in a scattering angle of 160 degrees. The beam spot size was approximately 1.5 mm × 0.5 mm whilst the detector was a solid state device with an energy resolution of 15 keV. The beamline contained a quadrupole magnet for focusing, an analyzer magnet, a raster-scanner, and a steerer. The chamber pressure was in the range of 1.3 × 10⁻⁵ Pa. Data analysis was performed with the program SIMNRA v6.06.47 In this analysis the composition depth profile was established by iterative simulation of both elements in each layer and layer thicknesses until the experimental RBS data was matched for a given beam energy. The match was achieved accounting for energy loss and element concentration in a Mg matrix. Three zones were assumed: oxide/hydroxide outer layer, metallic enriched zone with the Mg below the oxide/hydroxide, and bulk Mg. This layered situation was modeled based on the 4He stopping cross-sections for a given layer thickness and composition. To achieve a match, the layer thickness, atomic numbers included in each zone, and thickness assumed needed to accurately reproduce the experimental RBS spectrum. Hence the atomic mass resolution produces the only uncertainty. A composition versus depth plot was constructed only after a match of the experimental data was obtained.
Results
Potentiostatic polarization
The typical potentiostatic polarization data for 99.9% pure Mg over a 24 hour period are shown in Figure 1. Figure 1a indicates the net current density vs. time for potentials that accumulated a net anodic charge whilst Figure 1b shows the net current densities vs. time for net cathodic potentials; the OCP is approximately −1.6 VSCE. All net anodic potentials underwent a reduction in net current between 100 to 1000 seconds implying either eventual inhibition of anodic dissolution or a large increase in cathodic reaction rate such that net anodic current was significantly reduced. Visual inspection of the Mg anode during testing showed that the minimum value in net current density measured during this period of time occurred when the Mg surface became completely covered with an optically black corrosion product. It is noteworthy that the current polarity switches from net anodic to net cathodic current density at a potential of −1.625 VSCE after approximately 1000 seconds similar to that reported elsewhere.20 In contrast, the current time behaviors were relatively stable at applied potentials where the current density remained net cathodic at all times (Figure 1b).
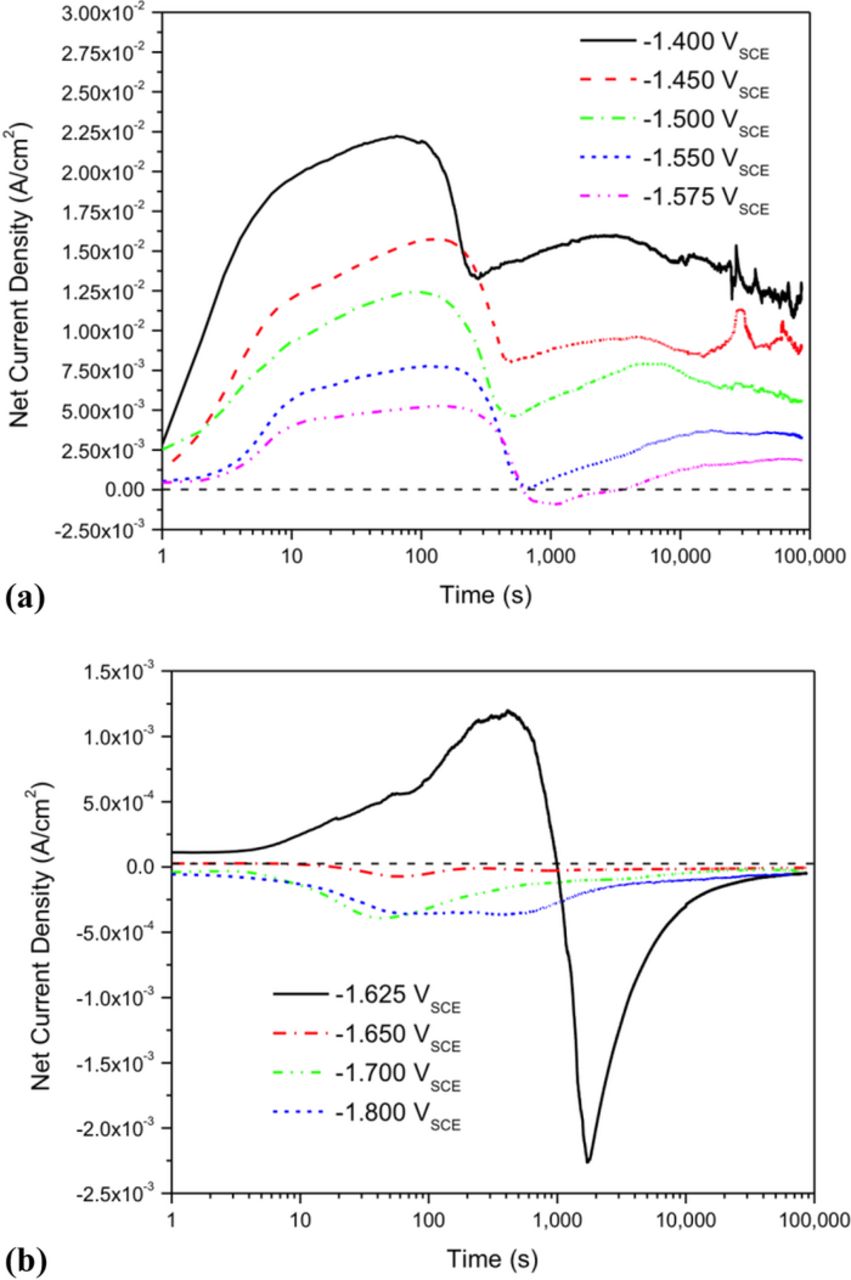
Figure 1. Potentiostatic polarization of 99.9% Pure Mg for 24 hours in 0.6 M NaCl. (a) Displays the net current densities vs. time for potentials which have accumulated a net anodic charge whilst (b) shows the net current densities vs. time for potentials which have accumulated a total net cathodic charge or undergo polarity reversal.
The net charge associated with hydrogen evolution plus the net charge measured by the potentiostat during anodic polarization are compared to mass loss as a function of potential in Figure 2a in accordance with Equation 1. This data is consistent with Mg2+ based dissolution where cathodic hydrogen evolution persisted on the corroding Mg surface at high anodic potentials. The volume of hydrogen captured was a maximum value at −1.4 VSCE and decreased at more negative applied potentials. Hydrogen evolution reached a minimum value of approximately 1.5 C/cm2 at the net cathodic potential −1.65 VSCE and subsequently increased at more cathodic potentials as shown in Figure 2b. Note that mass loss data was excluded in Figure 2b because negative values were measured and analysis of −1.625 VSCE is complex due to polarity reversal. It is also interesting to note that the minimum value of hydrogen captured was not measured at the OCP but rather at a potential roughly 50 mV cathodic than the OCP. Moreover, the accumulated charge density from evolved hydrogen at net cathodic potentials was much less than that expected based on the current measured by the potentiostat. It is interesting to note that the charge density ratio from HER to the charge density measured by the potentiostat, QH2:Qi net anodic, was near 2.5 at −1.575 VSCE and decreased with increasing applied anodic overpotentials to a value of 0.85 at −1.4 VSCE. A measure of the NDE at anodic potentials is observed in Figure 3 where the NDE is defined as  and is in agreement with the principles of the NDE. Note that the NDE is traditionally measured as a function of constant applied current.28,48
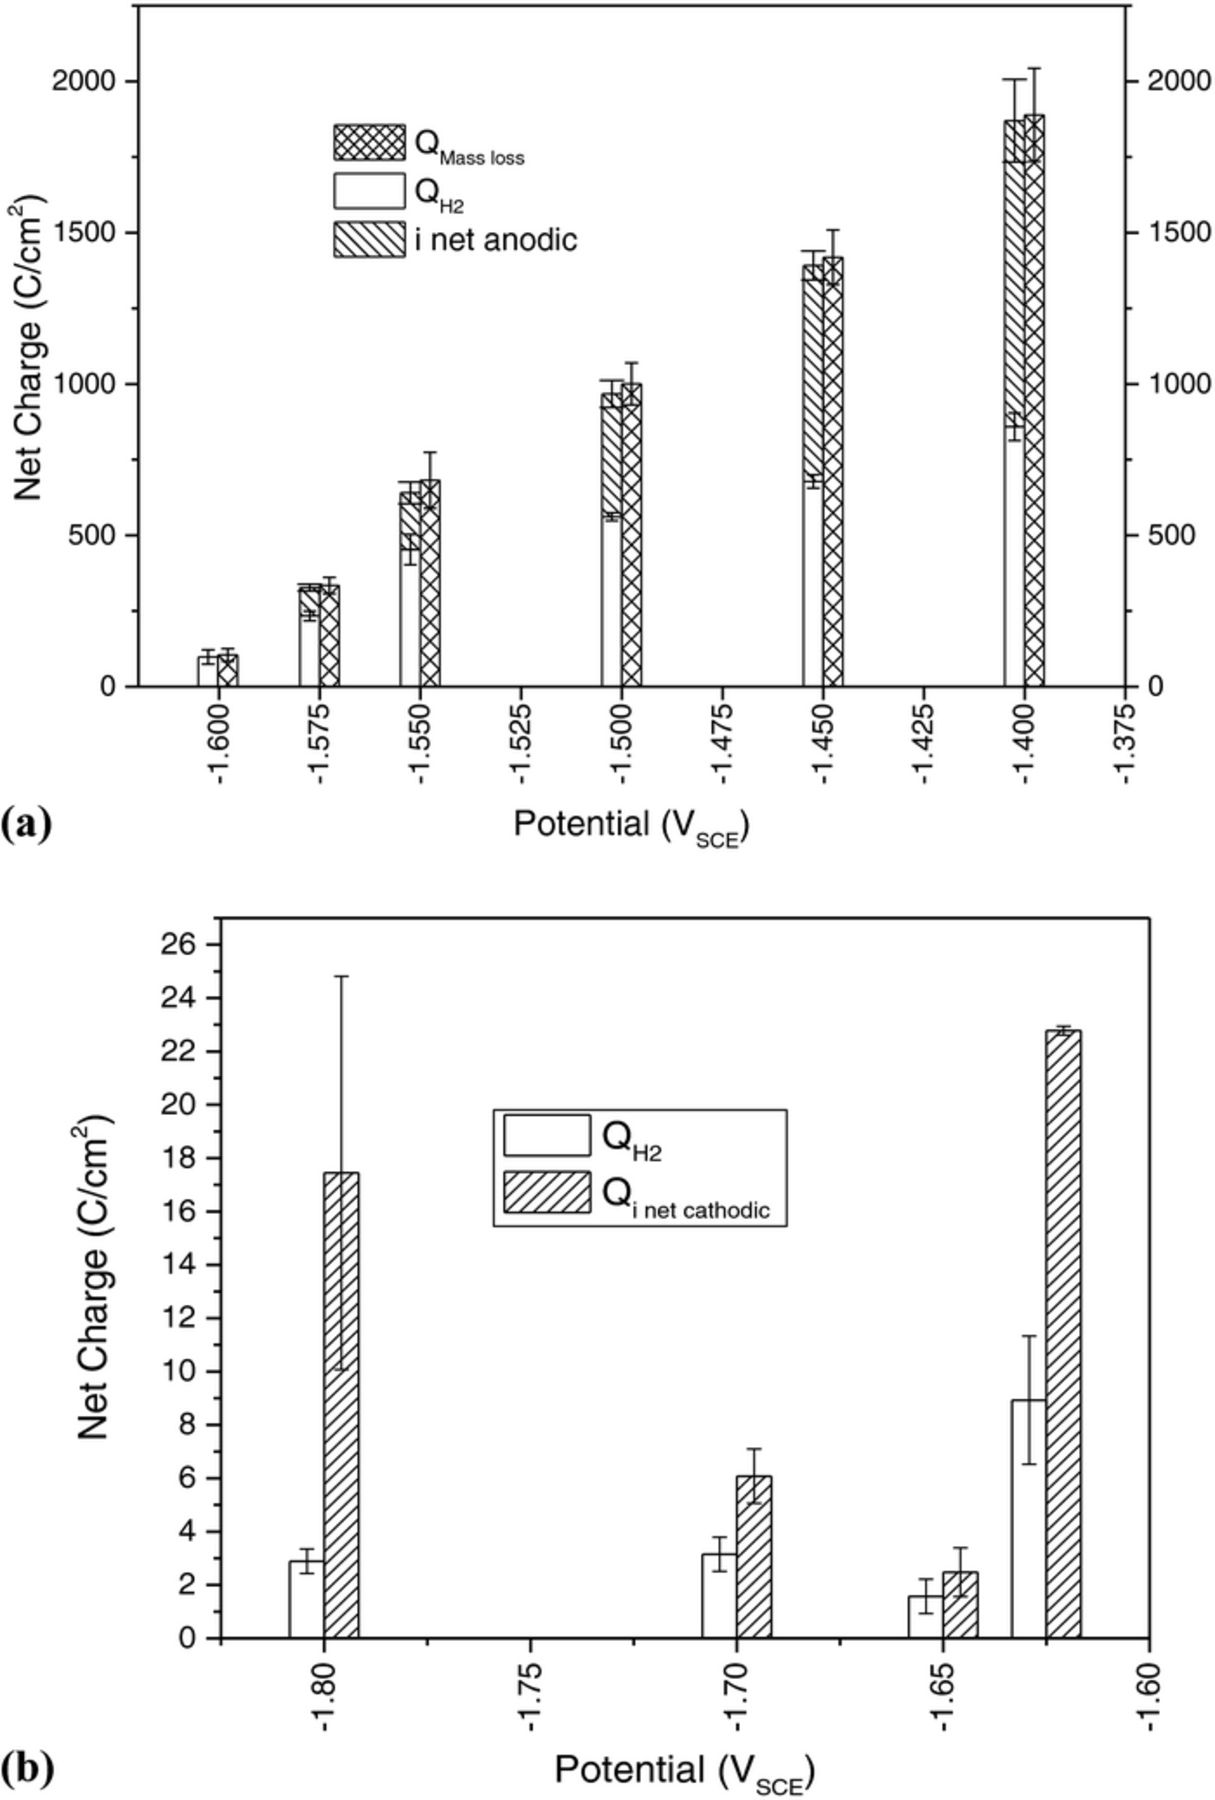
Figure 2. (a) The net charge associated with hydrogen evolution plus to the net charge measured by the potentiostat compared to mass loss as a function of potential. (b) The net charge associated with hydrogen evolution compared to the net charge measured by the potentiostat at cathodic potentials. Error bars are one standard deviation for a minimum of 3 tests.
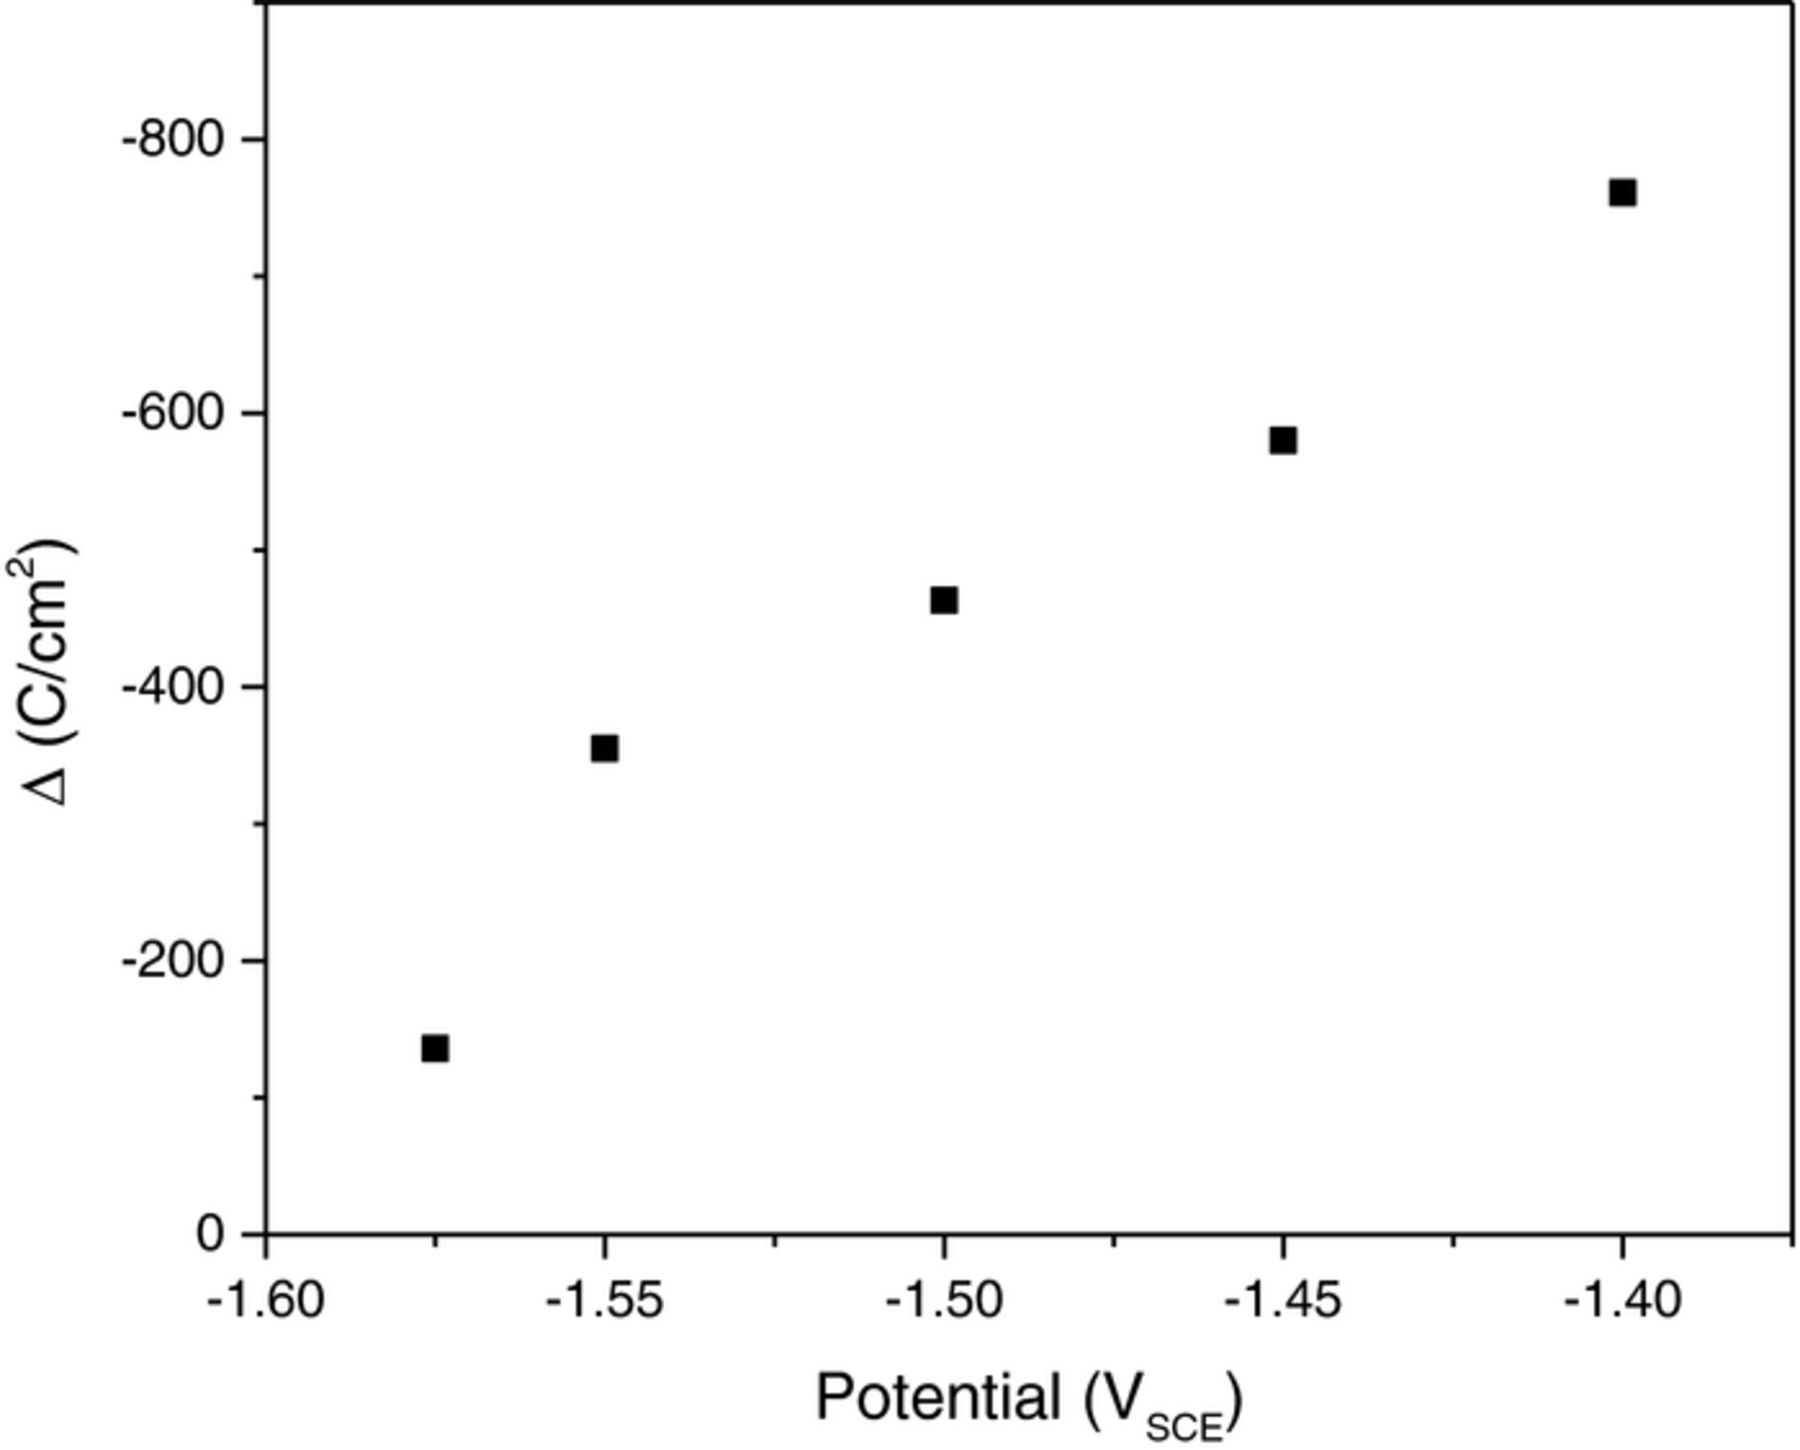
Figure 3. The negative difference effect Δ (Eq. 5) for 99.9% pure Mg in terms of the applied potential for all net anodic potentials tested in this study.
A simple indication of enhanced catalytic activity toward HER on Mg is given by Figure 4. Figure 4a shows cathodic potentiodynamic polarization scans which were performed immediately upon completion of each respective potentiostatic hold; potentiodynamic polarization after 10 min and 24 hr OCP are also shown. This plot indicates that prior polarization had a significant effect on the net cathodic current density realized. Prior anodic current density produced a considerably larger net cathodic current density over a wide range of potentials. Moreover, what is evident from Figure 4 is that allowing a specimen to undergo free corrosion under open circuit conditions also leads to an enhanced catalytic effect – such that longer exposure times at OCP can produce a similar qualitative effect. In addition, cathodic polarization scans which were performed on samples subjected to the potentiostatic hold, cleaned in CrO3, and tested in a film free condition yielded similar results. An example of this is given in Figure 4b.
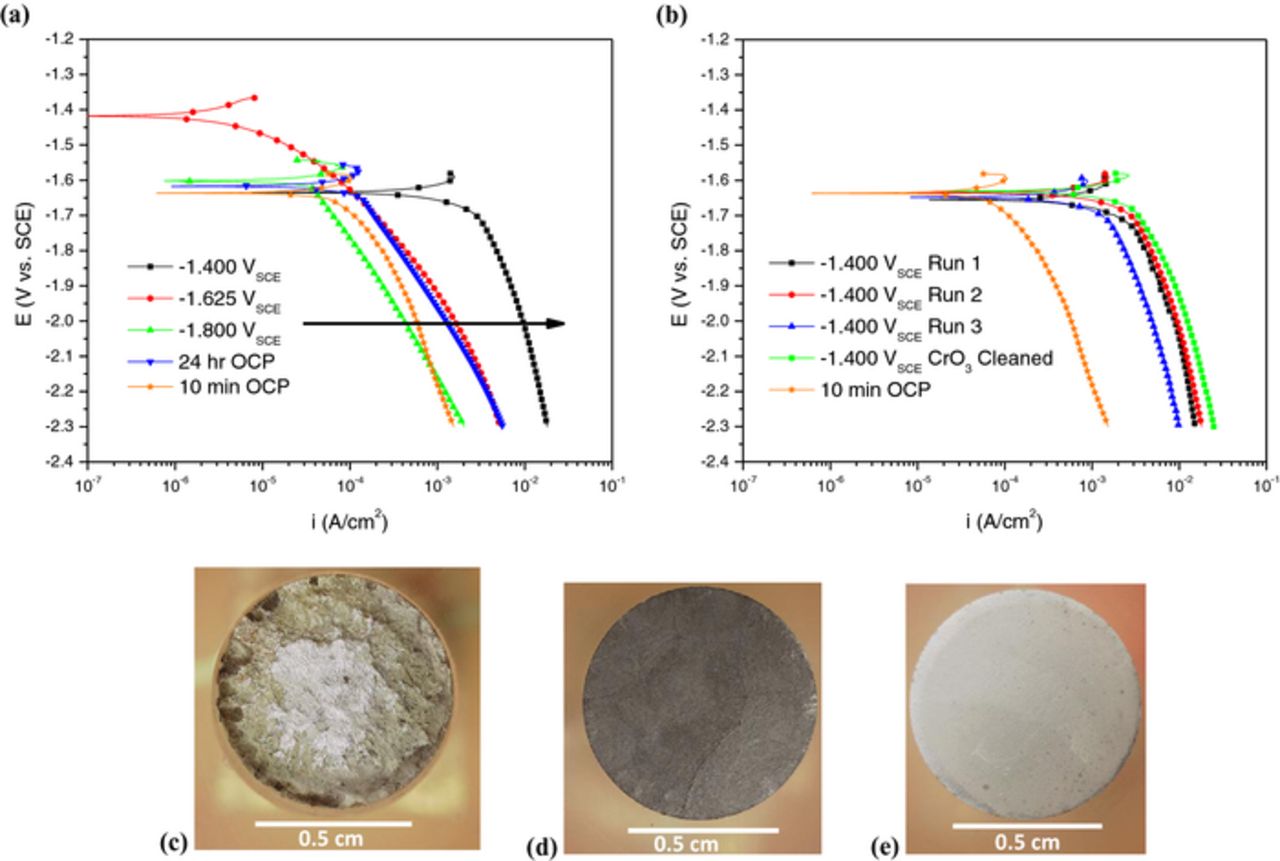
Figure 4. (a) Cathodic potentiodynamic polarization scans of 99.9% pure Mg in 0.6 M NaCl after 24 hour potentiostatic at the designated potentials. Samples were not cleaned prior to the cathodic scan. (b) Cathodic polarization scans comparing the uncleaned versus the CrO3 cleaned condition performed after prior anodic polarization at −1.4 VSCE for 24 hours. Optical micrographs of (c) −1.400 VSCE (d) −1.625 VSCE (e) −1.800 VSCE sample surfaces after CrO3 cleaning.
The combination of optical micrographs (Figure 4b–4d) and ICP-OES (Table IV) support enhanced cathodic activity on anodically polarized samples since the samples exposed at cathodic potentials exhibit very little damage and 1200 grit grind marks were still present. Indeed, very limited Mg cations were detected from ICP-OES at net cathodic potentials compared to mass loss during anodic polarization. It should be noted that Mg was the only element detected beyond a reasonable doubt by ICP-OES (Table IV) during anodic polarization. The measured intensities for all other elements were at or below the detection limit of the apparatus resulting in high error values. Therefore it is plausible that samples which have undergone anodic dissolution have surfaces enriched with more noble impurity elements, such as Fe. It should be noted that not all of the corrosion product could be recovered for solution analysis due to complications with chromic acid cleaning as further discussed in the Role of Fe enrichment section below.
Table IV. Average element concentration from the raw data intensities in solution after 24 hour potentiostatic polarization determined by ICP-OES. Solutions were acidified with 1 M HCl to dissolve insoluble corrosion products. Note that all concentrations of Al, Cu, Fe, Mn, Zn, and Zr are below the detection limits as defined in Table II.
| Element Concentration (ppm) | |||||||
|---|---|---|---|---|---|---|---|
| Potential (VSCE) | Mg | Al | Cu | Fe | Mn | Zn | Zr |
| −1.400 | 27.470 | −0.020 | −0.015 | −0.010 | −0.019 | −0.020 | 0.004 |
| −1.450 | 16.397 | −0.033 | −0.030 | −0.027 | −0.032 | −0.034 | −0.006 |
| −1.500 | 13.036 | −0.010 | −0.032 | −0.031 | −0.032 | −0.034 | −0.008 |
| −1.550 | 12.232 | −0.028 | −0.036 | −0.033 | −0.032 | −0.034 | −0.008 |
| −1.600 | 6.202 | −0.036 | −0.033 | −0.032 | −0.032 | −0.034 | −0.007 |
| −1.625 | 0.146 | 0.001 | 0.005 | −0.001 | −0.001 | −0.004 | 0.001 |
| −1.650 | 0.038 | −0.002 | −0.005 | −0.003 | −0.002 | −0.007 | 0.001 |
| −1.700 | 0.092 | 0.006 | −0.006 | −0.003 | −0.002 | −0.007 | 0.000 |
| −1.800 | 0.024 | 0.002 | −0.004 | −0.002 | −0.002 | −0.007 | 0.001 |
In order to compare the net cathodic current density at a fixed potential sufficiently displaced from Ecorr, the value of −1.9 VSCE was selected, and the results are compiled in Figure 5. The increased cathodic activity is readily apparent for all prior anodic potentials pre-treated where the net cathodic current density is approximately 40 times greater than that experienced at cathodic potentials. The statistics from replicate experiments indicate the phenomenon of cathodic activation is highly reproducible.
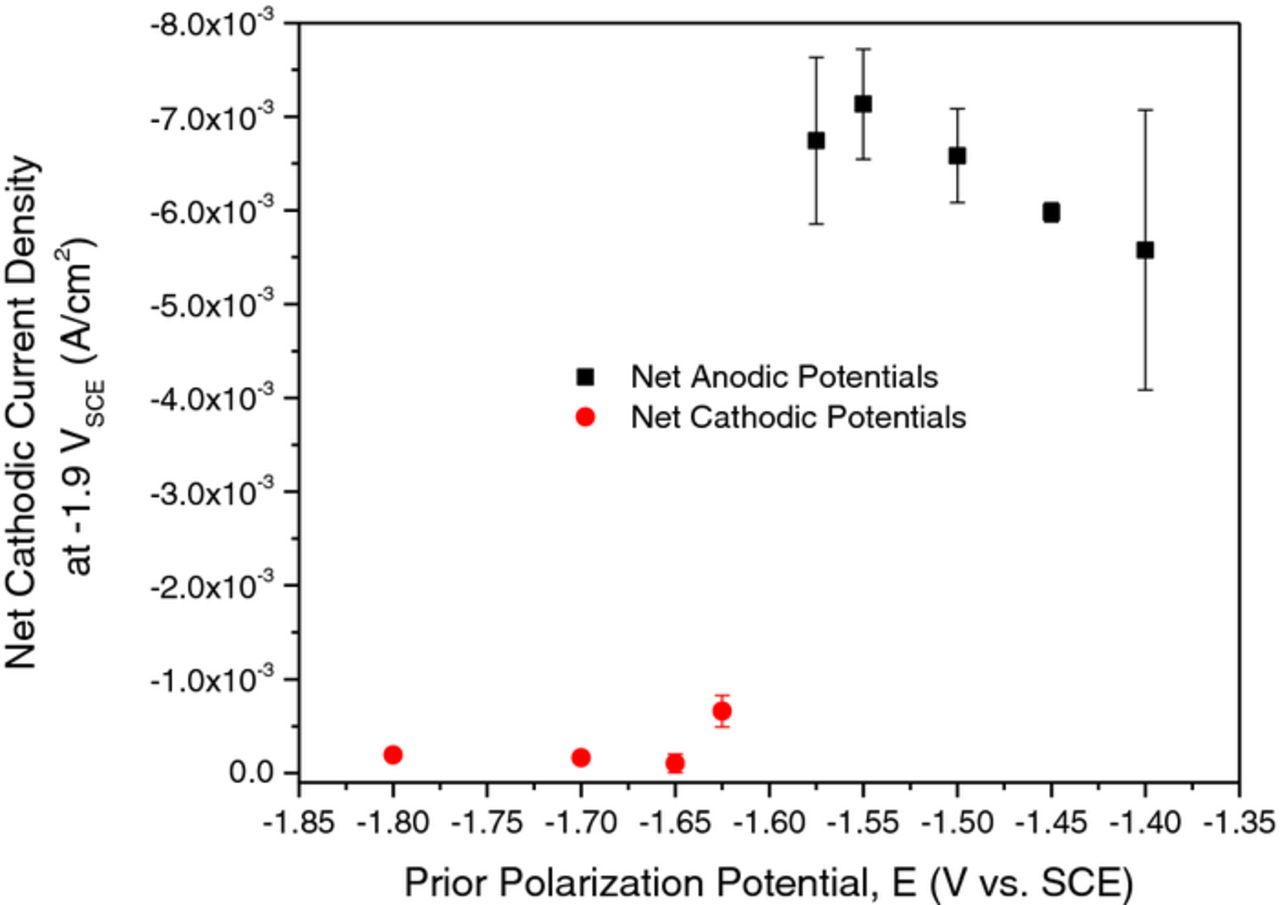
Figure 5. Average net cathodic current density at −1.9 VSCE on 99.9% pure Mg in 0.6 M NaCl after prior exposure for 24 hr at the indicated applied potentials. Net cathodic current density was determined from cathodic polarization scans.
Rutherford backscattering spectrometry
RBS analysis performed in this study is shown in Figures 6–8. Figure 6 displays RBS data for a ground specimen without chromic acid cleaning where the number of counts measured at a given energy level is shown in Figure 6a whilst Figure 6b shows the corresponding composition profile calculated from a simulation fit in the SIMNRA program. Note that the x-axis for all concentration vs. depth profiles have been expanded to focus on the Mg surface while utilizing a linear axis. This figure indicates that the freshly prepared surface (not exposed to electrolyte) consists predominantly of a Mg oxide/hydroxide covered surface with a trace levels of Si which we have ascribed to mechanical grinding with the Si incorporated in the oxide/hydroxide layer and at the film/metal interface; hydrogen is not included in the analysis as it is a forward scattered particle and will not appear in the backscattered spectrum. The broad low energy shoulder on the left of Figure 6a indicates bulk Mg with the low energy near surface oxygen peak superimposed. The oxygen peak indicates little energy loss from its theoretical level and thus indicating that the oxygen resides at the surface. Fitting of the oxygen peak utilized input data for the elastic scattering cross section measured at a scattering angle of 165°. This data was used because the SIMNRA program does not possess an elastic scattering cross section for a scattering angle of 160° which results in an overestimate of the oxygen peak intensity. The presence of elements in the zone just below the oxide is near the detection limit for all elements with an atomic mass ranging from Si (28.09 amu) to Fe (55.85 amu).
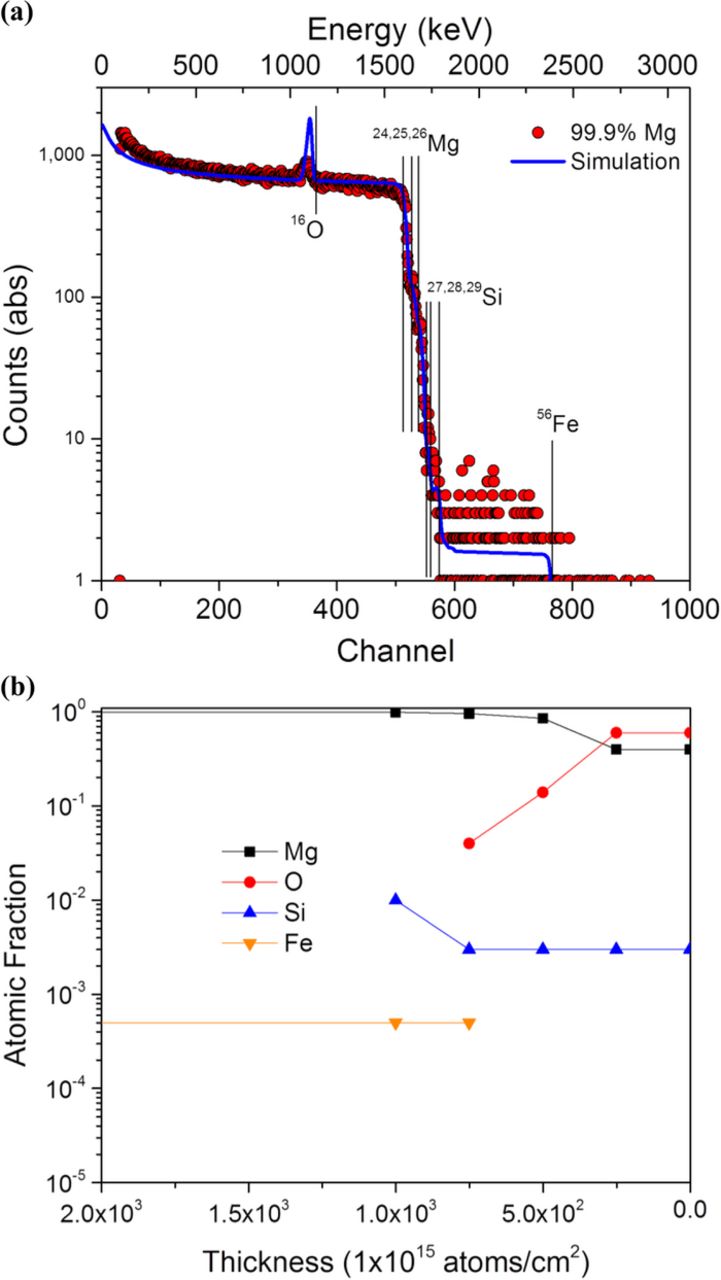
Figure 6. (a) RBS scan of high purity Mg ground to a 1200-grit finish in ethanol with (b) the corresponding concentration vs. depth profile as determined by the SIMNRA 6.06 computer code.
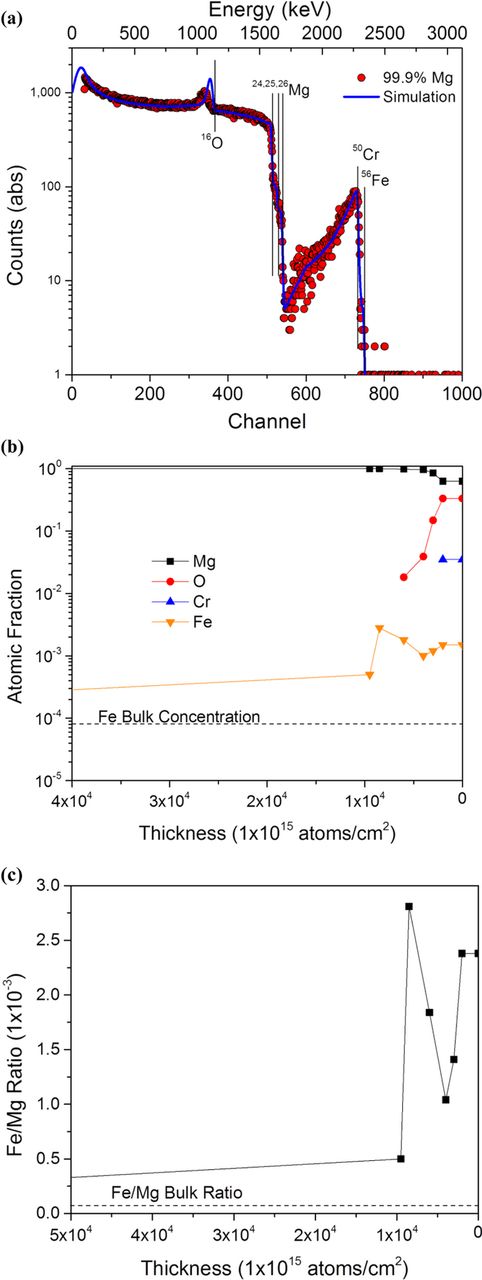
Figure 8. (a) RBS scan of high purity after 24 hour potentiostatic polarization at −1.625 VSCE with (b) the corresponding concentration vs. depth profile as determined by the SIMNRA 6.06 computer code. Corrosion products were cleaned off using CrO3 solution. (c) shows the Fe:Mg ratio as a function of depth in the sample.
The RBS data of a ground sample followed by chromic acid cleaning (Figure 7) indicates a sharp peak consistent with near surface Cr. It is noted from the raw RBS data in Figure 7a that the oxygen peak is negligible, indicating that chromic acid is indeed capable of corrosion product removal with minimal adverse effects such as additional oxidation and scale formation (as advocated in ASTM standard G-143). In addition, the composition of Fe (Figure 7b) remains constant on the surface.
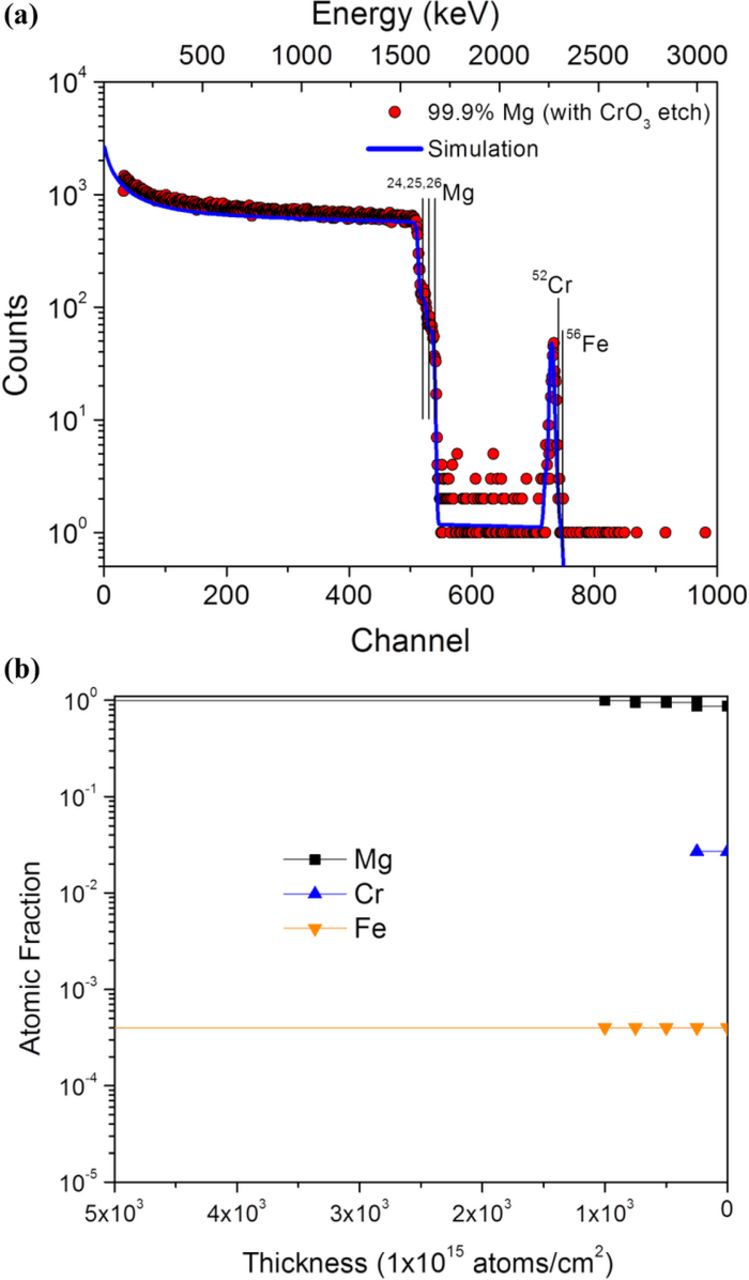
Figure 7. (a) RBS scan of high purity Mg ground to a 1200-grit finish in ethanol followed by CrO3 cleaning with (b) the corresponding concentration vs. depth profile as determined by the SIMNRA 6.06 computer code.
In order to detect possible enrichment of elements other than Mg upon the dissolving metal surface, RBS was performed on a specimen exposed for 24 hrs potentiostatic polarization at −1.625 VSCE in 0.6 M NaCl and cleaned using CrO3 solution (Figure 8). This specimen was chosen for analysis because accurate RBS requires a flat test surface with minimal roughness which was not available on the heavily corroded surfaces of anodically polarized samples. In addition, this sample showed enhanced hydrogen collection during anodic polarization (Figure 2b), enhanced HER at −1.9 VSCE (Figure 4a), and experienced polarity reversal during potentiostatic polarization (Figure 1b) which made it ideal for RBS analysis testing for possible surface enrichment by noble elements (Figure 4). Figure 8 indicates the presence of Cr as well as Fe and a near surface oxide/hydroxide as expected from Figures 6 and 7. However, the measured intensity of the broad Cr peak in Figure 8a decreased gradually over a broad range of energy in contrast to the sharp Cr peak observed in the non-corroded sample (Figure 7). This suggests that Cr is not wholly responsible for the gradual decrease in energy. The interaction energies of Cr and Fe are only separated by 49 keV, thus measured intensities for both elements will be superimposed. The decrease in energy observed is indicative of an enrichment of Fe in the residual oxide/hydroxide and on the metal surface decreasing as a function of depth into the sample. The simulation of this peak shows the composition of Fe on the surface is ca. 18.5x greater than that in the bulk metal (Figure 8b). Additionally, Figure 8c shows that the Fe:Mg ratio (i.e., CFe/CMg) at the lowest value on the surface is ca. 30x greater than in the bulk metal (2.38 × 10⁻³ versus 8.00 × 10⁻⁵).
Discussion
Enhanced catalytic activity toward the hydrogen evolution reaction
Several independent groups have published evidence supporting hydrogen evolution on a corroding Mg anode to be a cathodically activated process, as opposed to a chemical reaction in solution.15–22,32,49–51 However, this is the first study with concurrent hydrogen evolution, ICP-OES, electrochemical, and chemical detection (RBS) of element enrichment as a physically based description concerning the origins of the NDE. The data presented in this study are in agreement with these prior reports. During anodic potentiostatic polarization tests, a reduction of the net anodic current was measured after 100–1000 seconds resulting in essentially complete coverage of the corroding surface with a black corrosion product. The origin for the color of this black corrosion product has not been fully described in the literature although some attempts have been made. For instance, Davidge reported dark brown and black samples of single crystal MgO doped with Fe at several different heat treatments.52 Reports by Williams16–19 using SVET have revealed activation of cathodic regions behind the advancing anodic front at both OCP and while under potentiostatic polarization. It was also shown that the cathodic current density increased over time proportionally to the surface coverage of corrosion products. This, therefore, would account for the decrease in net anodic current density observed in the 100–1000 second time window during anodic potentiostatic scans. Once the entire surface is covered with corrosion product, localized corrosion currents can no longer be resolved with SVET and a more general form of corrosion begins. As such, the measured anodic current density increased before decreasing again due to alkalinization of the bulk NaCl solution to pH values in the stable region for Mg(OH)2. A thick corrosion film is allowed to form which covers cathodes with implications of its own regarding the cathodic reaction rate. However, it should be noted that an anodically activated and cleaned sample has an equal or greater cathodic reaction rate than ones covered in Mg(OH)2 (Figure 4b). Since Mg corrosion is under cathodic control, the anodic dissolution rate and net anodic current would be expected to decrease when the corrosion film covers the surface. Mg(OH)2 is not a suitable passive layer due to its porous nature which leads to crack formation and spalling of the hydroxide revealing fresh areas of Mg metal to be oxidized,16,53 whilst the Mg(OH)2 may even allow electron transfer itself. The noise at the end of the −1.4 VSCE and −1.45 VSCE scans observed in Figure 1a can be interpreted as a result of crack formation and spalling of the oxide/hydroxide corrosion film. Breakdowns in the Mg(OH)2 film would be expected to cause an increase in the anodic current density after which the anodic current density will decrease by some combination of enhanced catalytic activity and reformation of the oxide/hydroxide, the latter aspect contributing to the development of hydrogen as a by-product of the re-filming process.
The most interesting case of enhanced catalytic activity is inherent in the sample previously held at −1.625 VSCE, which indicates a polarity reversal from net anodic to net cathodic current. Despite having a more positive potential than the other net cathodic potentials studied, a greater net cathodic charge density as well as volume of hydrogen captured was measured as shown in Figure 2. This is not surprising given an assumed increase in the HER exchange current density after undergoing anodic dissolution supported by RBS detection of Fe. Unfortunately, the hydrogen captured was not measured as a function of time so it is difficult to ascertain how much of the hydrogen was captured during the period of anodic polarization versus cathodic polarization. Nevertheless, larger quantities of hydrogen would be expected based on the measured net cathodic current.
Role of Fe enrichment
Early studies by Hanawalt12 established the effects of impurity concentration on the corrosion rate of pure Mg. In doing so, they discovered a tolerance limit at which point the corrosion rate increased multiple orders of magnitude. For Fe, this tolerance level was found to be about 170 ppmw (μg/g) or an atomic Fe:Mg ratio of 7.4 × 10⁻⁵. The Fe:Mg ratio on the Mg surface after anodic polarization at −1.625 VSCE was found herein to be between 1.04 × 10⁻³ and 2.81 × 10⁻³. As the exchange current density for hydrogen evolution on Fe, Ni and Cr occurs at a much higher rate than on Mg,54,55 an enrichment of more than an order of magnitude should produce a large effect on cathodic E-log(i) kinetics dominated by hydrogen even though surfaces have predominantly Mg composition.
The degree of enhanced cathodic activity on a corroding Mg anode is clearly shown in Figures 4 and 5. It is apparent from the data in Figure 5 that there is a limit to the possible enhanced catalytic activity. Taub et al.56 reported increases in the HER kinetics with increasing elemental additions of Fe to Mg but observed no further increases in cathodic reaction rate beyond about 7–8 at% Fe in 2 M NaCl solution. It is reasonable to assume that the concentration of Fe enrichment on the Mg surface reaches a maximum value after undergoing extensive corrosion damage. Reasons for this are speculative but could involve reduced catalytic capability when incorporated in poorly conductive MgO or Mg(OH)2 films or Fe-rich particles detached from the surface, and simply, poor enrichment efficiency. The present work indicates that the efficiency of Fe enrichment would in fact be very low, which is perhaps why lower resolution forms of spectroscopy to measure Fe enrichment have not been successful. We indicate an enrichment herein of about an order of magnitude, which is appreciable in the context of Mg corrosion, however the total Fe content remains well below 1 at.%. The degree of enhanced cathodic activity toward the HER also reaches a maximum value. It was observed in Figure 2a that the relative contribution of HER to the right hand side of Equation 1 decreased with increasing anodic overpotential. This observation was also reported by Frankel et al.15 as well as Bender et al.57 and confirms the notion of a decrease in the contribution of enhanced catalytic activity at increasing anodic overpotential.
The Fe enrichment observed in RBS only accounts for Fe on the surface of the alloy but does not account for possible Fe-rich particles embedded in the thick oxide/hydroxide since most of this layer was removed CrO3 cleaning. Moreover, RBS cannot detect whether the enrichment of Fe is by accumulation of Fe-rich particles on the alloy surface or by elemental enrichment in the α-Mg matrix. The limited solubility of Fe in Mg would point toward the accumulation of Fe-rich particles.3 One would expect Fe-rich particles to be present in the oxide/hydroxide layer based on the TEM studies performed by Taheri et al.32 Any Fe embedded in the corrosion layer would therefore be expected to be detected by ICP-OES measurements only if dissolved. Unfortunately not all of the product remaining on the Mg surface after corrosion could be dissolved with chromic acid and hence made available for ICP-OES. The only corrosion product analyzed was that which was present in solution and could be mechanically removed from the corroded Mg surface after testing. The remaining corrosion product from the sample was collected after CrO3 acid cleaning and tested with ICP-OES. However, the presence of high Cr concentrations with respect to Fe caused interferences with the measured Fe intensities resulting in non-usable data. It is likely that there are some Fe cations in solution as a result of dissolved particles in the corrosion layer. However, the levels were at or below the detection limit.
Fe dissolution from the Mg surface is not expected to occur during the potentiostatic tests as the potentials tested in this study are more than 1 V more negative than the reversible potential of the Fe/Fe2+ reaction.45 Moreover, Swiatowska et al.22 did not observe quantities of Fe in solution using an in-situ atomic emission spectroelectrochemical (AESEC) method at various anodic pulses varying between −1.433 VSCE and −0.333 VSCE in a 0.01 M NaCl electrolyte which supports this claim. If Fe and other impurity elements are not dissolving into solution then they must be enriching on the Mg surface, and this has been demonstrated in this study.
The results presented do not explain recent results for Mg-Ca and Mg-Li alloys since these elements presumably can dissolve preferentially to Mg yet the NDE is still observed.51 However, Fe enrichment in these alloys is still possible and may participate in manifestation of the NDE. Further investigation would be required. The efficiency of enrichment and the role of other alloying elements such as Ca additions are areas of important future work, and whether the enrichment alone is sufficient to account for the whole of the NDE phenomenon by the enhanced catalytic effect mechanism, will also be an important future clarification. The work herein has also contributed to the notion that the dissolution of Mg is predictable on the basis of Mg dissolving as Mg2+.
Conclusions
- (1)Analysis of potentiostatic data after 24 hours suggested the NDE was operative in the commercial purity Mg studied, with Mg dissolving as Mg2+.
- (2)Anodic potentiostatic polarization of a 99.9% pure Mg anode revealed a decrease in the net anodic current between 100–1000 seconds consistent with enhanced catalytic activity of the oxidized surface subsequently verified by cathodic polarization. Potentiostatic polarization at −1.625 VSCE resulted in polarity reversal from net anodic to a stable net cathodic current over a 24 hour test period consistent with anodically induced enrichment of noble elements of the surface of a dissolving Mg anode.
- (3)Cathodic potentiodynamic polarization scans following 24 hour potentiostatic holds were able to reveal a dramatic increase in cathodic kinetics upon samples which have undergone increased anodic corrosion.
- (4)The electrochemical analyses herein agree with enrichment of noble elements on a corroding Mg surface. Applied for the first time, RBS of dissolved Mg surfaces revealed direct evidence of Fe enrichment in the residual oxide/hydroxide and on the metal surface of a Mg anode. Solution analysis by ICP-OES showed that the concentration levels of Fe and other impurity elements in solution after potentiostatic polarization were less than their corresponding concentrations in bulk Mg. This affirms the enrichment of noble impurities on a corroded Mg surface by mass balance considerations.
- (5)The suitability of RBS as a means of quantifying the surface composition of Mg in high resolution has been shown to be of key utility.
Acknowledgments
We gratefully acknowledge the US Air Force Academy under agreement number FA7000-13-2-0020 as part of Corrosion University Pilot Program under the direction of Daniel Dunmire and by the National Science Foundation under NSF DMR#1309999 as well as the Army Research Office under agreement number W911NF-14-2-0005. The U.S. Government is authorized to reproduce and distribute reprints for government purposes notwithstanding any copyright notation thereon. The views and conclusions contained are those of the authors and should not be interpreted as necessarily representing the official policies or endorsement of the US Air Force Academy or the US Government. We would also like to acknowledge the Australian Research Council Centre of Excellence for Design in Light Metals (NB).