
Abstract
Manganese oxide (MnOx) and cobalt-iron (Co-Fe) were sequentially electrodeposited onto a gas diffusion layer (GDL) as bifunctional electrocatalysts for rechargeable zinc-air batteries. The fabricated material was characterized by scanning electron microscopy (SEM), transmission electron microscopy (TEM), X-ray diffraction (XRD) and X-ray photoelectron spectroscopy (XPS). The sequentially deposited MnOx/Co-Fe catalysts, tested using cyclic voltammetry (CV), showed activity for both the oxygen reduction and oxygen evolution reactions (ORR and OER), with better performance than either MnOx or Co-Fe alone. The fabricated material was assembled into a zinc-air battery as the air electrode component for battery cycling tests. The zinc-air battery using MnOx/Co-Fe catalysts exhibited good discharge-recharge performance and a cycling efficiency of 59.6% at 5 mA cm−2, which is comparable to Pt/C catalysts. In addition, the electrodeposited MnOx/Co-Fe layer showed strong adhesion to the gas diffusion layer (GDL) and was structurally stable throughout 40 h of battery cycling.
Export citation and abstract BibTeX RIS

This is an open access article distributed under the terms of the Creative Commons Attribution Non-Commercial No Derivatives 4.0 License (CC BY-NC-ND, http://creativecommons.org/licenses/by-nc-nd/4.0/), which permits non-commercial reuse, distribution, and reproduction in any medium, provided the original work is not changed in any way and is properly cited. For permission for commercial reuse, please email: oa@electrochem.org.
Electrochemically rechargeable zinc-air batteries are one of the best candidates to store large amounts of electrical energy.1,2 However, due to the sluggish oxygen reduction reaction (ORR) and oxygen evolution reaction (OER) at the air electrode, the efficiency of zinc-air batteries is comparatively low, leading to energy losses.3 Also, catalyst stability is a problem, because the catalyst can detach from the current collector or pulverize during battery cycling.4 Currently, some precious metals such as Pt, Ru and Ir are recognized as the most active ORR or OER electrocatalysts.5,6 However, their application in zinc-air batteries is limited by their high cost and low abundance. Also, Pt is vulnerable during battery cycling, because it can oxidize or agglomerate.7 Hence, the fabrication of cheap and stable bifunctional electrocatalysts/electrodes that are active for both ORR and OER is of great importance to the application of zinc-air batteries.
Extensive efforts have been devoted to the development of transition-metal (Mn, Co, Ni and Fe) based ORR and OER electrocatalysts, since they are abundant and stable in alkaline solutions.8 Manganese oxides are active toward ORR and are used in commercial primary zinc-air batteries.9–13 However, their ORR activity is limited by the low electrical conductivity of the oxides, which can be improved by adding carbon blacks or hybridizing with conductive agents like carbon nanotubes or graphenes.14–16 In addition, manganese oxides do not have appreciable OER activity and should be combined with another OER electrocatalyst. Co and Fe-based materials have been shown to be excellent OER catalysts and are stable in alkaline solutions.17–19 The proper combination of the ORR and OER electrocatalysts is critical to electrochemical performance. This can be achieved by using a single layer of bifunctional catalysts or by using multiple catalytic layers.20 The catalysts for a single layer structure are usually synthesized as powders and mixed with binders (e.g., Nafion and PTFE) and conductive agents (e.g., carbon black) to coat onto the gas diffusion layer (GDL) substrate.21,22 Alternatively, catalysts can be directly electrodeposited onto the GDL substrate, without using any binders and conductive agents. However, anodic electrodeposition of binary or ternary metal (oxides) is difficult due to the gap in redox potentials. For anodic deposition of Mn, Co and Fe oxides, starting from their metal sulfates, the redox potential increases in the order (assuming the electrolyte for electrodeposition has a pH of 5):23–25 Fe2+/Fe2O3 (0.25 V vs. SHE) < Mn2+/MnO2 (0.80 V vs. SHE) < Co2+/Co(OH)3 (1.35 V vs. SHE). Therefore, the generation of mixed oxides is difficult because Fe oxide would deposit first.26 Cathodic electrodeposition of binary or ternary metal alloys containing both Mn and Co/Fe is impossible for the same reason, since the redox potentials increase in the following order: Mn/Mn2+ (−1.19 V vs. SHE) < Fe/Fe2+ (−0.60 V vs. SHE) < Co/Co2+ (−0.35 V vs. SHE). Thermodynamically favored Co/Fe deposition will lead to a strong hydrogen evolution reaction (HER) on the substrate, making it impossible to produce Mn metal.27
One solution to this problem is the use of multiple layers. For example, an air electrode consisting of two parts was reported to present superior performance in a zinc-air battery.28 ORR and OER catalyzing layers were fabricated independently, i.e., α-MnO2 loaded on carbon paper and Fe0.1Ni0.9Co2O4 coated onto Ti mesh. These were then pressed together to form a bifunctional electrode. For electrodeposition, several layers of catalysts can be fabricated by simply dipping the substrate into different electrolytes. The layer thickness, as well as the morphology and composition, can be tuned by adjusting the deposition conditions.
In this study, an ORR active MnOx film and an OER active Co-Fe layer are sequentially electrodeposited onto GDL substrates to produce bifunctional electrocatalysts for rechargeable zinc-air batteries (Figure 1). In this double-layered electrode, the first layer of ORR active MnOx is combined with the porous GDL, allowing access to the air supply to favor ORR, while the second layer of OER active Co-Fe is deposited by immersion into a second electrolyte. The Co-Fe layer is composed of nanoparticles, which not only provide OER active sites but also decrease the charge transfer resistance of the electrode. The nanoscale amalgamation of the two materials is able to generate an efficient bi-functional catalyst that is better than either layer alone. The whole fabrication process only includes two electrodeposition steps, which is cost effective, scalable and easy to control.
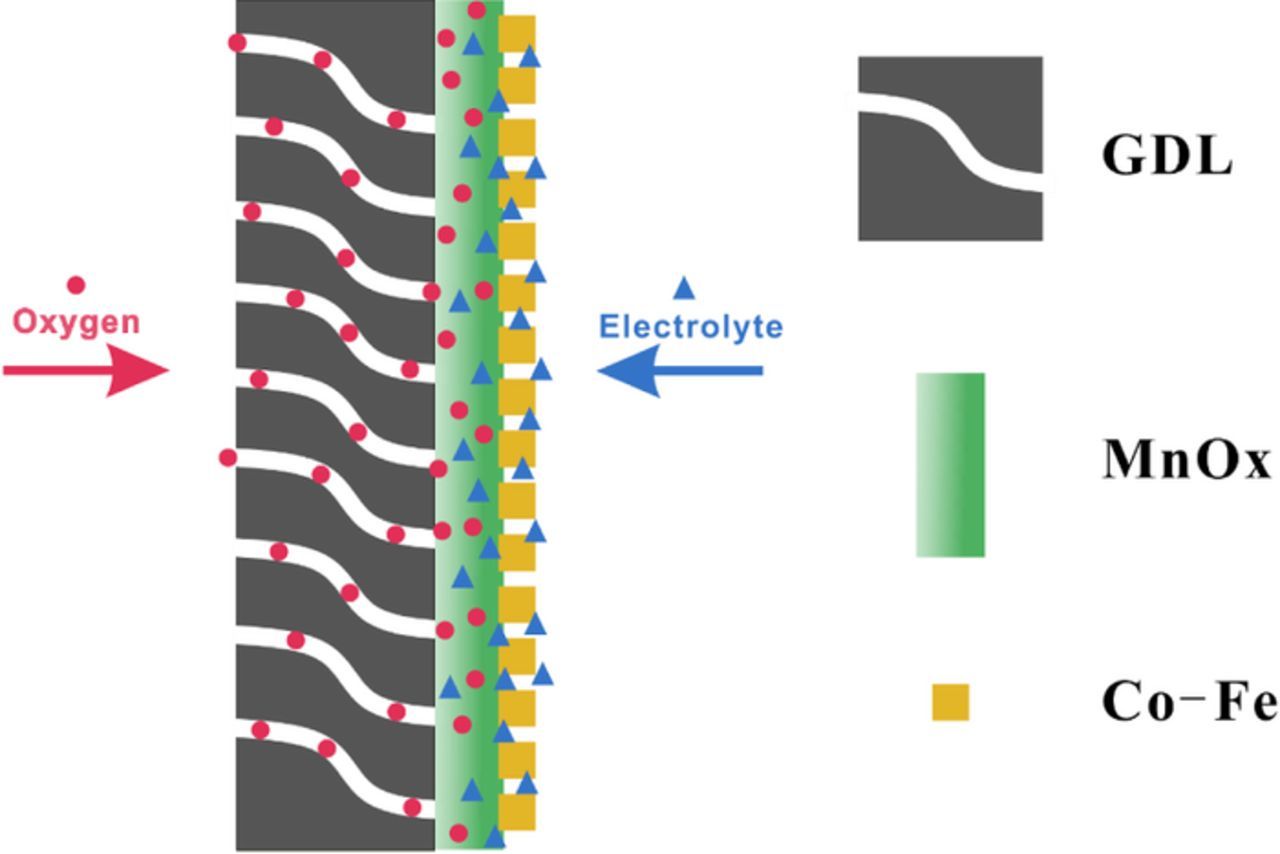
Figure 1. Schematic illustration of the structure of bifunctional catalysts on GDL (cross-section view).
Experimental
Electrodeposition of MnOX, Co-Fe and MnOX/Co-Fe on GDL
All reagents were certified ACS grade without further purification. GDL (Teflon-coated porous carbon paper, SGL 35DC, 5 cm2 pieces) was used as the substrate for electrodeposition at room temperature (25°C). Electrodeposition was performed in a two-electrode configuration, where the GDL and Pt mesh were used as the working electrode and the counter electrode, respectively. Sodium dodecyl sulfate (surfactant), L-ascorbic acid (antioxidant) and boric acid (buffering agent) were added to the baths to enhance the uniformity of the coating and its adhesion to the substrate. MnOX was anodically electrodeposited onto GDL at a constant current of 40 mA for 10 min in an electrolyte containing MnSO4 (0.1 M), sodium acetate (0.1 M) and sodium dodecyl sulfate (100 mg L−1). Co-Fe was cathodically electrodeposited on GDL at a constant current of 200 mA for 2 min. The solution for Co-Fe deposition included CoSO4 (0.15 M), FeSO4 (0.05 M), sodium citrate (0.2 M), boric acid (0.2 M), L-ascorbic acid (0.05 M) and sodium dodecyl sulfate (400 mg L−1). For sequentially deposited MnOx/Co-Fe, a layer of MnOx was anodically deposited first, followed by a layer of cathodically deposited Co-Fe. After electrodeposition, the GDL was rinsed several times with de-ionized water and dried in air. The mass loading of catalysts on GDL was measured by a microbalance before and after electrodeposition. Mass loadings were 1, 0.6 and 1.2 mg cm−2 for MnOx, Co-Fe and MnOx/Co-Fe, respectively.
Materials characterization
The microstructure and composition of the samples were characterized by scanning electron microscopy (Tescan VEGA3 and Zeiss Sigma SEMs operated at 10–20 kV) and transmission electron microscopy (JEOL 2010 TEM operated at 200 kV), along with energy dispersive X-ray (EDX) spectroscopy. TEM samples were prepared by scraping some of the as-deposited material from the GDL and dispersing it in ethanol. One or two drops of the suspension were then placed onto a carbon grid and the ethanol was allowed to evaporate. The crystalline state was examined by X-ray diffraction (XRD) (Rigaku Ultima IV) using Co Kα radiation (λ = 1.789 Å). X-ray photoelectron spectroscopy (XPS) using an Al X-ray source (Kratos AXIS 165) was conducted to determine the oxidation state of the different species. All XPS spectra were corrected using the C 1 s line at 284.8 eV. Casa XPS software (Version 2.3.17 PR1.1) was used for curve fitting and background subtraction.
Electrochemical measurements
Electrochemical tests were carried out in 6 M KOH at room temperature using a potentiostat (Biologic SP-300) with a three-electrode configuration. The catalyst-coated GDL, Hg/HgO and Pt mesh were used as the working electrode, reference electrode and counter electrode, respectively. All potentials are relative to Hg/HgO unless otherwise indicated. Cyclic voltammetry (CV) measurements were scanned from −0.25 V to 0.7 V at 10 mV s−1. The electrolyte was agitated with a stir bar below the working electrode and the electrolyte was purged with pure O2 gas or Ar gas. The current densities were normalized to the geometric surface area. For comparison, a Pt/C catalyst ink was sprayed onto separate GDL substrates. The ink consisted of 50 mg of Pt/C powder (40% Pt, Alfa Aesar) dispersed in 2.0 mL of de-ionized water, 1.0 mL of isopropanol, 0.1 mL of 5 wt% Nafion (D-521) and 0.2 mL of 10 wt% PTFE binder (DISP30). The mass loading of Pt/C ink on the GDL was about 0.6 mg cm−2 after drying in a furnace.
Cell testing
Zinc-air battery testing was done in a home-made cell with the same conditions reported in our previous work.29 Briefly, Zn foil and the catalyst loaded GDL were used as the anode and the air electrode, respectively. A microporous membrane (Celgard 5550) was used as the separator. The battery discharge and charge voltages were measured by a galvanostatic method for 10 min at different current densities of 1, 2, 5 and 10 mA cm−2. Discharge-charge cycling was done using a current density of 5 mA cm−2 for each cycle. The back side of the GDL was purged with pure oxygen at 20 mL min−1 and the catalytic active side (5 cm2) was in contact with the electrolyte. The discharge-charge efficiency was calculated by dividing the average discharge potential by the average charge potential. Electrochemical impedance spectroscopy (EIS) was performed at 1.1 V vs. Zn/Zn2+ with 20 mV AC potential from 1 MHz to 0.1 Hz.
Results and Discussion
Characterization of the catalysts
SEM secondary electron (SE) images of the catalyst layers on GDL are shown in Figure 2. The MnOX film deposited on GDL has an irregular surface (Figures 2a and 2b). FESEM imaging revealed a porous structure (inset in Figure 2b). The pores within the film may have been generated by the removal of water within the deposit during drying, since the MnOx deposit is significantly hydrated after electrodeposition.30 The porous structure can provide a large surface area for the electrochemical reaction and facilitate the diffusion of oxygen into the ORR reaction zone.
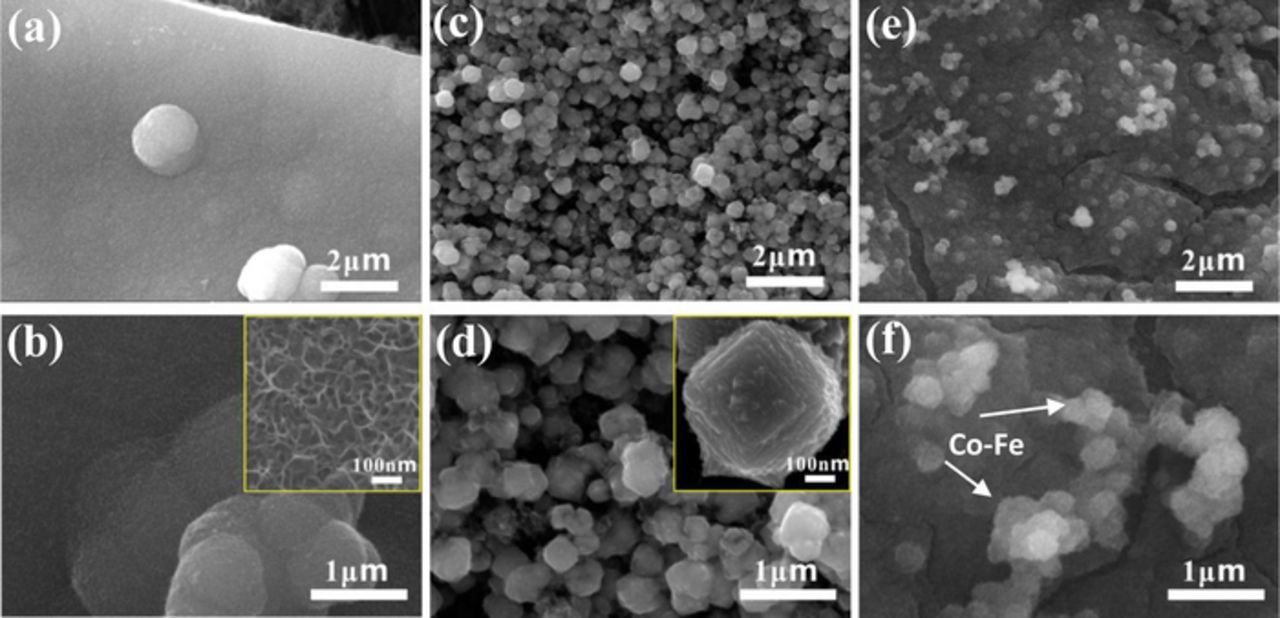
Figure 2. SEM SE images of (a, b) MnOX on GDL, (c, d) Co-Fe on GDL and (e, f) MnOX/Co-Fe on GDL.
Co-Fe, as a separate layer on the GDL, was deposited as individual particles with diameters of several hundred nanometers or less (Figures 2c and 2d). The inset image (Figure 2d) shows that individual Co-Fe particles have a terraced surface, which can provide numerous surface defects for the OER reaction.31
Sequentially deposited MnOX/Co-Fe consists of a MnOX layer covered with Co-Fe particles (Figures 2e and 2f). In order to confirm the presence of Co-Fe particles on the MnOX film, EDX mapping was done on the MnOx/Co-Fe sample (Figure 3) and showed that MnOX is uniformly coated on GDL. Co and Fe are distributed across the MnOx surface, but are concentrated at the Co-Fe particle locations. Therefore, a MnOX film coupled with Co-Fe nanoparticles was successfully synthesized through sequential electrodeposition. The KOH electrolyte still has access to the MnOx for ORR.
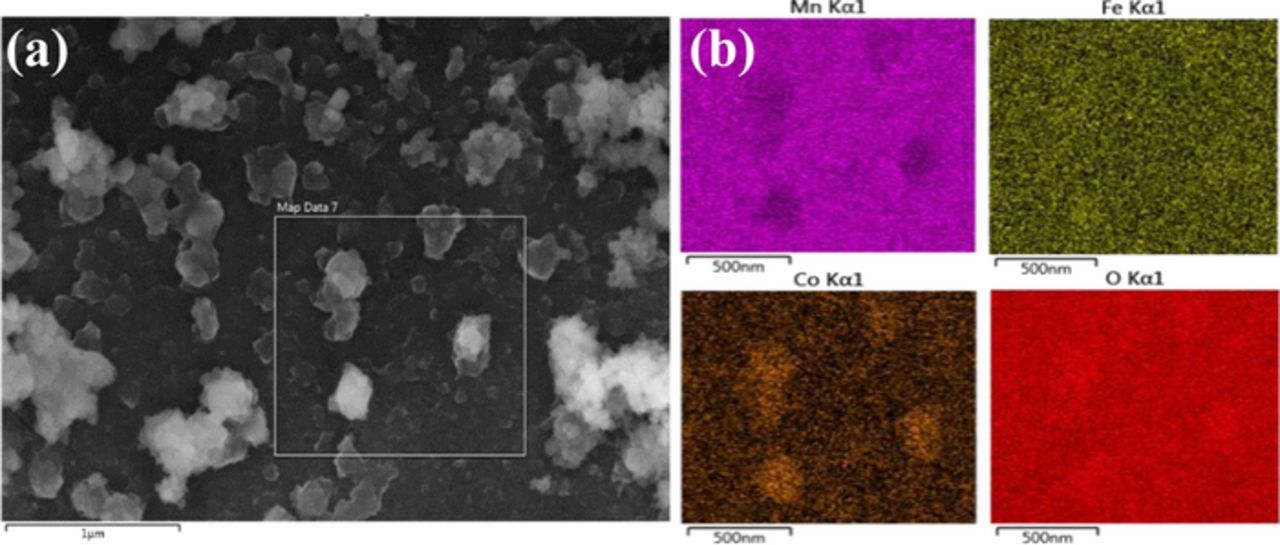
Figure 3. (a) MnOX/Co-Fe sequential deposit on GDL. (b) EDX elemental mapping images for Mn, Fe, Co and O obtained from the indicated region in (a).
The crystal structures of the separate MnOx and Co-Fe deposits were studied using XRD (Figure 4). The diffraction peaks at 21.0° and 30.82° are from the PTFE (PDF File No. 54–1595) and graphite (PDF File No. 89–8487) in the GDL substrate, respectively. For the Co-Fe deposit on GDL, the peak at 52.80° corresponds to the (110) plane of the bcc Co-Fe solid solution. The deposit composition can be estimated from the Vegard equation, i.e., ∼36 at% Fe in Co-Fe or Co0.64Fe0.36. There is only a weak, broad peak at 43.05° to 43.37° corresponding to MnOx, indicating its amorphous or nanocrystalline structure. There are several Mn dioxides with a major peak at or near the same angle (e.g., PDF File No. 53–0633, tetragonal Hollandite), so MnOx may be one form of α-MnO2.32 XPS data, presented later in this paper, confirms that a significant portion of MnOx consists of Mn with a valence of 4+.
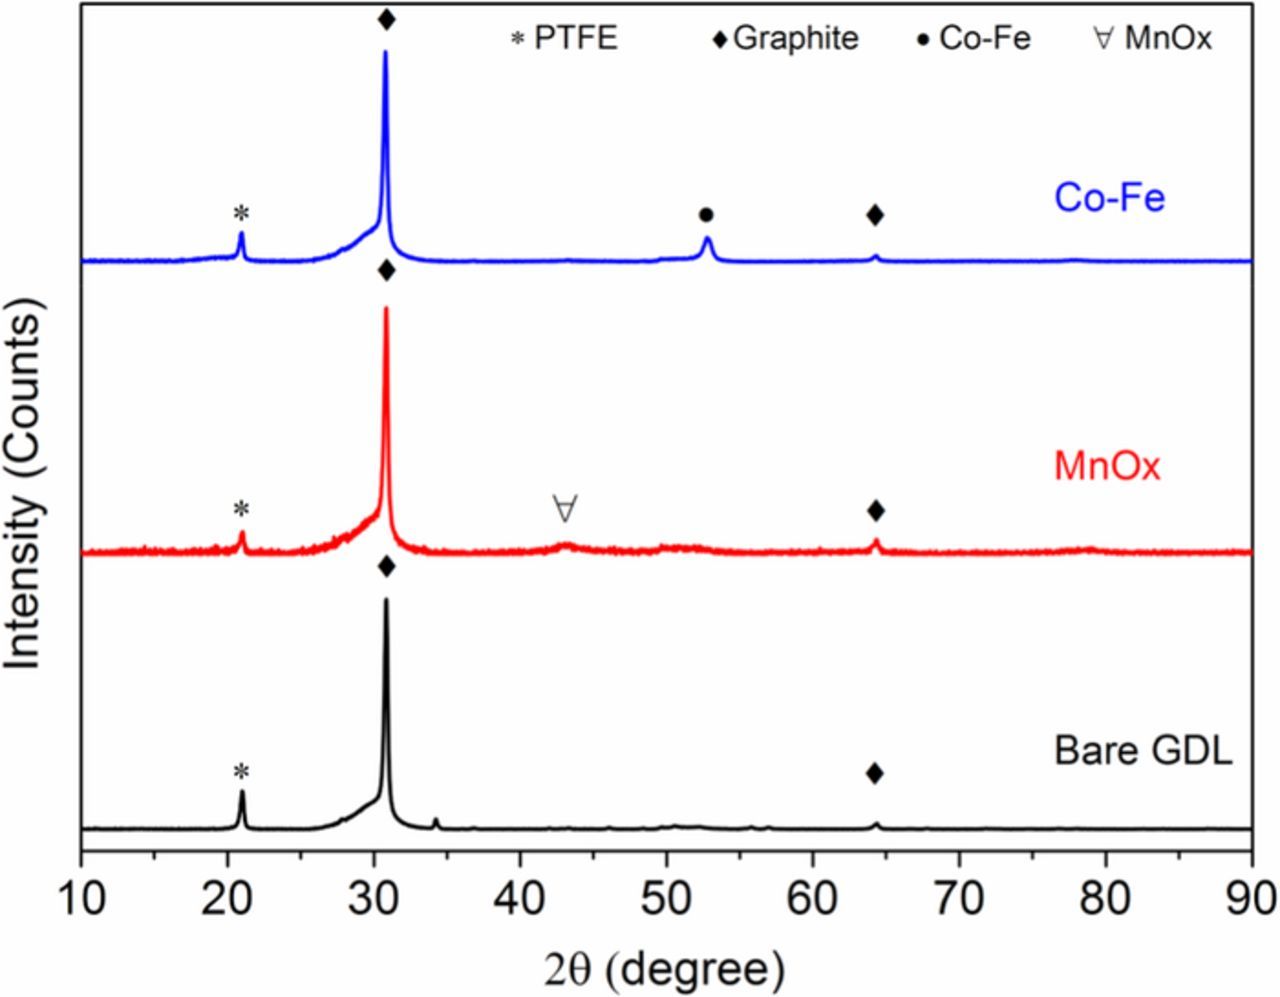
Figure 4. XRD patterns for MnOx, Co-Fe and bare GDL.
Further investigation by TEM confirmed the amorphous nature of MnOx (Figure 5). The selected area electron diffraction (SAED) pattern only shows diffuse rings, which can be indexed to graphite; there are no separate, distinct rings for MnOx (Figure 5a). It has been reported that the extent of disorder within electrodeposited MnOx will increase for depositions at higher current density, while a relatively dense deposit is generated with a low current density.33
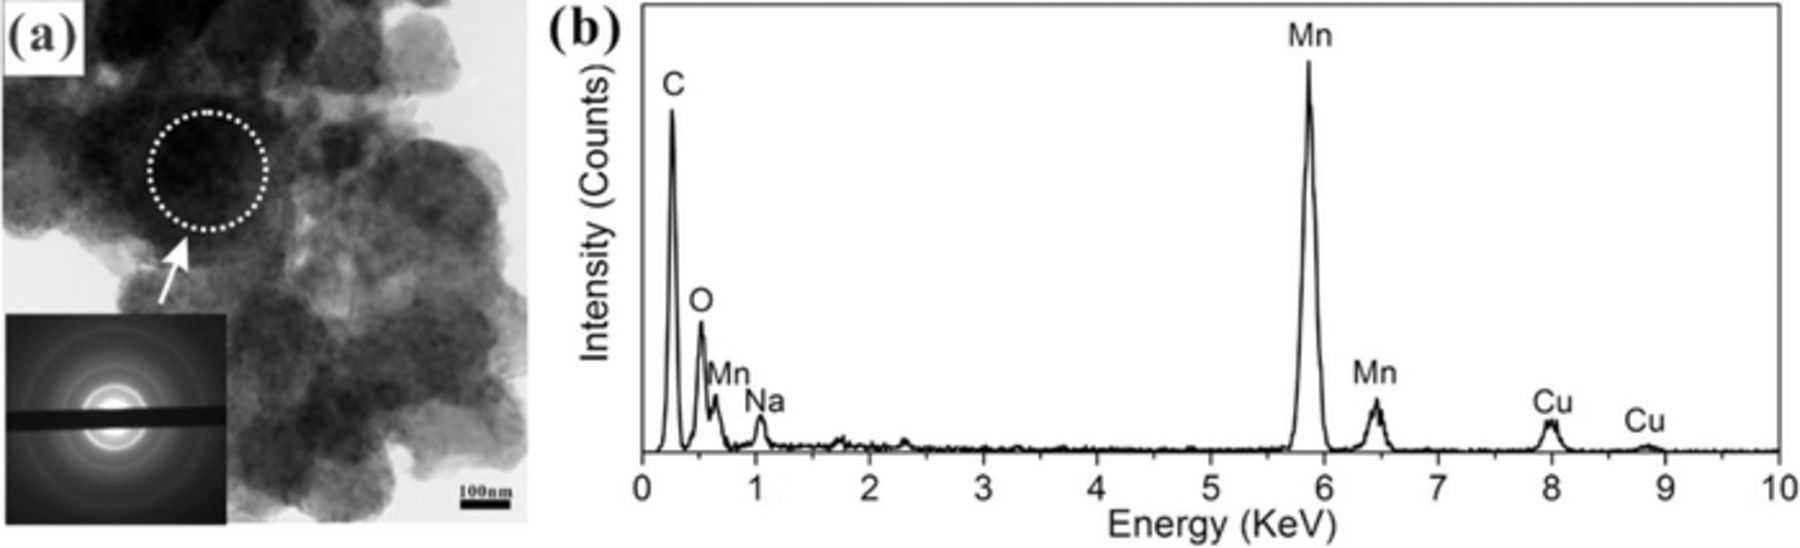
Figure 5. (a) TEM bright field (BF) image of MnOx and SAED pattern (inset) of the region indicated. (b) EDX spectrum of the region indicated in (a).
The hybrid structure (MnOx/Co-Fe) was investigated by TEM. Co-Fe exists in two different forms: metallic nanoparticles and an amorphous mesh (Figure 6a). The metallic particles are ∼100 nm in size (red arrow) with the same crystal structure (bcc) as the Co-Fe electrodeposited separately (SAED pattern in Figure 6a). The three concentric diffraction rings can be indexed to the (110), (200) and (211) planes of bcc Co-Fe. The Co/Fe ratio is ∼2 (EDX spectrum in Figure 6b), which is similar to the composition for the Co-Fe particles deposited separately. The particles contain a small amount of oxygen, due to surface oxidation when the deposit is exposed to air.34 The amorphous region has a mesh-like appearance (yellow arrow and SAED pattern in Figure 6a) and is more Fe-rich than the crystalline Co-Fe regions (compare the EDX spectra from the crystalline and amorphous Co-Fe regions in Figure 6c). The oxygen level is significantly higher in the amorphous region, possibly due to the formation of metal hydroxide caused by HER during cathodic electrodeposition of Co-Fe. The amorphous Co-Fe contains low levels of Mn, implying some degree of MnOx dissolution (less than 40%) and replacement with Co and Fe during Co-Fe deposition on MnOx. Co-Fe was also found in the form of extremely fine (∼5 nm) nanocrystalline particles (Figure 6d). The three concentric diffraction rings can be indexed to the (311), (400) and (440) planes of cubic spinel (Co,Fe)3O4. The Co/Fe ratio (1.22) can be estimated from the Vegard equation, giving a composition corresponding to (Co0.55Fe0.45)3O4 which agrees with the EDX results in Figure 6e.
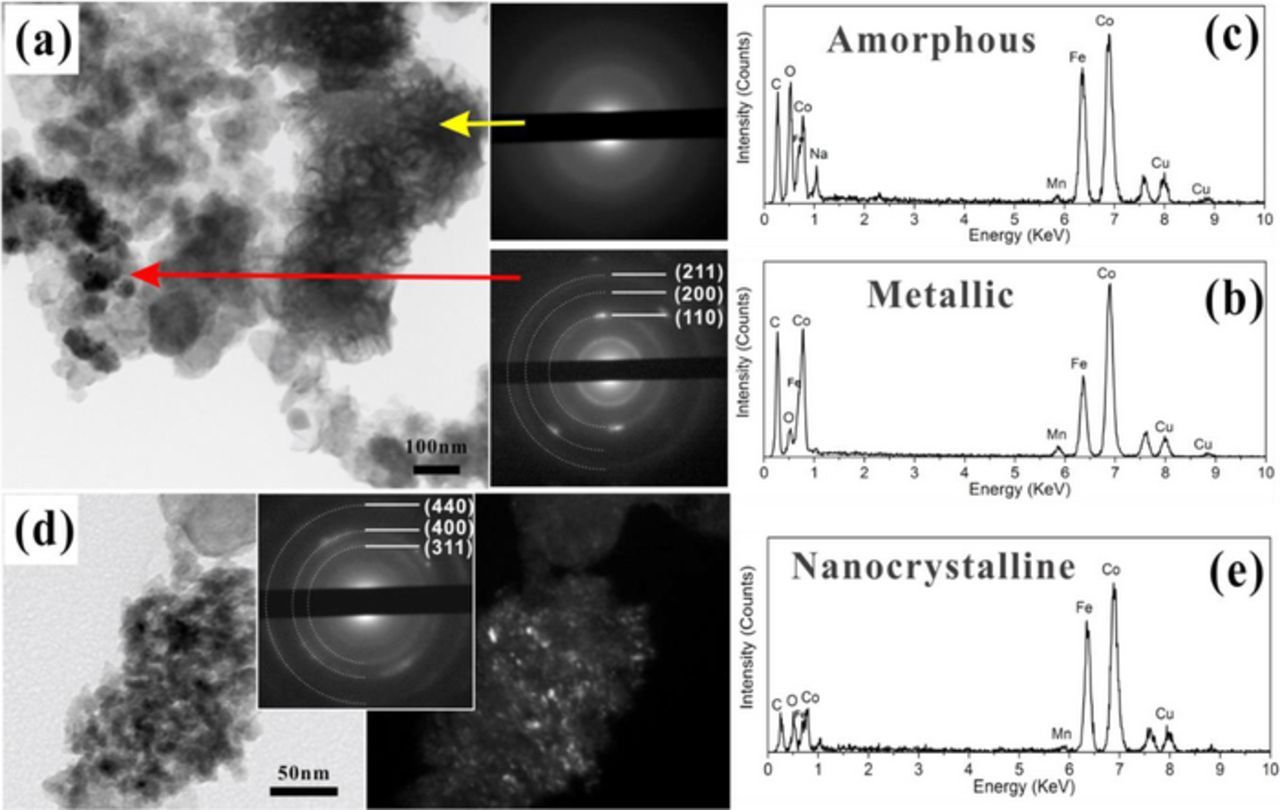
Figure 6. (a) TEM BF image and SAED patterns from MnOx/Co-Fe deposit. (b) EDX spectrum from the metallic Co-Fe region (red arrow). (c) EDX spectrum from the amorphous Co-Fe region (yellow arrow). (d) BF image, SAED pattern and DF image from Co-Fe nanoparticles in MnOx/Co-Fe deposit. The DF image was obtained from part of the first two rings in the SAED pattern. (e) EDX spectrum from the Co-Fe nanoparticles in (d).
Normally, crystalline spinel M3O4 coatings (M = Co, Ni or Fe) can be prepared by electrodeposition through three different ways: (1) Anodic electrodeposition;35,36 (2) cathodic electrodeposition of metal followed by electrochemical oxidation (anodization) in an alkaline solution;37,38 (3) cathodic electrodeposition of metal hydroxide followed by thermal annealing at high temperature.39,40 In this study, the nanocrystalline spinel phase (Co0.55Fe0.45)3O4 is generated by a different mechanism, since neither anodization nor thermal annealing was used after cathodic electrodeposition. According to the Ellingham diagrams for Mn, Co and Fe, the standard Gibbs free energy changes at 300 K for the oxidation of Co and Fe to the spinel phases are as follows:41


The oxide in this work is a mixed Co-Fe spinel, so the standard free energy change will be between the above two values.
![Equation ([1])](https://content.cld.iop.org/journals/1945-7111/164/6/A1012/revision1/d0003.gif)
The standard free energy for the reduction of MnO2 to Mn2O3 is:42
![Equation ([2])](https://content.cld.iop.org/journals/1945-7111/164/6/A1012/revision1/d0004.gif)
MnO2 was chosen as the initial form of MnOx based on the XPS results presented later in this section. Therefore, the free energy change for the reduction of MnO2 to Mn2O3 by Co and Fe is given by the sum of the standard free energies for Reactions 1 and 2. Note, that this is the free energy change for standard state conditions; however, the large negative free energy change indicates that there will still be a significant driving force for the reduction of MnO2 in the presence of Co and Fe even under non-standard state conditions.
![Equation ([3])](https://content.cld.iop.org/journals/1945-7111/164/6/A1012/revision1/d0005.gif)
The surface compositions of the MnOx, Co-Fe and MnOx/Co-Fe deposits were investigated using XPS (Figure 7). The O 1 s spectrum for the MnOx deposit was deconvoluted into three components: O-M(Mn)-O, M(Mn)-O-H and H-O-H (Figure 7a).43 Quantitative calculations (Figure 7a) show more oxide than hydroxide with an oxide/hydroxide ratio of 3.6. The binding energy for the H2O peak is 532.45 eV, suggesting chemisorbed or structurally bound water.44 The fitting procedure for Mn 2p3/2 is based on the data reported in the literature.45 Mn 2p3/2 was deconvoluted into different components belonging to Mn+4 and Mn+3 after considering the binding energy, the full width at half maximum (FWHM) and the relative intensity. The normalized compositions of Mn+4 and Mn+3 are 62.9 at% and 37.1 at%, respectively. Therefore, the MnOx film should be a mixture of MnO2 and MnOOH/Mn2O3, with more MnO2. It has been reported that the pathway for MnO2 electrodeposition is dependent on the acidity of the supporting electrolyte.46 Accordingly, initial precipitation of MnOOH on the GDL surface, followed by incomplete solid state oxidation to MnO2 should be favored in this work since a near neutral electrolyte (pH = 6.7) was used.47
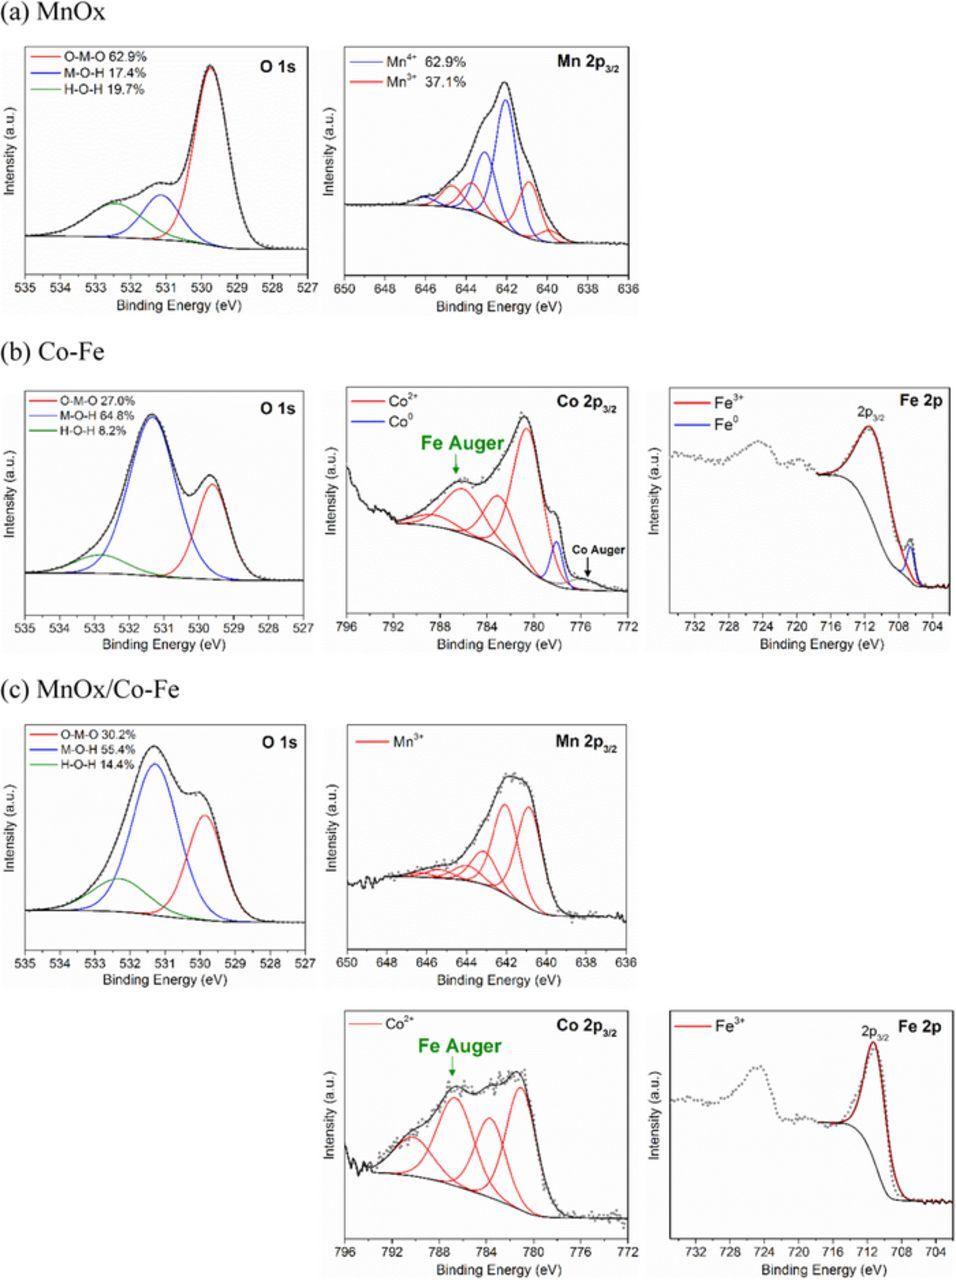
Figure 7. XPS spectra for the three types of deposits, i.e., (a) MnOx, (b) Co-Fe and (c) MnOx/Co-Fe.
For the Co-Fe deposit, a weak O-M-O peak and a relatively strong M-O-H peak with an oxide/hydroxide ratio of 0.4 indicate a hydroxide-like environment that dominates the surface (Figure 7b). The fitting procedure for Co-Fe is based on the data reported in the literature.48 The Co 2p3/2 peak of Co-Fe is composed of Co2+ components and Co0 metal (778.35 eV), indicating that the surface was not fully oxidized after electrodeposition. In addition, the Co LMM Auger peak at 775.87 eV is visible in the XPS spectrum.48 The Fe LMM Auger peak at 786.69 eV (green arrow) is also present and contributes to the Co 2p3/2 spectrum. The Fe 2p3/2 can be deconvoluted into Fe3+ (710.79 eV) and Fe0 metal (706.55 eV). Therefore, Co-Fe (oxy)hydroxide generated on the surface of the Co-Fe alloy will provide the primary active sites to catalyze OER.
Cathodic electrodeposition of Co-Fe on MnOx changed the XPS spectra for both materials (Figure 7c). The O 1s peak for the MnOx/Co-Fe sequential deposit shows an oxide/hydroxide ratio of 0.5, which is between the values for the separate MnOx and the Co-Fe samples. The Mn 2p3/2 spectrum shows that the Mn4+ was reduced to Mn3+ after cathodically depositing a layer of Co-Fe on MnOx. The metal phase disappeared in both the Co 2p3/2 and Fe 2p3/2 spectra, but the oxidation states for Co (Co2+) and Fe (Fe3+) remained unchanged. In addition, the peak at 786.63 eV in the Co 2p3/2 part of the spectrum became stronger compared with the Co-Fe sample. This component was attributed to the Fe LMM Auger line as explained before. The same trend was reported in the literature, with a stronger shoulder in the Co 2p3/2 peak when more Fe3+ was incorporated into Co(OH)2.17 As such, these results suggest that there is more Fe in Co-Fe when it is deposited onto MnOx. The TEM analysis in Figure 6 is consistent with the XPS results, i.e., the amorphous Co-Fe hydroxide and nanocrystalline spinel ((Co0.55Fe0.45)3O4) which form in the MnOx/Co-Fe deposit are more Fe-rich compared with the solid solution phase that forms in the separate Co-Fe deposit (Co0.64Fe0.36).
Electrochemical performance
Figure 8a shows CV curves for the catalysts cycled in oxygen saturated 6 M KOH solution. The current at −0.25 V is derived from ORR and the current at 0.7 V is produced by OER. Thus, this test can provide information for both ORR and OER electrocatalytic capabilities of the catalysts. The ORR and OER activities of MnOX, Co-Fe and MnOx/Co-Fe are compared. In terms of ORR activity, MnOX has better performance than Co-Fe as expected and its performance is improved by sequentially depositing a Co-Fe layer (MnOx/Co-Fe). For MnOx/Co-Fe compared with MnOx the mass loading increased by 0.2 mg cm−2 or 20%, but the ORR current density at −0.25 V increased by 44% from 12.5 mA cm−2 to 18 mA cm−2. The OER current density at 0.7 V increased by 54% from 17.5 mA cm−2 to 27 mA cm−2, with a more negative onset potential. In addition, the shape of the MnOx/Co-Fe CV curve changed with a bump appearing at 0.1 V. MnOx may experience some dissolution during cathodic electrodeposition of Co-Fe, meaning less MnOx is present in MnOx/Co-Fe. However, MnOx/Co-Fe still performs better than the MnOx sample in terms of ORR activity. If it is assumed that the mass of MnOx does not change during Co-Fe deposition, then only 0.2 mg cm−2 of Co-Fe was coated onto the MnOx, but the OER performance was much better compared with pure MnOx. These observations indicate that the improvements for MnOx/Co-Fe relative to MnOx are not simply from the increase in mass loading, but also from a synergistic effect of the two materials. Amorphous MnOx can provide numerous active sites for oxygen adsorption and deliver discharge power comparable to 20% Pt/C in a Zn-air battery after combining with Ketjenblack carbon to improve its electrical conductivity.49
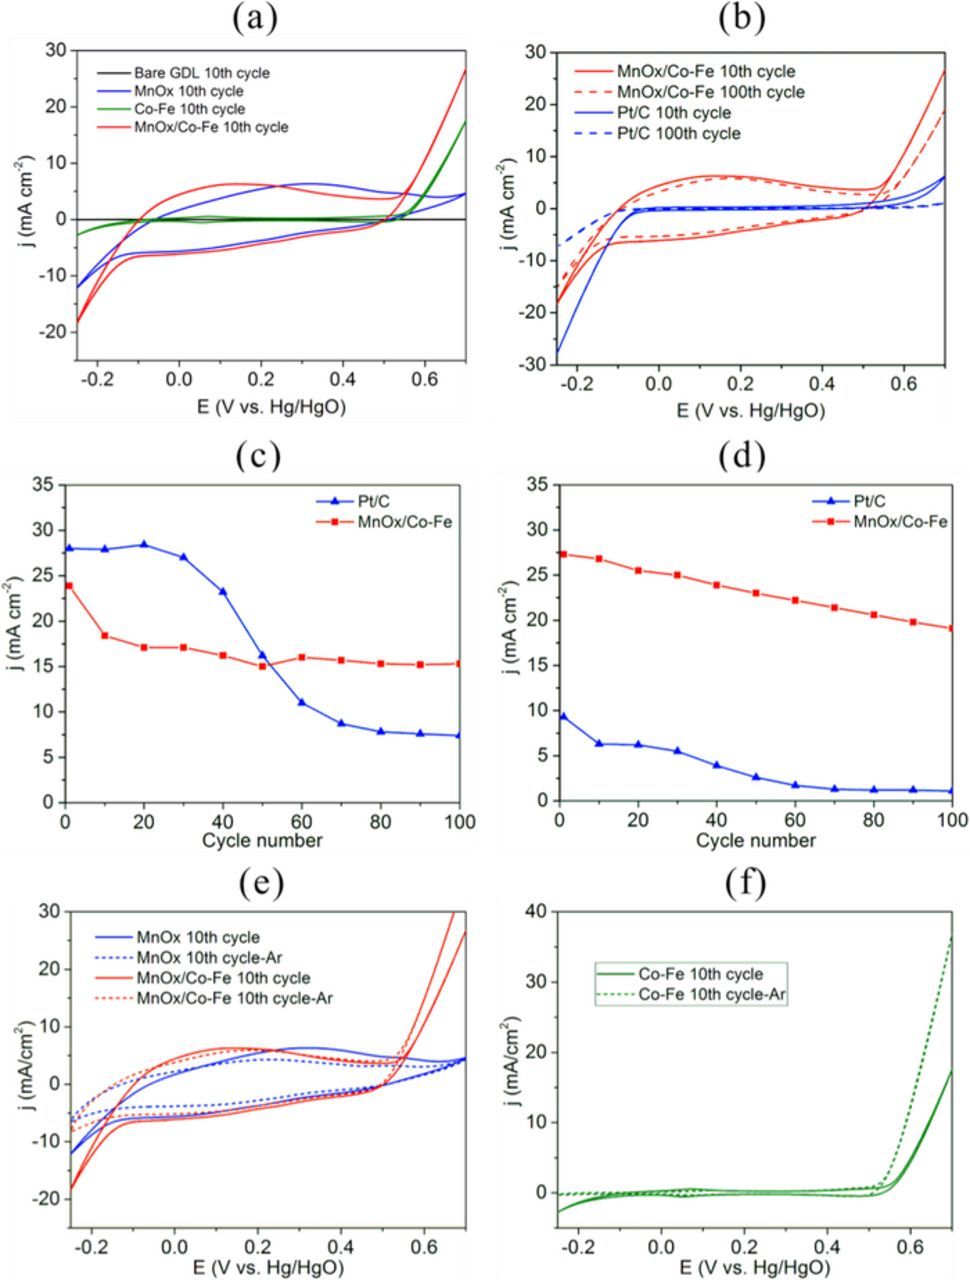
Figure 8. (a) CV curves for different catalysts in oxygen saturated 6 M KOH, cycled from −0.25 V to 0.7 V. (b) CV curves for MnOx/Co-Fe and Pt/C at the 10th and 100th cycles in oxygen saturated 6 M KOH. (c) Current density as a function of cycle number at −0.25 V. (d) Current density as a function of cycle number at 0.7 V. (e) CV scans for MnOx and MnOx/Co-Fe in oxygen and Ar saturated 6 M KOH. (f) CV scans of Co-Fe in oxygen and Ar saturated 6 M KOH.
The improved ORR activity for MnOx/Co-Fe, relative to MnOx alone, may be related to the reduced oxidation state of Mn. The specific ORR electrocatalytic activity of MnOx increases exponentially with the potential of the Mn4+/Mn3+ redox couple and MnOOH/Mn2O3 has a higher formal potential than MnO2 for this transition.50 Therefore, the better ORR activity of MnOx/Co-Fe compared with MnOx may be due to the change in oxidation state from Mn4+ to Mn3+ as demonstrated in the XPS analysis. The addition of Ni(OH)2 into MnOx by reducing an amorphous MnO2/C suspension, in the presence of Ni2+ with NaBH4, has also been reported to stabilize the morphology and phase of the active material.51 ORR activity was improved due to the higher MnOOH content after adding the reducing agent NaBH4.52 An increasing level of Mn3+ may be expected to decrease the conductivity of MnOx; however, EIS results demonstrate that the electrical properties of MnOx/Co-Fe are enhanced by the Co-Fe coating, as will be shown later.
The CV curves for MnOx and MnOx/Co-Fe show typical behavior for an electrochemical capacitor, due to pseudocapacitive reactions occurring on the surface of Mn oxide.53 In contrast, Co-Fe shows no obvious capacitive current but has a Co2+/Co3+ redox peak at around 0.1 V.54 Co-Fe is a much better OER catalyst than MnOx, as confirmed by our previous work.55 The large active surface area of the Co-Fe nanoparticles, as shown by SEM and TEM analysis, can facilitate the OER reaction. MnOx/Co-Fe has higher OER activity than pure Co-Fe. According to the literature, amorphous MnOx can act as an OER catalyst as well.56 The Pourbaix diagram of Mn shows that MnO2 tends to dissolve under high anodic potential, even in alkaline solutions.23 Therefore, a low OER potential or charging voltage is desired when using MnO2 in the bifunctional catalysts, which was achieved by coating the Co-Fe OER active layer onto MnO2 in this work. In addition, the Co-Fe layer covering MnO2 has more contact with the KOH electrolyte and acts as the primary OER active sites, reducing the negative impact of the oxygen evolution process. Therefore, in terms of both ORR and OER activity, MnOx/Co-Fe performs better than either MnOX or Co-Fe alone, making it a promising bifunctional catalyst. CV scans for Ar saturated electrolyte and oxygen saturated electrolyte (both 6 M KOH) are compared in Figures 8e and 8f. The ORR current was diminished when Ar was purged into the electrolyte for all three samples, while the OER current increased for Co-Fe and MnOx/Co-Fe (dashed line). The CV scan for the Ar saturated electrolyte shows that MnOx/Co-Fe has a higher capacity than MnOx (dashed line in Figure 8e), so the better ORR activity may be partly from the larger surface area.
The MnOx/Co-Fe sample was cycled 100 times to test its durability and compared with commercial Pt/C (Figure 8b). The ORR current density for MnOx/Co-Fe at −0.25 V decreased by 16% from the 10th to the 100th cycle, while the ORR current density for Pt/C dropped by 73%. The plot in Figure 8c shows that the ORR current for Pt/C decreased rapidly after 30 cycles, possibly due to the detachment of active material from GDL or catalyst particle agglomeration.57 In contrast, the ORR current for MnOx/Co-Fe was stable during cycling. The OER performance of MnOx/Co-Fe was much better in terms of both activity and durability than Pt/C (Figure 8d). These results indicate the combined MnOx/Co-Fe catalysts are more stable than Pt/C during cycling from the ORR to the OER potential range and are good candidates as bifunctional catalysts in zinc-air batteries.
Battery performance
Three different catalyst materials (MnOx, MnOx/Co-Fe and Pt/C)) were assembled into Zn-air batteries for discharge-charge tests at different current densities (1, 2, 5 and 10 mA cm−2). Figure 9a shows that Pt/C has the highest discharge potential, because its ORR activity is the highest, followed by MnOx/Co-Fe. At a current density of 10 mA cm−2, the cell with MnOx/Co-Fe catalysts is able to discharge at 1.24 V vs. Zn/Zn2+, which is higher than the discharge potential for either MnOX (1.16 V) or Co-Fe (1.08 V). Moreover, MnOx/Co-Fe has the lowest charge potential among all samples. This performance confirms the CV results in Figure 8a. The efficiencies calculated from Figure 9a are plotted for different current densities (Figure 9b). The cell with MnOx/Co-Fe catalysts has the highest efficiency at nearly all current densities. The efficiency is 62% at 10 mA cm−2, which is higher than the 60% efficiency of Pt/C. Figure 9c shows that Pt/C performs the best during discharge polarization, followed by MnOx/Co-Fe, which has the lowest charge polarization potential. Potentiostatic EIS was performed at 1.1 V vs. Zn/Zn2+ for the Zn-air battery, with different catalysts, to evaluate the electrical properties of the electrodes. The impedance data were fit using ZFit software (Biologic), with the equivalent circuit shown in Figure 9d, and the values of fitted parameters are listed in Table I. The Nyquist plots reveal that the three samples have similar solution resistances (Rs), but have different solid-electrolyte interface resistances (Rint) and charge transfer resistances (Rct).58 The Rint value of MnOx/Co-Fe is half that of MnOx, indicating easier interfacing with the electrolyte after coating with Co-Fe.59 In addition, Rct for MnOx/Co-Fe is greatly reduced compared with MnOx, showing almost the same value as Pt/C. The enhanced electrical properties of MnOx/Co-Fe relative to MnOx can be attributed to the thin layer of conductive Co-Fe nanoparticles.
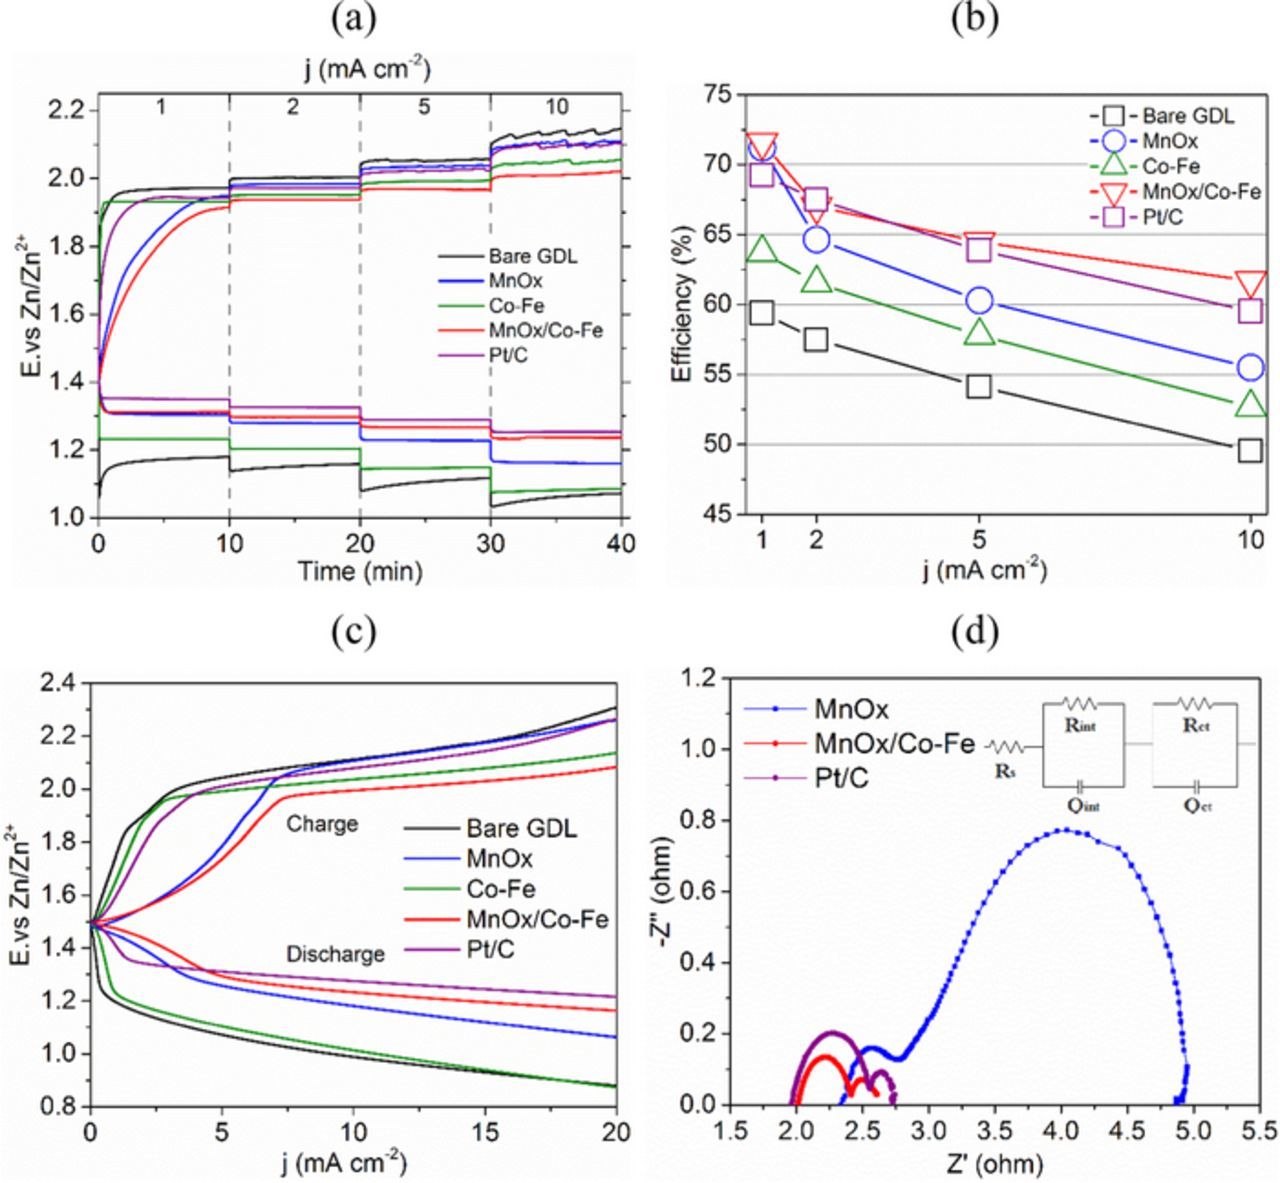
Figure 9. (a) Rate discharge-charge curves for Zn-air batteries. (b) Discharge-charge efficiencies for Zn-air batteries at various current densities. (c) Discharge-charge polarizations for Zn-air batteries. (d) Electrochemical impedance spectra for Zn-air batteries at 1.1 V vs. Zn/Zn2+.
Table I. Equivalent circuit elements based on the EIS analysis of Pt/C, MnOx/Co-Fe and MnOx.
| Pt/C | MnOx/Co-Fe | MnOx | |
|---|---|---|---|
| Rs (Ω) | 1.96 | 2.00 | 2.27 |
| Rint (Ω) | 0.61 | 0.40 | 0.81 |
| Rct (Ω) | 0.17 | 0.21 | 1.89 |
During discharge-charge cycling at 5 mA cm−2 (Figure 10a), the cell with MnOx/Co-Fe had an average discharge potential of 1.18 V vs. Zn/Zn2+, which is slightly lower than the cell with Pt/C with an average discharge potential of 1.21 V vs. Zn/Zn2+. Due to the better OER activity of MnOx/Co-Fe, its cell can charge at an average potential of 1.98 V vs. Zn/Zn2+, which is lower than the 2.03 V vs. Zn/Zn2+ for the cell with Pt/C. The declining discharge potential for the Pt/C cell can be attributed to two factors. The first is the poor stability of Pt/C particles when cycled between cathodic and anodic potentials, which was confirmed by the CV cycling test in Figure 8b. The second reason relates to flooding of the electrolyte into the pores of the air electrode, which limits diffusion of air and impairs the three-phase reaction zone for ORR. This influences the MnOx/Co-Fe sample as well.60 For the OER part, the charge potential of Pt/C increases with cycling, while the charge potential of MnOx/Co-Fe remains almost the same throughout the whole test. Therefore, both the MnOx/Co-Fe and Pt/C cells have almost the same efficiency of 59.6%.
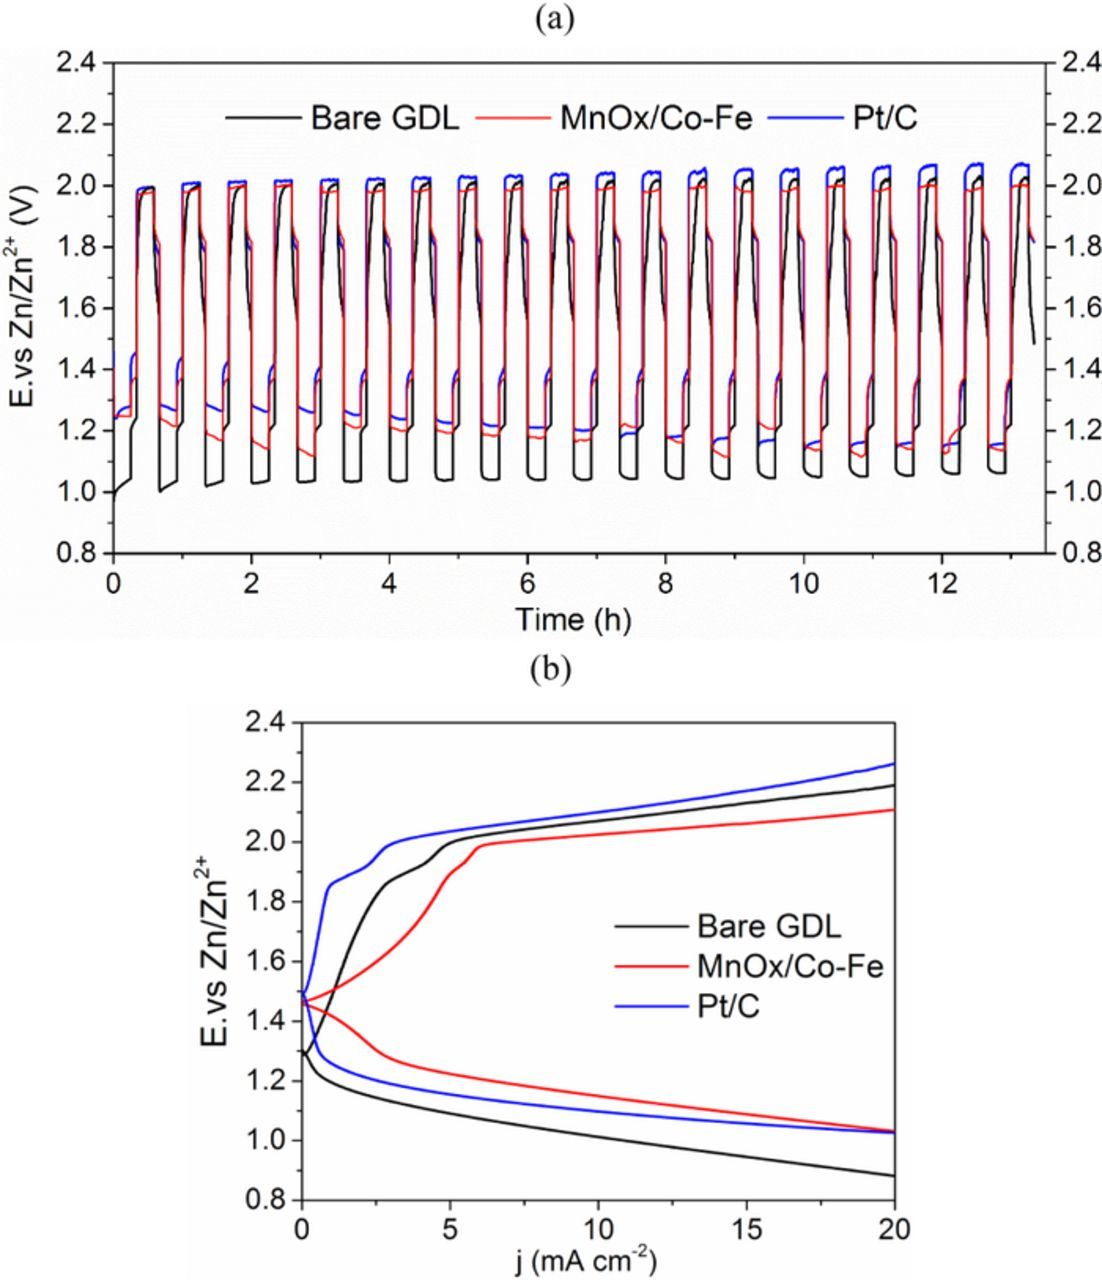
Figure 10. (a) Discharge-charge cycling performance for Zn-air batteries at 5 mA cm−2. (b) Discharge-charge polarization after cycling.
Discharge-charge polarization was conducted again after the cycling tests and shows that MnOx/Co-Fe performs better than Pt/C (Figure 10b). The cell with MnOx/Co-Fe catalysts was then cycled for 40 h to test the catalyst's durability in a Zn-air battery. Figure 11a presents the galvanostatic discharge-charge curve for the cell. The discharge potential gradually decreased after 20 h of cycling. One possible reason for the decrease is blocking of oxygen diffusion caused by flooding of electrolyte into the air electrode.61 There was no obvious peeling of the MnOx/Co-Fe layer from the GDL substrate (insets of Figures 11b and 11d). SEM images show that there are more cracks on the electrode surface after cycling, but no obvious morphology changes, other than the cracking, were observed (Figures 11b-11e). The cracks may be produced by MnOx phase changes when cycled between ORR and OER potentials.62 EDX analysis of the GDL surface demonstrates that the composition did not change much after cycling, other than the presence of small amounts of Zn and K from the electrolyte (Table II). Thus, the MnOx/Co-Fe bifunctional catalysts exhibit excellent structural stability in terms of morphology and composition during battery cycling.
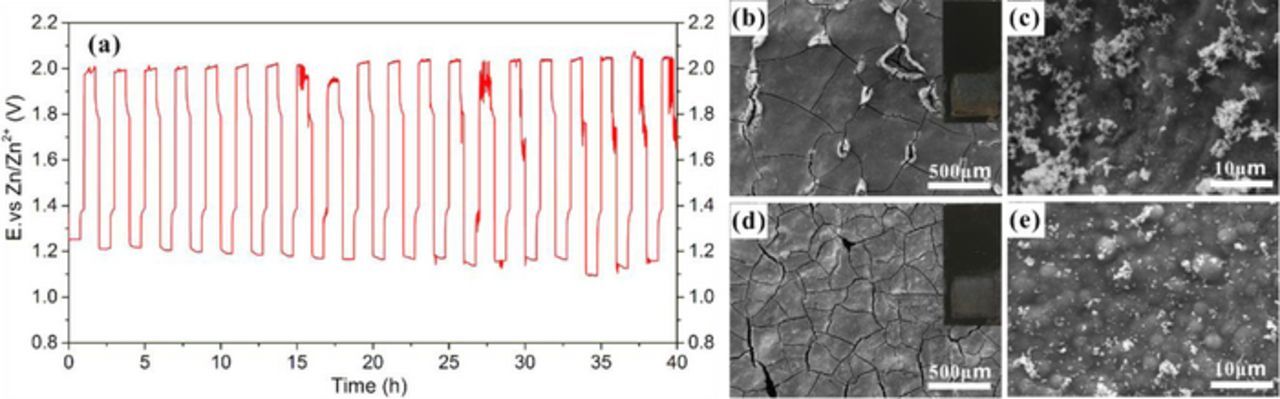
Figure 11. (a) Discharge-charge cycling at 5 mA cm−2 for zinc-air battery with MnOx/Co-Fe catalysts. (b, c) SEM SE images of MnOx/Co-Fe catalyst layer before cycling. (d, e) SEM SE images of MnOx/Co-Fe catalyst layer after cycling. The insets show the visual appearance of MnOx/Co-Fe catalyst layer on GDL before and after cycling.
Table II. Composition of catalyst layer before and after 40 h cycling test (at%).
| Mn | Co | Fe | C | O | Na | K | Zn | |
|---|---|---|---|---|---|---|---|---|
| Before cycling | 21.6% | 0.7% | 0.5% | 6.5% | 67.6% | 3.2% | 0 | 0 |
| After cycling | 20.8% | 0.6% | 0.3% | 0 | 68.7% | 0 | 7.8% | 1.9% |
Conclusions
MnOx and Co-Fe were sequentially electrodeposited on carbon paper to fabricate bifunctional catalysts MnOx/Co-Fe for zinc-air batteries. The MnOx, Co-Fe and MnOx/Co-Fe structures were confirmed by SEM, TEM, XRD and XPS analysis. MnOx was initially deposited as an amorphous mixture (MnO2/MnOOH) and was then reduced to Mn2O3/MnOOH after coating with Co-Fe nanoparticles. The electrochemical properties of the hybrid MnOx/Co-Fe catalysts were measured, showing higher ORR and OER activity compared with MnOx and Co-Fe alone. The synergistic effect is related to the reduced Mn oxidation state, higher surface area and lower charge transfer resistance. A Zn-air battery using MnOx/Co-Fe catalysts exhibited good discharge-recharge performance and a cycling efficiency of 59.6% that is comparable with Pt/C catalysts. Electrodeposited MnOx/Co-Fe showed strong adhesion to GDL and was stable throughout 40 h of battery cycling.
Acknowledgments
This work was supported by the Natural Sciences and Engineering Research Council (NSERC) of Canada and the Chinese Scholarship Council. Wei Qu, Xinge Zhang and Xiao-Zi Yuan of NRC Canada are acknowledged for valuable discussions. The authors are also grateful to Elaheh Davari and Michael Clark, from the University of Alberta, for their support and contributions.