Abstract
Electrodes prepared from lithium-rich (Li-rich) xLi2MnO3⋅(1-x)LiNiaCobMncO2 materials (a + b + c = 1) show extremely high discharge capacities, arising from excess Li+ present in their Li2MnO3 component, and the ability to reversibly store charge with O2− anions. These electrodes suffer serious voltage and capacity fading however, due to the migration of transition metals to the Li-layer at advanced states of charging, partial structural layered-to-spinel transformation and other reasons. In this focus paper, the current understanding of the above materials is summarized, briefly concluding with attempts by our groups to mitigate the voltage and capacity fade of these electrodes.
Export citation and abstract BibTeX RIS

This is an open access article distributed under the terms of the Creative Commons Attribution Non-Commercial No Derivatives 4.0 License (CC BY-NC-ND, http://creativecommons.org/licenses/by-nc-nd/4.0/), which permits non-commercial reuse, distribution, and reproduction in any medium, provided the original work is not changed in any way and is properly cited. For permission for commercial reuse, please email: oa@electrochem.org.
Lithium-rich Materials
Due to their high capacity, ca. 250 mAh/g, and the lower cost of Mn than Co or even Ni, lithium and manganese rich, (Li-rich) xLi2MnO3⋅(1-x)LiNiaCobMncO2 materials are considered as likely candidates for the next generation of cathodes following Ni-rich materials (discussed in the preceding review of this issue).1–7 The mechanism behind such a high, reversible capacity is still under intense investigation,8–10 as well as many other aspects such as the nature of the materials' activation,11–14 the large voltage hysteresis after activation,15–18 redox couple designations,14,19,20 and the nature of fading mechanisms during cycling.16,21–25 Even something as basic as the structure of the pristine material remains the subject debate.26–31 Ultimately, the main obstacle to overcome for commercialization of Li-rich materials is their dramatic capacity and voltage fade, the latter especially detrimental for portable electronics that require stable voltage sources.1,2,6
Li-rich materials have a layered structure, described by some groups as either a single phase solid solution,26–28,32–34 or a composite of two phases, the rhombohedral  phase Li(TM)O2 and an additional monoclinic C2/m phase, Li2MnO3.3,14,35 There is mounting evidence however for the composite phase, with the Li(TM)O2 and Li2MnO3 phases intimately integrated and interconnected on a nano-scale.14,36 This model is supported by XRD, electron diffraction, high-angle annular dark-field (HAADF) STEM images and X-ray absorption spectroscopy (Figure 1).14,36,37 The C2/m phase introduces a tilt to the
  phase, lowering the crystal symmetry, with new peaks arising indicated in Figure 1A. For Figures 1–4, data from our groups is of 0.35LiMn2O3·0.65Li[Mn0.45Ni0.35Co0.20]O2 cathode material produced by BASF. The presence of the monoclinic phase is additionally confirmed via TEM electron diffraction patterns (Figure 1B). Further evidence for a multi-phase structure comes from aberration corrected STEM HAADF images, taken along the [100] zone axis according to the C2/m phase, or the [210] zone axis for the
  space group (Figures 1C–1D).14 Li2MnO3 possesses an O3-type structure that can be represented in conventional layered LiMO2 notation as Li3a[Li1/3Mn2/3]3bO2, where interslab octahedral sites are only occupied by Li+-ions, while Li+ and Mn4+-ions (in a ratio of 1:2) occupy slab octahedral sites, and 3a and 3b refer to the octahedral sites of the trigonal lattice.38 Since the intensity of the spots in Figure 1C corresponds to the average atomic number, Z, of each column by the power of 1.7, the intensity of the LTMO2 region will be constant (Line 2), whereas the Li2MnO3 line intensity (Line 1) varies (Figure 1D). Extended X-ray Absorption Fine-Edge Structure (EXAFS) data on pristine Li-rich materials can offer further evidence for an integrated structure, with the Mn EXAFS R-space plot for pristine Li-rich materials corresponding to a mix between LiNi1/3Mn1/3Co1/3O2 and Li2MnO3.14
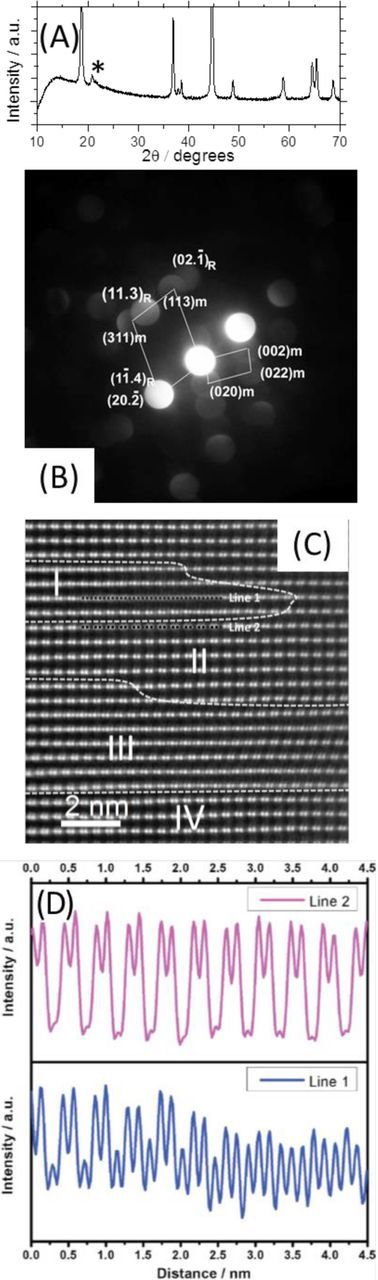
Figure 1. (A) and (B) XRD patterns and electron diffraction patterns, respectively, of Li-rich material 0.35LiMn2O3·0.65Li[Mn0.45Ni0.35Co0.20]O2 (produced by BASF) with the C2/m peaks indicated by an asterisk. (C) HAADF STEM image and (D) line profiles of pristine, uncycled Li-rich material Li1.2Ni0.15Co0.1Mn0.55O2 (0.5LiMn2O3·0.5Li[Mn0.375Ni0.375Co0.25]O2). Reproduced with permission from Ref. 14.
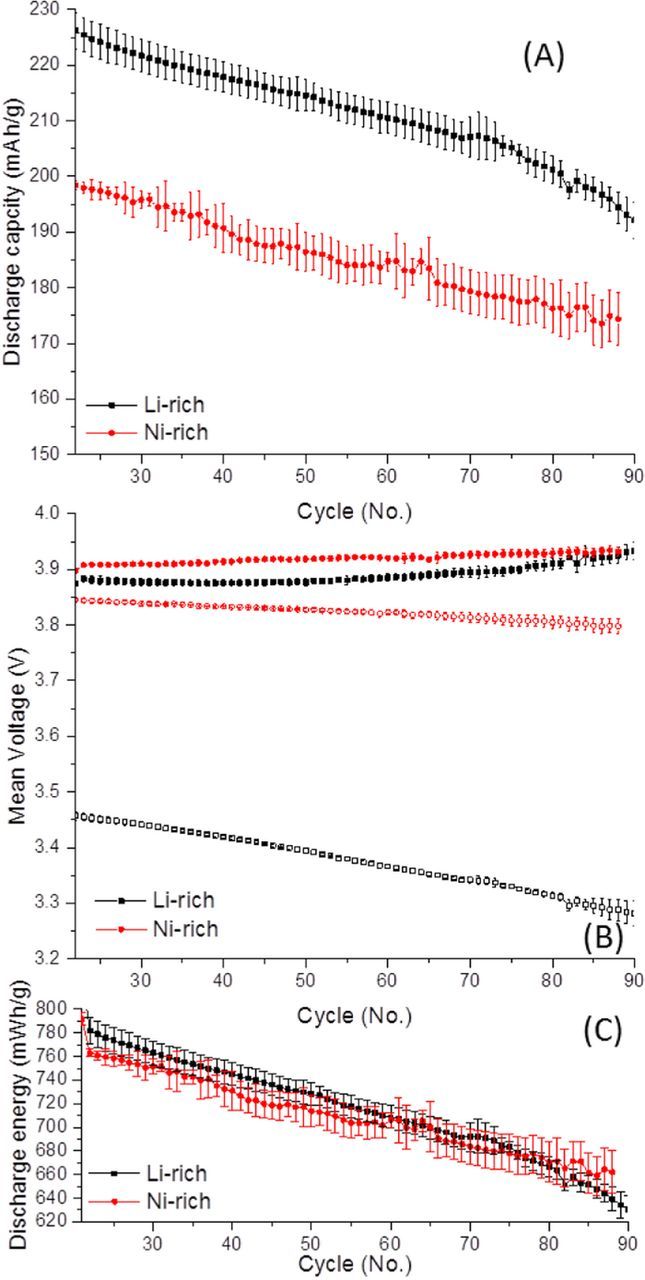
Figure 4. The (A) average discharge capacity, (B) mean charge (closed symbols) and discharge (open symbols) voltages and (C) discharge energy density for representative Li-rich (0.35LiMn2O3·0.65Li[Mn0.45Ni0.35Co0.20]O2) and Ni-rich (LiNi0.8Co0.1Mn0.1O2) material electrodes throughout prolonged cycling at C/3, ignoring the Li side of the cell. Mean voltage is calculated from dividing the energy (Wh) from each cycle by the capacity (Ah). The first 20 cycles are omitted since these are from a rate capability measurement. Coin cells utilized ∼2.5 mg active material/cm2 cathodes vs. Li, wth 1 M LiPF6 3:7 EC:EMC at 30°C, at C/3 from 2 to 4.6 V for the Li-rich cathode and 2.8 to 4.3 V for the Ni-rich cathode.
Redox Designations of Li-rich Materials
Lithium insertion and extraction can be fairly easily tracked through monitoring of the c-lattice parameter during cycling.9,39,40 The first cycle charge-discharge profile and dq/dV are plotted in Figures 2A–2B.39 Looking at the charge profile, three main regions are seen during charging: first from the open circuit potential until ∼4.4 V, Li+ is extracted from the Li-layer, because of which the shielding between O2− slabs decreases, causing the c-parameter to increase. Next is the activation step, during which lattice parameters remain constant.9,14,39,40 The mechanism of the activation step will be discussed in detail in a later section. Beyond activation, >4.6 V, the materials' c-parameter rapidly decreases, due to the extraction of Li+ from the TM layer, and probable migration of TM ions to the Li-layer.9,14,39,40 A similar contraction is observed with other transition metal oxides at high levels of Li+ extraction, such as LiNi0.8Co0.1Mn0.1O2.41 Upon discharge, best pictured in the dq/dV plot in Figure 2B, Li+ is first inserted into the transition metal layer since this happens at a higher energy than insertion into the Li+ layer, observed by an increase in the c-lattice parameter.39,42 Finally, the lower voltage Li+ layer insertion occurs below 3.5 V, causing a c-lattice parameter decrease as O2− slab repulsion is shielded by the cations.39 The evolution of a similar Li-rich material's a and c parameters vs. voltage in the first cycle is depicted in Fig. 2C, taken from neutron diffraction from the Meng group.43

Figure 2. (A) Charge voltage profile and (B) differential capacity plot of the first cycle of a model Li-rich material, 0.35LiMn2O3·0.65Li[Mn0.45Ni0.35Co0.20]O2, indicating to which layer Li+ inserts/extracts and which atoms receive/donate charge. Modified with permission.39 Figures 2A–2B are from coin cells of ∼2.5 mg/cm2 vs. Li, with 1 M LiPF6, 3:7 ratio of ethylene carbonate (EC) to ethyl methyl carbonate (EMC) at 30°C, at a C/15 rate from 2 to 4.7 V. (C) The comparison of a and c parameters vs. the voltage profile with a similar composition electrode (0.5LiMn2O3·0.5Li[Mn0.375Ni0.375Co0.25]O2) calculated from in-situ neutron diffraction patterns of a 12 layer pouch cell to increase the scattering volume, with 1 M LiPF6 1:1 EC to diethyl carbonate. Reproduced with permission from Ref. 43.
Assigning which atoms are involved in redox peaks in Fig. 2 is much more difficult than determining where Li+ is inserted to or extracted from. X-ray absorption near-edge spectroscopy (XANES) can be used to monitor metal oxidation states, through an X-ray induced excitation of inner core electrons to the materials' LUMO band, referred to as a white line.44,45 Since the electronic structure of the material's LUMO band influences white intensity and position, the white line can be used to correlate atomic oxidation states, making XANES a powerful method for monitoring which atoms in the battery materials are involved in specific redox peaks.45 Ni2+/4+ is fairly easy to monitor with less accuracy for Co3+/4+ and even Mn3+/4+, since their white lines are not as dynamic over these redox changes.14,19,20 O2− oxygen state changes can also be monitored fairly well by XANES.46,47 One drawback of XANES is that the oxidation states measured are not absolute, since endpoints are given by standards such as NiOOH for Ni3+, which will have a different band structure than LiNiO2, though have average 3+ oxidation states. During the first charging step described in the voltage profile in Figure 2, Ni2+ and Co3+ are oxidized as with standard, LiNixCoyMnzO2 layered materials.14,19,20,39 Subsequent redox activity is more complex, with further study required before consensus.14,19,20 The activation peak will be discussed in the following paragraph. Beyond activation, further reversible oxidation of O2− is believed to occur, with the nature of the oxidized group likely to be in the form of peroxo (O2)n− dimer species, sharing overlapped orbitals with manganese.2,48–52 Involvement of oxide in reversible redox activity is supported by XANES O k-edge spectra,46,47 EXAFS describing Mn-O bond changes,14 HAADF STEM images showing peroxo dimer formation48 and by ab-initio molecular orbital calculations.2,48 The involvement of O2− anionic redox is thought to have slower kinetics than cationic redox, as well as enhances the materials' voltage hysteresis and fade.53 Still, the nature of the O2− oxidation remains controversial, with some groups suggesting alternative mechanisms including reversible O2 evolution/reincorporation, though this seems unlikely from an entropic point of view.10 Aside from the nature of the oxidized anion, consensus is being developed that reversible oxidation of O2− is in part the source of enhanced capacity for Li-rich lithium ion battery cathodes.53 The reduction peak in Fig. 2 then proceeds first with reformation of O2−, before the reduction of Ni4+ and Co4+, which tend to overlap, followed by reduction of Mn4+, possible after activation of the Li2MnO3 phase of the material.14 The Mn4+ reduction occurs with either transition metal or Li-layer insertion of Li+, occurring at a higher potential for the former.14,39 As stated above, due to the difficulties of interpreting XAS and a wide variety of sample compositions that may perform differently, these redox designations are not fully accepted, especially for the potential range of reversible O2−/(O2)n− redox activity.14,19,20 Further intensive studies are sure to come before these controversies are settled.
Activation of Li-rich Materials
Li2MnO3 has a very high theoretical capacity, ca. 459 mAh/g, that remains inactive without activation, at first discovered through utilization of acid pretreatment.54 Efforts to enhance the capacity and stabilize the dramatic fading of Li2MnO3 electrodes took advantage of a similar strategy as with LiTMO2 electrodes, through the compositing with other transition metal oxides.55,56 Although acid was used to initially activate Li-rich materials, electrochemical activation proved a better and more convenient pretreatment.42,55–57 Activation is a complex, highly irreversible rearrangement of the material that permits subsequent reversible Li+ extraction and intercalation.8–10 Shortly after the discovery of the material, it was realized that the activation plateau exceeds the oxidation of transition metals to 4+ state, so alternative charge acceptors were necessary.9 Electrochemical activation, mentioned above, proceeds during the voltage plateau above ∼ 4.5 V, believed initially to involve the extraction of Li2O and O2 from the material and the formation of MnO2, upon reduction of which Li+ reintercalation could occur, resulting in the subsequent enhanced discharge capacity.8,9 This was only discovered later to be partially correct, since this process was found to evolve inward from the surface slowly as cycling progresses.58–61 Additionally a slow, irreversible transition metal migration to the Li+ slab occurs at these oxygen deficient sites, since the coordination of transition metals by only 5 O2− ions is instable, this transition metal migration ultimately resulting in a defect spinel phase formation at the surface of the material.62,63 These surface reactions are irreversible, causing the large irreversible capacity loss during this cycle, but additional reversible capacity is made possible through charge acceptance by the oxide itself in the material, described above in greater detail.2,62
Voltage Hysteresis, and Capacity and Voltage Fading
Aside from the surface migration of transition metals to the Li-layer, as described above, toward the end of charge, the Li+ in the Li-layer has been depleted, and a gradual migration of transition metals to the Li+ layer occurs in order to shield the charge between facing O2− slabs.14,39 This migration causes a pronounced voltage hysteresis between charge and discharge cycles, since the material does not revert fully to its initial state until after discharge and the material with transition metal ions in the Li-layer intercalates Li+ at a lower potential than the uncharged material.15–18 Additionally, this transition is evanescently reversible, with some further transition metal ions made inactive and trapped in the Li+ slab with each cycle.15,16,22,64 This is the main cause of the voltage and capacity fade for the material, which results in the loss of high voltage (ca. 3.8 V) Ni2+/4+ and Co3+/4+ redox peaks.15,16,22,64 Moreover, as further transition metals occupy Li-slab sites, Li+ intercalation into the transition metal layer sites becomes more difficult, resulting in a preference for Li-layer intercalation, at the lowest voltage redox couple (Figure 2).15,16,22,64 We present in Figure 3, the individual typical dq/dV plots over prolonged cycling, the discharge capacity calculated from integrating each of the three peaks, and the voltage contribution VContr of each specific peak. Integration ranges were chosen from local minima between peaks and three different cells were averaged to generate standard deviation values. The voltages in Figure 3C were calculated by normalizing average peak voltage by the total discharge capacity:  , where CPeak, is the peak capacity, CTotal is the total discharge capacity, VPeak is the average voltage of the peak.
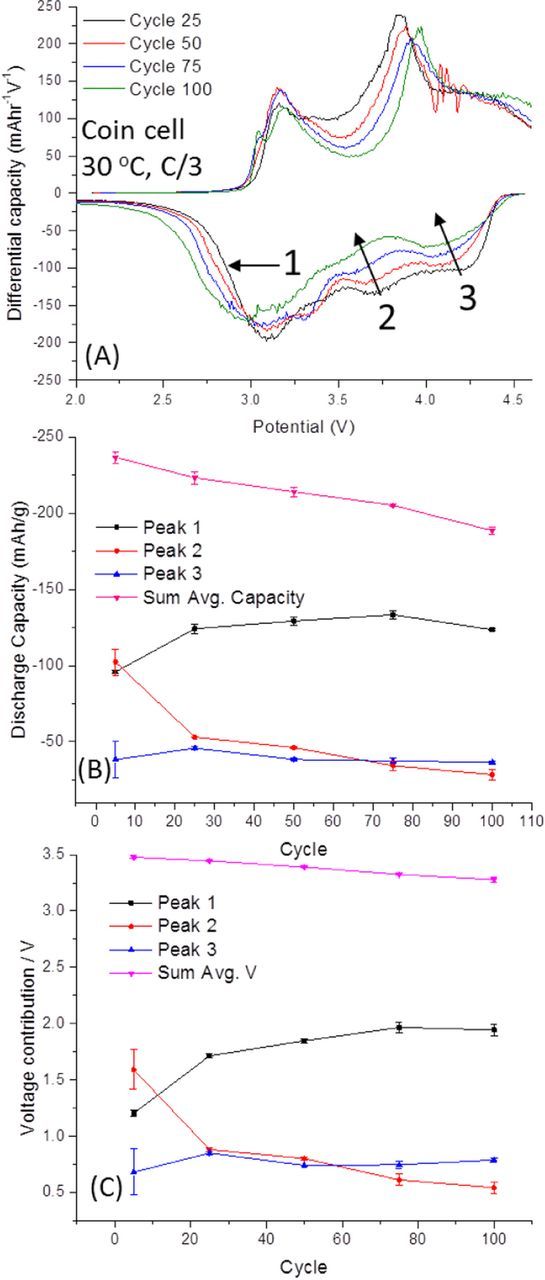
Figure 3. (A) Differential capacity plots for a half-cell using an electrode prepared from a typical Li-rich material, 0.35LiMn2O3·0.65Li[Mn0.45Ni0.35Co0.20]O2, cycled at C/3 during prolonged cycling. (B) The average discharge capacities for the three main reduction peaks taken as average from 3 cells. (C) The individual discharge voltage contribution from the 3 individual redox peaks with the cells average voltage. Coin cells of ∼2.5 mg active material/cm2 cathodes vs. Li, wth 1 M LiPF6 3:7 EC:EMC at 30°C, at C/3 from 2 to 4.6 V.
Figure 3A depicts the dq/dV plot for a typical Li-rich material cycled over 100 cycles. Three main reduction peaks are observed, as described above. The first, labeled 1, corresponds to two peaks for Mn4+/3+ reduction, with Li+ insertion into the transition metal and the Li-layer, as described above.14,39 These peaks have merged and broadened since there is a greater degree of resistance toward Li+ intercalation during discharge because transition metals are still present in the Li+ layer.15,16,22,64 Peak 2 corresponds to TM-layer Li+ insertion for Co4+/3+ and Ni4+/2+ reduction, and peak 3 is O2-x reduction with TM-layer Li+ insertion.14,39 Overall, as Co4+/3+ and Ni4+/2+ become inactive, the Mn4+/3+ reduction peaks become more intense, since more Li-layer Li+ intercalation is then favored. This causes the average capacity and voltage contribution from peak 1 to increase during early cycles while the opposite occurs for peak 2. Not a great deal of capacity or voltage contribution is lost from a diminished O2-x/O2− redox couple. This is in agreement with the observation that oxygen evolution from the material is minimal after initial activation.58–61 Still, between the 75th – 100th cycle, the capacity and voltage contributions from peak 1 are lowered; this peak will include effects from both blocking of the transition metal layer and spinel formation, though the voltage fade from defect spinel formation is minor, with a distinct oxidation peak only visible by the 100th cycle. Early hypotheses that spinel formation was the leading cause of the voltage fade for electrodes prepared from Li-rich materials were likely encouraged by the fact that defect spinel is easily detectable from electron and X-ray diffraction measurements.65 Though spinel formation surely contributes to an average voltage decay, it is far from the sole or even major cause of Li-rich materials' voltage fade.
The average discharge capacity and mean operating voltages for representative Li-rich and Ni-rich material electrodes are depicted in Figure 4. An important note is that while many articles optimistically suggest that Li-rich materials can achieve high discharge voltages, e.g. 3.8 V, Li-rich electrodes are very much constrained by their large charge-discharge voltage hysteresis, and low discharge voltage for Mn4+/3+ reduction, providing an average discharge voltage closer to ∼3.5. This is in contrast to the Ni-rich materials, which can show average discharge voltages ∼3.8 V, as depicted from our data in Figure 4. The low operating voltage of Li-rich materials does not eliminate their commercialization value, since the much lower cost of Mn than Co and even Ni can provide an incentive, even if the materials' energy density is similar to that of Ni-rich materials. Still, Li-rich materials will have to overcome their dramatic capacity and voltage fade during cycling, prior to commercialization. At 3.5 V, Li-rich materials would need to provide ∼220 mAh/g to show higher energy density than Ni-rich materials operating at 3.8 V and 200 mAh/g, a possibility easily within reach as depicted in energy density vs. cycle plots for both materials in Figure 4C.
Stabilization of Voltage and Capacity Fade
Stabilization of the capacity fade for Li-rich materials generally proceeds through a few different options, combinations of all of which may ultimately contribute to a solution for Li-rich cathode materials. One method for the improving capacity and voltage fade can come simply through optimization of the cycling modes with different potential limits (e.g. window opening experiments) and rates for different cycles yielding higher capacities and better cycling stability of the material.12,65–69 Our group has recently discovered an interesting phenomenon, in which activation of Li-rich material during the first two cycles at low temperatures (e.g. 0°C or 15°C) yields ∼10% higher discharge capacities for the subsequent cycles at ambient (30°C) temperatures.70 Figure 5 depicts the cycling data from 0.75Li2MnO3·0.25Li[Mn0.35Ni0.325Co0.325]O2 electrodes activated at either 0 or 30°C. The material in Figure 5 was synthesized by the self-combustion method, in which aqueous solutions of metal nitrates and sucrose are heated to form a precursor that is annealed in air at 900°C. The data in Figure 5 show that low temperature activation can enhance discharge capacities over a wide range of Li-rich material compositions. It has been shown that a stepwise increase of potential limits increases subsequent discharge capacity for Li-rich electrodes.12,65–69 We believe both activation at low temperatures as well as the stepwise potential activation cause a slower activation of the material, resulting in a surface reorganization and a modified electrode/solution interface that improve the materials' capacity.
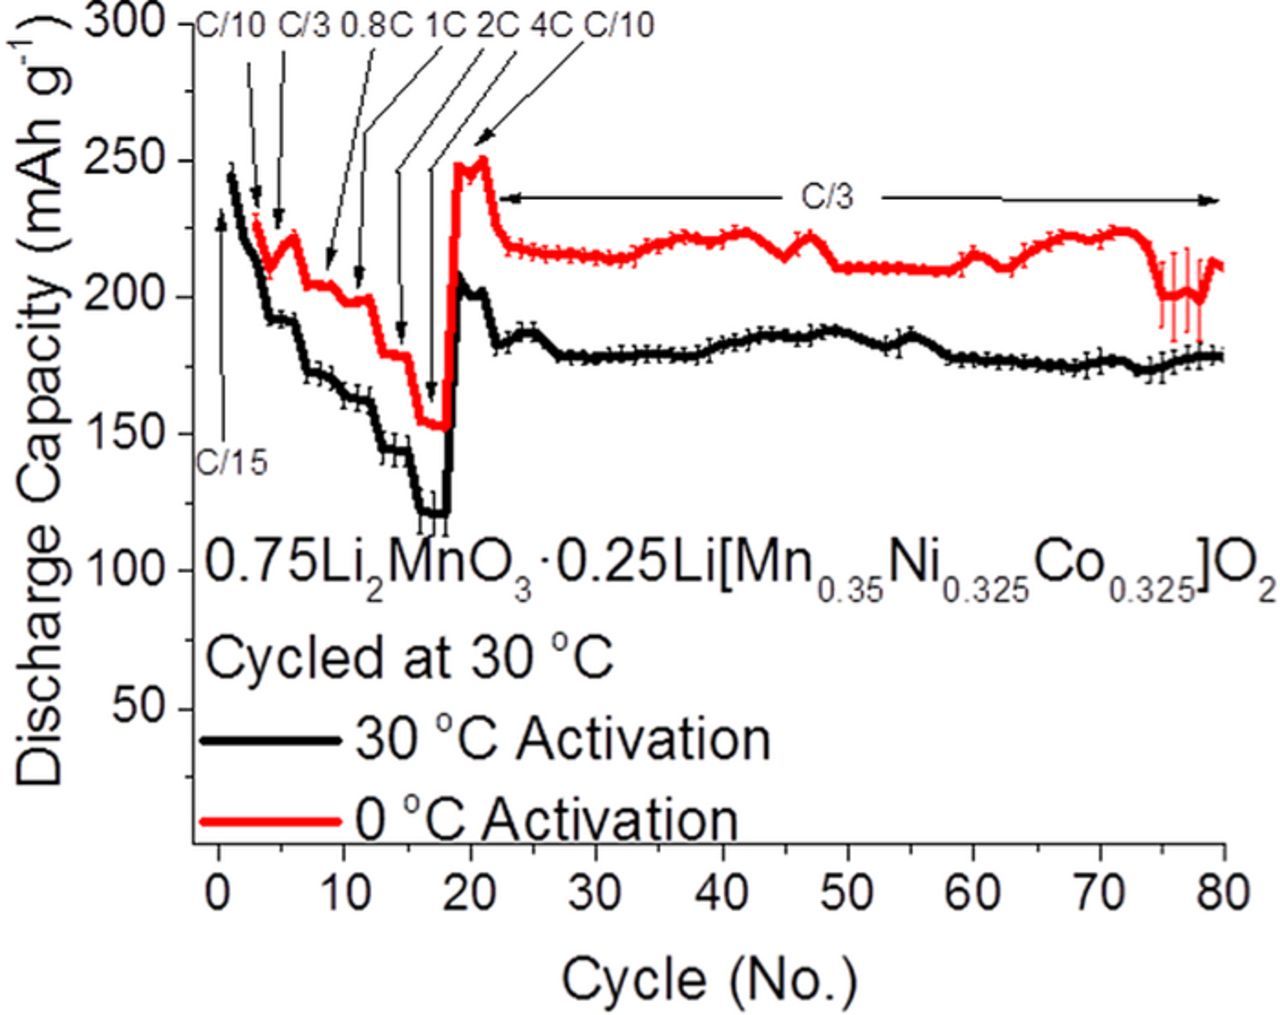
Figure 5. Discharge capacities for representative Li-rich, 0.75Li2MnO3·0.25Li[Mn0.35Ni0.325Co0.325]O2, electrodes in coin cells vs. Li operated at 30°C, when activated at 0 or 30°C. Coin cells utilized ∼2.5 mg active material/cm2 cathodes vs. Li, with 1 M LiPF6 3:7 EC:EMC solution, at C/3 from 2 to 4.6 V. The material was synthesized by the self-combustion method.
Another way to improve cycle stability of Li-rich materials is through the use of alternative electrolyte solutions and additives. One major drawback of the Li-rich materials is that they operate at high anodic voltage limits, where electrolyte solution breakdown occurs readily.4,71,72 Aside from all standard problems for high voltage cathodes, Li-rich materials are also Mn rich, so Mn2+ ion dissolution is a greater problem for Li-rich materials, making Li-rich materials susceptible to HF attack.72 Additionally a sufficiently sturdy cathode surface-electrolyte interphase (SEI) layer can act as a capping agent, diminishing irreversible capacity and O2 evolution from the Li-rich material.
There are as many electrolyte solution additives as organic chemistry is rich, with tunable functionalities such as thermal stabilizers,73,74 fluorinated compounds,75,76 LiBOB derived compounds,77–81 unreactive nitriles82 and sulfones,78 the detail of all far beyond the scope of this focus paper.4,71,72 Our group has utilized LiBOB with Li-rich electrodes to improve charge-transfer resistance and cycle stability of Li-rich electrodes.83
Figure 6 depicts the discharge capacity of a representative Li-rich electrode with and without various concentrations of LiBOB. The discharge capacity of these electrodes are lowered by use of LiBOB, but also stabilized. This stabilization is explained via impedance spectra measurements, which show lower charge-transfer resistance when using electrolyte containing 2% LiBOB (Figure 6B). Clearly from Figure 6, better electrolyte solution systems can be chosen that do not drastically limit initial discharge capacities, but the data suggest that stability enhancements may also come from the use of electrolyte additives.
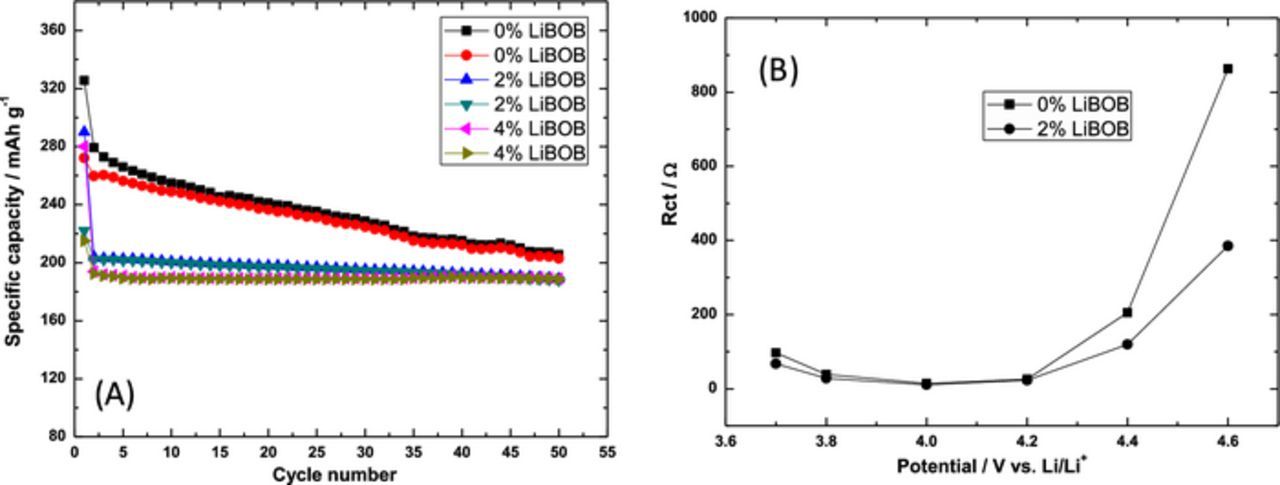
Figure 6. (A) Utilization of LiBOB can improve cycle stability of Li1.2Ni0.16Mn0.56Co0.08O2 electrodes and (B) charge transfer resistance at 45°C and C/10 rates, in coin cells vs. Li, ∼5 mg/cm2 active mass. Impedance spectra were measured at specified potentials (after 5 h potentiostatic steps at each potential), from 100 kHz to 5 mHz, and the charge transfer resistance calculated from the intermediate-to-low frequency semi-circle of the spectra. Electrodes were of the same geometrical area of 1.54 cm2. Reproduced with permission from Ref. 83.
A promising possible treatment to limit voltage and capacity fading is through coatings, which can protect the material against electrolyte-surface reactions, problematic due to the high operating voltages of Li-rich materials.84,85 Also transition metal ion dissolution may be impeded by surface coatings, especially problematic in full cells where TM ions dissolved in the electrolyte solution are reduced onto the graphite anode, where they act as a catalyst for electrolyte solution breakdown and subsequent Li+ inventory loss.86 An additional benefit may come in the form of lower first cycle irreversible capacity, since the coating restricts oxygen evolution and the subsequent irreversible transition metal migration to the Li+ layer, ultimately leading to spinel formation.84 MnO2 coatings may take advantage of these phenomena, since formation of this material occurs at the surface of Li-rich materials during their electrochemical activation step anyways.87–89 Most coatings generally take the form of monovalent oxides, such as Al2O3,84,90 TiO2,84,91 or MgO.92 An interesting coating with promising results came from utilizing a thin film of the olivine cathode material, LiFePO4.93 Another coating with interesting results comes from AlF3, also explored by our group.37,94,95 AlF3 was coated on Li-rich material via pH controlled aqueous solution, and annealed at 400°C.37 The AlF3 coating imparts improved capacity and fading, as well as decreased surface film resistance resulting in lowered charge voltage (Figure 7).37
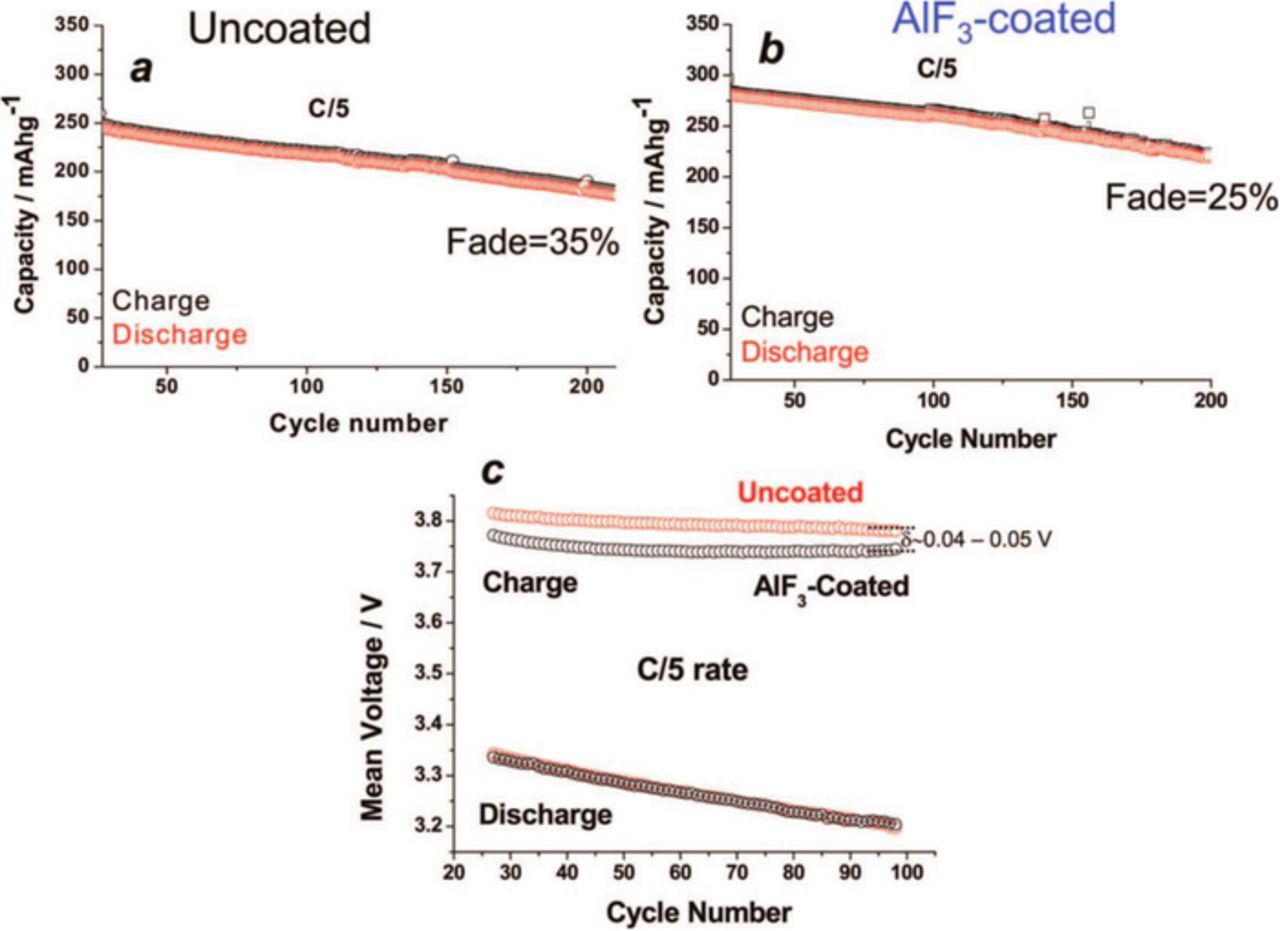
Figure 7. Galvanostatic discharge capacities for representative (a) pristine and (b) AlF3 coated Li-rich materials, cycled at 60°C. (c) The corresponding average charge and discharge voltages for the materials. Coin cells utilized ∼5 mg active material/cm2 cathodes vs. Li, wth 1 M LiPF6 1:1 EC:dimethyl carbonate (DMC) at C/5 from 2 to 4.6 V. First cycles of a rate capability experiment are omitted. Reproduced with permission from Ref. 37.
A final and the most promising candidate to limit transition metal migration to Li-layer during later cycles (or improve its reversibility), is through the use of doping. Many groups dope cathode materials with different elements such as Al3+,96,97 Mg2+,97 Mo6+,98 Y3+,99 Zn2+.97 Doping may alter the electronic structure of the material, enhance the materials' c-lattice parameter to improve rate-capabilities and act as a pillar to stabilize the structure of the material.96–99 Our group has explored doping of Li-rich materials with Al3+, performed during self-combustion synthesis.96 Figure 8A depicts an EDX line scan of an Al-doped, Li-rich Li1.2Ni0.16Mn0.56O2 particle, showing uniform Al distribution. Voltage profiles of the pristine material and 5% doped material are depicted in Figures 8A–8C. Doping decreases the initial capacity of the material but improves stability, with the doped material performing better by the 50th cycle. Additionally, the average discharge voltage of the material is improved by Al-doping (Figure 8D).
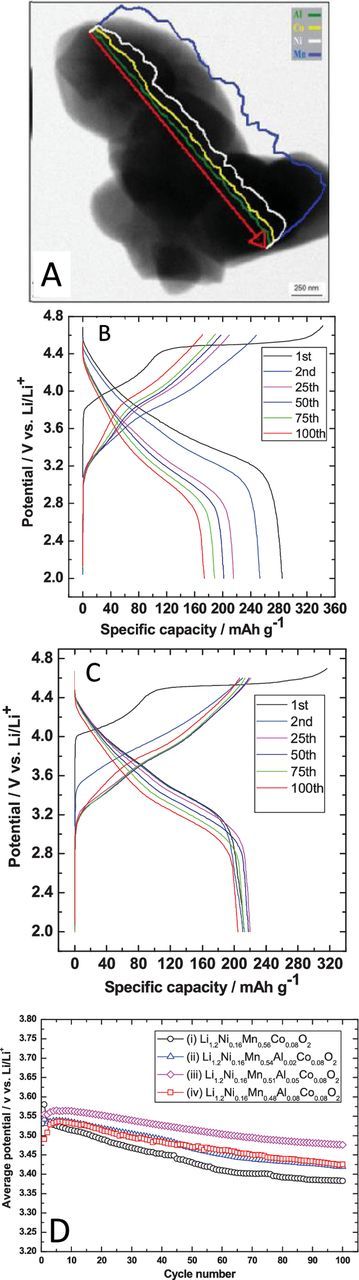
Figure 8. (A) EDX line scan showing that Al doping of a Li-rich material is uniform throughout the entire particle. Voltage profiles over cycling for a (B) pristine Li-rich material and (C) a 5% Al doped Li-rich material. (D) Average discharge voltages for Al doped and undoped Li-rich materials.96 Coin cells utilized ∼5 mg active material/cm2 cathodes vs. Li, with 1 M LiPF6 1:1 EC:DMC at C/10 from 2 to 4.6 V. First cycle was performed from 2 to 4.7 V. Reproduced with permission from Ref. 96.
Conclusions
The understanding of the mechanism behind the high discharge capacity and the capacity and voltage fade of Li-rich materials has advanced dramatically during the last few years. Previous consensus had developed around the layered-to-spinel transition as the leading cause of the voltage fade; though spinel formation was a contributor to the voltage fade, it was found to be dwarfed in its role by inactivation of transition metal ions and the blocking of Li+ transition metal layer intercalation sites. No doubt this further understanding of the material can lead to improved, intelligent design of fading mitigation techniques. Our group will focus on electrolyte solutions, surface coatings, and doping for stabilization treatments. Additionally, a further understanding of the role of anionic redox has opened a whole field for advanced material exploration, which may provide alternative cathodes that outperform Li-rich materials.