
Abstract
To obtain information about the Li-S reaction mechanism through spectroscopy, a Raman literature study, polysulfide vibrational mode calculations and experimental in-situ measurements were performed. A special test cell was constructed to examine in-situ Raman spectra in the spectral range from 100 cm−1 to 600 cm−1 during charge and discharge in the voltage range of 1.5 V to 3.0 V. In order to assign the in-situ Raman data and to support the interpretation of the observed changes in the overall Raman-spectrum, several reference measurements on well-defined substances were conducted. The reference measurements included pure solvents, electrolytes and polysulfide solutions prepared from stoichiometric mixtures of S8 and Li2S powders. The assignment of the observed Raman-spectra was further based on a comparison with purely theoretical data for the vibrational modes of the polysulfide di-anions Sn2− and radical mono-anions Sn− calculated at the B3PW91/6–311G(2df,p) level of density functional theory (DFT). The DFT data for the vibrational spectra, corrected for solvent effects in the framework of the polarizable continuum model (PCM), allowed an identification of several characteristic features in the in-situ Raman spectra.
Export citation and abstract BibTeX RIS
Li-S cells are potential next generation batteries with practical energy densities of up to 500 Wh kg−1 on cell level. The complex reaction mechanism seems to depend on the type of electrolyte used in the cell and is likely to comprise both polysulfide disproportion and to some degree gradual polysulfide chain length reduction with retention of the polysulfide concentration.1 The dependencies between the reaction mechanism and the utilized electrolyte solvent have been reviewed in a recent publication.2 Standard electrolytes based on ethers like Dimethoxyethane (DME), Dioxolane (DIOX), Tetraethyleneglycodimethylether (TEGDME) and further,3–5 sulfolane6 or sulfones7 typically show two discharge voltage plateaus at ∼2.3–2.4 V and ∼2.1 V respectively. The high voltage plateau corresponds to the reduction of S8 to highly soluble long chain polysulfides which easily disproportionate, but also detach and are able to further reduce elemental sulfur. The second discharge plateau corresponds to the reduction of less soluble medium chain polysulfides as well as insoluble short chain polysulfides (Li2S2, Li2S).
During charge, medium chain polysulfides are oxidized to long chain polysulfides which enter the reaction with short chain polysulfides, thus creating medium chain polysulfides. After the short chain polysulfides are consumed, long chain polysulfides are oxidized to elemental sulfur to some degree, precipitating on the positive electrode.1
The best electrochemical results regarding sulfur utilization and especially high current densities are achieved with ether based electrolytes explaining their utilization in almost 74% of 85 recent Li-S publications (Fig. 1) with liquid or gel type electrolytes.
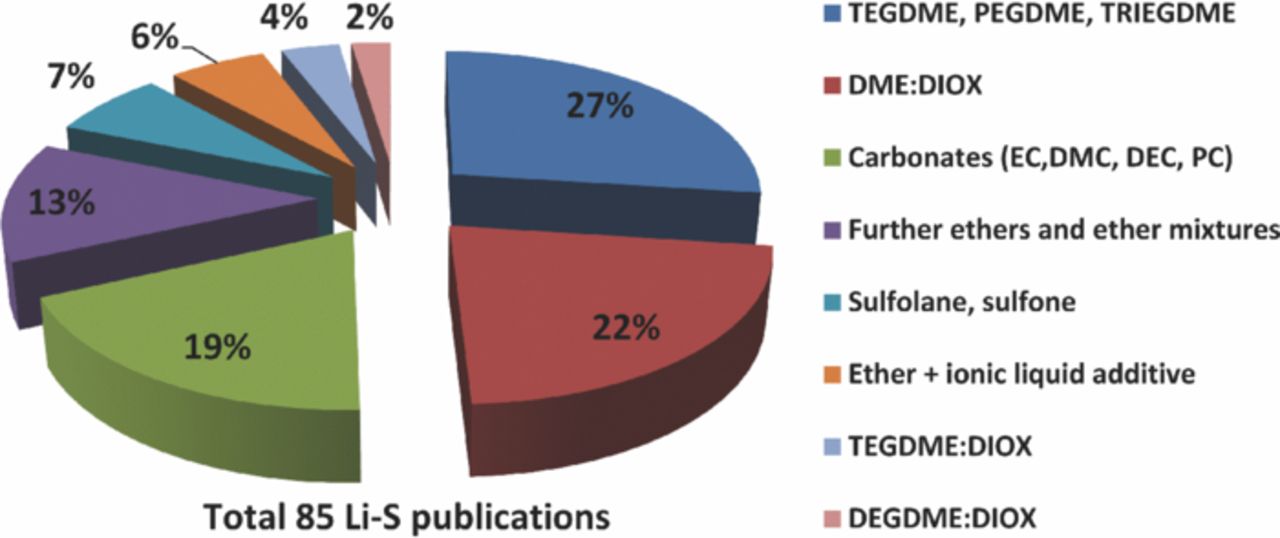
Figure 1. Solvents used in Li-S electrolytes; DEGDME: Diethyleneglycol dimethylether, TRIEGDME: Triethyleneglycol dimethylether, PEGDME: Polyethyleneglycol dimethylether, EC: Ethylene carbonate, DMC: Dimethyl carbonate, DEC: Diethyl carbonate, PC: Propylene carbonate.
Elemental sulfur and polysulfides are strongly Raman active, making the Raman technique an interesting tool for the investigation of the reaction mechanism. Nevertheless, Raman spectroscopy was mainly used in past Li-S publications to examine the components of the sulfur electrode or to provide information about the synthesis process and electrode structure.8–14 An exception is the work of Diao et al. who used (ex-situ) Raman, FTIR and XPS to identify the LiNO3 additive and electrolyte-electrode decomposition products.15 Yeon et al. examined the lithium metal anode, the sulfur cathode and polysulfides by ex-situ Raman and XRD.16 Since several polysulfides easily disproportionate or are in equilibrium, we suppose that ex-situ techniques are suitable to identify certain reaction products such as elemental sulfur deposited on the electrode surface or insoluble components such as Li2S or Li2S2, but are insufficient to examine the mechanisms by which polysulfides are formed in the electrolyte during charge and discharge of the cell.
Raman data of polysulfides can be found in Refs. 17–34 and data of polysulfides in various solvents are given in Refs. 35–44. The positions of the polysulfide Raman lines depend on temperature, solvent and the polysulfide anion38 and can vary several cm−1 for the same polysulfide species. Characteristic polysulfide Raman position lines can be found in the area between 400 and 500 cm−1 (S-S stretch vibration) and below 250 cm−1 (bending and torsional modes). Experimental Raman data obtained from crystalline solids are not necessarily helpful for the interpretation of Raman lines of solvated polysulfide anions, since the solid-state spectrum of the former is influenced by reciprocal effects with the cations in the crystal lattice. Through polarization of the anion within the crystal lattice, it is possible to observe Raman line displacements which do not exist in polysulfide solutions.42 Local symmetry effects within the lattice can even increase the number of Raman lines in the solid state spectra compared to spectra obtained from solutions: Prominent examples include the solid state Raman spectra of crystalline Li2S and Li2S2 with one (Li2S) or two (Li2S2) Raman lines as reported in the literature even though the anions have no (S2−) or only one (S22−) fundamental vibrational mode.15,16 Furthermore, lattice effects can force the anion into conformations that only have insufficient concentrations in solution. One example is the local C2 symmetry of the pentasulfide anion (S52−) in K2S5.45
Additionally, oxidation conditions immediately lead to the creation of oxy-sulfur compounds30 from polysulfides making the chemistry even more complex. Valuable physical and chemical information about solid and liquid sulfur can be found in Ref. 46.
Experimental
Preparation of binder-free carbon nano tube (CNT)-electrodes
Gas diffusion layers (GDL) or Ni foam were used as substrate for the growth of CNTs by a CVD process. The detailed CNT coating procedure and the sulfur infiltration is described in Refs. 47–49. The rectangular electrodes had a size of approximately 0.9 cm2. The polypropylene separator with about 2.0 cm2 overlapped the electrodes.
Raman in-situ test cell
The stainless steel test cell housing for the in-situ cell consists of a rectangular chamber with two windows and cylindrical parts at the ends. Stainless steel contacts with spring guides sealed the cell from both sides with two O-rings. The latter additionally prevented electrical contact, isolating the cell housing from the stainless steel contacts. Four microscope glass slides with 0.125 mm thickness were cut and put inside the cell housing and glued to the latter from outside. By this way the electrolyte could not get in contact with the glue. The four glass slides also isolated the electrode stack from the housing. The rectangular electrodes and separator cut by a special designed punch hole were placed in the chamber and contacted by stainless steel bars. A guided spring led to a defined pressure on the electrode stack. The test cell is shown in Fig. 2.
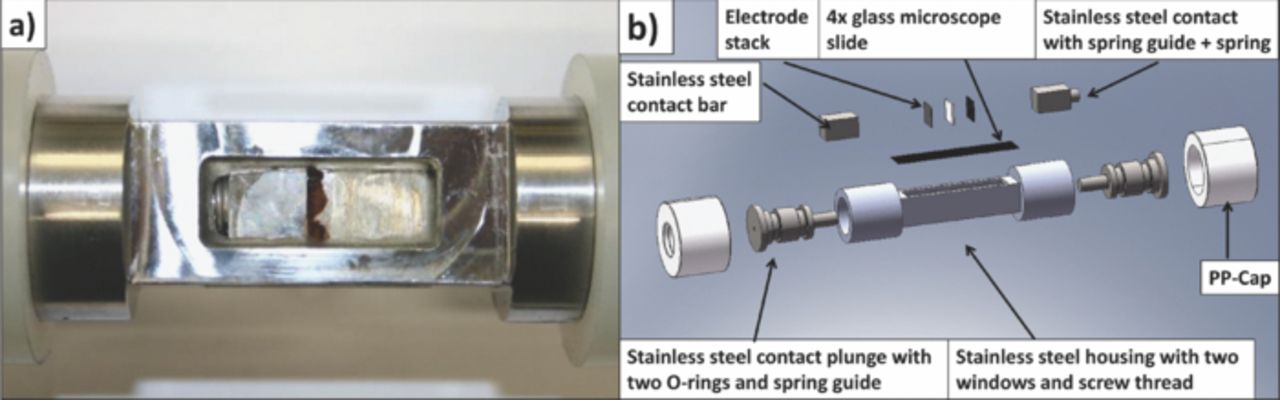
Figure 2. Raman in-situ cell a) Photo on cell window with electrode stack and b) drawing and assembly.
Cell assembly and analysis
All tests were conducted against metallic lithium (SA, 99.9% purity) as counter electrode. The lithium was scraped with a ceramic knife to remove surface layers and afterwards pressed through a calendar to obtain a homogeneous and reproducible surface. Commercial polypropylene separators with a thickness of around 25 μm and an average pore size of around 40 nm were used. As electrolyte 0.7 M lithium bis(trifluoromethanesulfonyl)imide (LiTFSI, SA, 99.95%) in DME:DIOX (2:1, v:v) (SA, anhydrous, 99.5% and 99.8% with 75 ppm butylated hydroxytoluene (BHT inhibitor) + 0.25 M/L LiNO3 (ABCR 99.98%) was used. The assembly of the test cells was done in an argon-filled glove box (MBraun) with an O2 and H2O content below 1 ppm.
Characterization methods
- The used cycle station was a Solartron ModuLab with "Cell Test" software. The Raman in-situ test cell was cycled between 1.5 and 3.0 V with a constant current of 0.56 mA cm−2 (C/7.5). The sulfur load was 5.1 mg cm−2.
- Raman measurements were made with a Horiba Jobin Yvon HR800. The in-situ test cell was fixed on a sample holder connected to the movable sample table which could be adjusted with 0.1 μm accuracy. The in-situ Raman spectra (Fig. 7) always show the Raman lines of exactly the same measurement point in the vicinity of the electrode surface such that Raman signals originating from species solvated in the electrolyte can be observed together with Raman signals originating from the electrode surface itself. Raman signals originating from the electrode surface include those bands due to fully oxidized S8 and those bands due to insoluble products precipitating on the electrode, namely Li2S and Li2S2. A red HeNe laser with λ1 = 632.8 nm and 20 mW with 100x objective was used. Raman measurements of the high purity solvents (+ polysulfides), salts, electrolytes and sulfur were made in a cuvette with Teflon (PTFE) fiber sealed screw thread.
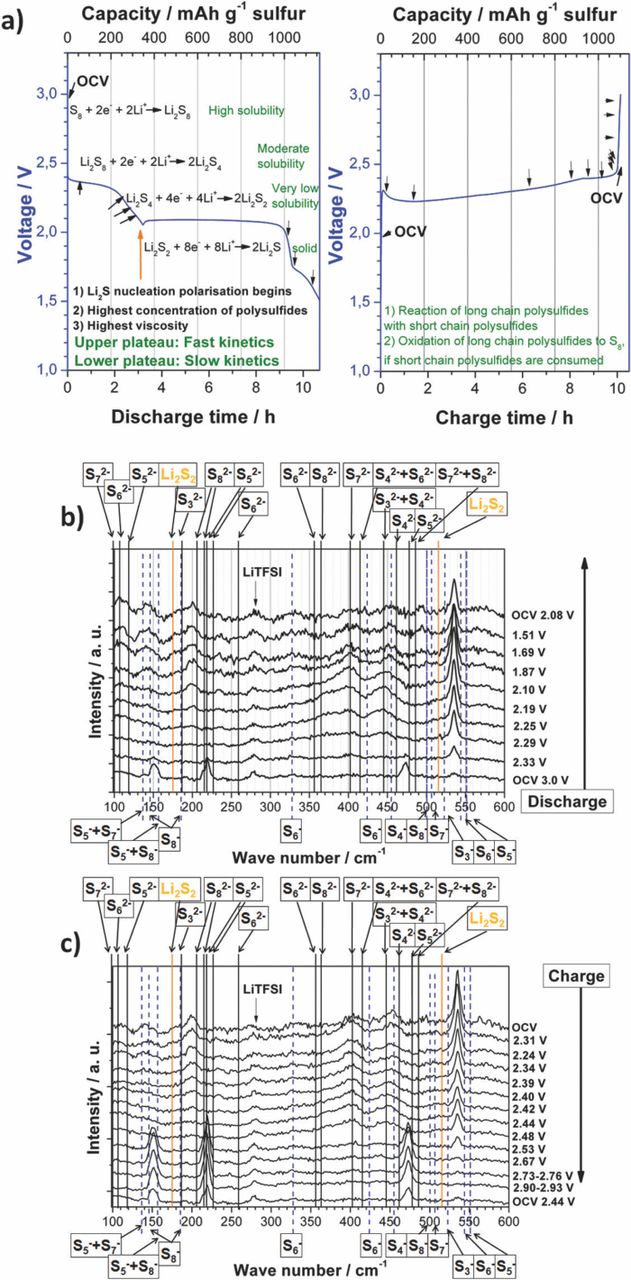
Figure 7. Raman in-situ measurement of a Li-S cell with 4.6 mg sulfur a) cycling current plot with indicated measurement points, left: Discharge,57 right: Charge1 b) discharge spectra at various voltages c) charge spectra at various voltages. Theoretical (DFT) Raman line positions of in THF solvatized polysulfide radical mono- and di-anions are indicated.
The purities were: DME (SA, anhydrous, 99.5%), DIOX (SA, anhydrous 99.8% with 75 ppm BHT inhibitor), TEGDME (SA, 99%), tetrahydrofurane (THF, Roth, 99.9%) LiTFSI (SA, 99.95%), lithium trifluoromethanesulfonate (LiTFS, SA, 99.995%), Li2S (Alfa Aesar, 99.9%, metals basis), sulfur (SA, >99.5%, purum p.a.), LiNO3 (ABCR 98%; anhydrous, metals basis).
Preparation of reference polysulfide solutions
Polysulfide reference solutions ("Li2S8", "Li2S6" and "Li2S4") were prepared by mixing Li2S and S8 powder in the particular stoichiometric proportions. The powder mixture was then added into an air sealed and solvent (TEGDME, DME, DIOX, THF, electrolyte) filled cuvette, which included a small magnet stirrer. After one night of stirring, Raman spectra were recorded (Fig. 5). The resulting solutions provide reference systems containing mixtures of polysulfides in equilibrium with the intended overall stoichiometry. Specifically, the reference solutions contain anionic polysulfide species with different chain lengths resulting from disproportionation reactions in equilibrium.30 It is thus not possible to prepare solutions containing a specific polysulfide anion with a single, uniquely defined chain length. Reference Raman spectra attributable to polysulfide dianions (or monoanions) with a unique chain length are obtainable by theoretical means only. In the present work, theses reference spectra are obtained by density functional (DFT) calculations of the respective mono- and dianions.
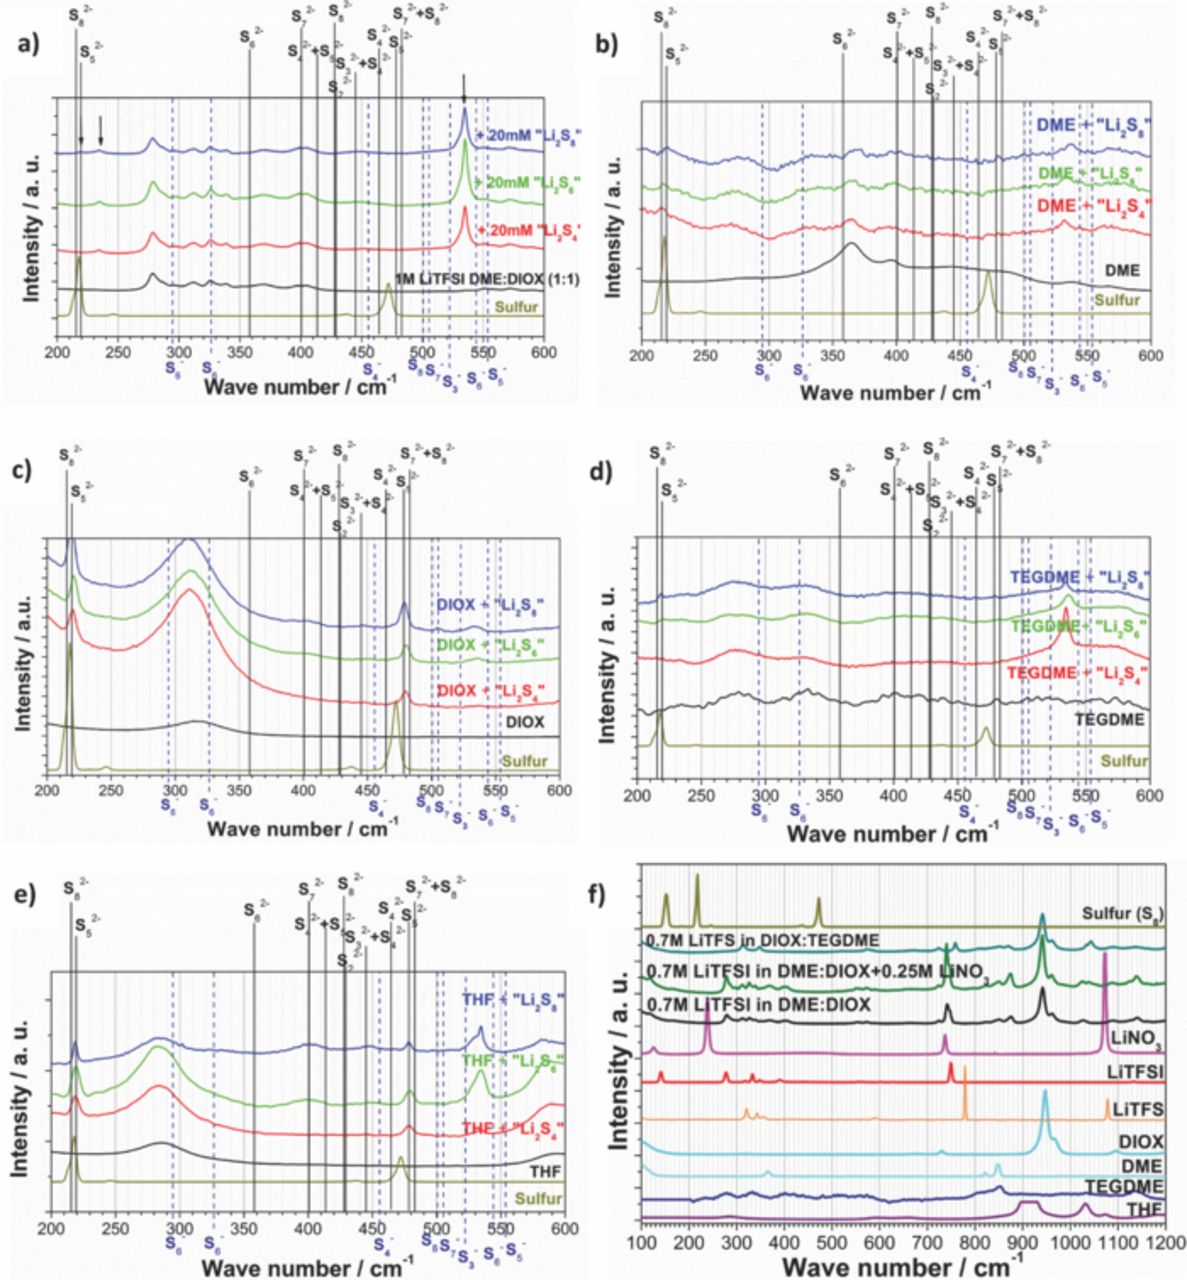
Figure 5. Raman measurements of various solvents, salts, sulfur and electrolytes including polysulfides a) 1M LiTFSI in DME:DIOX, b) DME, c) DIOX, d) TEGDME, e) THF; f) various solvents, salts, electrolytes and sulfur. Theoretical (DFT) Raman line positions of in THF solvatized polysulfide radical mono- and di-anions are indicated.
Results and Discussion
Calculation of polysulfide raman lines
The interpretation of the experimental in-situ Raman spectra in terms of contributions attributable to individual reduced sulfur species in the electrolyte solution or due to solid-state precipitates at the electrode surface poses several difficulties: As reviewed in,30 pronounced differences in Raman-spectra can be expected depending on the chain-length of the polyanions but additionally due to different rotational isomers. Experimental Raman data for individual polysulfide anions used for peak-assignment by comparison have often been obtained from crystalline samples. In these solid-state spectra, Raman signals originating from lattice vibrations are observed together with peaks due to the typical S-S stretching or bending and torsional modes of the anion. Additionally, the local symmetry around the anion as well as the polarization of S-S bonds induced by counterions in the lattice can decisively shift the Raman peaks and even lead to band splittings not observed in solution as shown by Jaroudi and coworkers.43,50 In some cases, lattice effects even result in anion conformations which are unfavorable in solution. One example are the rotational isomers of S52− which have local CS (Na2S2) or C2 (K2S2) symmetries, depending on the counterion in the lattice.30 The latter isomers can be distinguished by their respective Raman fingerprints. It should be noted that polysulfide anions with a precisely defined chain length cannot be prepared in solution for reference measurements since disproportionation and redox-reactions result in a distribution of several polysulfide chain lengths. The resulting Raman spectra are thus not representative of a polysulfide anion with a unique chain length corresponding to the overall stochiometry.
In the present work, theoretical Raman spectra based on quantum-chemical calculations on reduced polysulfide di-anions Sn2− as well as on the sulfur radical mono-anions Sn− with n = 3–8 are used to establish an independent means to aid the assignment of the in-situ spectra. Since both Li2S and Li2S2 are merely insoluble in the electrolyte used in the present study, the corresponding Raman spectra measured at the end of the charge cycle with short-chain sulfides (n≤2) are to be compared to the respective solid-state spectra obtained from crystalline samples. In both cases, lattice effects will influence the Raman signals as described above which is not the case for the solvated polysulfide species with n≥3.
Quantum-chemical calculations on sulfur-rich compounds including polysulfide di-anions and radical mono-anions were reviewed by Wong.53 In solution, polysulfides predominantly form linear, unbranched chains. The symmetry of the latter varies between C1, C2 and Cs, depending on the S-S-S-S torsional angles along the chain, which are typically close to 110°. The order of the sign of the torsional angles along the chain defines the 'motif' of the anion which determines the Raman band positions, intensities and selection rules.30 It is well documented that DFT-methods, especially those involving hybrid functionals yield reliable equilibrium structures and vibrational frequencies for sulfur-rich compounds, even though care must be taken when interpreting calculations with insufficiently large basis sets.
All our calculations were performed with the Gaussian03 program package.51 For each individual chain length from n = 3 to n = 8 (anions and radical anions respectively), we first generated starting structures for all diastereomeric conformations (motifs) resulting in distinct vibrational spectra based on symmetry considerations†. The total number of diastereomeric conformers increases swiftly with the chain length: For the shorter chains such as S32− and S42− there is only one relevant conformer, S52− has two diastereomeric conformers. S62−, S72− and S82− have 3, 6 and 10 conformers respectively. The initial molecular structures were fully optimized at the B3PW91/6–311G(2df,p) level of theory in vacuum, which also includes diffuse functions as found essential by Ref. 53. This level of theory was also used to calculate the vibrational wavenumbers, zero-point corrections to the energy and thermal energies including the Gibbs free energy. Following the initial refinement in vacuum, we modeled solvent effects on the vibrational spectra for THF within the framework of the polarizable continuum model (PCM) by further refinement using the B3PW91/6–311G(2df,p) + PCM (THF) level of theory as implemented in Gaussian03. Within the PCM model, solvation is simulated as an infinite polarizable continuum (the solvent) surrounding a molecular-shaped cavity (the solute). PCM produces the sum of the electronic energy of the solute and the Gibbs free energy of the continuum solvent.52
Since the total Raman spectrum for an individual polysulfide chain with fixed chain-length represents a superposition of the Raman spectra of all individual motifs (conformers) present in solution, the Gibbs free energy of all contributing conformers at 298.15 K was evaluated. The total Raman spectrum for an individual polysulfide chain length is then obtained as Boltzmann-averaged superposition of the Raman spectra of all contributing conformers according to their respective free energy differences. Following Ref. 54, all DFT calculated peak positions are uniformly corrected by a scaling factor of 0.9573 for the B3PW91 functional. Fig. 3 and Fig. 4 show the resulting theoretical Raman spectra for the di-anions and radical mono-anions respectively. Raman lines are uniformly broadened by a Lorentzian lineshape with a finite width at half maximum (FWHM) of 10 cm−1 to aid the visualization of the spectra. Individual Raman bands of all contributing conformers are indicated by vertical lines.
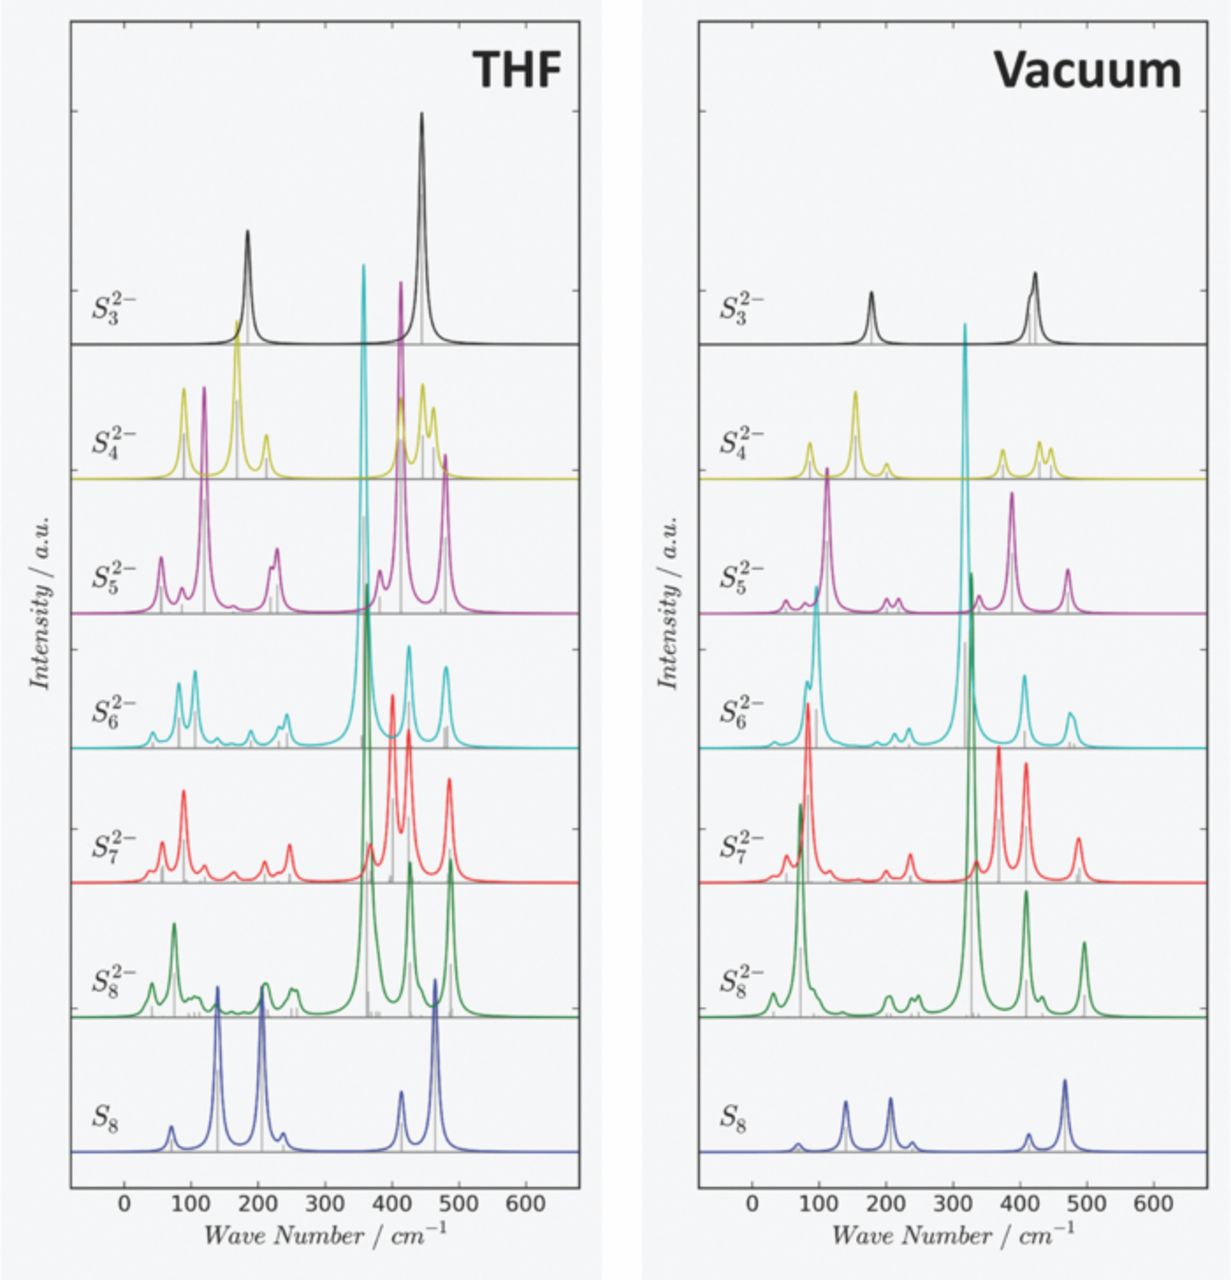
Figure 3. Theoretical (DFT) Raman-spectra of individual polysulfide di-anions Sn2− in THF (Left) and in vacuum (Right) evaluated as a superposition of all Raman-spectra of contributing conformers (motifs) at 25°C. The calculated Raman-spectrum for S8 is given as reference.
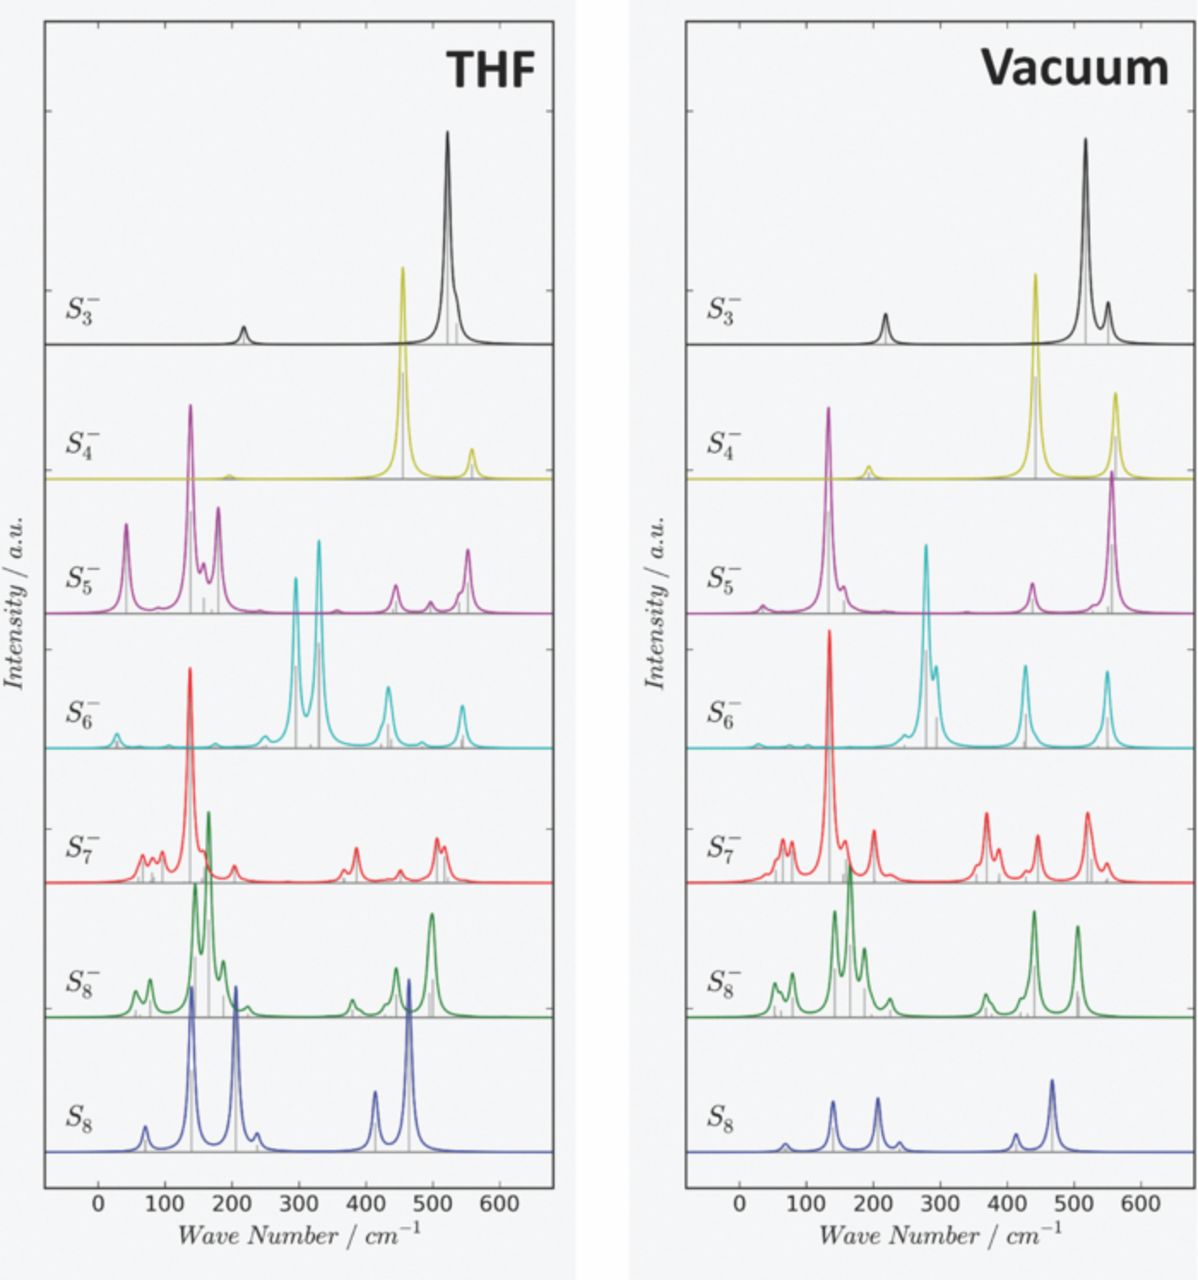
Figure 4. Theoretical (DFT) Raman-Spectra of polysulfide radical mono-anions Sn− in THF (Left) and in vacuum (Right) evaluated as a superposition of all Raman-spectra of contributing conformers (motifs) at 25°C. The calculated Raman-spectrum for S8 is given as reference.
Considering the free energy differences between individual conformers (motifs) in THF solution, it was discovered that the fully stretched, helical chains (chainlike twisted structures) dominate the Raman spectra of the small chain lengths polysulfide di-anions Sn2− with n≤6 at 298.15 K. For di-anions with longer chain lengths, such as S72− and S82−, significant contributions from other conformers were found: In the case of S72−, conformations other than the fully stretched one contribute approximately 8.7% to the overall Raman spectrum while for S82−, such contributions amount to 22% of the final spectrum. The contribution of non-helical chains to the Raman-spectra is even more pronounced for the radical mono-anions Sn−, especially for the longer chain radical mono-anions. The fully stretched conformer becomes less stable compared to other conformers for Sn− with n≥5 in THF solution. It is clearly visible that the solvent modeled within the PCM-framework has an effect on the Raman lines which can range from some slight shifts in peak positions (i.e. in S8−) to the resolution of accidentally degenerated Raman lines.
For the polysulfide di-anions Sn2−, three groups of Raman-peaks related to S-S stretch vibrations can be distinguished in the region 350 cm−1 to 500 cm−1. These modes involve the central S-S linkage and terminal S-S linkages respectively (Fig. 3) with the terminal modes always shifted to higher wavenumbers. Interestingly, a systematic variation in Raman intensities was found for the symmetric S-S vibration belonging to the central S-S linkage which is predicted to be rather intense for chains with an even number of atoms. The corresponding peak positions for the central S-S vibration are 413 cm−1 (S42−), 357 cm−1 (S62−) and 362 cm−1 (S82−) in THF solution. Symmetric and antisymmetric terminal S-S modes are observed at higher wavenumbers. For the short lengths radical mono-anions Sn− (Fig. 4) we note a systematic shift of the symmetric and antisymmetric terminal S-S modes toward higher energies. Compared to the di-anions, the Raman lines of the radicals are observed at higher wavenumbers in the region above 500 cm−1 in THF solution. The corresponding peak positions for the highest energy S-S vibrations above 500 cm−1 are 558 cm−1 (S4−), 552 cm−1 (S5−) and 542 cm−1 (S6−).
Summary of observed and calculated Raman peak positions
An overview of Raman assignments for the various polysulfide anions and radicals is given in Table I. together with other Raman bands important for the interpretation of the Li-S in-situ data. The table includes Raman signals attributable to solvents commonly used as a basis for electrolytes and data for crystalline polysulfide samples. As discussed above, the novel in-situ technique developed in the present work records Raman signals originating from polysulfides, electrolyte and as well as signals due to solid state precipitates on the electrode (Li2S, Li2S2). The values provided in Table I can be used to interpret the measured spectra and give a good overview concerning Raman measurements in Li-S cells.
Table I. Vibrational frequencies and assignments to relevant Li-S cell species, calculated values in THF solvent, experimental and literature values. PAN-S: Polyacrylnitrile-sulfur composite cathode; HMPA: Hexamethylphosphoramide, DMF: Dimethylformamide, own exp.: own experiments, s: solid, l: liquid, S-S: sulfur-sulfur bond, C-S: carbon-sulfur bond; Local symmetry of the vibrations: νs: Symmetric stretch vibration, νA: Antisymmetric stretch vibration, δ: Bending mode; Intensity: w = weak, m = medium, s = strong, vs = very strong. Polysulfide species being suitable for in-situ Li-S cell interpretation are highlighted.
| Raman spectrum, cm−1 | |||
|---|---|---|---|
| Assignments | Own calculation solvatized in THF / own measurements | Literature values + source | |
| S8 (solid) | own exp. | 472vs, 437m, 246m, 218vs, 185m, 151vs, 87vs | 47546,8–14 |
| S8 (solv.) | 474vs, 437vs, 249m, 222vs, 188m, 155vs | - | |
| S2− | in vac. | 560m | 589 (NaI),36,37 594 (KI),52 577 (calc.)39 |
| S3− | in THF | 535 υs(SS), 522m υa(SS) , 217w δ(SSS) | 543 (KI),52 549 (NaI),37 535s, 232 in HMPA,19 540;23 534 (solid),53 535 (S3− in Li2S4 or Na2S4 in NH3),38 535 in DMF37 |
| S4− | in THF | 558m υs(SS, terminal), 500w, 455vs υs(SS, central), 196w, 107w, 61w | 518w, 439m, 384s (in DMF);36,37,32 |
| S5− | in THF | 552s, 539m, 497m, 473vw, 445, 440m, 357w, 353w, 242w, 217w, 179s, 170m, 158s, 138s, 89w, 50w, 44w, 42s | - |
| S6− | in THF | 544s, 484w, 434s, 423w, 329vs, 295s, 251w, 221w, 175w, 130w, 62w, 61w, 27m | - |
| S7− | in THF | 609m, 517m, 506m, 492m, 452w, 434w, 386m, 368w, 232w, 204w, 201w, 158w, 155w, 137s, 96m, 80m, 66m | - |
| S8− | in THF | 500m, 495w, 445m, 437w, 429w, 391w, 380w, 224w, 216w, 196w, 187m, 165s, 157, 145m, 78m, 62w, 56w, 55w | - |
| S2− | - | - | 372,6w (Li2S (+paraffine)),35 37816 |
| S22− | in vac. | 392 | 473 (BaS2),36 451 (ß-Na2S2),36,42 174 δs, 514 υs(SS),15 476, 469, 462, 454, 148, 118, 87 (K2S2 in NH3)43 |
| in THF | 428 | ||
| S32− | in THF | 444s υa(SS) and υs(SS) 184s δ(SSS) | 466s, 238m (K2S3) or 476–479s, 458m, 238w (Na2S3, BaS3) [36, 42, 43], 479, 460, 256 (Na2S3 in NH3) [43] |
| S42− | in THF | 462s υs(S-SS-S, terminal), 445s υa(S-SS-S, terminal), 413s υs(SS-SS, central), 212m, 168s, 89s | 482s, 445m;36 (Na2S4): aqueous: 484, 446, 410, 256, 194, 144; polycrystalline: 962, 935, 923, 883, 876, 482, 468, 445, 440, 239, 206, 171, 151, 97, 83, 48;42 (Li2S4 in NH3, 293K): 430vs, 188vs, (Na2S4 in NH3, 293K): 437vs, 191vs38 |
| S52− | in THF | 479s, 473w, 413s, 381w, 228m, 219m, 119s, 86w, 54m | 496m, 432s, 252m (K2S5),40 (Na2S5)42 |
| S62− | in THF | 482m υs(S-SSSS-S, terminal), 479w υa(S-SSSS-S, terminal), 426m υs(SS-SS-SS), 425m υa(SS-SS-SS), 358s υs(SSS-SSS, central) 243w, 230w, 189w, 106m, 82m, 56w, 43w | 453m, 373s, 358m, 337m, 254m (K2S6)40 |
| S72− | in THF | 486s υs(S-SSSSS-S, terminal), 484w υa(S-SSSSS-S, terminal), 429w, 424s 401s, 368m υs(SSSS-SSS), 247m, 246m, 210w, 165w, 92s, 88w, 55m, 43w, 37w | - |
| S82− | in THF | 487s, 486m, 443w, 427s, 426m, 381w, 362s, 258m, 250m 214m, 208m, 142w, 96w, 75s, 64w, 41m, 33w, 31w | - |
| S-S | - | 460m (PAN-S)12 | |
| Ring S-S | - | 1151w, 1143w, 1052w, 932m, 926m, 919w (PAN-S)12 | |
| C-S | - | 182s, 176m, 161w (PAN-S)12 | |
| C-S (in plane bending) | - | 308w, 298m (PAN-S)12 | |
| C-S (deformation) | - | 378s, 370m (PAN-S)12 | |
| C-S (stretch) | - | 905vw, 797vw (PAN-S)12 | |
| Sulfone, S2O32- | - | 663 δs(S=O), 1271 υa(S=O), 1017 υs(S−O) 1104 υs(S=O),15 | |
| ROLi | - | 911 δ(Li-O), 1017 υs(C-O), 1104 υas(C-O)15 | |
| HCO2Li | - | 911 δ(Li-O), 1454 υs(COO-), 1609 υas(COO-)15 | |
| NO2 | - | 1374 υs(NO)15 | |
| S3N− | - | 894m, 686s, 574vs36 | |
| S4N− | - | 892w, 710vs, 592s, 570s36 | |
| "Graphite, CNT" | - | 1350s (crystal disorder), 1585s (in plane C-C vibration), single wall CNT: Split of G peak in 1570s and 1590s;55,56 | |
| LiTFSI (s, ∼20°C) | own exp. | 1248m, 749s, 390w, 348w, 333m, 318w, 278m, 140s | - |
| LiTFS (s, ∼20°C) | own exp. | 1256w, 1077m, 778s, 356w, 342w, 320m | - |
| LiNO3 (s, ∼20°C) | own exp. | 1386m, 1071s, 738m. 238s, 126w | - |
| TEGDME (l, ∼20°C) | own exp. | 1474s, 1453s, 1297m, 1284m, 1244m, 1130m, 854m, 334m, 279m | - |
| THF (l, ∼20°C) | own exp. | 1489s, 1477s, 1451s, 1367w, 1335w, 1232s, 1183m, 1073m, 1023s, 911vs, 658m, 590m, 285m | - |
| DME (l, ∼20°C) | own exp. | 1470m, 1450s, 1302w, 1282w, 1247w, 1155w, 1130m, 847s, 820s, 396m, 364m | - |
| DIOX (l, ∼20°C) | own exp. | 1513m, 1486m, 1239m, 1097m, 967m, 947s, 730m, 100s | - |
| Sulfolane (l, ∼40°C) | own exp. | 1452m, 1418m, 1262m, 1204w, 1144m, 1109m, 1035m, 970m, 875m, 789m, 737m, 675s, 570m, 521w, 443s, 388s, 314m, 245m | - |
| 1M LiTFSi in DME:DIOX | own exp. | 1478m, 1450m, 1244s, 1138m, 1087w, 1025w, 961m, 940s, 875m, 850m, 740s, 723w, 401w, 370w, 339w, 327w, 312w, 278m | - |
It should be noted that the published values for the "S22−" peaks in Table I refer to Raman signals obtained from crystalline Li2S2 in which the Raman bands arise from lattice vibrations.15 The difference between the calculated Raman peak positions and the experimental results reported are thus mainly due to solid-state effects for this species. As Li2S2 and Li2S are insoluble in the electrolyte used, all comparisons should be based on the crystalline Raman band positions for Li2S2 and Li2S respectively. In solution or in vacuum, the latter ion has no Raman spectrum since there is no vibrational mode. Published values indicate peak positions at 174 cm−1 and 514 cm−1 for crystalline Li2S215 and at 378 cm−1 for crystalline Li2S,16 but the Li2S Raman peak intensity is rather low and can almost not be identified in a discharged sulfur cathode.16 Nevertheless it can be questioned whether the examined species in ref. 15 is pure Li2S2 for it can be assumed that there are additional or maybe even different polysulfide species at the electrode. Yeon et al. also observed a peak above 500 cm−1 in discharged state16 which also can be seen in the in-situ spectra in Fig. 7. This Raman line is assigned to S3−, perfectly fitting to our DFT calculations of this species.
Since Li2S and Li2S2 are insoluble in the electrolyte, the corresponding experimental solid-state spectra must be taken as reference for the Raman peak assignment. Table I includes calculated Raman peak positions for S22− both in vacuum (560 cm−1) and in THF solution (428 cm−1) only for completeness.
Comparing the Raman lines of the calculated polysulfide mono- and dianions (Sn−, Sn2− with n>2) with literature results of alkali metal or alkaline earth metal polysulfides one can see the impact of the coordinating cation and as well the solvent. The calculated Raman lines of S42− are at 462, 445, 413, 212, 168 and 89 cm−1 in THF. For aqueous Na2S4, peaks are reported at 484, 446, 410, 256, 194 and 144 cm−1.42 Polarization in a solvent such as THF can lead to shifts in Raman band positions as evidenced by comparing the calculated vacuum results to the THF case (see Fig. 3, 4). Typically, the Raman-line in THF is found at slightly higher wavenumbers due to polarization effects in the solvent which tend to increase S-S bond strength. Additionally, the relative peak intensities are also affected by the solvent.
As mentioned above, the electrolyte can have a dramatic effect on the reaction mechanism in Li-S cells which influences the distribution of polysulfide chains in solution. Comparing different electrolytes, the overall Raman spectra are thus different due to different amounts of individual polysulfides or different sulfur and polysulfide solubility.
The effect of the solvent on polysulfide Raman peak positions – considering one individual chain length – is not so pronounced. Comparing the calculated THF and vacuum spectra in Fig. 3, we find that these spectra are overall very similar. There are variations in intensity and also some shifts in wavenumbers which we estimate to be below 15–20 cm−1 at most. The notable exception is S22− as discussed above. Here, the discrepancy is larger but Li2S2 is not solvable in the used electrolyte, so comparisons should be made with the solid-state spectra. For the calculated wavenumbers, we note that one of the important parameters for the PCM model is the dielectric constant of the solvent, which does not vary to a large degree for different ether based solvents. We thus conclude that the solvent effect on peak positions is only minor compared to other uncertainties and calculations of Raman-spectra. Therefore THF can be used as a good reference for ether-based electrolytes regarding the calculations. This could also be confirmed by experimental data of polysulfides in various ether based solvents (Fig. 5). There a characteristic polysulfide induced peak at around 535 cm−1 could be identified with different intensities depending on the solvent. Therefore one can suppose that the effect of the specific ether used on the polysulfide Raman line positions is comparably low and taken into account within the calculations.
Nevertheless, the electrolyte composition does have an effect on the overall Raman spectra resulting from all species within solution plus the solid state precipitates. This is because the electrolyte solvents influence the reaction mechanisms and the distribution between different polysulfide chain lengths due to different polysulfide and sulfur solubility. Additionally, the electrolyte solvents also contribute with their own Raman lines to the overall spectrum.
Raman measurement of polysulfides in various solvents and experimental standards
The reaction mechanism in Li-S cells seems to be dependent on the electrolyte solvents2 as discussed above. Consequently the solvents should have a high impact on polysulfide creation and decomposition. Therefore various measurements of typical Li-S electrolyte solvents with polysulfides were made, to allow a more precise interpretation of the Li-S reaction mechanism. Fig. 5f shows the corresponding Raman measurements of various standards including solvents like THF, TEGDME, DME, DIOX and salts like LiTFSI, LiTFS and LiNO3 which are frequently used in Li-S electrolytes (compare Fig. 1). In the Raman spectrum of LiTFSI in DME:DIOX (+LiNO3) the DIOX peaks at 947 cm−1 and 967 cm−1 and the DME peaks at 364 cm−1, 820 cm−1 and 847 cm−1 are clearly visible. LiTFSI peaks in the electrolyte can be identified at 278 cm−1, 749 cm−1 and between 300–400 cm−1. Interestingly LiNO3 peaks cannot be detected in the electrolyte with the exception of a possible peak at 740 cm−1, which could have been formed by LiTFSI alone or together with LiNO3. Nevertheless the sharp LiNO3 peaks at 238 cm−1 and 1071 cm−1 are clearly not visible in the electrolyte, despite the high LiNO3 concentration of 0.25 M/L.
The LiTFS in TEGDME:DIOX shows again the typical DIOX peaks and indicates TEGDME peaks between 800–900 cm−1. The LiTFS Raman lines seem to have been moved to smaller wave numbers (320 → 314 cm−1, 778 → 758 cm−1 and possibly 1077 → 1044 cm−1) showing again the strong impact of solvation.
To get an impression of characteristic Raman polysulfide lines, a stoichiometric powder mixture of Li2S and S8 to obtain "Li2S8, Li2S6 and Li2S4" was added to various solvents or electrolytes. The polysulfide concentration was between 5 mM L−1 and 50 mM L−1 to allow a complete dissolution of the solid powders. Different polysulfide compositions led to different solvent colors with yellow for Li2S4, orange for Li2S6 and red for Li2S8. It was not expected to obtain polysulfides with exact Li2S8, Li2S6 and Li2S4 chain length but the different amount of sulfur should at least influence the equilibrium of the various polysulfides, which are likely to be formed in the solvents. The corresponding Raman spectra in dependency of the solvents are shown in Fig. 5a–5e. In all polysulfide/solvent spectra the Raman peaks of the base solvent/electrolyte are clearly visible. Additionally all spectra showed a peak between 520–550 cm−1 which can be attributed to polysulfides, likely through S-S vibration, since it was not visible in the pure solvents. Nevertheless this peak could not clearly be identified, because there were several mono-anion induced peaks and the S22− peak nearby. Nevertheless, it seems to be implausible to obtain a S22− peak in solutions with sulfur excess (stoichiometric Li2S8) without electrochemical reduction. Most likely the observed peak is created by S3−, which would therefore have been created in all solvents even with excess of sulfur.
A peak at around 480 cm−1 close to the S8 standard peak could be seen in polysulfide- THF and DIOX but not in DME, TEGDME and electrolyte. Close to this peak are several di-anion Raman lines like S52−, S72− and S82− but also the S8 peak at 472 cm−1. Another peak at 219 cm−1 is also very clearly visible in polysulfide-THF and -DIOX but only very little in DME, TEGDME and the electrolyte. Again the S8 peak and several di-anion peaks like S52− and S82− are close to this position but no mono-anion peaks were calculated for this area. This could lead to the following conclusions: Either the sulfur S8 did not react with the Li2S in THF and DIOX, leading to the S8 Raman signals, or the creation of di-anion polysulfides seems to be somehow inhibited in TEGDME and DME. Most likely the poor S8 dissolution in DIOX brings forth S8 Raman signals.16
The fact that the DME:DIOX electrolyte shows merely no peaks at around 219 cm−1 and 480 cm−1 is remarkable and leads to the suggestion that DME could have a dominating impact over DIOX. Nevertheless, the electrolyte, DME and also TEGDME show a low intensity peak at 219 cm−1 which seems to be present especially if "Li2S8" or generally more sulfur was added. This could mean that no more polysulfides were created and that the small excess of S8 led to a Raman line, corresponding to S8.
Raman ex-situ measurements of a CNT-S electrode
To get an impression how the Raman lines of a binder free CNT-S electrode are affected by addition of the electrolyte and a Li metal anode, the in-situ test cell was assembled with a bare CNT-S electrode with Ni foam current collector (Fig. 6). Subsequently electrolyte and a Li metal anode were added in order to examine possible impacts on the Raman lines.
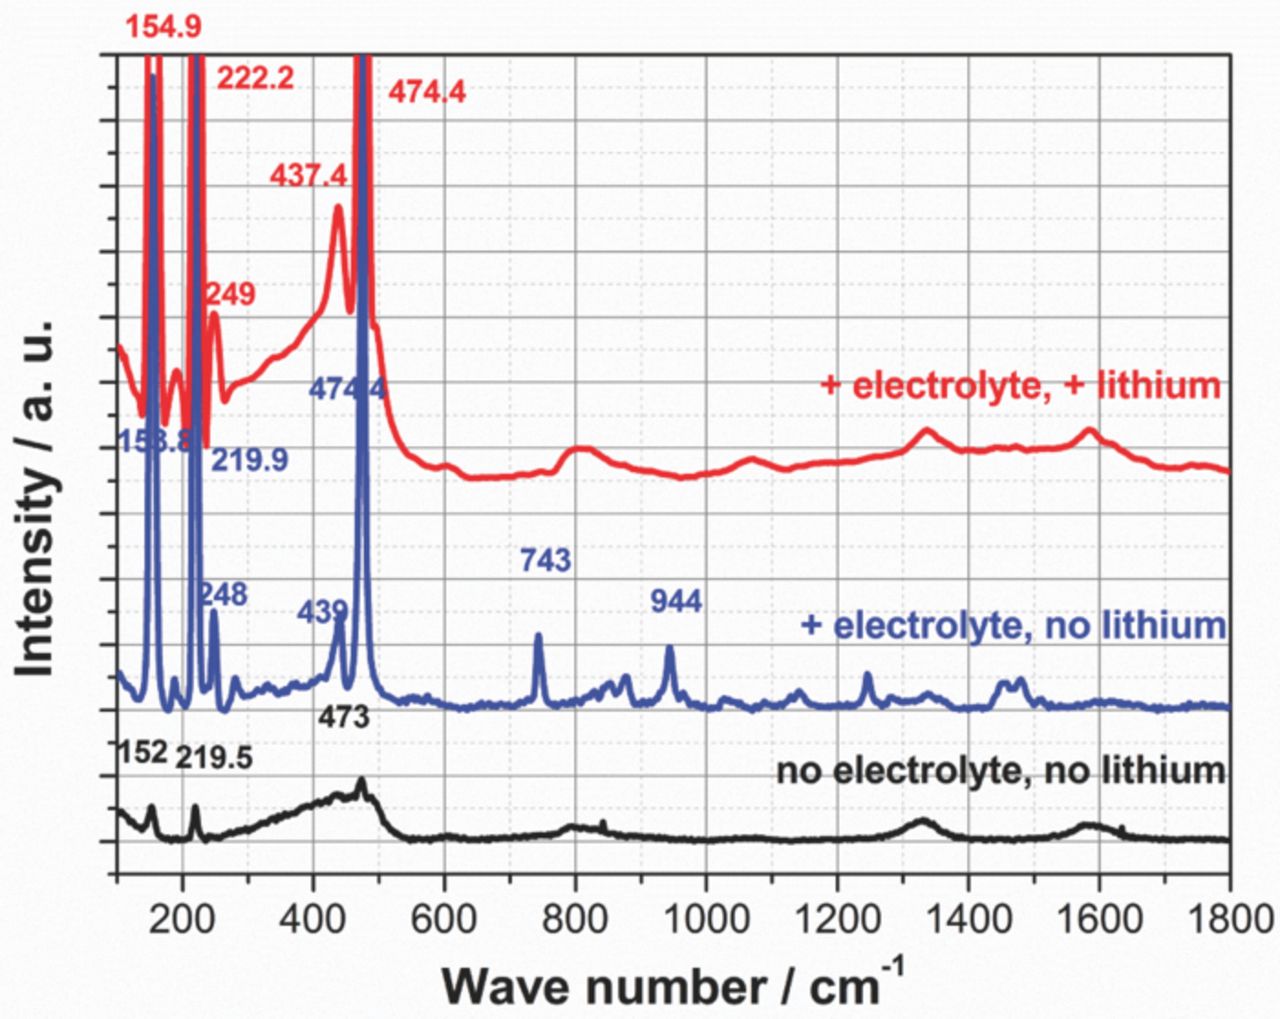
Figure 6. Raman measurements of a CNT-S electrode in in-situ test cell a) without electrolyte and without Li anode, b) with electrolyte and without Li anode and c) with electrolyte and Li anode.
Measurements of the bare CNT-S electrode showed typical S8 peaks at 152, 219 and 473 cm−1. Additionally there were broad CNT induced peaks at 1330 cm−1 and 1586 cm−1.55,56 With addition of electrolyte the S8 peaks shifted to slightly higher wave numbers (154, 220, 439, 474 cm−1) and peaks induced by the electrolyte were visible. With further addition of a lithium metal anode there was a further small shift of the lower wave number S8 peaks to 155 and 222 cm−1. The electrolyte induced peaks somehow lost some intensity and could not be identified in several positions any more (e.g. 743, 853, 877, 944 cm−1 et cetera).
As a conclusion, the influence of electrolyte and lithium metal on S8 Raman peaks is rather low and within the range of a few cm−1. Nevertheless, a lithium counter electrode with separator somehow removes some electrolyte induced peaks and starts to create polysulfides through sulfur-electrolyte dissolution and by polysulfide shuttle self-discharge. An explanation for the missing electrolyte induced peaks could be a reaction of the lithium salt with the lithium metal anode, leading to a solid electrolyte interface (SEI) or a reaction with the polysulfides. Nevertheless, the concentration of LiTFSI should have been high enough to leave some additional salt, which should have been identified by Raman.
Raman in-situ measurements of a Li-S cell
A carbon structure electrode, coated with CNT and a sulfur load of 5.1 mg cm−1 was assembled vs. a Li metal anode. A polypropylene separator and an excess of 200 μL electrolyte were added. Raman spectra were taken at various cell voltages during charge and discharge. The cell voltage profile with indicated measurement points including information about the reaction mechanism out of the literature1,57 are shown in Fig. 7a. The discharge spectra are demonstrated in Fig. 7b and the charge spectra in Fig. 7c. The measurement range was limited between 100 and 600 cm−1 in order to shorten the measurement time and to reduce the possibility of laser induced effects on sensible substances. This measurement range is sufficient to discuss polysulfide creation and the reaction mechanism. An interpretation of electrolyte decomposition products would only be possible if the measurement range is increased to much higher wave numbers.15 This was, however, not the intention of this work.
The open circuit voltage (OCV) before discharge (Fig. 7b) shows typical S8 peaks at around 150, 220 and 470 cm−1. But compared to previously shown S8 peaks those peaks were broad, indicating the possible existence of polysulfide di-anions (S72−, S82−) and mono-anions (S5−, S8−). After some time of discharge (2.33 V) these peaks were almost completely reduced. Nevertheless, this does not need to be the case for every electrode. Especially with very high sulfur loads (> 10 mg cm−1) it is possible to obtain S8 peaks even after the end of the first discharge (not shown here). This should be due to bad electrical contact of the isolating sulfur to the electrode carbon network. But even those isolating sulfur spots were reduced in the second discharge, likely by solid-liquid reactions indicating that a completely homogenous sulfur distribution is not necessary to obtain an electrode with high sulfur utilization. More important seems to be a sufficient conductive electrode surface and easy accessibility of the electrode.49
With further discharge until the end of discharge a peak between 520–550 cm−1 emerges, reaching its highest intensity at around 2.10 V. The peak position is the same as in Fig. 5 at which the polysulfides were created by mixing Li2S and S8. Again the interpretation of this important peak position is difficult, since there are many mono-anion peaks (e.g. S3−, S6−) and the possible Li2S2 solid-state peak of the precipitate nearby. Yeon et al.16 assigned this peak to S3−, created through decomposition of S42−38 with S22− as additional product. This hypothesis can be confirmed by our Raman in-situ measurements, since S42− vibrations (445 and 462 cm−1) are very likely to be found in the very broad Raman peaks in this area. Peaks induced due to crystalline Li2S2 cannot be identified directly at 514 cm−1 but very likely at 174 cm−1,15 especially after continuous discharge.
Between 2.29 V and the OCV voltage after discharge two very broad peaks emerge among 340 and 420 cm−1 and 420 and 480 cm−1, reaching their intensity maximum at 2.10 V. These broad peaks are likely be induced by several coexisting polysulfides which should have a medium to short chain length according to the reaction mechanism theory. Regarding the polysulfide calculations in Table I the peak between 340 and 420 cm−1 is likely to be created by a mixture of S62−, S72−, S82−. With further discharge the S62−, S82− induced shoulder between 350 and 370 cm−1 loses its intensity, indicating lower concentrations of these polysulfides. The broad peak between 420 and 480 cm−1 is likely to be created by shorter chain polysulfides like S32−, S42−, S52− and S4−.
Two further peaks at 130–160 cm−1 and 170–220 cm−1 emerge between 2.19 V and 1.51 V. According to the DFT-results, the peak with the lower wave number can be attributed to polysulfide mono-anions (S5−, S7−, S8−). This is unlikely or at least surprising because in this state of discharge polysulfides with lower chain length were expected. The other peak contains the Raman lines of S22− (Li2S2) and S32−, especially at the end of discharge which perfectly fits to the theory of short chain polysulfides in this state of charge. Nevertheless, the peak maxima at 200 cm−1 does not perfectly fit to a specific calculated polysulfide but could have been created together through S32−, S42−, S52−.
During charging we almost see the reverse process of polysulfides being created and consumed with Raman line positions already described above. The peak between 520–550 cm−1 loses a lot of its intensity during charge, indicating that short chain polysulfides (e.g. S3−) are likely responsible for its creation. The first sulfur peaks (likely together with long chain polysulfides e.g. S52−, S82− and S5−, S8−) appear at 2.53 V, when the cell voltage increases rapidly to the end of charge voltage. These results should prove that there can be S8 creation in Li-S cells during charge, although some publication denied this.58 Nevertheless, we could not discover the three S8 related peaks in every in-situ measurement with every CNT-S electrode, although we examined the electrodes at several measurement points. Therefore there seem to be certain electrode hotspots at which the accumulation of elemental sulfur is favored. Probably those electrode spots have a good electrolyte accessibility, high surface and low resistance. After end of charge and some additional minutes of relaxation another measurement of the electrode was made. The intensity of the three S8 peaks was a little lower and the peak shoulders (especially at 215 cm−1) seem to be more significant. This could be due to the beginning of a self-discharge being fast at the high level plateau with long chain polysulfides. The self-discharge leads to the decomposition of S8 to long chain polysulfides and to medium chain polysulfides, created out of the former after some time.
Conclusion
Experiments, DFT calculations and a literature research led to a compendium of species assigned vibrational frequencies being interesting for Raman measurements on Li-S cells. By calculating the vibrational frequencies of polysulfide mono-anions and di-anions in vacuum and in THF solvent and by adding polysulfides in various solvents it could be proved that the latter have a great impact on the Raman lines and on the polysulfide creation. Raman in-situ measurements of a Li-S cell proved the existence of various polysulfides being dependent on the state of charge. According to the Raman spectra, there seem to be polysulfide mono-anions next to di-anions in every state of charge. Additionally, several polysulfides with various chain lengths form a kind of polysulfide equilibrium that is moved toward shorter chains during discharge and longer chains during charge. The creation of S8 through charging has been proved.
Raman in-situ examinations can be a valuable tool to examine the reaction mechanism which is highly dependent on the used electrolyte solvents.
Acknowledgments
This research was financed by the German Bundesministerium für Bildung und Forschung (BMBF) through the project STROM: "AlkaSuSi-Alkalimetal sulfur and silicon". We are grateful for the support.
Footnotes
- †
Symmetry related Sn conformers such as for example the left handed and right-handed versions of the fully stretched helical chains result in the same Raman-spectrum, at least in non-chiral solutions.