Abstract
Pouch cells made with single-crystal LixNi0.5Mn0.3Co0.2O2 positive electrodes have recently shown superior capacity retention over equivalent pouch cells made with polycrystalline LixNi0.5Mn0.3Co0.2O2.1 This paper aims to further understand the cycling behavior of polycrystalline and single-crystal LixNi0.5Mn0.3Co0.2O2 through an operando X-ray diffraction study, which reveals identical trends in lattice parameter evolution and unit cell volume change during cycling for the two materials. In addition, coin-cell cycling experiments used to examine the initial irreversible capacity loss observed for both materials indicate that it is primarily caused by kinetic limitations of lithium intercalation. Additional X-ray diffraction experiments show much higher c-lattice preferred orientation for electrodes made from single-crystal material, and SEM images of the electrodes reveal a shearing effect in single-crystal particles caused by electrode calendaring.
Export citation and abstract BibTeX RIS

This is an open access article distributed under the terms of the Creative Commons Attribution 4.0 License (CC BY, http://creativecommons.org/licenses/by/4.0/), which permits unrestricted reuse of the work in any medium, provided the original work is properly cited.
Lix(NiaMnbCoc)O2 cathode materials (NMC) are currently used in lithium-ion cells for electric vehicles.2 NMC compositions with high nickel content, like LixNi0.5Mn0.3Co0.2O2 (NMC532), may be chosen for this application in order to improve energy density3 and rate capability,4 but with the associated cost of accelerated capacity fade compared to NMC111.4,5 Researchers have used several methods to reduce capacity fade in high nickel NMC materials including electrode coatings,6–8 electrode dopants,9 and electrolyte additives.10,11
Recently, Li et al. demonstrated that electrodes made with single-crystal NMC532 have superior capacity retention over typical polycrystalline NMC532.1 The primary particles in the single-crystal material, which are each one crystal of NMC532, are larger than the primary particles in typical NMC532 polycrystalline agglomerates. The larger particle size may improve thermal stability (based on similar work involving LiCO212). Additionally, the single-crystal material shows more resistance to oxygen loss compared to the polycrystalline material. Charged polycrystalline NMC532 shows a peak in oxygen evolved when the material is heated to 80°C, but under the same conditions single-crystal NMC532 shows no oxygen loss peak.1
This paper further characterizes the cycling behavior of polycrystalline and single-crystal NMC532 through an operando X-ray diffraction study of the crystal lattice parameters. Additionally, experiments are presented to investigate the first cycle irreversible capacity loss observed for both materials.
Experimental
Single-crystal NMC532 electrodes used in the operando study were punched from a hand- coated electrode composed of 94 wt% active material (the same single-crystal NMC532 powder described in Reference 1), 4 wt% conductive additive, and 2 wt% polyvinylidene fluoride binder (PVDF). All other electrodes were composed of 96 wt% active material, 2 wt% carbon-black, and 2 wt% PVDF and were extracted from dry pouch cells provided by Li-Fun Technology (Xinma Industry Zone, Golden Dragon Road, Tianyuan District, Zhuzhou City, Hunan Province, PRC, 412000). Electrode punches were dried under vacuum at 110°C for 14 hours before transferring directly to an argon filled glove box for coin cell assembly.
Each standard 2325 size coin cell was assembled with one 13 mm diameter dried NMC532 punch (single-sided coating on aluminum foil), two layers of 19 mm diameter Celgard 2320 separator, a lithium metal counter-electrode, and an excess of electrolyte consisting of 1M LiPF6 in EC:DEC (1:2 wt:wt). Lithium salt and electrolyte solvents were provided by BASF Canada and were mixed in an argon filled glove box. The capacity of each coin cell was ∼5 mAh, which is expected for this cell format using the electrodes specified.
Coin cells for the operando experiment were assembled as described above, but with an inset beryllium disc to allow for X-ray penetration. Before coin cell assembly, Roscobond pressure adhesive was used to seal a 0.010" thick x 0.850" diameter PF-60 Beryllium disc (Materion Electrofusion, 44036 South Grimmer Blvd, Fremont CA) into a 15 mm diameter hole cut into a typical 2325 size coin cell steel can. After coin cell assembly, the joint between the beryllium disc and steel can was sealed with Loctite adhesive to ensure the seal would not leak during testing.
Electrode images were captured with a Phenom G2 Pro desktop scanning electron microscope with 5 kV accelerating voltage and 25 nm resolution.
X-ray diffraction was performed on bare electrodes (Figure 2) with a Bruker D8-Discover diffractometer equipped with a diffracted beam monochromator and a Cu target X-ray source. Bare electrode diffraction patterns were taken in the range of scattering angles 2θ = 15°-70° at steps of 0.01° with a dwell time of 4 seconds per step. Both scans used a 0.6 mm divergence slit, a 0.6 mm antiscattering slit, and a 0.1 mm receiving slit.
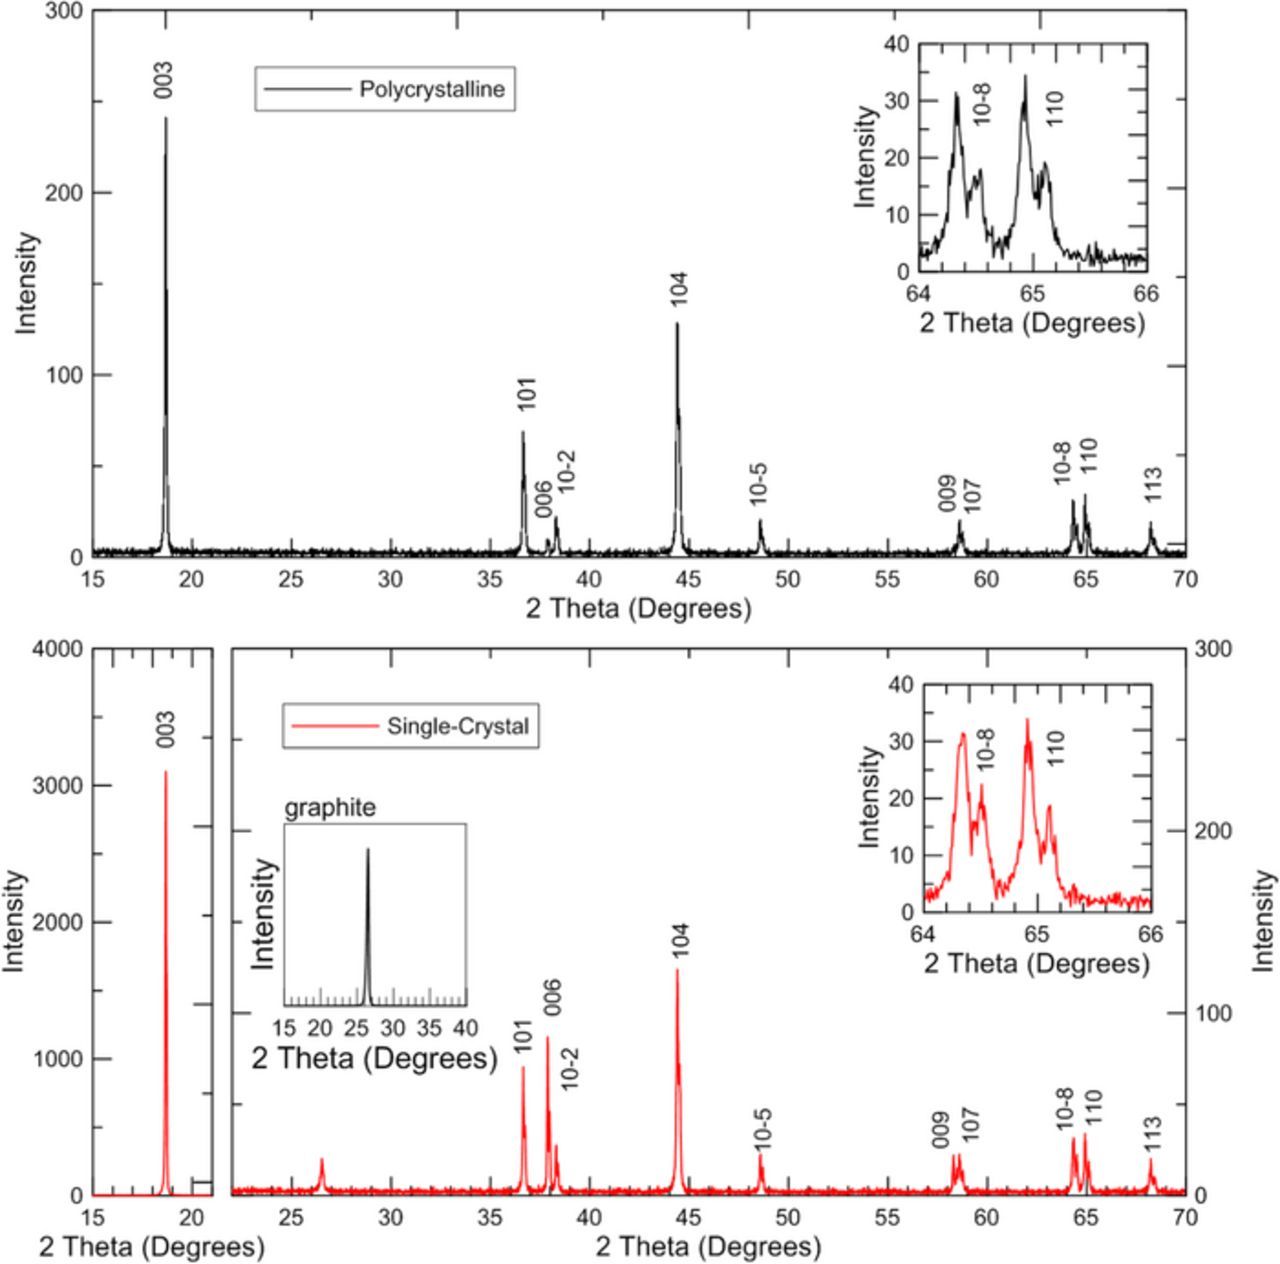
Figure 2. X-ray diffraction of electrodes made from polycrystalline (top/black) and single-crystal (bottom/red) LixNi0.5Mn0.3Co0.2O2. Peaks indexed to the R-3m space group are labelled. The inset-zoom (for 64 to 66°) for both materials shows clear splitting between the peaks from Kα1 and Kα2 radiation. The second inset in the lower panel shows the graphite (002) peak (conducting additive) measured in a separate scan.
X-ray diffraction patterns for refinements (Figure 3) were measured on bare electrodes with a Siemens D500 diffractometer equipped with a diffracted beam monochromator and a Cu target X-ray source. Measurements were made in the range of scattering angles 2θ = 15°–70° with a step size of 0.05° and an 8 second dwell time per step. Both scans used a 0.3° divergence slit, a 0.3° antiscattering slit, and a 0.15° receiving slit.
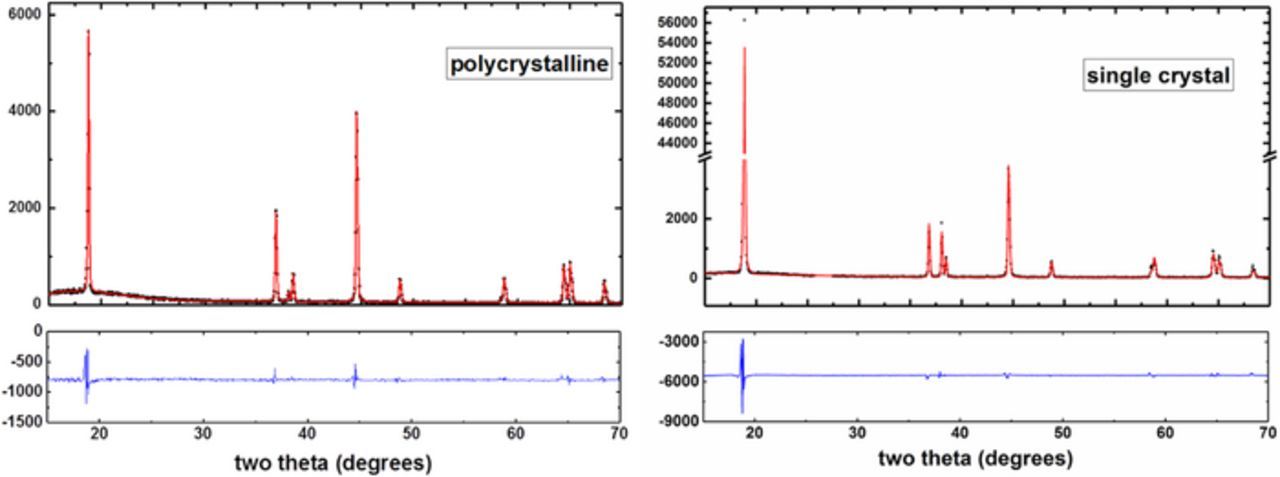
Figure 3. X-ray diffraction patterns (black dots) and refinements (red lines) are shown for polycrystalline and single-crystal electrodes. Parameters are summarized in Table I.
X-ray diffraction during the operando experiment was measured with a Siemens D5000 diffractometer equipped with a diffracted beam monochromator and a Cu target X-ray source. Measurements were made with a step size of 0.05° and a 20 second dwell time per step in the following limited ranges in order to minimize scan time: 2θ = 17.8° – 19.5°, 36° – 39.5°, 43° – 50°, 57° – 60°, 63° – 67°. All scans used a 0.5° divergence slit, a 0.5° antiscattering slit, and a 0.2 mm receiving slit. GSAS (General Structure Analysis System)13 and EXPGUI (GSAS graphical user interface)14 were used to refine the initial XRD scan for each coin cell, then the seqgsas function was used to automatically refine all other XRD scans. The crystal lattice parameters and the unit cell volume from each refinement are shown in Figure 7 and Figure 8.
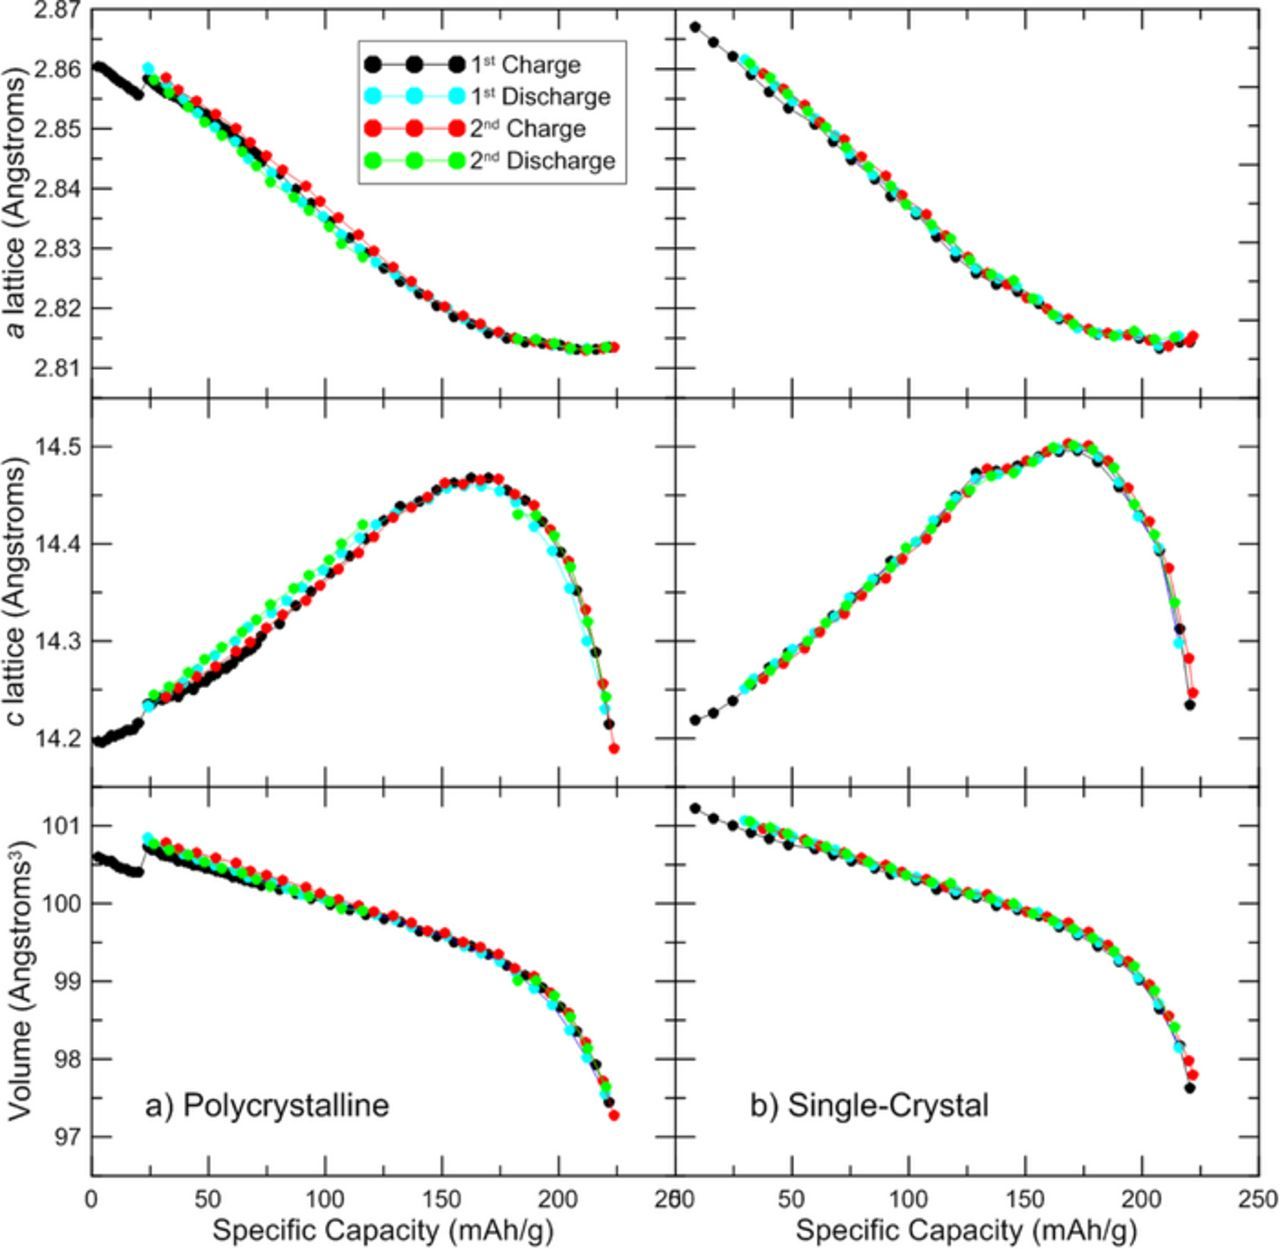
Figure 7. Lattice parameters and unit cell volume are shown as a function of specific capacity.
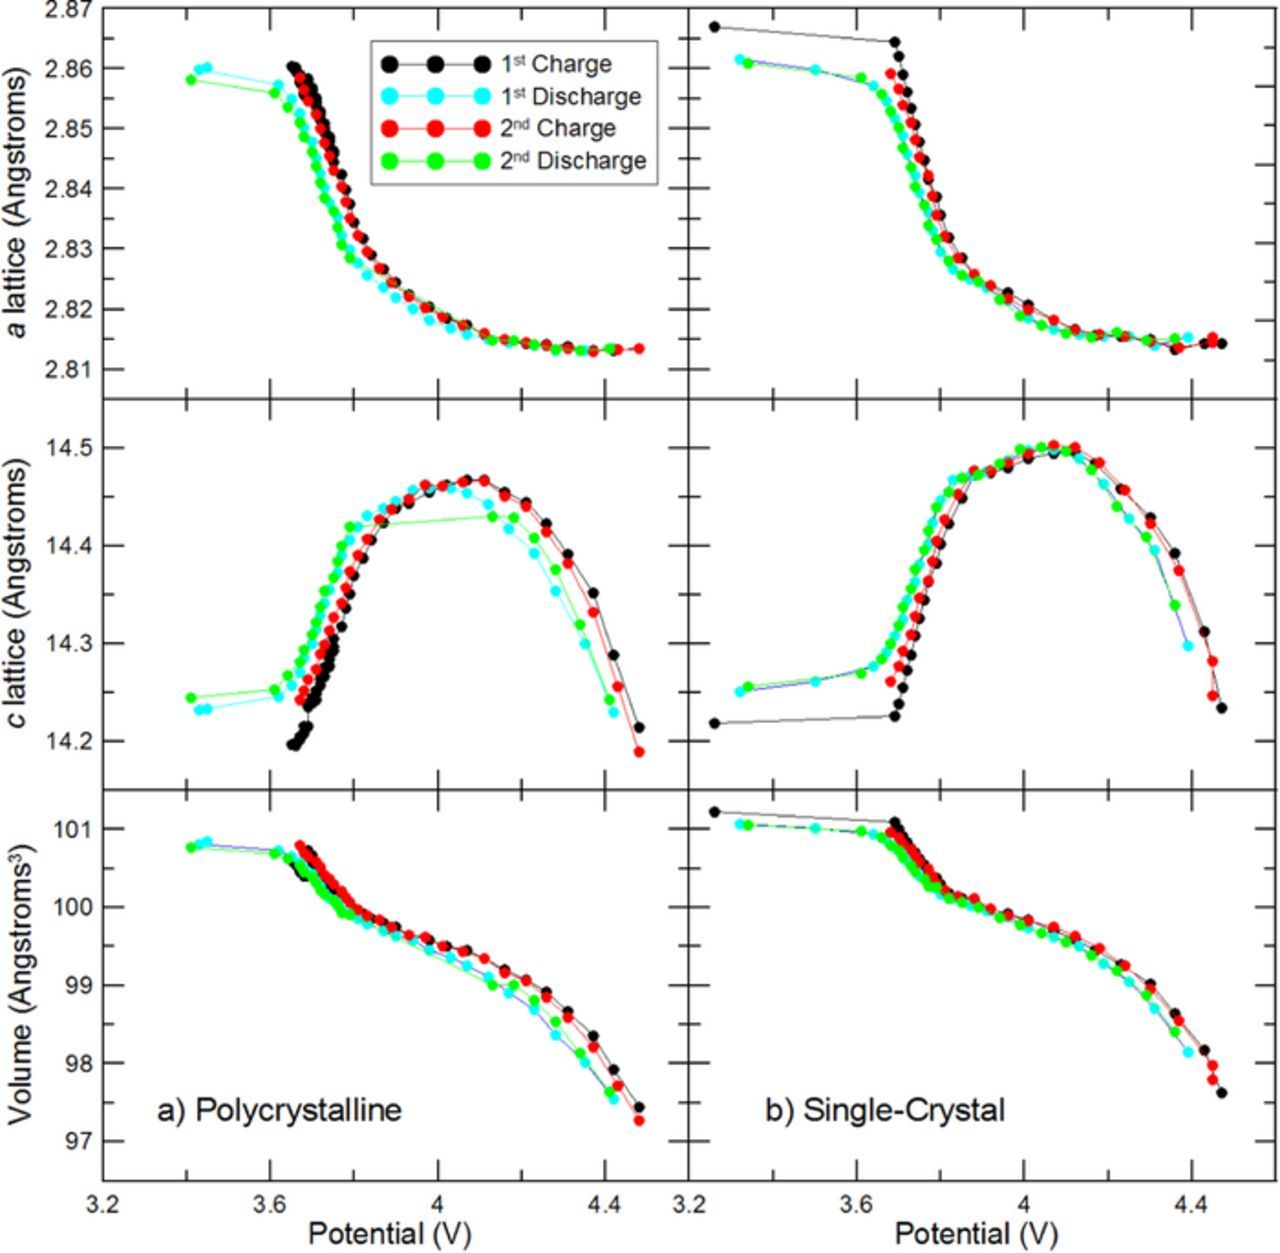
Figure 8. Lattice parameters and unit cell volume are shown as a function of average cell potential during each XRD scan.
Coin cell cycling during the operando X-ray diffraction experiment was performed using E-One Moli Energy (Canada) battery cycling equipment. Electrodes were charged and discharged between 3 V–4.5 V vs Li/Li+ at a rate of approximately C/50. A Maccor series 4000 battery test system was used for coin cell cycling in irreversible capacity tests.
Results and Discussion
Electrode characterization
Figure 1 shows SEM images of the electrodes used in the operando XRD study. As seen in the SEM images, the electrode made from polycrystalline NMC532 (left) has ∼10 μm diameter secondary particles formed from agglomerates of smaller ∼300–500 nm diameter primary particles. Each primary particle may be a single-crystal or contain grain boundaries. The material is referred to as "polycrystalline" because the secondary particles are polycrystalline regardless of the primary particle structure. In contrast, the electrode made from the single-crystal NMC532 has larger ∼1–5 μm particles and there is no primary/secondary particle structure. The material is referred to as "single-crystal" since most particles are single-crystals of NMC532 and they are not bunched into secondary particles like the polycrystalline material. Li et al. used electron backscatter diffraction mapping to image the grain boundaries and crystal orientation for the single-crystal material. The images showed that most of the particles are single-crystals of NMC532, free of grain boundaries.1 Interestingly, several of the NMC particles in the single-crystal electrode show a "curtaining" effect, possibly caused by particle shearing during electrode calendaring. This curtaining is not observed in the as-synthesized powders before electrode fabrication. The dark gray material in each image is conductive additive.
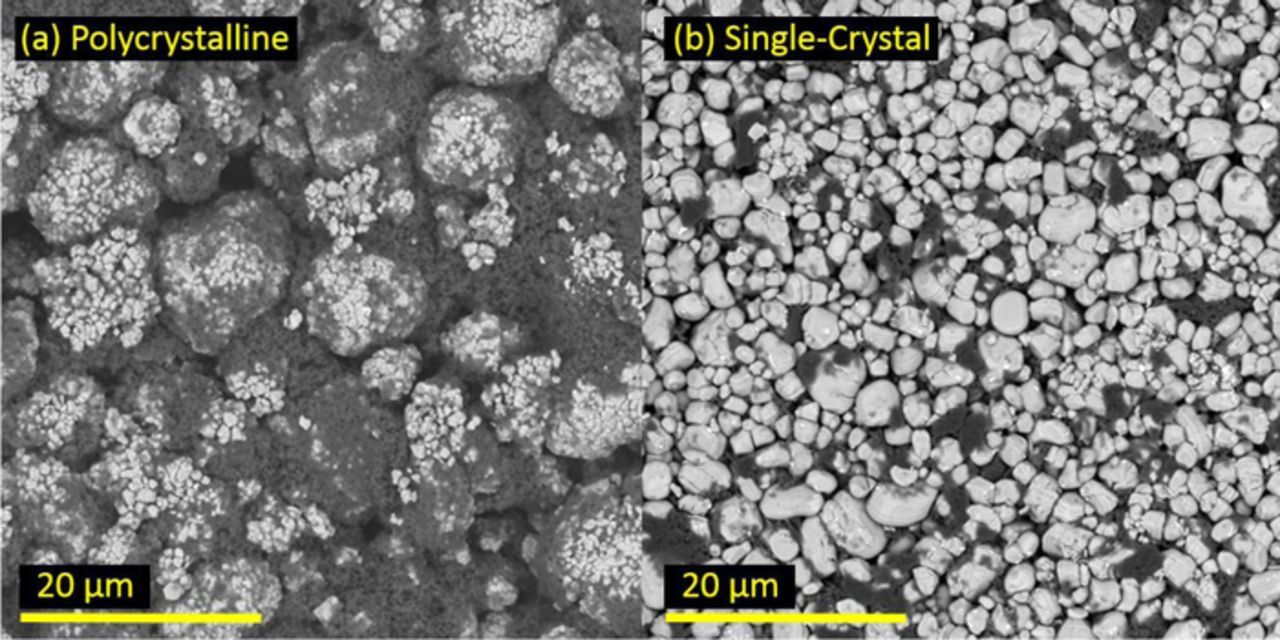
Figure 1. SEM images of electrodes made from (a) polycrystalline and (b) single-crystal LixNi0.5Mn0.3Co0.2O2. The dark material in each electrode is conductive additive.
Figure 2 and Figure 3 show X-ray diffraction patterns measured from each dry electrode in air. Peaks indexed to the R-3m space group are labeled. Figure 3 includes refinements of the X-ray diffraction data where a single hexagonal layered phase (R-3m space group) was used. Refinement parameters are summarized in Table I. The peak observed at 26.5° for the single-crystal material was ignored for the refinement since it is from the conductive carbon additive, like graphite (shown as an inset in Figure 2).
Table I. X-ray diffraction refinement parameters for polycrystalline and single-crystal NMC532 electrodes. Refinements are shown in Figure 3.
| a (Å) | c (Å) | c/a | Unit Cell Volume (Å3) | MD Preferential Orientation Fraction for 00l axis | |
|---|---|---|---|---|---|
| Polycrystalline | 2.86956(7) | 14.2352(6) | 4.9607 | 101.514(4) | 0.972 |
| Single-Crystal | 2.87092(10) | 14.23356(26) | 4.958005 | 101.598(6) | 0.636 |
The intensities for the 003, 006, and 009 peaks are much larger for the single-crystal material than the polycrystalline material, which indicates that there is preferred orientation on the 00l axis for the single-crystal material in the calendared electrode (particles should tend to lie with the 00l axis perpendicular to the electrode surface). Similarly, Rietveld refinement results of the electrodes indicate that the 00l axis shows considerable preferred orientation for the single-crystal electrode relative to the polycrystalline electrode. The single-crystal electrode March-Dollase (MD) preferential orientation fraction is 0.636 while the polycrystalline electrode MD preferential orientation factor is 0.972. An MD preferential orientation fraction less than 1 indicates preferential orientation and a smaller value indicates greater preferential orientation along the axis specified. The strong preferred orientation on the 00I axis for the single-crystal electrode may be related to the curtaining observed on SEM in several of the particles. However, further work is needed to understand the impact, if any, this has on the electrochemical performance.
Lattice parameter evolution during cycling
During the operando X-ray diffraction experiment each NMC532 coin cell was charged and discharged at a rate of ∼C/50 between 3 V and 4.5 V vs Li/Li+ at room temperature (∼22°C). Plots of the cell potential vs positive electrode specific capacity (Figure 4/left) show similar voltage profiles for the two materials, including ∼25 mAh/g irreversible capacity loss during the first charge cycle. Differential capacity, dQ/dV, vs potential, V, (Figure 4/right) is nearly identical for the polycrystalline and single-crystal cells. Each X-ray diffraction scan ran for 2.2 hours, which corresponds to 10 mAh/g of charge passed (∼4% of the total capacity).
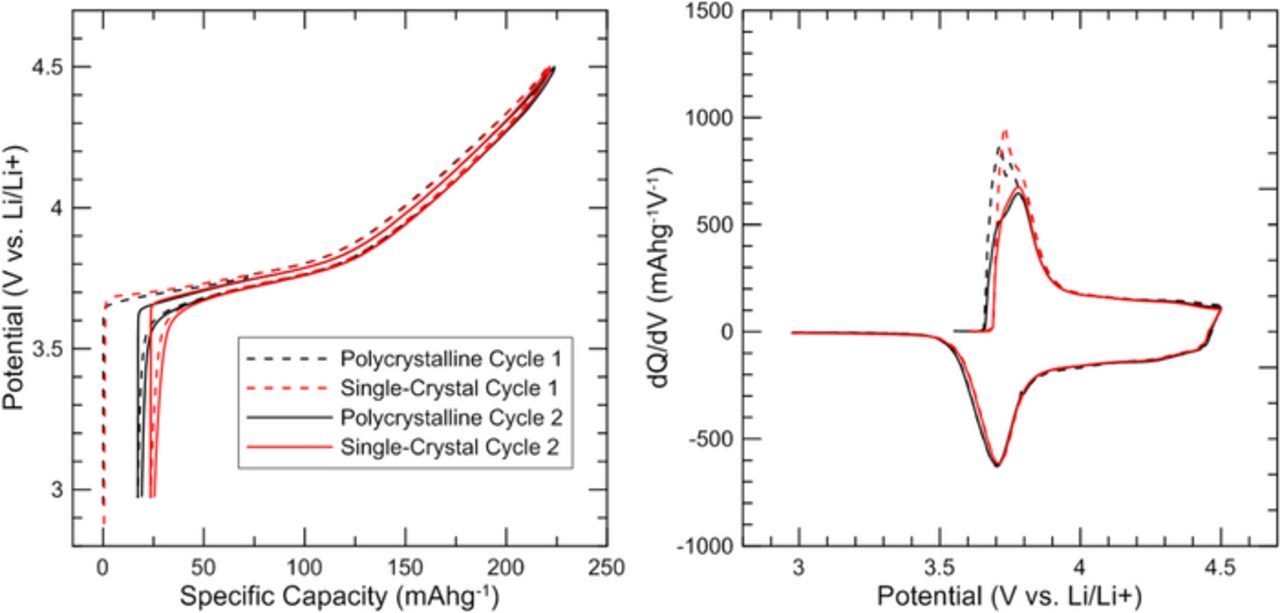
Figure 4. (a) Cell potential vs. specific capacity and (b) dQ/dV vs. potential for both electrodes during the Operando X-ray diffraction experiment.
Figure 5 shows the X-ray diffraction scans from the operando experiment. For clarity, every other scan is plotted and the intensity of each scan is offset to match the cycling data. Some scans are missing from (a) and the charger current was C/350 for the first 100 hours of the test due to instrument issues.
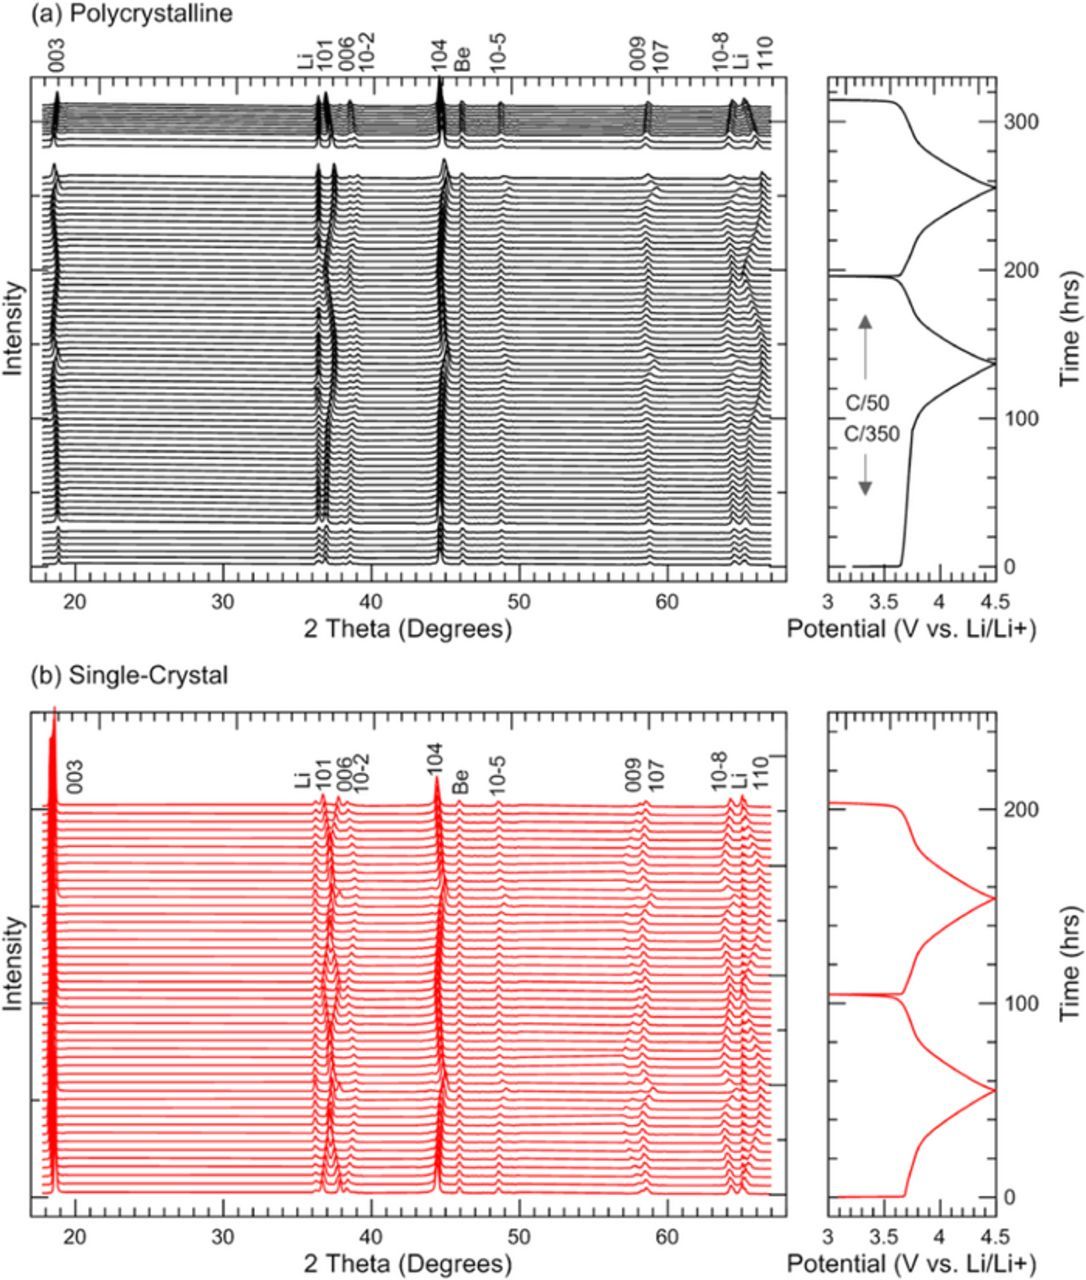
Figure 5. Operando X-ray diffraction data for LixNi0.5Mn0.3Co0.2O2 electrodes made from (a) polycrystalline material and (b) single-crystal material.
In Figure 5, each peak from the NMC532 material is labeled as indexed to the R-3m space group, and peaks from the lithium metal counter electrode and beryllium window are indicated. As the crystal structure changes during cycling, the NMC peak positions shift with respect to scattering angle (2Θ) but the Li and Be peaks remain fixed.
Figure 6 shows that at the bottom of the first and second discharges, X-ray diffraction peaks from the NMC532 return to the same position. This indicates that the changes in crystal structure observed during cycling are highly reversible. For the polycrystalline material, the lattice parameters at the bottom of the first discharge are: a = 2.86 Å, c = 14.23 Å and at the bottom of the second discharge they return to a = 2.86 Å, c = 14.24 Å. For the single-crystal material, the lattice parameters at the bottom of the first discharge are: a = 2.86 Å, c = 14.25 Å and at the bottom of the second discharge they return to a = 2.86 Å, c = 14.26 Å. Figure 6 also shows that the Kα1 and Kα2 splitting is sharper for the single-crystal material than it is for the polycrystalline material. Since peak broadening in inversely related to crystallite grain size (according to the Scherrer formula15), the sharper peaks for the single-crystal material are indicative of the larger crystallite grain size (the entire particle is one grain for the single crystal material).
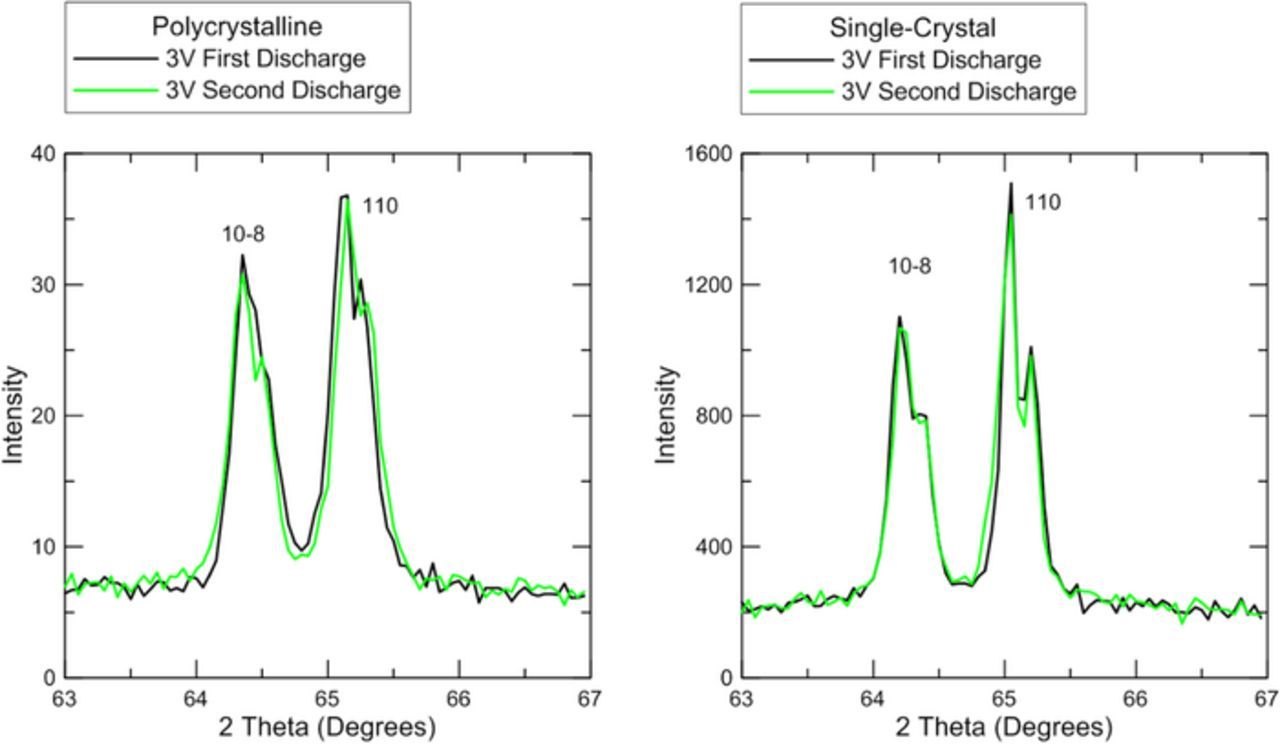
Figure 6. Detailed view of the 10–8 and 110 peaks for both materials at the bottom of the first discharge and at the bottom of the second discharge.
The crystal structure reversibility is further demonstrated in Figure 7, which shows the a lattice parameter, the c lattice parameter, and the unit cell volume plotted as a function of positive electrode specific capacity. It is evident that the changes in crystal structure are reversible for both materials, especially the single-crystal material which returns to the exact a lattice and c lattice values during both cycles for charge and discharge. [Note: The small "step" in the data for the single crystal material near 25 mAh/g coincides with the point a power failure interrupted the experiment briefly. It may be the case that the diffractometer angles were slightly shifted when the experiment resumed.] However, neither material returns to the initial lattice parameters observed in the range of the initial irreversible capacity loss. It is probable that a potential hold at bottom of discharge would allow the lattice parameters to return to the initial values, since later experiments show that most of the irreversible capacity is recovered during a 3 V potential hold (Figure 9).
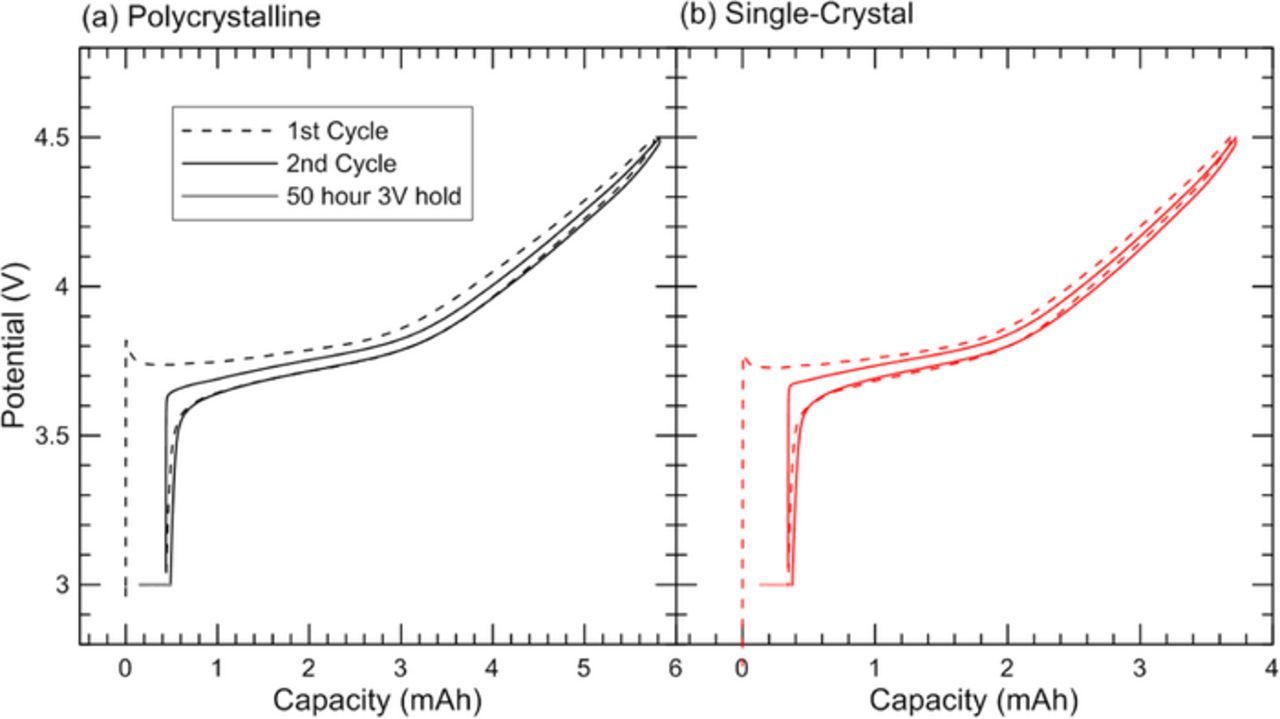
Figure 9. Plots of capacity vs potential for coin cells built with lithium metal against (a) polycrystalline NMC or (b) single-crystal NMC.
Figure 8 shows the lattice parameters and unit cell volume plotted as a function of electrode potential vs Li/Li+. Note that each data point is plotted vs average cell potential during each 2.2 hour scan, so the results may be skewed for data near 3 V where the potential changes rapidly with time. Both polycrystalline and single-crystal materials follow the same trend in lattice parameters vs cell potential. The c lattice shifts from increasing to decreasing at 4.1 V, and the unit cell volume changes by 4% between 3 V and 4.5 V. As explained by Min et al.3 the trends in lattice parameters during cycling are related to changes in the transition metal and Li layer spacing. Removing lithium from the crystal lattice initially reduces shielding between the oxygen layers, so the increased repulsion increases spacing between layers. Throughout delithiation, the volume of the transition metal layer decreases, as evidenced by the continual decrease of the a lattice parameter. But the c lattice parameter initially increases because the change in lithium layer spacing is initially more pronounced. As the increasing repulsion across the lithium layer tapers off, the effect of the transition metal layer shrinking dominates and the c lattice begins to decreases. Near the end of delithiation, the decrease in c lattice with lithium content becomes quite steep.
First cycle irreversible capacity
Coin cells with polycrystalline or single-crystal electrodes were charged and discharged at a rate of C/10 in order to investigate the first cycle irreversible capacity loss (Figure 9 and Figure 10). Both materials show irreversible capacity loss between the first charge cycle (dashed line) and subsequent charge and discharge cycles. At the end of the second discharge cycle (solid line) each coin cell was held at a potential of 3 V for 50 hours, during which >70% of the initial irreversible capacity was recovered. This indicates that most of the irreversible capacity loss is due to a kinetic limitation of lithium intercalation into the positive electrode. Similar phenomenon were observed for LixNi1-yFeyO2 by Mueller-Neuhaus16 and for NMC111 by Kasnatscheew et al.17 Each of these results is consistent with the divacancy diffusion mechanism proposed by Van der Ven et al., although this mechanism is not proven.18
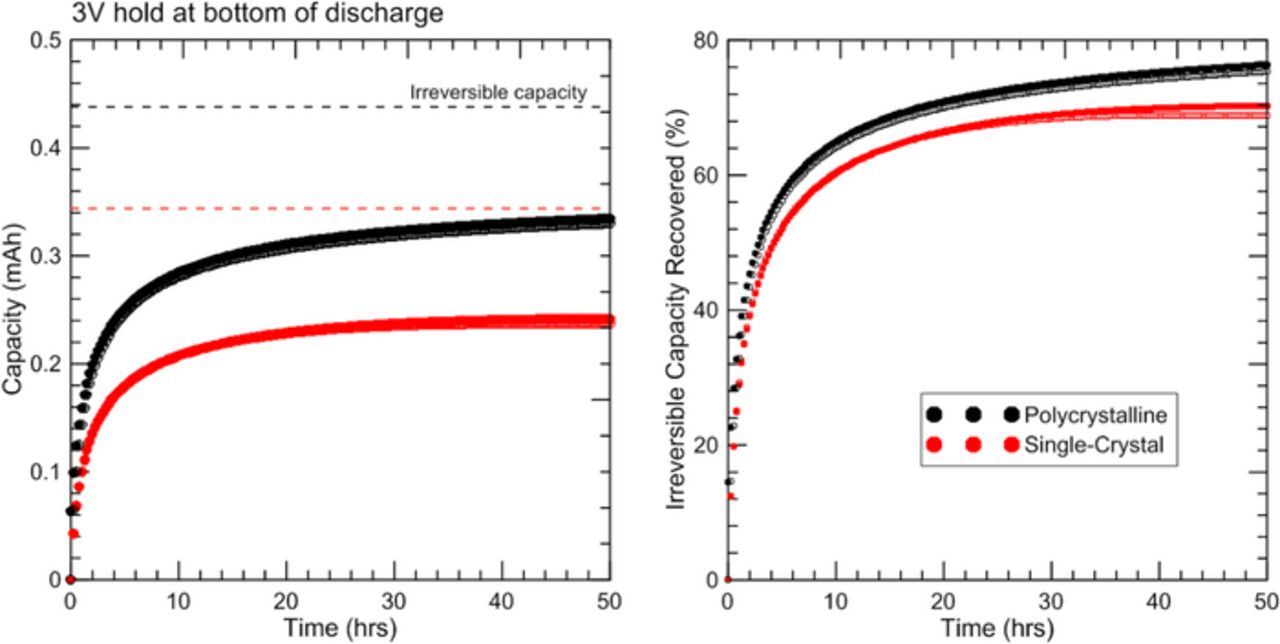
Figure 10. Plots of irreversible capacity recovered during a 50 hour hold at 3 V for polycrystalline (black) and single-crystal (red) electrodes. Duplicate experiments are shown as open symbols.
From these experiments it is evident that the polycrystalline material recovers capacity faster than the single-crystal material when held at 3 V at the bottom of discharge. In 50 hours the polycrystalline material recovers ∼75% of the original irreversible capacity, while in the same amount of time the single-crystal material recovers ∼70% of the initial irreversible capacity. Slower lithium diffusion kinetics for the larger single-crystal particles may be the reason for slower capacity recovery.
Conclusions
An operando X-ray diffraction study of polycrystalline and single-crystal LixNi0.5Mn0.3Co0.2O2 shows identical trends in lattice parameter evolution and unit cell volume change during cycling. Both materials exhibit an initial irreversible capacity loss that is primarily caused by kinetic limitations of lithium intercalation. Additional X-ray diffraction experiments show much higher c-lattice preferred orientation for electrodes made from single-crystal material, and SEM images of the electrodes reveal a shearing effect in single-crystal particles. Further investigation is required to understand what effect preferred orientation and particle shearing may have on electrode performance. In any event, the outstanding performance of single-crystal NMC532 reported in Reference 1 cannot be attributed to differences in lattice changes during lithiation and delithiation. Other factors are responsible.
Acknowledgments
This research was financially supported by Tesla and NSERC under the Industrial Research Chairs program. The authors acknowledge Dr. Jing Li (BASF) for providing chemicals used in the electrolytes.