Abstract
At Forschungszentrum Jülich GmbH an SOFC system with anode off-gas recirculation loop operating at temperatures up to 160°C is simulated. To analyze the effect of anode off-gas recirculation, a dynamical system model was implemented in Matlab/Simulink. The results show, that the recirculation rate has a significant effect on the electrical efficiency. In principle, at constant current density high recirculation rates decrease the cell voltage and increase the power demand of the recirculation blower. Therefore, the highest electrical efficiency can be reached with high system fuel utilization, low recirculation rate and in consequence high stack fuel utilization. On the other hand less amount of steam is available for the reforming reaction at low recirculation rates. Therefore, the minimum recirculation rate is determined by the risk of carbon formation. An optimal operation range to avoid carbon formation and to ensure a high electrical efficiency requires recirculation rates between 65 and 70% and system fuel utilizations above 90%.
Export citation and abstract BibTeX RIS
The daily growing global energy demand has to be provided by technologies, which emit increasingly less greenhouse gases. This requires the use of highly efficient energy systems. SOFC systems can already provide electrical efficiencies above 50%.1–4 When using the heat produced by the system, overall efficiencies above 90% are possible.
One opportunity to improve the electrical efficiency of an SOFC system to more than 60% is the implementation of an anode off-gas recirculation.5 However, high anode off-gas temperatures above 700°C prohibit the use of commercially available blower units. Therefore, the use of ejectors is discussed in literature.6–10 There are also approaches to develop high temperature blowers3 or to use commercial blowers in combination with a heat exchanger.1 Each of these approaches has its advantages and disadvantages.
At Forschungszentrum Jülich GmbH a recirculation loop operating with a blower and a heat exchanger is favored. In order to analyze the influence of the recirculation rate on the operating conditions, a dynamic system model in Matlab/Simulink was developed.
Simulation Model
For systems analysis, models for all system components, like heat exchanger, pre-reformer, fuel cell, off-gas burner and blower are necessary. The combination of these models within system simulation requires an approach, which allows a short computation time at an adequate simulation depth. Although papers have already been published in the area of SOFC system simulation,11–17 there are few simulation approaches, which can be used for every system component and for different flow directions. To keep the numerical effort and therefore the simulation time as low as possible, a cascade of ideal stirred tank reactors is chosen for the model.18 In principle, the calculation of a stirred tank reactor requires only the determination of energy and mass balance. Inside of the reactor a thermal and chemical equilibrium is assumed. The equilibrium is influenced by the composition of the inlet gas flow xi, in, temperature Tin, pressure pin, the reaction heat  and any possible energy input from outside, like heat
  or power P. As the outlet composition xi, out and temperature Tout corresponds to the inlet equilibrium, a determination of concentration or temperature profiles within the reactor is not possible. A series of stirred tank reactors can improve this drawback. In this case, the output values of the upstream reactor form the input values of the next reactor. With a sufficient number of reactors within the cascade the concentration and temperature profile along a flow channel can be described almost like a 1-D flow. In our case, for each channel flow six reactors are sufficient to produce adequate results. A higher number of reactors linearly increase the simulation time, whereas the accuracy is nearly constant.
The connection of two stirred tank reactors with a thermal mass in between allows the simulation of a heat exchanger with two channel flows. Figure 1 shows this principle in case of a counter-flow heat exchanger. This approach also allows calculating a co- or cross-flow heat exchanger, by changing the connection between the reactor cascades. There is no additional numerical effort necessary. However, all following models are based on counter-flow components.
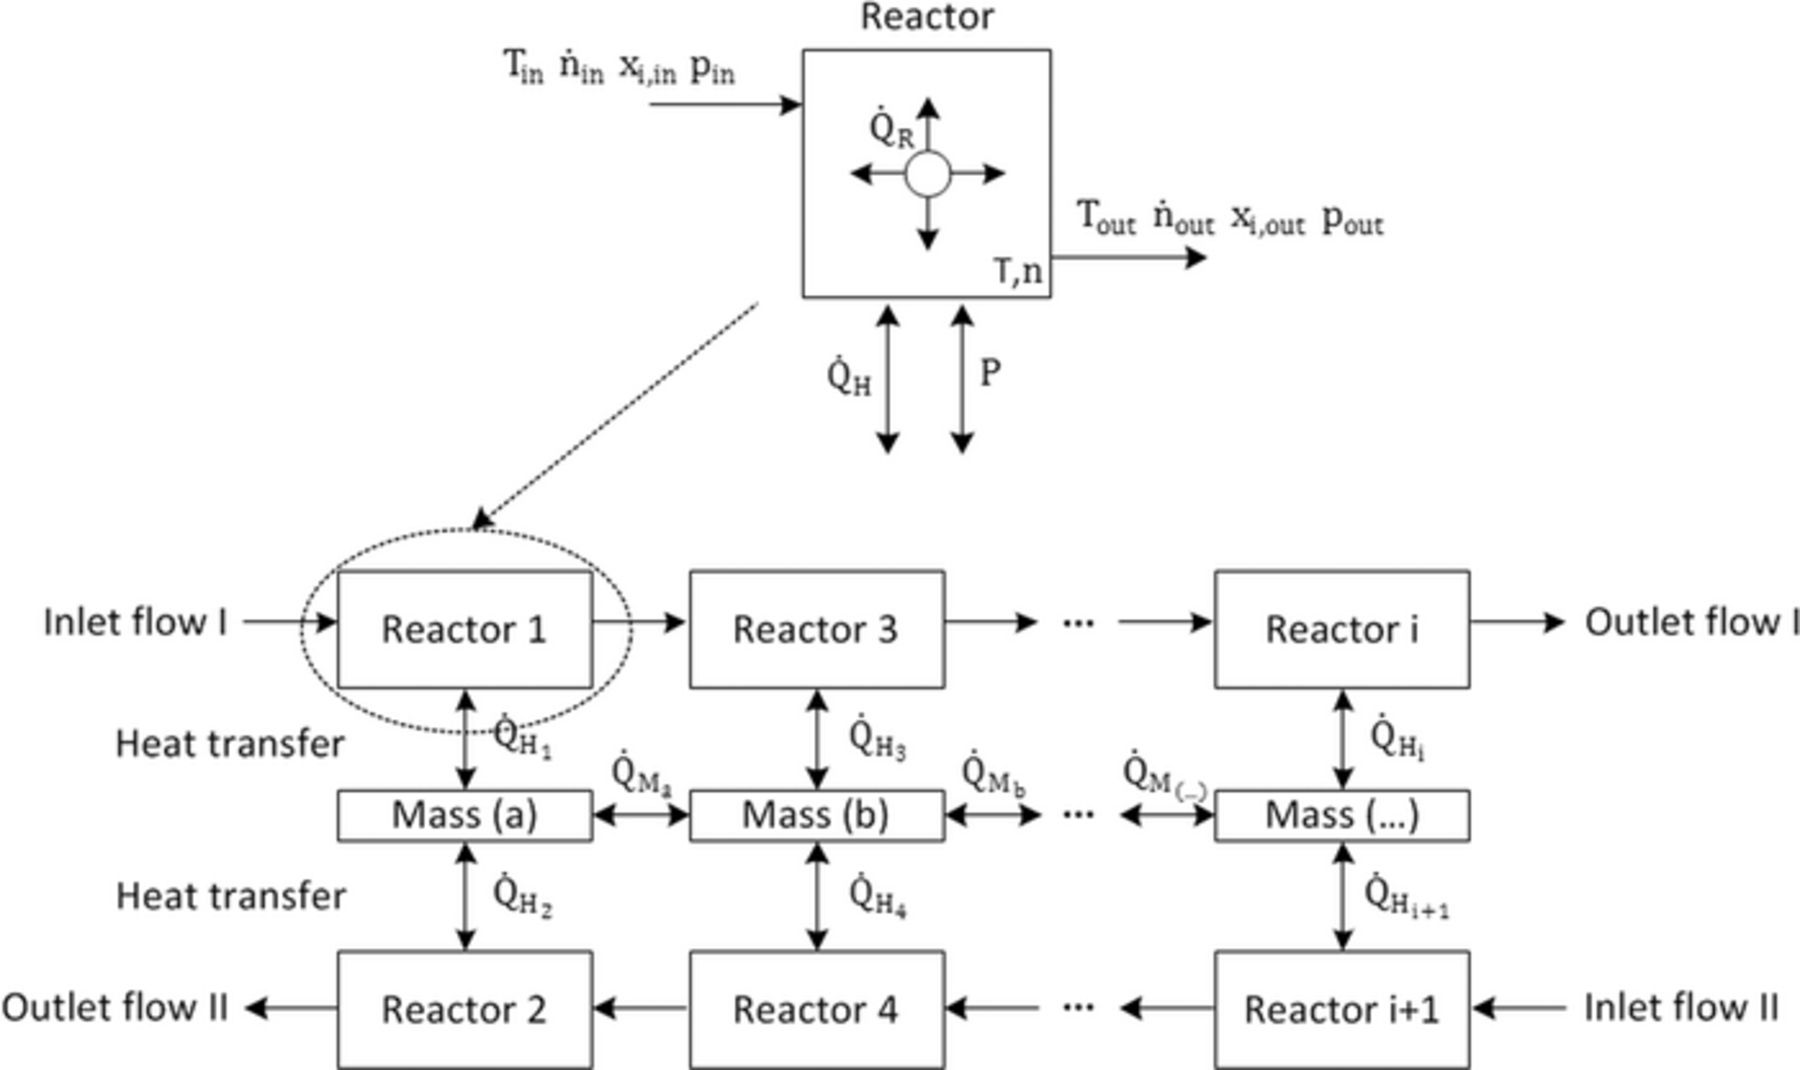
Figure 1. Illustration of the principle of a stirred tank reactor cascade.
To determine the reactor composition and temperature the following equations, which are based on the energy and mass balance, have to be solved:
![Equation ([1])](https://content.cld.iop.org/journals/1945-7111/162/9/F982/revision1/jes_162_9_F982eqn1.jpg)
![Equation ([2])](https://content.cld.iop.org/journals/1945-7111/162/9/F982/revision1/jes_162_9_F982eqn2.jpg)
Where ni is the mole number, cpi the heat capacity at constant pressure, Ti the reactor temperature,  the inlet,
  the outlet molar flow,
  the molar flow which results from the reaction,
  the resulting reaction heat,
  and Pi the external supported heat respectively power in reactor i.
The temperature of the mass TM is calculated by Equation 3, where m describes the weight and cpM the heat capacity of the mass.
![Equation ([3])](https://content.cld.iop.org/journals/1945-7111/162/9/F982/revision1/jes_162_9_F982eqn3.jpg)
The heat  transferred within the heat exchanger is a function of the Nusselt number. It is calculated by two approaches based on. Ref. 19. For a laminar flow case (Reynolds number < 2,300), the Nusselt number is expressed by Equation 4. The turbulent flow case (Reynolds number > 10,000) is solved by Equation 5, where L describes the channel length, di the hydraulic diameter and Pr the Prandtl number. The Reynolds number is calculated by Equation 6, where ρ is the gas density, v the gas velocity and η the dynamic viscosity.
![Equation ([4])](https://content.cld.iop.org/journals/1945-7111/162/9/F982/revision1/jes_162_9_F982eqn4.jpg)
![Equation ([5])](https://content.cld.iop.org/journals/1945-7111/162/9/F982/revision1/jes_162_9_F982eqn5.jpg)
![Equation ([6])](https://content.cld.iop.org/journals/1945-7111/162/9/F982/revision1/jes_162_9_F982eqn7.jpg)
For Reynolds numbers between 2,300 and 10,000 both equations are correlated as a function of the Reynolds number.
With the shown equations the temperature distribution in gas flow I, II and the temperature of the different masses of the heat exchanger can be calculated (see Figure 1). As the heat conductivity of the mass, which is normally steel, is high, an additional heat transfer  between the mass parts is considered. The composition of the two gas flows is not changing in the heat exchanger model.
The following assumptions underlie all models:
- Adiabatic conditions are assumed as an integrated system design is used, which combines the high temperature components in one module.20
- A uniform distribution of pressure and temperature in the cross section of the flow channel is assumed, as the channel dimen-sions are small (< 4 mm).
- A uniform gas flow distribution to all gas flow channels is assumed. Therefore a multi-channel component can be calcu-lated by simulating the interaction of only two flow channels of the component (like presented in Figure 1).
- Each stirred tank reactor is perfectly mixed.18
- Due to the low operating pressures (< 1.2 bar), ideal gas behav-ior is assumed.
- Energy losses, for example by friction, are not considered.
The steam reformer model is based on the heat exchanger model and therefore the principle of a stirred tank reactor cascade. The model is extended by two chemical reforming reactions which can take place in every reactor within the cascade: The steam reforming Reaction 7 and the water gas shift Reaction 8:
![Equation ([7])](https://content.cld.iop.org/journals/1945-7111/162/9/F982/revision1/jes_162_9_F982eqn8.jpg)
![Equation ([8])](https://content.cld.iop.org/journals/1945-7111/162/9/F982/revision1/jes_162_9_F982eqn9.jpg)
For the simulation of the steam reformer different calculation methods for reaction kinetics are known. An overview can be found in Refs. 21 and 22. Here an equilibrium approach based on Ref. 23 is used. The reaction kinetic of the steam reforming rSR is calculated using Equation 9, where KSR is the equilibrium constant for the steam reforming reaction and pi the partial pressure of the reactantspi. To calculate the reaction rate constant ks, an activation energy of 53,000 J/mol and a pre-exponential factor  are assumed.23 The activation energy is in agreement with the activation energy of 50,000 J/mol which was determined by Drescher.22 Moreover it is in the range of 38,500–62,000 J/mol according to.24
![Equation ([9])](https://content.cld.iop.org/journals/1945-7111/162/9/F982/revision1/jes_162_9_F982eqn10.jpg)
![Equation ([10])](https://content.cld.iop.org/journals/1945-7111/162/9/F982/revision1/jes_162_9_F982eqn11.jpg)
Parallel to the reforming process the water gas shift reaction takes place. This reaction is assumed to be in equilibrium.23,25 Changes of the flow composition caused by reforming are taken into account by  in Equation 1. The reaction heat for the endothermic steam reforming process is considered by
  in Equation 2 and calculated by the following equation:
![Equation ([11])](https://content.cld.iop.org/journals/1945-7111/162/9/F982/revision1/jes_162_9_F982eqn12.jpg)
Where νkj describes the stoichiometric coefficient of reaction j respectively component k.  represents the reaction rate and
  the molar enthalpy of component k at the mass and in this case catalytic temperature TMi.
The fuel cell model includes the heat exchanger and reformer equations and is extended by equations for the electrochemical reaction. In contrast to the models discussed above, the fuel cell model allows a mass transport between the anode and cathode-side reactors. By this the oxygen ion transport, which is required for the electrochemical reaction, can be simulated. The Nernst voltage depends on the mass temperature and partial pressures of hydrogen, oxygen and steam. As the anode flow composition is changing from fuel inlet to outlet, the Nernst voltage is changing in every cascade, too (see Equation 13). For the electrochemical reaction only hydrogen is used and converted to steam:
![Equation ([12])](https://content.cld.iop.org/journals/1945-7111/162/9/F982/revision1/jes_162_9_F982eqn13.jpg)
The cell voltage UCell is determined in dependence of the area specific resistance (ASR), the Nernst voltage UN and the electrical current density i:
![Equation ([13])](https://content.cld.iop.org/journals/1945-7111/162/9/F982/revision1/jes_162_9_F982eqn14.jpg)
![Equation ([14])](https://content.cld.iop.org/journals/1945-7111/162/9/F982/revision1/jes_162_9_F982eqn15.jpg)
![Equation ([15])](https://content.cld.iop.org/journals/1945-7111/162/9/F982/revision1/jes_162_9_F982eqn16.jpg)
Where E0 describes the standard equilibrium potential, xi the molar fraction, p0 the standard pressure, pi + 1 the cathode side pressure, F the Faraday constant and EA the activation energy. As shown in Ref. 26 the use of the temperature dependent ASR can be assumed as constant for a stack fuel utilization of up to 85%. Larger fuel utilizations in the stack lead to a significant voltage drop due to concentration polarization, which cannot be represented by this ASR approach. The product of cell voltage and current leads to the electrochemically generated power in each reactor on the anode side. This energy is considered by P in Equation 2. The total generated power of the stack is equal to the summation of each anode side reactor power. Beside the heat demand for the reforming reactions, the electrochemically produced heat is considered by Equation 11. The reaction rate of the electrochemical reaction depends on the current density, the electrochemically active cell area AER and the Faraday constant F:
![Equation ([16])](https://content.cld.iop.org/journals/1945-7111/162/9/F982/revision1/jes_162_9_F982eqn17.jpg)
In each reactor on the cathode side the molar oxygen flow is reduced by the electrochemical reaction:
![Equation ([17])](https://content.cld.iop.org/journals/1945-7111/162/9/F982/revision1/jes_162_9_F982eqn18.jpg)
Beside this the cathode side is only influenced by the temperature of the mass.
The stack fuel utilization ufStack is calculated by Equation 18, where  is the molar flow of hydrogen,
  the molar flow of methane and
  the molar flow of carbon monoxide at the stack inlet. The recirculation rate RR describes the ratio between the recirculated and the entire anode off-gas molar flow at the fuel cell outlet. The system fuel utilization depends on the recirculation rate and the stack fuel utilization and is calculated by Equation 20.
![Equation ([18])](https://content.cld.iop.org/journals/1945-7111/162/9/F982/revision1/jes_162_9_F982eqn19.jpg)
![Equation ([19])](https://content.cld.iop.org/journals/1945-7111/162/9/F982/revision1/jes_162_9_F982eqn20.jpg)
![Equation ([20])](https://content.cld.iop.org/journals/1945-7111/162/9/F982/revision1/jes_162_9_F982eqn21.jpg)
The blower and off-gas burner model are carried out as an energy balance model. Within the off-gas burner calculation a complete conversion of hydrogen to steam and carbon monoxide to carbon dioxide is assumed.
SOFC System
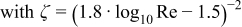
The investigated SOFC system is shown in Figure 2. On the cathode side, an air blower is used to overcome the pressure losses. A part of the air flow is used to cool down the anode off-gas flow in heat exchanger 2. The cooling air amount is adjusted by two 2-way-valves. Before entering the stack, the entire air flow is heated up via heat exchanger 1. After the stack, the air is mixed and burned in the off-gas burner together with unused fuel. A part of the resulting heat energy is used for preheating the air stream in heat exchanger 1. The rest supports the endothermic steam reforming process in the pre-reformer. After remixing both streams, the remaining heat is extracted for heating purpose. It is assumed, that the exhaust gas leaves the system with a temperature of 60°C.
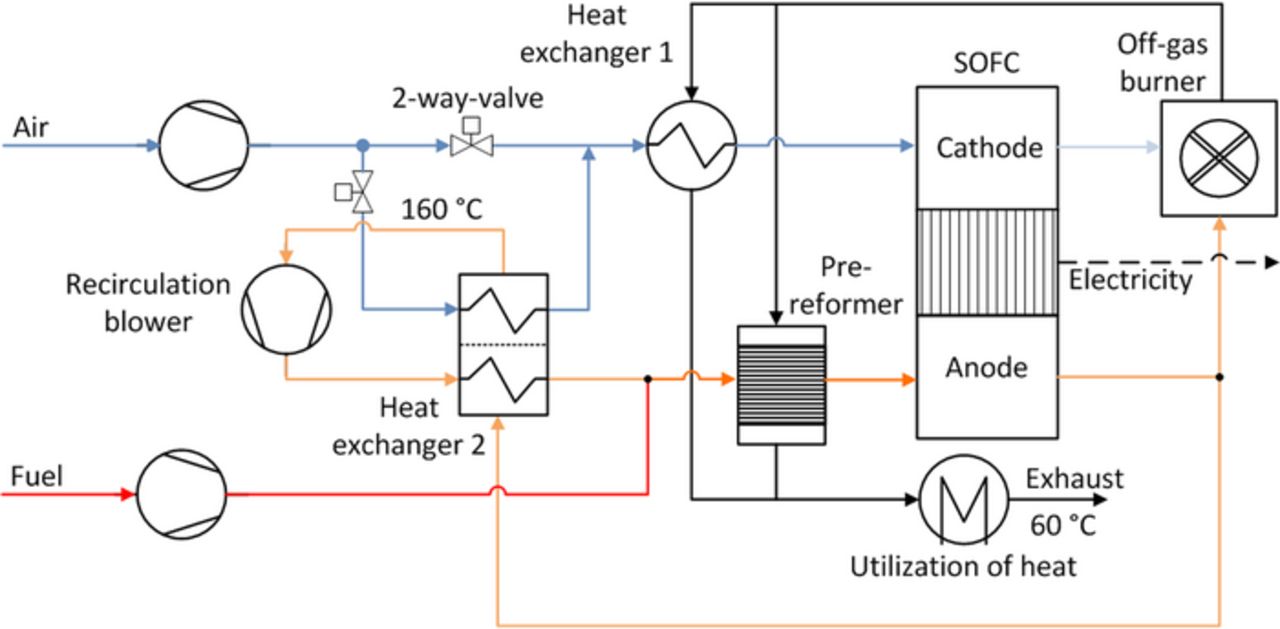
Figure 2. Flow scheme of the SOFC system.
On the anode side methane is fed into the system. Due to the electrochemically produced steam, the system can be operated water autonomous. A steam generator and external water supply are just required during the startup procedure of the system. Therefore, these components can be downsized. Before entering the pre-reformer, the methane flow is mixed with the recirculated anode off-gas flow. In the pre-reformer the steam reforming reaction takes place. The reformed fuel gas mixture enters the anode side of the stack where the electrochemical reaction takes place and the reforming reaction proceeds further. The anode off-gas is recirculated or given to the off-gas burner, depending on the recirculation rate. The recirculated anode off-gas is cooled in heat exchanger 2 by the cold anode off-gas stream and the partial air stream to approximately 160°C. After compressing the anode off-gas stream by the recirculation blower, the recirculated stream is reheated above 400°C via heat exchanger 2.
The parameters required for the simulation and the boundary conditions are listed in Table I.
Table I. Definition of the system operating parameters.
| Parameter | Value |
|---|---|
| Design Power Output | 5 kWel (DC) |
| Cell Type | Anode Supported Cell |
| Composition of Fuel | 100 mol% CH4 |
| Composition of Air | 21 mol% O2, 79 mol% N2 |
| Maximum Stack Temperature | 780°C |
| Active Cell Area | 0.0361 m2 |
| Cells per System | 36 |
| Current Density at Design Load | 0.5 A/cm2 |
| ASR0 | 8.15664e-09 Ωm2 |
| ASR – EA (Activation energy) | 69005 J/mol |
| System Inlet Temperature Fuel | 25°C |
| System Inlet Temperature Air | 25°C |
| System Outlet Temperature Exhaust | 60°C |
| Pre-Reformer Type | Steam Reformer |
| Maximum Inlet Temperature of Recirculation Blower | 160°C |
| Isentropic efficiency of blower | 60% |
| Mechanical efficiency of blower | 50% |
| Electrical efficiency of blower | 90% |
| Heat losses | Adiabatic |
Results and Discussion
The effects of different recirculation rates on power demand of air and recirculation blower as well as on cell voltage and on anode-side molar steam fraction at stack inlet for a stack fuel utilization of 75% are shown in Figure 3. With increasing recirculation rate the power demand of the recirculation blower increases exponentially, since both the recirculated anode off-gas flow and the anode-side pressure losses increase. In particular, at recirculation rates above 85%, a small increase in recirculation rate leads to a large increase in mass flow. Thus, for an increase from 85 to 90%, the power demand of the recirculation blower is more than doubled. In contrast, the power demand of the air blower decreases with increasing recirculation rate, because the high anode off-gas flow provides additional cooling of the stack. Moreover, the system fuel utilization increases with increasing recirculation rate (according to Equation 20). Due to the higher system fuel utilization less fuel is converted in the off-gas burner leading to a decreasing off-gas temperature. Lower gas temperatures reduce the cathode side air inlet temperature. Thus, the temperature difference between air inlet and outlet of the stack increases and so the required amount of cooling air is reduced.
Figure 3. (a) Power demand of the air and recirculation blower at different recirculation rates. (b) Cell voltage and molar steam fraction at the stack inlet at different recirculation rates. (The curves in (a) and (b) correlate with a stack fuel utilization of 75%).
Higher recirculation rates lead to an increasing molar fraction of electrochemically produced steam in the anode off-gas flow. The increased amount of steam results in an increasing partial pressure of steam at the stack inlet. Thus, the Nernst voltage and so the cell voltage decreases. In Figure 3b can be seen, that an elevated recirculation rate for example from 55 to 85% results in a cell voltage drop of 73 mV. At design load, the power output of the stack would fall by 473 W.
Despite the adverse effects (cell voltage drop, increased power demand of recirculation blower), the electrical system efficiency can increase by an anode off-gas recirculation. In Figure 4, the electrical system efficiency curves at design current density are shown as function of recirculation rate and stack fuel utilization. For stack fuel utilizations below 80% and increasing recirculation rates an increase of the electrical efficiency is recognizable. In contrast to that, rising recirculation rates in combination with stack fuel utilizations higher than 80% lead to an efficiency drop. Recirculation rates of more than 85% decrease the efficiency, regardless to the fuel utilization in the stack. Therefore, a maximum electrical efficiency can be found depending on the stack fuel utilization and recirculation rate. The maximum efficiencies are shown in Figure 4 by the dashed MAX-curve. As can be seen, the maximum electrical efficiencies are achieved with the smallest possible recirculation rates at simultaneously high stack fuel utilizations.
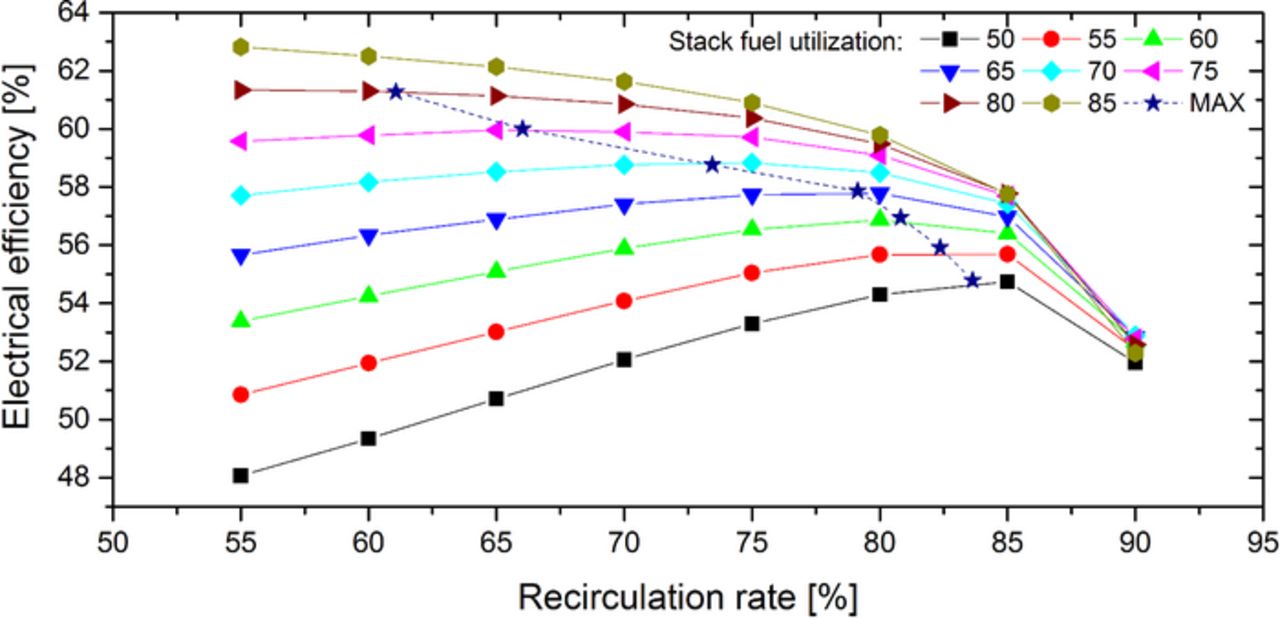
Figure 4. Electrical system efficiency at different recirculation rates and stack fuel utilizations.
At high stack fuel utilizations only a small increase in system fuel utilization is reachable by an anode off-gas recirculation, since most of the available fuel is already converted in the stack (according to Equation 20). In this case, the use of an anode off-gas recirculation leads to the disadvantages already explained, such as cell voltage drop and increasing power demand of the periphery. However, for small stack fuel utilizations the recirculation of anode off-gas enables significantly higher system fuel utilizations compared to the fuel utilization in the stack. For example, the system fuel utilization increases at a recirculation rate of 75% and stack fuel utilization of 50% by 30 percentage points to 80%. In contrast, with the same recirculation rate and stack fuel utilization of already 80%, the fuel utilization in the system can be elevated only by 14 percentage points. Thus, the electrical efficiency rises despite the adverse effects at low stack fuel utilizations and increasing recirculation rates.
Figure 5a shows the optimal recirculation rate curve, which leads to a maximum efficiency depending on the stack fuel utilization. The curve is based on the MAX-curve shown in Figure 4 and fitted by a 2nd order polynomial:
![Equation ([21])](https://content.cld.iop.org/journals/1945-7111/162/9/F982/revision1/jes_162_9_F982eqn22.jpg)
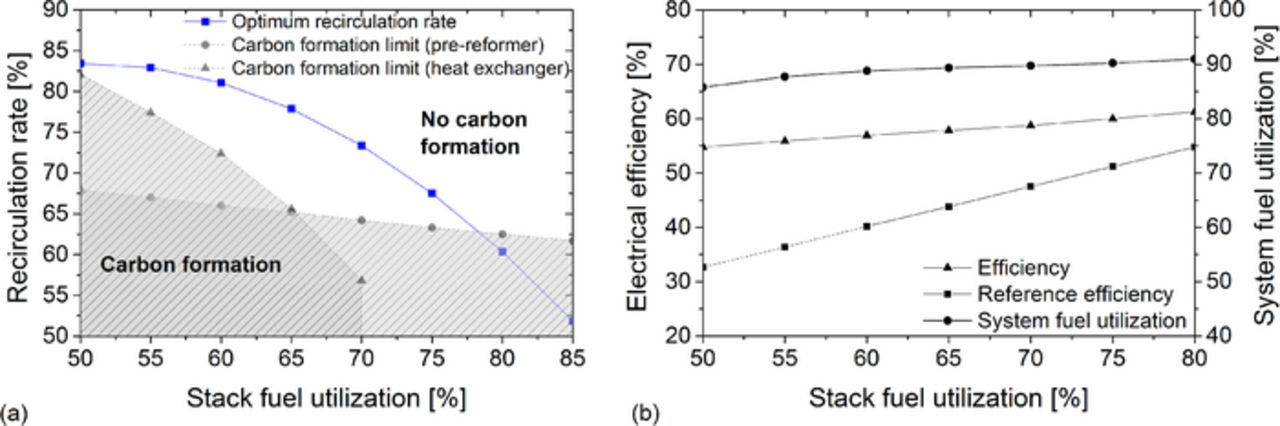
Figure 5. (a) Optimum recirculation rate to reach the maximum electrical efficiency at different stack fuel utilizations. (b) System fuel utilization and electrical efficiency of the SOFC system with and without anode off-gas recirculation at different stack fuel utilizations and optimal recirculation rate.
The scope of the polynomial is limited to stack fuel utilizations between 50 and 80%. Comparisons with other calculated system configurations showed a similar peak curve.
In Figure 5a the system limitations are plotted, which lead thermodynamically to carbon formation. In the investigated system configuration carbon formation has to be considered in two components. The first one is heat exchanger 2. Here, the carbon formation risk is high due to low temperatures (160°C). With rising system fuel utilization methane and carbon monoxide fraction in the anode off-gas decreases whereas steam and carbon dioxide fraction increases. This results in a decreasing carbon formation risk and can be seen at the sloping curve in Figure 5a. The second component is the pre-reformer. Here, the carbon formation risk is high because methane is supplied to the system at the inlet of the pre-reformer. Especially at low recirculation rates and thus low steam fractions in the recirculated anode off-gas, the steam to carbon ratio can become very low. To prevent carbon formation, recirculation rates below 63% have to be avoided.
Figure 5b shows the fuel utilization and electrical efficiency of the system with anode off-gas recirculation at different stack fuel utilizations. In this case, the optimal recirculation rate, presented in equation 21, was assumed. With rising stack fuel utilization, the electrical efficiency and system fuel utilization increase. Therefore, maximum electrical efficiencies require high stack fuel utilizations. Figure 5b also presents the efficiency curve of an SOFC system without anode off-gas recirculation (reference efficiency). This efficiency was calculated with the same operating conditions given in Table I. Particularly at low stack fuel utilizations the electrical efficiency can be significant increased by the use of an anode off-gas recirculation. It should be noted, that low stack fuel utilizations in an SOFC system without recirculation lead to high off-gas burner temperatures (> 950°C) and thus to an unrealistically high amount of cathode-side cooling air. Therefore, the reference curve is presented by dashed lines in the lower stack fuel utilization area. With increasing stack fuel utilization, the potential efficiency gain of an anode off-gas recirculation is reduced. However, at a stack fuel utilization of 80% the electrical efficiency is still 6.5 percentage points higher compared to the system without anode off-gas recirculation. Regardless of the efficiency, the advantage of the water independency remains always maintained.
At Forschungszentrum Jülich GmbH, it was decided to build the system shown in Figure 2 and to operate it at a stack fuel utilization of 75% and recirculation rates between 65 and 70%. This suggests an electrical system efficiency of more than 60%. The experimental results will be published later.
Conclusions
For the dynamic analysis of an SOFC system with anode off-gas recirculation a Matlab/Simulink model was developed. The model is based on a stirred tank reactor cascade. The simulation results of the presented SOFC system, which was operated with a low temperature blower in the anode recirculation loop, are summarized below:
- (1)An anode off-gas recirculation always improves the electrical efficiency compared to a conventional system without recirculation.
- (2)For a stack fuel utilization between 50 and 80% an appropriate recirculation rate polynomial was found, which enables to find the maximum electrical efficiency.
- (3)The highest electrical efficiencies can be reached at high stack fuel utilizations in combination with low recirculation rates.
- (4)Recirculation rates below 63% lead to an increasing risk of carbon formation.
Acknowledgments
The authors thank their colleagues in the SOFC department. The department Technology Transfer of Forschungszentrum Jülich GmbH is acknowledged for their financial support.