Abstract
A technique to measure the cation-transference number of salts in fully hydrated ion-selective membranes has been developed and demonstrated on Nafion 117 for LiCl and Li2SO4. Dilute solution theory is used to identify experimental conditions that reduce the propagation of uncertainties in membrane properties to transference number estimates. This technique has advantages over commonly used methods, including the elimination of the need for the analysis of electrode potentials in approaches that exploit electroanalytical methods or the need for additional information required to reconcile NMR-based methods with the bulk transport property. It additionally allows for numerous measurements per day and offers the possibility to relate trace measurements of either cations or anions to values of transference number. For LiCl both modes of the technique were employed; the anion-tracer method is more precise and gives t+ = 0.936 ± 0.010. The experimental procedure was repeated using the cation-tracer method for Li2SO4, and t+ = 0.95 ± 0.06 was estimated.
Export citation and abstract BibTeX RIS

This is an open access article distributed under the terms of the Creative Commons Attribution 4.0 License (CC BY, http://creativecommons.org/licenses/by/4.0/), which permits unrestricted reuse of the work in any medium, provided the original work is properly cited.
The 21st century presents a key challenge in energy storage due to the intermittency of wind and solar energy sources. Lithium ion batteries, fuel cells, and redox flow batteries are promising technologies for energy storage since they have high energy densities, are environmentally friendly, and have an array of other desirable properties.1–6 Solid electrolytes are ubiquitous for these energy storage systems since they serve the important function of mechanical separation between electrodes. In addition, solid electrolytes circumvent several problems associated with liquid electrolytes such as the leakage of electrolyte solution and the reaction of volatile organic solvents.7 Of the solid electrolytes, polymer electrolytes have garnered the most interest in recent years.8–11 These membranes facilitate ionic transport between electrodes, inhibit electron flow between electrodes, prevent direct contact between electrodes, and minimize mixing of the anolyte and catholyte.
In recent decades, researchers have sought to understand the relationship between the molecular structure of polymer electrolytes and their performance. These structure-property relationships have been developed for two major types of polymer electrolytes: (I) mixtures of salts in high molecular weight polymers and (II) polymerized ionic liquids (single ion conductors). Polyethylene oxide (PEO), polypropylene oxide (PPO), and 4 poly[bis(methoxy-ethoxy-ethoxy) phosphazene] (MEEP) are all promising Type I polymer electrolytes.12–16 The electron-donating groups incorporated into the polymer architecture are responsible for solvating the lithium ion while the fast segmental dynamics promote high ionic conductivities through fluctuation-driven diffusion.17–19 However, Type I polymer electrolytes typically suffer from poor mechanical properties, which is an unfortunate compromise for the fast segmental dynamics. Furthermore, Type I polymer electrolytes have relatively poor transference numbers that reflect the relative diffusion of the ions of opposite charge in the high molecular weight polymer. Single ion conductors, Type II polymer electrolytes, synthetically immobilize an ion (either an anion or cation) through a covalent linkage to the polymer chain, and forces the counterion of the membrane's fixed ion to carry most of the current between the electrodes. Polystyrene sulfonate (PSS) and poly(4-vinylbenzylhexylimidazolium bis-trifluoromethylsulfonimide) (PVBnHexImTFSI) are good examples of type II polymer electrolytes, where transference numbers are expected to approach unity.11
Although recent advancements have been made in the field, researchers struggle to rationally design polymer electrolytes. Difficulties in membrane development are partly due to unresolved challenges in membrane characterization.20 The performance of polymer electrolytes is characterized by three transport properties: conductivity (σ), salt diffusivity (Dsalt), and cation transference number (t+).21 The latter two transport properties, however, are often unreported in the literature due to experimental challenges in their measurements. The value of t+ is particularly laborious to determine. The most common techniques to measure t+ include potentiostatic polarization, galvanostatic polarization, electromotive force method, determination by NMR, and the Hittorf Method.22–25 There are several challenges with each of these methods, however: (1) These methods often indicate inconsistent t+ values for the same materials (2) t+ measurements span several days, and (3) t+ measurements have high uncertainties. Of these methods, potentiostatic polarization and determination by NMR are most common in the recent literature.
It has been shown that potentiostatic polarization coupled to impedance spectroscopy can lead to substantially different t+ measurements than more comprehensive methods due in part to non-idealities in the electrodes that may impact analysis of the electrochemical measurements.26,27 Determination by NMR measures an element rather than a dissociated ion, and therefore, additional information about the state of dissolution is required while using this method.28 In contrast, the method used here relies on measurement of steady-state ion concentrations (that need not be real time) and do not require analysis of experimental measurements of electrochemical potentials.
In this study, we present a continuous flow technique to measure t+ of a salt in an ion-selective membrane. The device contains two reservoirs that are separated by the membrane. One reservoir of the device houses an anode while the second reservoir houses a cathode. Additionally, the electrolyte in one of the reservoirs contains the target salt for which t+ is measured, and the electrolyte in the second reservoir contains a tracer electrolyte (with one shared ion across the two membranes, e.g., LiCl/KCl, LiCl/Li2SO4). Typically, the tracer electrolyte contains an equal concentration for one of the ions of the target salt. For instance, if the target electrolyte is 0.1 M LiCl, then the tracer electrolyte can be 0.1 M KCl to balance the Cl ions or 0.05 M Li2SO4 to balance the Li ions. Experiments with identical anions in the two reservoirs are termed cation-tracer experiments, and similarly, experiments with balanced cation concentrations are termed anion-tracer experiments. When no current is applied between the electrodes, the ions are transported across the membrane via restricted diffusion. When a constant current is applied across the membrane, especially in the limit of high current densities, electrical migration drives the target ion across the membrane and restricts the flow of the tracer ion across the membrane. Consequently, the tracer ion's impact on the t+ measurement is minimized at high currents.
Numerical simulations are used to further reduce uncertainties introduced by the tracer ion on the t+ measurement. The simulations for cation-tracer experiments with Nafion 117 indicate that properties of the tracer ion, specifically its diffusivity and solubility in the membrane, have a small impact on the t+ measurement. These properties, however, can be estimated by the measurement of flux of the target ion and tracer ion across the membrane to minimize their effect on the estimated transference number. The simulations for anion-tracer experiments with Nafion 117 show that the tracer ion has virtually no impact on the t+ measurement, and therefore, additional properties of the tracer ion need not be estimated. Consequently, the simulations demonstrate that anion-tracer experiments result in more accurate values of t+ in Nafion 117 than cation-tracer experiments. More generally, the charge of the tracer ion should have the same sign as the charge of the membrane's fixed ion for the most accurate t+ measurements. The values of t+ of LiCl and Li2SO4 in Nafion 117 were experimentally measured to validate the theory and the method.
Theory
In the experimental setup, a dilute solution of each of the electrolytes flows through reservoirs adjacent to the ion-selective membrane, one on each of its two sides. A constant current density applied across the membrane affects the flux of ions across the membrane. The computationally determined fluxes depend on the value of t+. Table I provides a summary of the subscripting conventions for the three simulated experiments. In the first cation-tracer experiment, 0.1 M LiCl is placed in the anode reservoir, and 0.1 M KCl is placed in the cathode reservoir. In the second cation-tracer experiment, 0.05 M Li2SO4 is placed in the anode reservoir, and 0.05 M K2SO4 is placed in the cathode reservoir. Lastly, in the anion-tracer experiment, 0.05 M Li2SO4 is placed in the anode reservoir and 0.1 M LiCl is placed in the cathode reservoir.
Table I. Subscripts for the three experiments of this study.
| Li measurement | Li measurement | Cl measurement | |
|---|---|---|---|
| Species | for LiCl t+ | for Li2SO4 t+ | for LiCl t+ |
| Cl | 1 | - | 2 |
| Li | 2 | 2 | 1 |
| K | 3 | 3 | - |
| SO4 | - | 1 | 3 |
Simulations also provide a basis to design experiments to minimize uncertainties in the transference number. The flux of ions is assumed to follow dilute-solution theory.21
![Equation ([1])](https://content.cld.iop.org/journals/1945-7111/164/13/A2940/revision1/d0001.gif)
where the velocity v is assumed to be zero in the membrane, and the ionic mobility uj is given by Nernst-Einstein relationship:
![Equation ([2])](https://content.cld.iop.org/journals/1945-7111/164/13/A2940/revision1/d0002.gif)
For more concentrated electrolytes, concentrated solution theory, which may account for electro-osmotic water flows for example, may be introduced to further refine the present treatment. The current density across the membrane is carried by the mobile ions within the electrolyte. Consequently, the current density can be related to the flux of ions. The relationship is quantified by the following expression:
![Equation ([3])](https://content.cld.iop.org/journals/1945-7111/164/13/A2940/revision1/d0003.gif)
It is assumed that the electrolyte is well mixed, so that there are no concentration gradients in the electrolyte (concentration polarization) on either side of the membrane. Consequently, the following boundary conditions for each species are provided:
![Equation ([4])](https://content.cld.iop.org/journals/1945-7111/164/13/A2940/revision1/d0004.gif)
![Equation ([5])](https://content.cld.iop.org/journals/1945-7111/164/13/A2940/revision1/d0005.gif)
The system is constrained to obey electroneutrality, assuming a fixed charge of zfcf on the membrane:
![Equation ([6])](https://content.cld.iop.org/journals/1945-7111/164/13/A2940/revision1/d0006.gif)
For the present purposes, the reported transference number is defined as if only two species are present. This would be the anticipated value when the tracer ion is removed from the system, as we assume this is of practical interest for the present study.
![Equation ([7])](https://content.cld.iop.org/journals/1945-7111/164/13/A2940/revision1/d0007.gif)
![Equation ([8])](https://content.cld.iop.org/journals/1945-7111/164/13/A2940/revision1/d0008.gif)
Code was written in fortran95 using a block tridiagonal matrix algorithm developed by Newman21 to solve the set of equations and boundary conditions. The solution to the governing expression subject to the boundary-condition constraints is dependent on four dimensionless ratios: D1/D2, D3/D2, S3/S2 and t+. These four parameters can be fit to experimental data, or alternatively, the parameters D1/D2, D3/D2, and S3/S2 can be experimentally determined to constrain the measurement of t+. However, the value of t+ generally has the most prominent effect in the simulation, and therefore, its value can be estimated even with uncertainty in the other dimensionless parameters. As a means of parameter estimation, a quasi-random search using Sobol sequences in Python was conducted over the 4-dimensional parameter space. The optimal parameter values were determined by searching for a minimum in a weighted least-squares value. One million Sobol points, corresponding to one million sets of parameters, were used, and the standard-deviation of the top 100 results provides an estimate of the precision in the transference number given the uncertainty in the other parameters.
Example results for the concentration profiles within the membrane for zero, intermediate, and high current densities are presented in Figure 1. At zero current density, both cations have significant concentrations throughout the membrane, and at high current densities, electrical migration forces a high concentration of Li and a low concentration of K throughout the majority of the membrane thickness. Consequently, the flux of Li as i→∞ does not depend on the ratio D3/D2, thereby eliminating a source of uncertainty arising from introduction of the tracer salt.
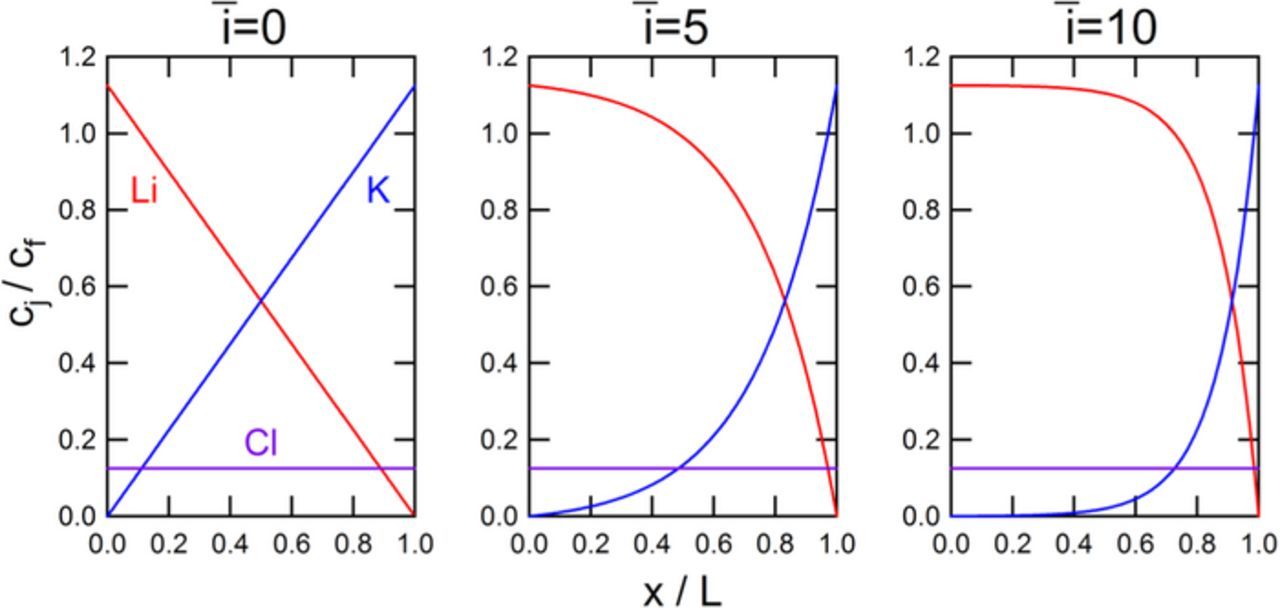
Figure 1. Simulated concentration profiles of the ions present within the membrane for a cation-tracer experiment for three applied current densities. Simulations assume D1/D2 = 1.0, D3/D2 = 1.0, S3/S2 = 1.0, and t+ = 0.90.
From the concentration profiles, the mathematical framework calculates the dimensionless flux of each species across the membrane. The flux of species 2 (shown in Table I) is of particular interest because its experimental measurement is used to determine t+. The theoretical flux of species 2 is presented as a function of current density in Figure 2. The dimensionless flux and current density are defined as:
![Equation ([9])](https://content.cld.iop.org/journals/1945-7111/164/13/A2940/revision1/d0009.gif)
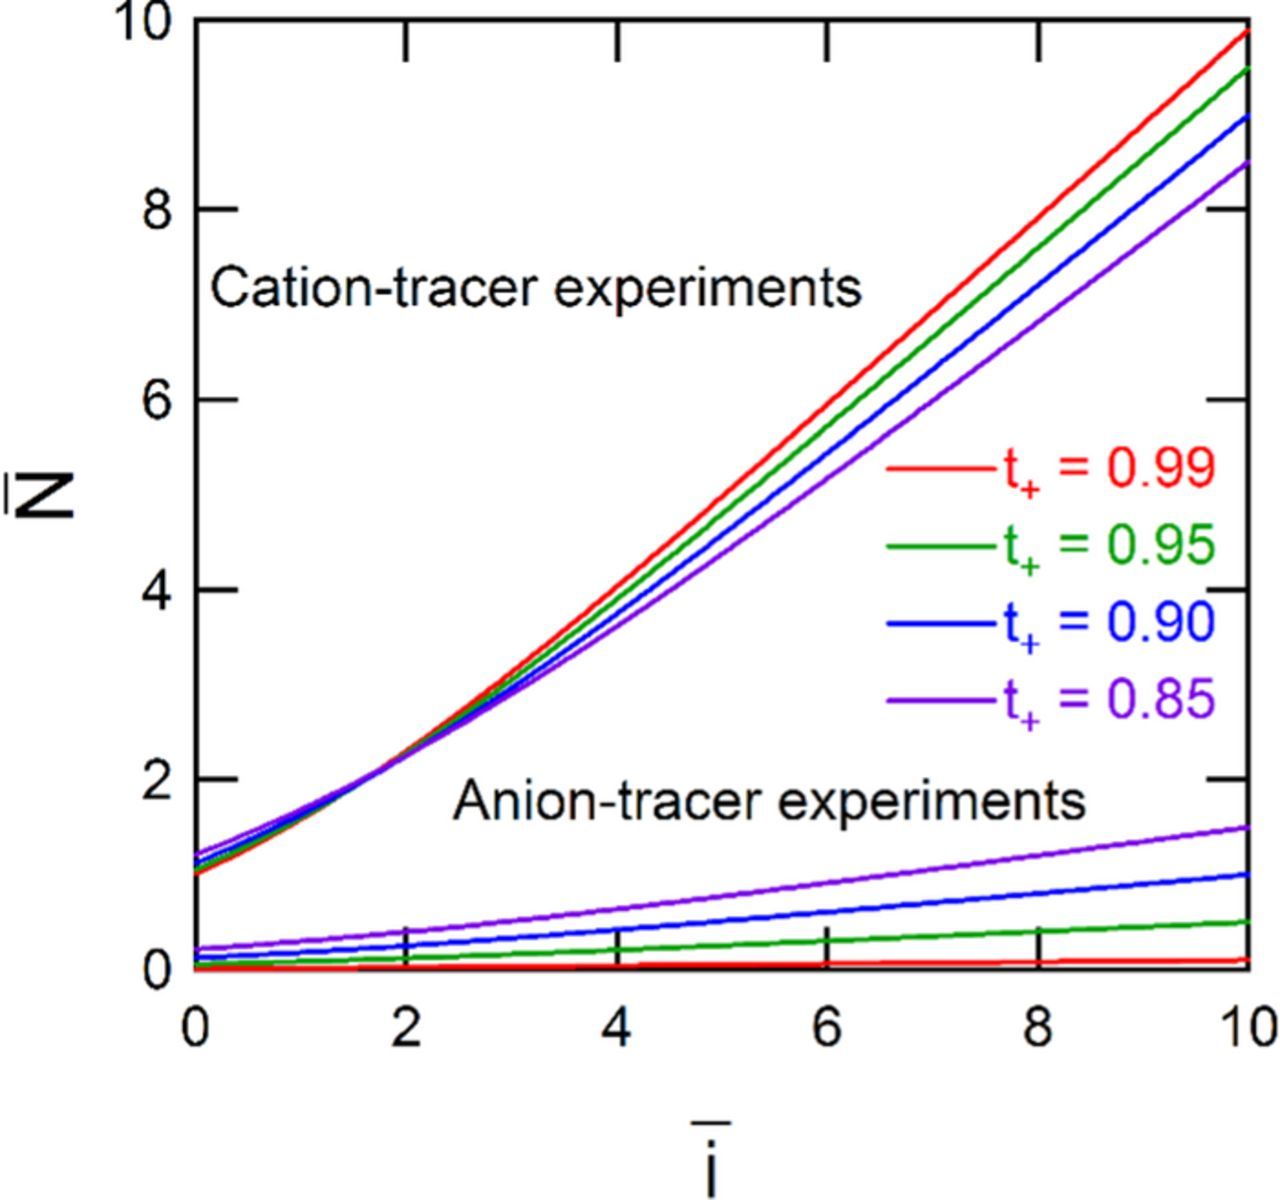
Figure 2. The simulated dimensionless flux of the measured species as a function of normalized dimensionless current density. The values of the three parameters in these models are: D1/D2 = 1, D3/D2 = 1, and S3/S2 = 1.
The quantity L/(D2cf) may not be known, especially for novel materials. However, this value is not required to compare simulations to experiment while estimating the transference number. Specifically, normalization of the applied current density with the zero-current flux of species 2 allows for comparison of simulation to experiment: The normalization of the measured flux with the applied current density allows facile comparison of experiment and simulation through
  . This normalization of the flux has the further advantage of reaching an asymptotic value at high current densities.
Figure 3 shows simulation results of a cation-tracer experiment and an anion-tracer experiment for different parameter values. Table II provides a summary of the impact of the parameters on simulation results for cation-tracer as well as anion-tracer experiments. For anion-tracer experiments, the simulation results are only sensitive to transference number. For cation-tracer experiments, the value of the ratio D3/D2 is significant at low currents and has virtually no effect at high current. The ratio D1/D2 has no effect on the simulation results when S3/S2 = 1; however, when S3/S2 is not equal to unity, the anion concentration is not constant, and consequently, D1/D2 is of small importance. These general trends provide guidance on the best means of estimating transference number. The insets of Figure 3 show the range of transference numbers from the top-100 best fit estimates of transference numbers to experiments (discussed below). The spread in the other parameters is relatively larger because they have a much smaller impact on simulation results. The estimated transference number shows low sensitivity to other parameters for the cation-tracer experiments and essentially zero sensitivity for the anion-tracer experiment.

Figure 3. Simulated normalized fluxes as a function of normalized current density. The solid lines of these plots assume D1/D2 = 1, D3/D2 = 1, and S3/S2 = 1. The dashed lines for the cation-tracer experiments (a) assume D1/D2 = 0.3, D3/D2 = 0.4, and S3/S2 = 0.9. The dashed lines for the anion-tracer experiments (b) assume the same ratios for the species present.
Table II. The importance of each of the four dimensionless parameters for the analysis of the theoretical model.
| Dimensionless parameter | Current range where model is affected | General magnitude of effect for cation-tracer studies | General magnitude of effect for anion-tracer studies |
|---|---|---|---|
| D1/D2 | All currents | No effect if S3/S2 = 1; small effect if S3/S2 ≠1 | Virtually no effect |
| D3/D2 | Low currents | Large effect | Virtually no effect |
| S3/S2 | All currents | Small effect | Virtually no effect |
| t+ | All currents | Large effect | Large effect |
For the cation-tracer experiments (Fig. 3a), the asymptotic value of normalized flux is approximated by the following expression for high values of t+ (≥0.8):
![Equation ([10])](https://content.cld.iop.org/journals/1945-7111/164/13/A2940/revision1/d0010.gif)
Note that the ratio D3/D2 is not important. For the anion-tracer experiments (Fig. 3b), the results are insensitive to all parameters except t+. In the high current limit, the anion-tracer flux can be approximated by:
![Equation ([11])](https://content.cld.iop.org/journals/1945-7111/164/13/A2940/revision1/d0011.gif)
Note that for an anion-selective membrane the high current limit is t+. The high current limits are defined as values of i/(FN2,i = 0) that result in constant values of FN2/i, which are approached for cation-tracer studies when:
![Equation ([12])](https://content.cld.iop.org/journals/1945-7111/164/13/A2940/revision1/d0012.gif)
At high current densities, however, concentration polarization (i.e., concentration variations in the near-membrane diffusion layers of the reservoirs) becomes more likely to interfere with the flux measurement due to the relatively high cationic flux. Values of i/(FN2,i = 0) < 10 may be used to determine t+, but result in some uncertainty in the t+ measurement. For anion-tracer studies, the high current limits can be approximated as:
![Equation ([13])](https://content.cld.iop.org/journals/1945-7111/164/13/A2940/revision1/d0013.gif)
Methodology
An AutoCAD schematic of the microfluidic device used for determination of transference number is presented in Figure 4. The device, consisting of two sections, was constructed by etching a slab of poly methyl methacrylate (McMaster Carr). The two components of the device were symmetrical in shape with dimensions presented in the figure. One component housed the Pt anode and allowed for the flow of lithium electrolyte (either 0.1 M LiCl or 0.05 M Li2SO4), whereas the second component housed the Pt cathode and allowed for the flow of potassium electrolyte (either 0.1 M KCl or 0.05 M K2SO4). In the experiments, the values of t+ for LiCl and Li2SO4 were measured, while KCl and K2SO4 were used as tracer salts. Tube fittings (McMaster Carr) were inserted into the inlet and outlet ports to connect the device to external polymer tubing. Pt wire with a diameter of 0.1 cm (Sigma Aldrich) was pierced through the outlet tube fittings, inserted into the microfluidic device, and epoxied to fill the piercing.
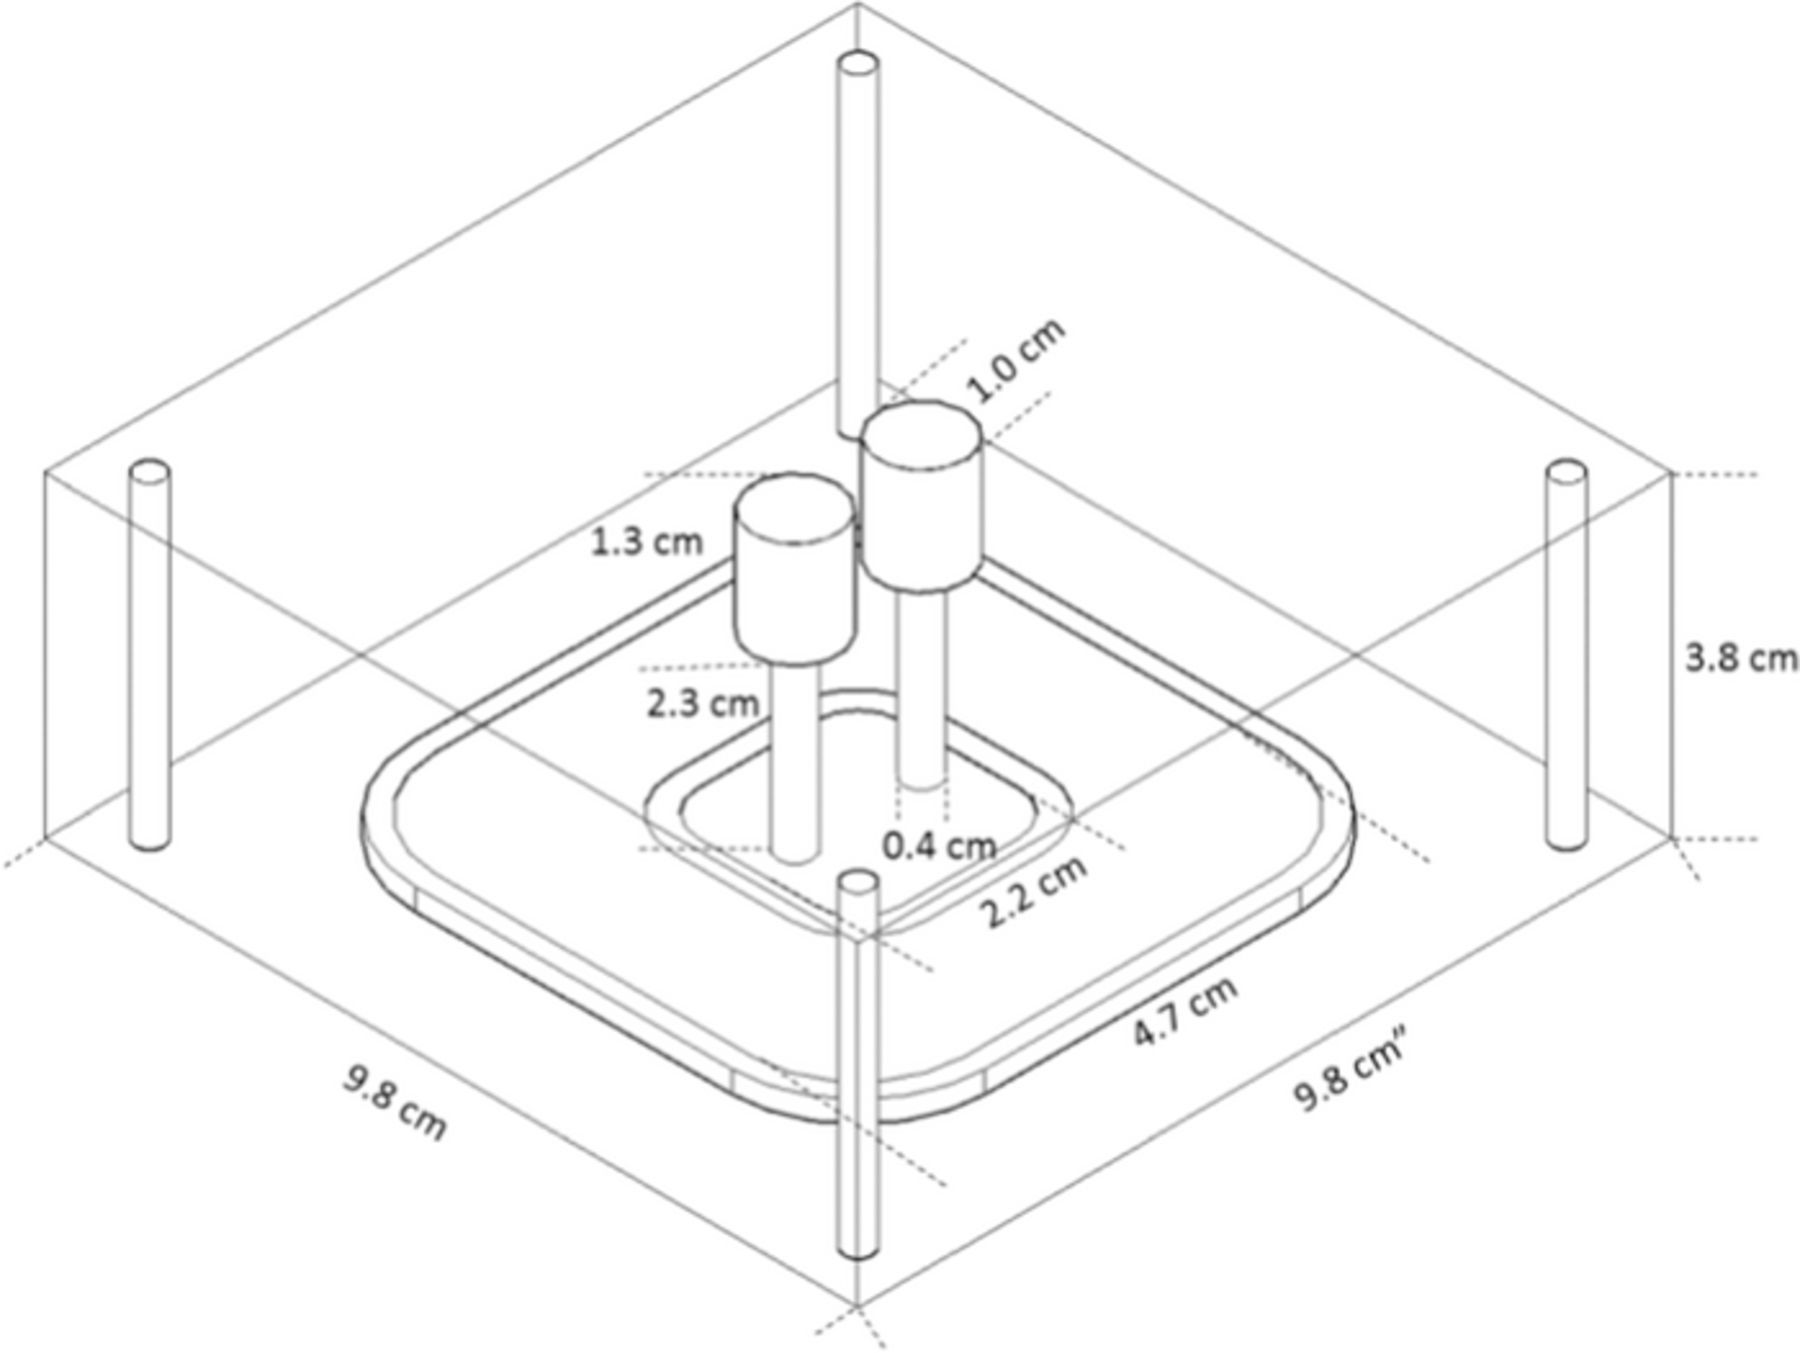
Figure 4. Schematic of one compartment of the microfluidic device used in our experiments. The outer ridge with length 4.7 cm provided a lock-and-key mechanism for the device. The inner ring of 2.2 cm supported an o-ring.
Experiments were conducted with Nafion 117 membrane (Sigma Aldrich) since this membrane is fairly well characterized and thus ideal to evaluate the methodology. As in the literature,29 the Nafion membrane was pretreated by slight boiling in 3% H2O2 at 80°C for one hour, followed by boiling in DI water at 80°C for 2 hours, and subsequent boiling in 0.5 M H2SO4 at 80°C for one hour. Kapton tape was then used to cover a fraction of the membrane, defining the area available for mass transport to be a circle with an area of 0.3 cm2. The Nafion membrane was soaked overnight in lithium salt, either 0.1 M LiCl or 0.05 M Li2SO4, before t+ measurements of the respective salts. The membrane was fixed between the two compartments of the microfluidic device, which was fastened together with four screws. The same membrane was used for all experiments.
The experimental process for cation-tracer experiments is shown in Figure 5. Two Kent Scientific syringe pumps controlled volumetric flow rates of electrolyte through the 1 /4'' vinyl tubing at a flow rate of 1mL/min. A μAutolab potentiostat was used to apply a constant current between the electrodes ranging from 0–5.5 mA, corresponding to a current density of 0–17 mA/cm2. Electrode reactions were believed to be hydrogen evolution at the cathode and oxygen evolution at the anode, though the measurements do not depend on the electrode-reaction assumptions, as long Li and K are not electrode reactants or products under the present aqueous environment. Since the electrodes were positioned in the outlet ports, the reaction products were purged out of the device, and therefore, had minimal interference with the membrane processes. For each applied current, 55 mL of electrolyte were used. The device-liquid volume, including tubing, was approximately 5 mL on both the cathode and anode sides. Thus, the first 40 mL of sample were discarded and the last 15 ml were collected, and this was estimated to allow a steady-state measurement.

Figure 5. Schematic of the experimental process. During the cross-flow of LiCl and KCl, a constant current is applied across the Nafion 117 membrane.
The experimental process for the anion-tracer experiments (Table I) were analogous to the cation-tracer experiments. However, the membrane area for these studies was increased to 1.3 cm2 to increase the concentration of the outlet samples to a measurable range. A 2410 Keithley Sourcemeter DC power supply was used to apply a constant current ranging from 0–16 mA, corresponding to 0–13 mA/cm2.
Concentrations of the cationic outlet samples were measured with atomic absorption spectroscopy (AAS) using a Buck Scientific Model 200A spectrometer. Absorbance readings scaled linearly with concentration (R2 > 0.99) over a range of 1–5ppm for both Li and K. For either species, 5-point calibration curves were obtained immediately before concentration measurements of the outlet samples, which were diluted to fall within the calibration range. Higher currents resulted in greater flux of Li and lower flux of K across the membrane, so the dilution step was modified appropriately for each current.
Concentrations of the chloride ion from the anionic outlet samples were measured with Mohr's method.30 Sample volumes of 10–12 ml were taken from the outlet samples. Due to water electrolysis, the anode reservoir was acidic, and therefore, the pH was tuned to a value between 7 and 8 with 0–1.8 mL of 0.1M bicarbonate. The indicator solution, 100 uL of 5% potassium chromate, was added to the solution. Lastly, 0.01M silver nitrate was used to precipitate the chloride ion until the indicator produced a change in color of the solution. The concentration of chloride in solution was related to the volume of silver needed for the titration.
For all experiments, the ionic flux was determined from the concentration measurements using a modified version of Fick's first law:
![Equation ([14])](https://content.cld.iop.org/journals/1945-7111/164/13/A2940/revision1/d0014.gif)
where cj represents the measured outlet concentration, Q represents the volumetric flow rate, and A is the cross-sectional area of the membrane available for transport.
Results and Discussion
The measured flux across the Nafion 117 membrane as a function of applied current density for LiCl and Li2SO4 is shown in Figure 6. Measurements at current densities greater than 6.3 mA/cm2 for LiCl and greater than 9.5 mA/cm2 for Li2SO4 were characterized by larger scatter, as indicated by the error bars. Furthermore, they begin to deviate from the nearly linear dependence on applied current. Analysis suggests that concentration polarization, i.e, mass transfer resistances within the flowing electrolyte may begin to be important. The flux of Li was equal to or slightly greater for Li2SO4 than LiCl for all applied current densities unaffected by concentration polarization, although the difference in flux is small compared to the experimental error of the measurements. The flux of Li is only slightly greater for Li2SO4 than for LiCl because Nafion is highly cation-selective for both salts. The value of t+ may be slightly greater for Li2SO4 than LiCl, which would be expected because (1) the sulfonate groups of Nafion electrostatically repel the sulfate group more than they repel chloride ions, and (2) sulfate is larger than chloride, suggesting a lower anion diffusion coefficient. The molar flux of Cl was approximately a factor of 10 less than the flux of Li, which is to be expected for a cation-selective membrane.

Figure 6. Experimental flux of species 2 as a function of applied current density for the three experiments of this study. Three trials were conducted for most data points, and the error bar is the standard deviation of the measurement.
The flux of K across the membrane is shown as a function of current density for KCl and K2SO4 in Figure 7. The flux of K for KCl and K2SO4 was measured simultaneously to the flux of Li for LiCl and Li2SO4, respectively. At zero current, the K flux was approximately the same value as the Li flux, as should be expected from Equation 3 in the limit that t+ → 1. As the current density increased, the flux of K decreased exponentially. The flux of K for KCl cannot be differentiated from the flux for K2SO4 within experimental error. This is partly because the flux of the K approaches zero at high current, and therefore, the high current data cannot be analyzed to compare relative t+ values.

Figure 7. Experimental potassium flux at varying applied current density for KCl and K2SO4. Three trials were conducted for most data points, and the error bar is the standard deviation of the measurement.
Li measurement for LiCl transference number
The subscripts 1,2 and 3 are replaced with Cl, Li, and K, respectively for this section (Table I). To facilitate the analysis of t+, the current density, Li flux, and K flux of Figures 6 and 7 were normalized and subsequently compared with the outlined multi-ion transport theory. As discussed in the theory, the current density was normalized by the Li flux at zero current, and the Li flux was normalized by the current density. The K flux was normalized by the Li flux since this ratio should approach one at zero current if t+ = 1. The normalized Li flux and normalized K flux are shown as a function of the normalized current density in Figures 8 and 9, respectively. Vertical error bars of the experimental data were determined from the standard deviation in the measurements at each applied current density. Horizontal error bars were determined from the standard deviation in the measurements of NLi at zero current density.
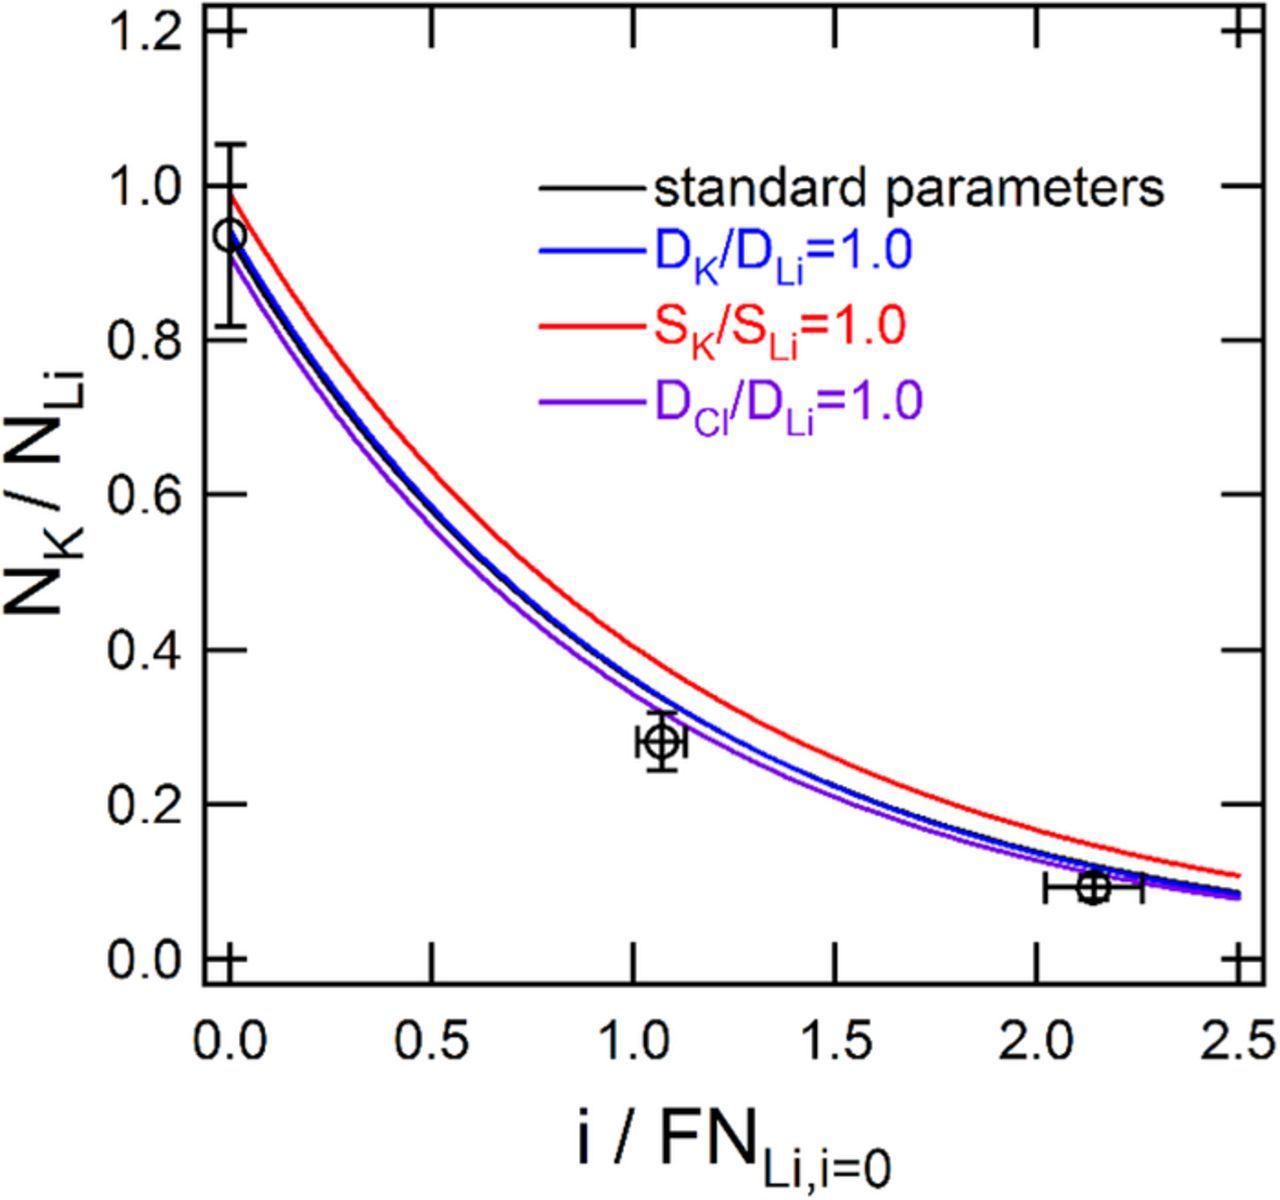
Figure 8. Experimental and simulated ratio of potassium to lithium fluxes as a function normalize current density for KCl and LiCl. Simulation results (labeled standard parameters) are shown using the optimal parameters: DCl/DLi = 0.68 DK/DLi = 0.90, SK/SLi = 0.92, and t+ = 0.90. Values of unity are presented for the first three parameters, while keeping all other parameters constant.

Figure 9. Experimental and simulated, normalized Li flux as a function of normalized current density for LiCl. A simulated value of t+ = 0.90 is in the best agreement with the collected data set. The values of DCl/DLi, DK/DLi, and SK/SLi in the simulation were 068, 0.90, and 0.92, respectively.
In the multi-ion transport theory, the normalized fluxes of Figures 8 and 9 depend on DCl/DLi, DK/DLi, SK/SLi, and t+, and therefore, strategies were employed to fit the four parameters to the experimental data. A weighted least-squares analysis was performed on the two figures simultaneously to optimize the four dimensionless parameters. The zero current data for Figure 8 and the high current data (i/FNLi,i = 0 > 3) for Figure 9 were used in the analysis since these data lead to the most reliable values of t+. The data at i/FNLi,i = 0 ∼ 1, for instance, were not accurately simulated for any parameter estimate, likely because of yet-to-be-identified simplifications in the model. Thus, the influence of this data on the t+ measurement was eliminated. We hypothesize that the inadequacy in the simulations do not have a significant impact at low currents (diffusion only) and high currents (dominated by electrical migration).
The outlined multi-ion transport theory was compared to the experimental data with one million adjustments in parameter fitting. The average and standard deviations for each of the parameters are presented for the 100 fits that resulted in the smallest sum of squares. The best least-squared-fit value of t+ was 0.90 ± 0.01, while the best-fit parameters for DCl/DLi, DK/DLi, and SK/SLi were 1.8 ± 1.4, 0.90 ± 0.06, and 0.95 ± 0.04, respectively. From a sensitivity analysis of the impact of t+ on the simulated FNLi/i (Figure 2) and additional uncertainty associated with parameter co-variance, we conclude t+ = 0.90 ± 0.03. Note that if the parameters SK/SLi, DK/DLi, and DCl/DK were set to unity then t+ would be estimated as 0.93 from Figure 9. The measurement of t+ for LiCl is in agreement with the literature values, which range from 0.82 to 0.988 at varying LiCl concentration.31,32
The quantity L/(DLicf) can be determined once the four dimensionless parameters are estimated. The four parameters are inserted into the model to determine the simulated dimensionless flux  . The quantity, L/(DLicf), is obtained from
  and was found to be 1.5 × 10⁻⁸ cm2 s−1 mol−1. Assuming L = 1.8 × 10⁻² cm and cf = 1.2 × 10⁻³ mol cm−3, DLi = 2 × 10⁻⁷ cm2 s−1. There is relatively small uncertainty in the values of L/(DLicf) and DLi since uncertainties in DCl/DLi, DK/DLi, and SK/SLi result in relatively small changes in
  .
.
Li measurement for Li2SO4 transference number
The subscripts 1,2 and 3 are replaced with SO4, Li, and K, respectively for this section (Table I). The same procedure was used to determine t+ for Li2SO4 as was used for LiCl. The current density, Li flux, and K flux of Figures 6 and 7 were normalized and subsequently compared with the outlined multi-ion transport theory as shown in Figure 10. The top 100 fits in the Sobol regression returned a best-fit t+ value of 0.95 ± 0.004, while the parameters DSO4/DLi, DK/DLi, and SK/SLi were 1.5 ± 1.3, 0.26 ± 0.02, and 0.99 ± 0.01, respectively. The experimental error was determined with the same method discussed above, and this results in t+ = 0.95 ± 0.06. If the parameters SK/SLi, DK/DLi, and DSO4/DK were set to unity then t+ would be estimated to be 0.97 from Figure 11.

Figure 10. Experimental and simulated, normalized Li flux as a function of normalized current density for Li2SO4. A simulated value of t+ = 0.94 is in the best agreement with the collected data set. The values of DCl/DLi. DK/DLi, and SK/SLi in the simulation were 1.55, 0.24, and 1.0, respectively.

Figure 11. Experimental and simulated, normalized Cl flux as a function of normalized current density for LiCl. A simulated value of t+ = 0.93 is in the best agreement with the collected data set. The values of DK/DLi, DCl/DLi, and SK/SLi have virtually no impact on the simulation, and therefore, their values are set to unity.
Anion-tracer method for LiCl transference number
The subscripts 1, 2, and 3 are replaced with Li, Cl, and SO4, respectively for this section (Table I). For the anion-tracer experiment, the parameters: DLi/DCl, DSO4/DCl, and SSO4/SCl have negligible effect on the theoretical model. Since these three parameters have an insignificant impact on simulation results, the measurement of tracer (SO4) flux is not needed. The complete set of data in Figure 11 was included in the fit. A value of 0.936 ± 0.001 for t+ resulted in the best fit to the experimental data, while the parameters DSO4/DLi, DK/DLi, and SK/SLi were indeterminate since simulation results were independent of their values. The additional uncertainty associated with experimental limits of anion-concentration detection and parameter co-variance leads to t+ = 0.936 ± 0.010. Applying Equation 11 to the data at the highest current density yields t+ = 0.937 ± 0.010, which is in agreement with the value obtained using the numerical simulation. The quantity, L/(DClcf), was analyzed with the same method discussed above and was determined to be 2.1 × 10⁻⁸ cm2 s−1 mol−1. From this value the diffusion coefficient, DCl, was estimated to be 1 × 10⁻⁷cm2 s−1, which is in accord with the values measured independently via the cation-tracer experiments. This analysis of DCl is an order-of-magnitude estimate since the values of L/(DClcf) and DCl are sensitive to values of DLi/DCl, DSO4/DCl, and SSO4/SCl, which were not well-characterized.
The cation-tracer mode and anion-tracer mode of experimentation give t+ = 0.90 ± 0.03 and t+ = 0.936 ± 0.010, respectively. For the anion-tracer mode, the flux of species 2 is much more sensitive to t+, and therefore, its uncertainty should be much less than for the cation-tracer mode. This is suggested in Figure 2, which shows that when t+ = 0.90, a 1% uncertainty in flux leads to an ∼1% uncertainty in t+ for cation-tracer experiments and an ∼0.1% uncertainty in t+ for anion-tracer experiments. In this study, however, the use of Mohr's method to measure chloride ion concentration had greater relative error than the use of atomic absorption spectroscopy to measure lithium ion concentration. Consequently, the anion-tracer mode showed only a factor-of-three reduction in t+ uncertainty. Nevertheless, one can conclude that 0.936 ± 0.010 is the best estimate for the Li transference number in these Nafion membranes. Generally, it is preferred to measure anion fluxes to characterize cation-exchange membranes and cation fluxes to characterize anion-exchange membranes. It has been shown, however, that the best mode of operation is also impacted by the limits of quantitation of the ion-concentration measurement, and this may impose a practical constraint.
As a final note, the dilute solution theory used for data analysis may be substituted for a concentrated solution theory, with an understanding that additional transport properties arise. While, depending on the application, this may be a warranted next step, the introduced experimental paradigm, using convective transport to allow for multiple steady state concentration measurements to achieve a facile determination of transference number, will remain a useful means of characterizing membrane transport properties. It is possible that design modifications to reduce uncertainties associated with fitting the concentrated solution theory to experiment will be required.
The present studies are likely in the dilute limit, and therefore, the re-examination of present data with concentrated solution theory is expected to result in similar values of t+. It is also possible, however, that the re-examination of the present data with concentrated solution would lead to a revised estimate of t+ that reconciles the small discrepancies between the anion and cation-tracer experiments. Furthermore, the underlying theory can be readily modified to account for complicated chemical interactions, such as the formation of ionic clusters in high salt concentrations that lead to apparent negative transference numbers.33
Conclusions
A technique to measure t+ in ion-selective membranes has been shown to be a reliable and easy-to-implement methodology that does not require any analysis of electrode processes for interpretation. Simulations allow for the identification of experimental conditions (zero current data coupled with data at large dimensionless current) that allow for determination of t+ even with incomplete knowledge of transport properties for the ions. Measuring the cation or the anion flux have been demonstrated to yield accurate measurements of t+, although there are significant advantages in measuring the anion flux for t+ measurements with Nafion 117. More generally, there are advantages to measuring the flux of the ion with the same sign charge as that of the membrane's fixed ion.
List of Symbols
| A | Cross-sectional area of membrane, cm2 |
| cf | Fixed concentration on membrane, mol cm−3 |
| cj | Concentration of component j in membrane, mol cm−3 |
| cj, bulk | Concentration of component j in flowing electrolyte mol cm−3 |
| Dj | Diffusion coefficient of component j in membrane, cm2 s−1 |
| F | Faraday's constant, 96485 C mol−1 |
| i | Current density, A cm−2 |
 |
Dimensionless current density: iL/(FD2cf) |
| Nj | Molar flux of component j, mol cm−2 s−1 |
 |
Dimensionless flux of component j: NjL/(D2cf) |
| Q | Volumetric flow rate, cm3 s−1 |
| R | Gas constant, 8.314 kg m2 s−2 K−1 mol−1 |
| Sj | Solubility factor of component j in membrane |
| T | Temperature, K |
| t+ | Cationic transference number |
| uj | Mobility of component j in membrane, cm2 s−1 volt−1 |
| v | Velocity, cm s−1 |
| x | Position, cm |
| zf | Fixed charge on membrane |
| zj | Charge of component j |
Greek
| Δt+ | Uncertainty in transference number |
| σ | Standard deviation |
| Φ | Potential, volt |
Subscripts
| 1 | Ion present on both sides of membrane |
| 2 | Measured ion of target salt |
| 3 | Tracer ion |
Acknowledgments
This material is based upon work supported by the National Science Foundation Graduate Research Fellowship under grant No. (DGE 16–44869). Any opinion, findings, and conclusions or recommendations expressed in this material are those of the authors and do not necessarily reflect the views of the National Science Foundation.