Abstract
Increasing the areal capacity or electrode thickness in lithium ion batteries is one possible means to increase pack level energy density while simultaneously lowering cost. The physics that limit use of high areal capacity as a function of battery power to energy ratio are poorly understood and thus most currently produced automotive lithium ion cells utilize modest loadings to ensure long life over the vehicle battery operation. Here we show electrolyte transport limits the utilization of the positive electrode at critical C-rates during discharge; whereas, a combination of electrolyte transport and polarization lead to lithium plating in the graphite electrode during charge. Experimental measurements are compared with theoretical predictions based on concentrated solution and porous electrode theories. An analytical expression is derived to provide design criteria for long lived operation based on the physical properties of the electrode and electrolyte. Finally, a guideline is proposed that graphite cells should avoid charge current densities near or above 4 mA/cm2 unless additional precautions have been made to avoid deleterious side reaction.
Export citation and abstract BibTeX RIS

This is an open access article distributed under the terms of the Creative Commons Attribution Non-Commercial No Derivatives 4.0 License (CC BY-NC-ND, http://creativecommons.org/licenses/by-nc-nd/4.0/), which permits non-commercial reuse, distribution, and reproduction in any medium, provided the original work is not changed in any way and is properly cited. For permission for commercial reuse, please email: oa@electrochem.org.
Lithium-ion (Li-ion) batteries are currently being used as the primary energy storage device in hybrid, plug-in, and all electric vehicles. This commercialization has been possible only by leveraging decades of previous scientific and engineering advances on materials, electrodes, and cell development. However, interactions in this complex system are still not fully understood. Automotive grade battery cells are required to fulfill a variety of optimization criteria in order to meet customer expectations and enable highly functional, robust and competitive products. In Fig. 1, key cell level criteria are shown for available technology as well as future development goals. Many of these values are highly influential on each other. In order to optimize one of the criteria it is always necessary to critically evaluate the impact on others. Key goals are to increase vehicle range and decrease cost at the same time. Minimizing the fraction of non-active material is an intuitive path to achieve these goals; however, the cell power and rate capability must simultaneously be maintained.1–3
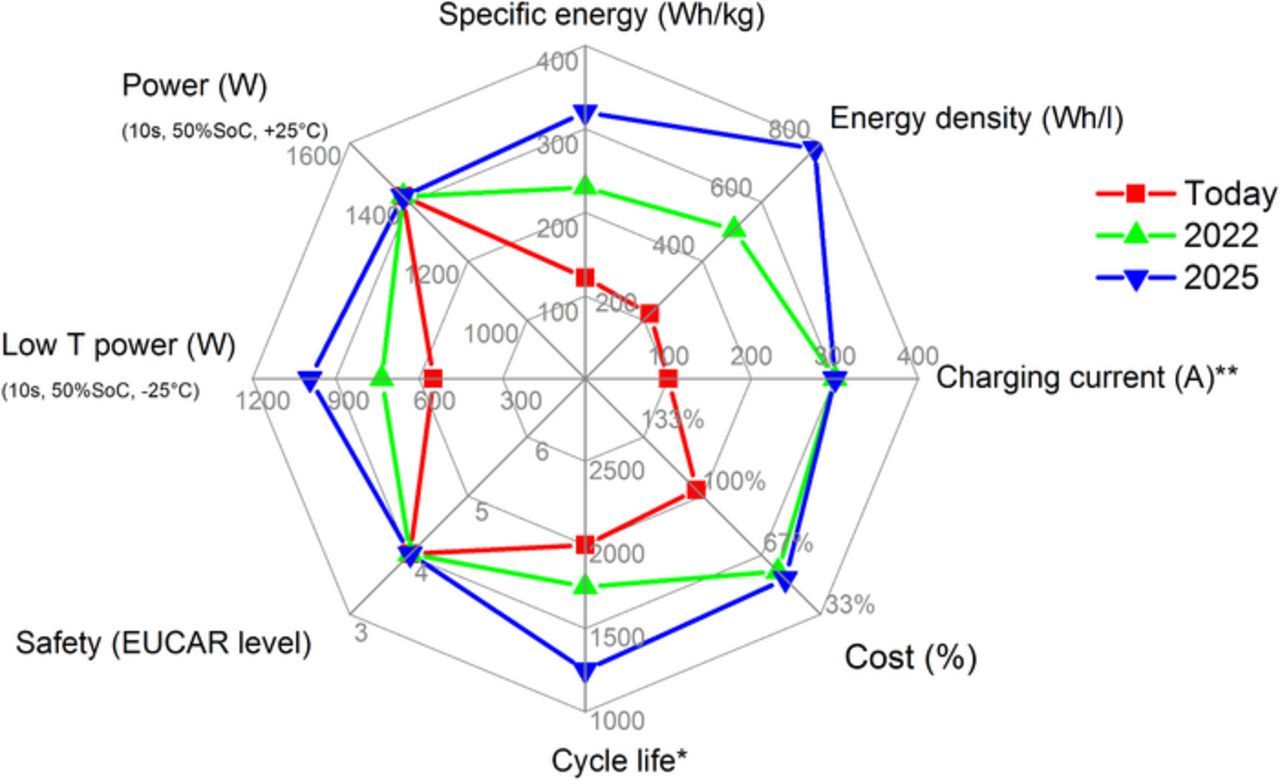
Figure 1. Key electric-vehicle cell-level criteria are shown for available technology as well as future development goals. *Future batteries are anticipated to have larger total energy content, which then reduces the total required number of cycles. **Maximum charge currents limited by infrastructure capabilities.
To derive clear development goals, the high level targets can be broken down to specific component requirements on the different levels of a storage system.1,4 In Fig. 2, an analysis is shown for a state of the art prismatic hard-case automotive cell format. A battery level specific energy of ∼225 Wh/kg is widely accepted to be a critical value for sustainable implementation of long range electric vehicles. It represents a useful ratio between vehicle weight and range. In order to achieve this high specific energy, all subcomponents of the storage system have to meet demanding requirements as well. On the cell level, large format cells are favorable as they reduce the amount of cell housing needed per cell volume. Prismatic cell formats have a positive influence on the packing density in the battery system as they maximize volume utilization. Besides energy dense active materials, electrode design influences the overall performance of a battery system in a substantial way. The main descriptors for a composite electrode are coating thickness L, porosity ɛ, as well as total mass loading, m. Furthermore the mass fraction of active material, binder and conductive agent content (ωAM, ωB and ωC) in the composite electrode play a role. Via the individual components densities, ρ, these values are connected in the following formula
![Equation ([1])](https://content.cld.iop.org/journals/1945-7111/163/2/A138/revision1/d0001.gif)
A whole parameter space exists which can result in a certain mass loading. On the electrode level, the mass loading is a good descriptor to evaluate the gravimetric energy density. A higher mass loading is preferable in an initial assessment as it better utilizes the areal components (i.e. carrier foils and separator). The associated porosity and thickness of the electrode have to be considered as they also affect the volumetric density of the electrode.
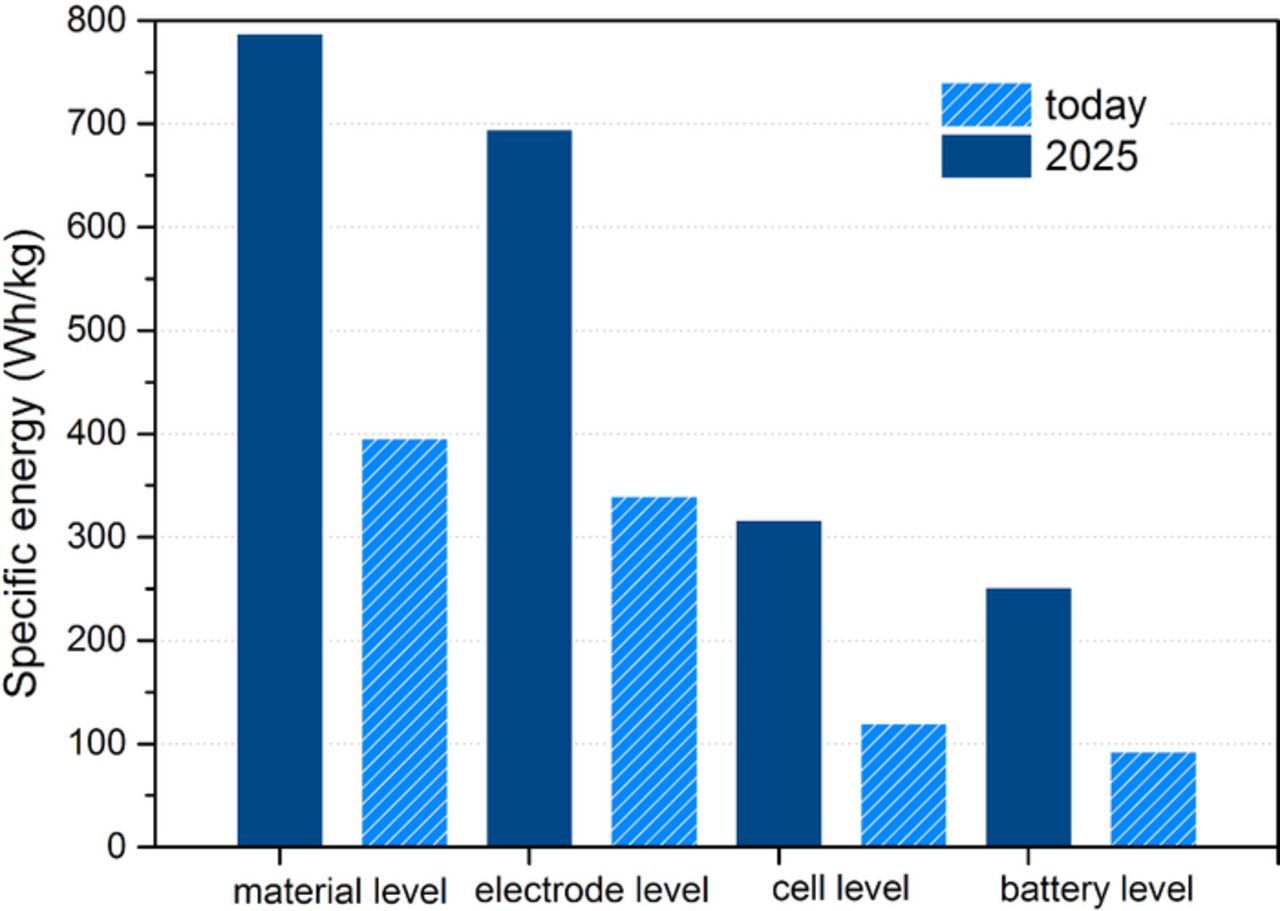
Figure 2. Specific energy of electric vehicle battery today considered at the system, cell, electrode and materials level. System level goals of 225 Wh/kg lead to the proposed breakdown for 2025. Electrode and material values refer to the cathode side.
The combination of these factors (mass loading, electrode area) can be used to calculate the energy densities which are achievable on cell level. In Fig. 3, a calculation is reported for a prismatic hard-case automotive cell format with LiNi0.6Mn0.2Co0.2O2 (NMC622) cathode versus synthetic graphite (Gr) anode.1,4 The cathode porosity and thickness were varied in this calculation. The negative electrode porosity was kept constant at 22% whereas the thickness was adjusted to obtain a constant negative to positive capacity ratio. It can be seen that densification of the electrode as well as increase in coating thickness significantly influences volumetric energy density. A similar trend can be derived for gravimetric energy density. Besides considerations that concern the amount of energy within a cell format it is equally important to assess the impact of electrode design on dynamic operations like charge and discharge. One important effect on cell level performance is a decrease of the electrode area inside a given volume with an increase in coating thickness. The overall active material amount increases with coating thickness as carrier foil and separator content decrease. Simultaneously the overall area of electrode has to decrease if packed into a fixed volume.
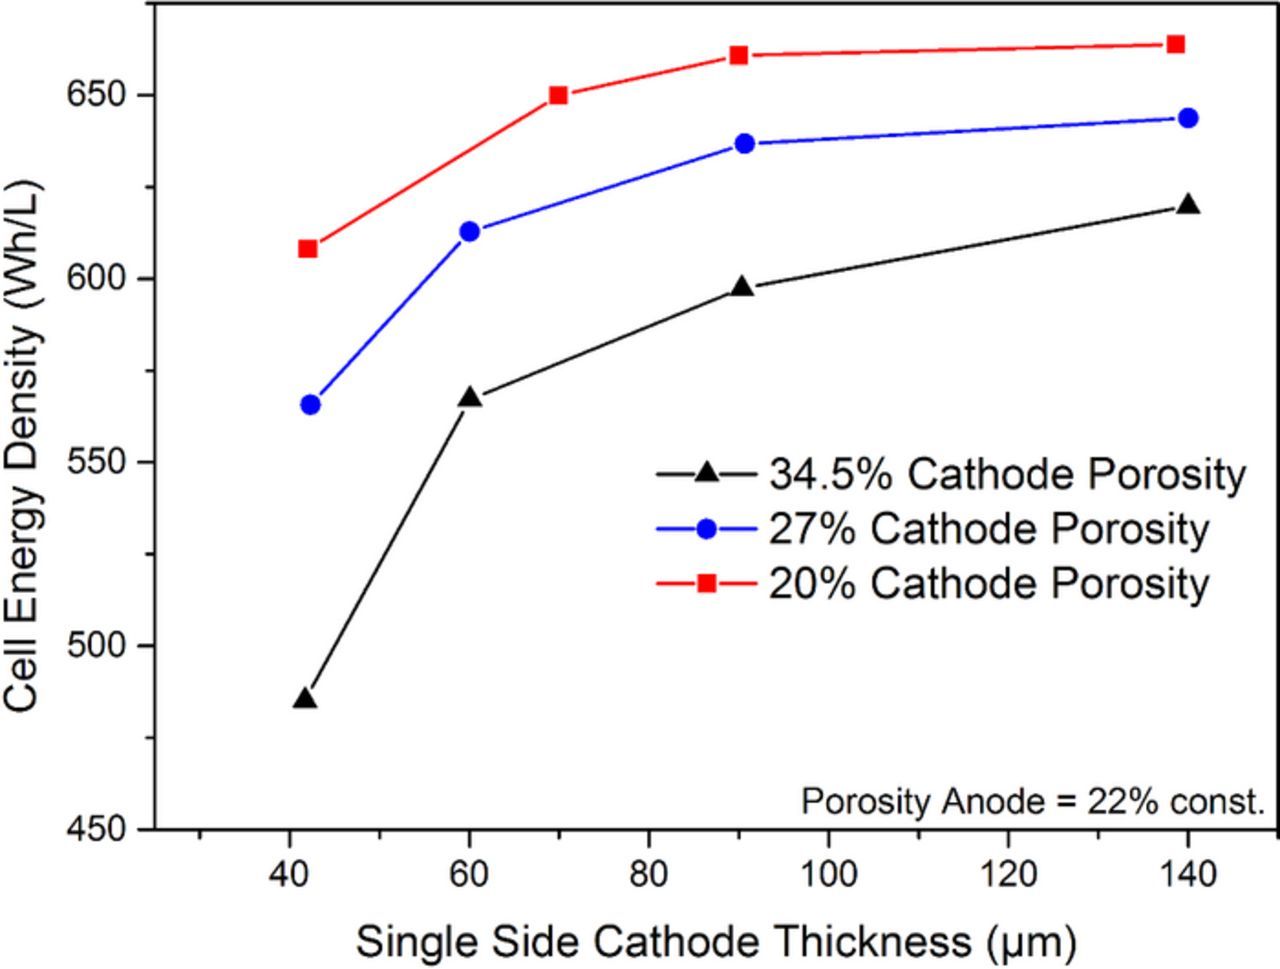
Figure 3. Calculated cell energy density for a representative cell chemistry of LiNi0.6Mn0.2Co0.2O2 versus synthetic graphite. The cathode porosity is varied while the anode is maintained at 22%. The thickness of the cathode and anode are varied.
One direct consequence of thick coatings is an increase in current densities when based on the projected electrode surface area. Depending on the application and layout of the storage system, the cells have to be capable of different load profiles which convert to different current densities depending on the individual cell design.1,4 This is an important aspect which has to be considered when designing and evaluating tests as shown in Fig. 4. The basis for the calculation is an electric vehicle drive train model utilizing an internal BMW drive cycle. The battery volume in the model is occupied with a constant number of cells. The properties of these cells (e.g. energy content, electrode area) are derived from an internal modeling tool and are a direct function of the electrode formulation and construction. The difference in energy and more importantly electrode area results in different imposed C-rates and current densities to meet the performance demanded by the drive cycle. In Figs. 4a/4c (low loading layout) and 4b/4d (high loading layout) histograms of geometrical current densities and related C-rates are shown for two different electrode layouts operated in the same application with the same load profile. The layout in 4b has roughly three times higher loading and coating thickness compared to 4a (at same porosity). The current densities experience an approximate threefold increase due to a reduced electrode area for the thick high loading layout in the constant cell volume. The C rate histograms, Figs. 4c/4d, shown below are significantly less influenced by electrode loading changes compared to the geometrical current densities. C-rates even decrease slightly from low to high loading due to an increase in overall cell capacity resulting from the higher energy density design.
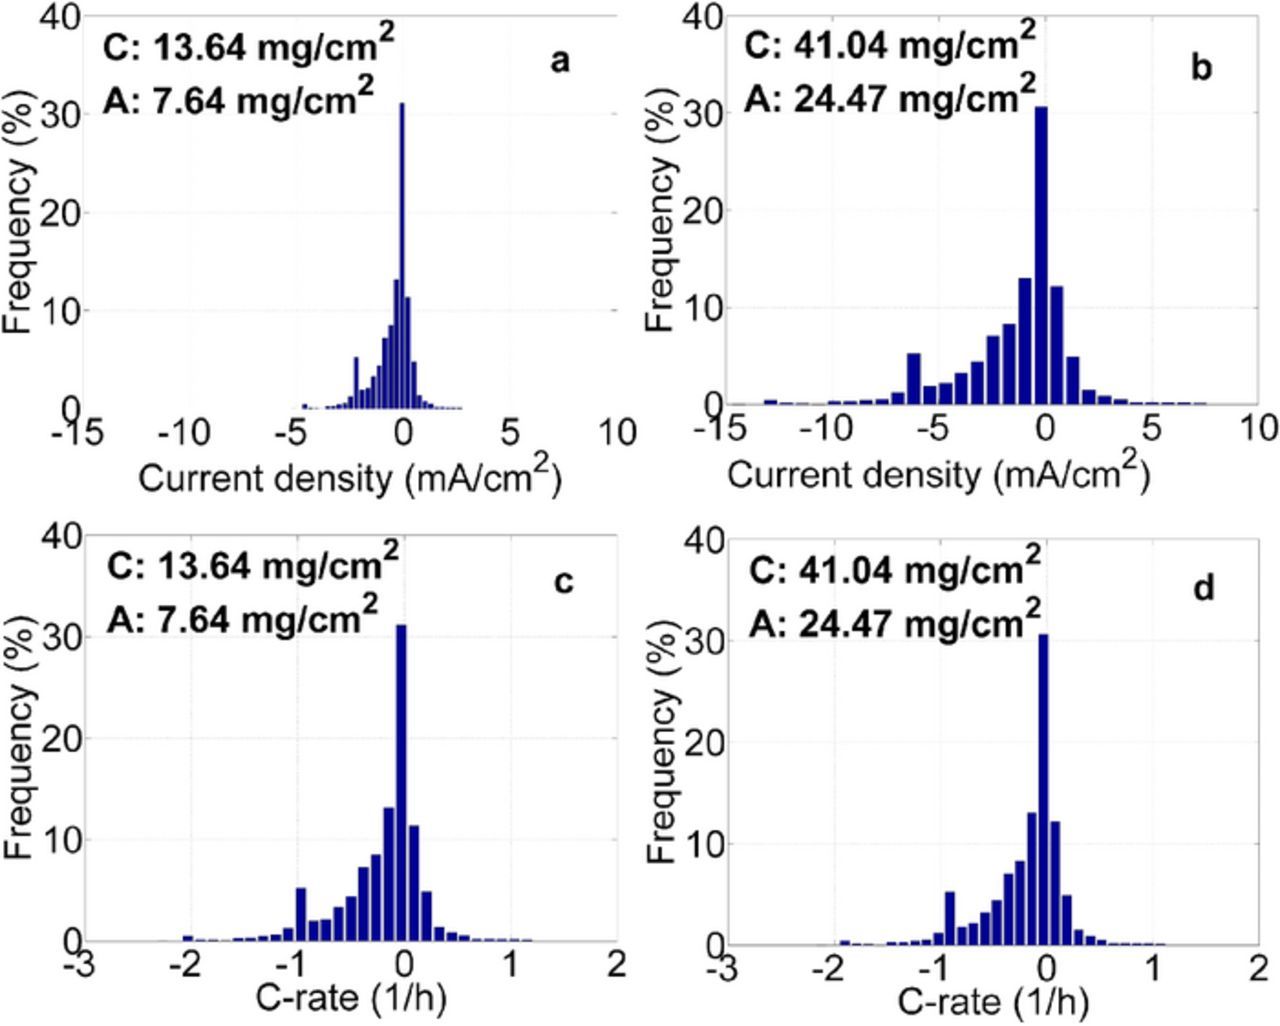
Figure 4. Histograms of geometrical current densities (a, b) and related C-rates (c, d) are shown for low (a, c) and high (b, d) electrode layouts operated in the same application with the same load profile. Loadings correspond to 2.2 and 6.6 mAh/cm2 for low and high respectively.
One important aspect which can never be neglected is the charging performance of a system. For this case, time based normalization of charging rate might be the most meaningful metric when the focus is put on time efficiency. In general it is widely accepted that fast charging capabilities are a crucial factor for the practical use of electric vehicles. The previously mentioned impact of electrode design on cell properties holds equally for the charging direction. Multiple criteria come into play here. First of all a maximum amount of energy is desired to be stored within the cell in the smallest time possible. Small cell-internal-resistances are important to avoid hitting voltage boundaries early, which would result in a dynamic limitation of the deployable capacity. The second important aspect of cell-internal-resistance is the amount of ohmic losses generated by the correlated voltage drop. The resulting heat has to be removed from the cell and thereby directly influences the layout of the cooling system as well as energy efficiency. A third aspect to be considered is the correlated degradation effects which can have different origin like thermally activated side reactions, gradient triggered particle cracking or potential driven lithium plating.
The effect of areal capacity on the performance of Li-ion cell has been examined to a lesser extent in the published literature compared to active materials development or cell degradation. The need to produce high quality electrodes likely limits the number of laboratories capable of completing such a study. Shim and Striebel examined the effect of electrode loading and density on natural graphite performance.5 Yu et al. examined the effect of electrode loading on the rate capability of a LiFePO4 half-cell as a function of electrolyte and electrode composition.6 More recently, researchers used a combined experimental and simulation approach to optimize LiFePO4 full cell electrode loadings and porosity for galvanostatic discharge.7 The role of electrode loading on cyclability, rate capability, and area-specific impedance has also been examined for LiNi0.8Co0.15Al0.05O2/graphite full cells.8,9 Zheng et al. reported the rate capability and cyclability for full cells based both on LiNi1/3Co1/3Mn1/3O2 and LiFePO4.10 Ogihara et al. investigate the relative importance of charge transfer impedance to ion transport using symmetric cells of varying electrode loadings.11 Singh et al. compared the cycling and rate performance of very high loading electrode to one similar to those used commercially.12
Several published works address the lithium plating side reaction and how the charging rate of a graphite based Li-ion cell may exacerbate the side reaction. Arora et al. presented an in-depth simulation study on the lithium plating side reaction and electrode properties that exacerbate the mechanism.13 Reference electrode cells may be used to measure when the potential of the negative electrode is favorable for plating to onset.14,15 Following the work of Arora et al., researchers have continue to use continuum models based on porous electrode theory to predict when conditions favorable to lithium plating may occur.16,17 Recently, Burns et al. presented a new method to capture coulombic inefficiency proposed to originate from lithium plating.18 The ultrahigh precision allows for the onset of plating to be measured after only one cycle rather than prolonged aging protocols or specialized cell configurations for reference electrodes.
Many of the previous published works referred to a critical electrode thickness, electrode loading, or C-rate that corresponds to a drop in performance or onset of lithium plating side reaction. However, a simple physics-based quantitative relationship has not yet been presented to link electrode thickness and rate of operation to performance losses. In this work, the relationship between electrode loading, current density, electrolyte transport, and measured performance is explored via numerical simulations and electrochemical characterization. The rate capability of the Gr/NMC622 electrode pairs is measured and then used to study aging behavior during constant current cycling. An analytical expression is proposed to capture the critical electrode properties that lead to a drop in performance related to mass transport limitations in the electrolyte. Future work is proposed and design methodology for optimizing electrode loading is discussed.
Experimental
Materials
The electrodes that composed the cell were fabricated by a commercial entity for the authors of the study. The positive electrode material is LiNi0.6Mn0.2Co0.2O2 (NMC622) and the negative electrode is primarily synthetic graphite. The positive electrodes consisted of 91.5% NMC622, 4.1% polyvinylidene difluoride (PVdF) binder, and 4.4% conductive carbon additive by weight on 15 μm aluminum foil. The negative electrode was 95.7% graphite, 3.3% styrene-butadiene-rubber/carboxymethyl-cellulose (SBR/CMC) binder, 1% conductive carbon additive by weight coated on 10 μm copper foil. An electrode porosity of 35 vol% was targeted in the calendering process that followed the coating and drying of the electrodes. The electrolyte used was 1.0 M LiPF6 in a 3:7 by weight ethylene carbonate, ethylmethyl carbonate mixture with an additional 2 wt% vinylene carbonate (BASF). The manufacturer electrolyte specification sheet reports 8 ppm water content. The electrode pairs in full cell format are identified by the anticipated areal capacity measured in half cells for the positive electrode. The specific capacity of the NMC622 material was measured at 10 mA/g to be 195 mAh/g for 1st charge to 4.3 V vs Li and 175 mAh/g for reversible capacity between 4.3 to 3 V vs Li. The specific capacity of the synthetic graphite material was measured at 35 mA/g to be 350 mAh/g for 1st charge (lithiation) to 0 V vs Li and 335 mAh/g for reversible capacity between 0 to 1.5 V vs Li. Table I details the physical properties of the electrode pairs and the calculated negative-to-positive capacity ratios for first charge and reversible cycling.
Table I. Physical properties of electrode pairs used in 14.1 cm2 active area single layer pouch cells. Thickness and porosity are based on the calendered electrodes in the dry state excluding the current collector foils.
| Positive electrode | Negative electrode | Negative to Positive Ratio | ||||||
|---|---|---|---|---|---|---|---|---|
| Reversible capacity | Active loading | Electrode thickness | Electrode porosity | Active loading | Electrode thickness | Electrode porosity | 1st charge C/10 capacity | Reversible C/10 capacity |
| mAh/cm2 | mg/cm2 | μm | cm3/cm3 | mg/cm2 | μm | cm3/cm3 | mAh/mAh | mAh/mAh |
| 2.2 | 12.5 | 48 | 0.32 | 7.3 | 58 | 0.39 | 1.05 | 1.12 |
| 3.3 | 19.0 | 77 | 0.36 | 12.5 | 97 | 0.37 | 1.19 | 1.26 |
| 4.4 | 25.1 | 101 | 0.35 | 15.9 | 127 | 0.39 | 1.14 | 1.21 |
| 5.5 | 31.2 | 129 | 0.37 | 19.1 | 154 | 0.40 | 1.10 | 1.17 |
| 6.6 | 37.6 | 154 | 0.36 | 23.4 | 182 | 0.38 | 1.12 | 1.19 |
Five negative-positive electrode pairs of targeted capacity loadings were fabricated with the same slurry composition as noted above and were coated to have a negative-positive capacity ratio between 1.05 and 1.20 for both 1st charge and reversible discharge capacity at C/10. Each of the electrodes fabricated were characterized in half-cells that consisted of 2032 coin cells with the positive or negative electrode of interest, 2325 Celgard separator soaked in LiPF6 based electrolyte, and lithium metal negative electrode. Four single layer pouch cells of 14.1 cm2 active cathode area were constructed from each of the NMC622/Gr electrode pairs. Prior to cell assembly, the electrodes were vacuum baked overnight at 120°C. The Cell Analysis, Modeling, and Prototyping (CAMP) Facility at Argonne National Laboratory was used to assemble the single sided laminates into pouch cells in a dry room operating below –40°C dew point. More details on assembly have been reported elsewhere.19 An electrolyte volume to pore volume ratio of approximately 5 was used for each pouch cell. The pore volume used in this ratio is the sum of the calculated pore volumes of the negative and positive electrodes after calendering, and the pore volume of the whole separator piece used in the cell (not just the section between the electrodes). In most prototype cell systems, a ratio between 2.5 and 3 is adequate, but in this study the ratio was doubled to ensure consistent electrolyte availability throughout the life of the cell. Previous experimental results suggest that ∼0.1 mL is required for wetting of the cell hardware. This additional volume was added to the calculated amount of electrolyte for the 2.2 mAh/cm2 cell. Thus, the electrolyte to pore volume ratios for the lowest to highest loading electrode pairs were: 6.2, 5.0, 5.0, 5.0, and 4.8 which corresponded to 0.50, 0.59, 0.75, 0.93, and 1.0 mL of electrolyte in each cell.
Electrochemical characterization
After filling, the cells were subjected to a tap charge and allowed to rest for 24 hours. Thereafter, the cells were formed by two consecutive, symmetric cycles at the C/20 rate between 3 and 4.2 V. Thereafter, a rate capability test commenced to examine the capacity utilized as a function of discharge rate. The rate capability test involved 3 consecutive cycles at a rate before increasing to a higher C-rate value: C/10, C/5, C/2, 1C, and 2C discharge rate between 3 and 4.2 V. The charge rates were symmetric to discharge for C/10 and C/5 and then set to the C/3 rate for the C/2, 1C, and 2C discharges. A voltage hold trickle charged the cell at 4.2 V until the measured current was less than that corresponding to C/20. A 96-channel MACCOR Series 4000 Test Unit was used for all of the electrochemical characterization and life cycle tests in this work. All coin cells and pouch cells were tested in forced ventilation ovens operating at 30 ± 1°C. The pouch cells were mounted in a test fixture with adjustable spring pressure to have a loading near 15 kPa on each cell.
The C-rate for the initial rate capability test was based on the available areal capacity measured in half cells of the positive electrodes. Thereafter, the rate capability results were interpolated to specify an appropriate current density for a desired time of discharge or charge. The measured full-cell pouch-cell capacities deviated from the available areal capacity as shown in Table II. The root cause of the deviations from half-cell capacity values are unknown, but believed to result from consumption of lithium with electrolyte and additive in the formation cycle, delamination of the graphite electrode, mismatch of the positioning of the layers, and/or poor wetting throughout the area of the electrode. The percentage of cathode available capacity utilized in the full-cell pouch-cell ranged from 92–97% for the mean cell group values. No monotonic trend with loading was observed, Table II.
Table II. Measured electrochemical discharge properties of 14.1 cm2 active area single layer pouch cells. Capacity measured with C/10 discharge between 4.2 and 3.0 V after a C/10 charge. Cells were aged at the C/3 rate for charge and discharge up to the 285th cycle, at the C/1 charge rate (*) and C/3 discharge rate between the 286th and 548th, and then at the 1.5C charge rate (#) and C/3 discharge rate thereafter.
| Anticipated capacity | 5th cycle QA ± 2σ | Percent of available | 18th cycle QA ± 2σ | 283rd cycle QA ± 2σ | 335th cycle* QA ± 2σ | 548th cycle* QA ± 2σ | 601st cycle# QA ± 2σ |
|---|---|---|---|---|---|---|---|
| mAh/cm2 | mAh/cm2 | % | mAh/cm2 | mAh/cm2 | mAh/cm2 | mAh/cm2 | mAh/cm2 |
| 2.2 | 2.02 ± 0.08 | 93 | 2.06 ± 0.03 | 1.99 ± 0.06 | 1.97 ± 0.09 | 1.92 ± 0.06 | 1.80 ± 0.17 |
| 3.3 | 3.06 ± 0.07 | 93 | 3.05 ± 0.03 | 3.01 ± 0.07 | 2.85 ± 0.24 | 2.69 ± 0.11 | 2.00 ± 0.35 |
| 4.4 | 4.27 ± 0.14 | 97 | 4.22 ± 0.12 | 4.10 ± 0.26 | 2.39 ± 0.29 | - | - |
| 5.5 | 5.20 ± 0.18 | 95 | 5.14 ± 0.18 | 5.08 ± 0.10 | 2.89 ± 0.82 | - | - |
| 6.6 | 6.07 ± 0.09 | 92 | 5.98 ± 0.07 | 5.83 ± 0.10 | 2.57 ± 0.74 | - | - |
The aging protocol for the single layer pouch cells involved a diagnostic series of tests followed by 50 cycles between 3 to 4.2 V at the C/3 discharge and C/3 charge with voltage hold at 4.2 V until the current decayed to less than C/20. The diagnostic series involves a discharge to 3 V until the current decays below C/20. Then the cell is charged to 4.2 V at the C/10 rate with a trickle charge until the current is less than C/20 followed by a C/10 discharge to 3.0 V. The cell is returned to 4.2 V at the C/3 rate utilizing the 4.2 V trickle charge with C/20 cutoff and then discharged at a 1C rate. Thereafter, the cell is charged to 4.2 V as before and allowed to rest for 1 hour before a series of pulse power measurements as a function of state-of-charge is commenced. The cell is discharged to decrease the SOC by 10% at the C/3 rate and allowed to rest for 1 hour before the next pair of current pulses was commenced. The pulse power experiments consisted of 2C discharge current pulses for 10 s followed by 40 s rest and a subsequent 10s 1.5C charge. This process was repeated at 10% SOC increments until the 3.0 V cutoff. The area-specific impedance (ASI) was calculated by dividing the polarization by the magnitude of the current pulse. The polarization is taken to be the difference between the voltage just prior to the current pulse and the final measured voltage before the current was interrupted. This series was then repeated until cycle 280, when the protocol was modified to accelerate degradation.
Theoretical Framework
Concentrated solution theory provides a rigorous description of transport within a binary electrolyte.20–22 Equation 2 presents the material balance on the anion in a binary electrolyte for transport within a porous media, neglecting convection and changes in solvent concentration, and assuming the salt is composed of a univalent cation and anion.
![Equation ([2])](https://content.cld.iop.org/journals/1945-7111/163/2/A138/revision1/d0002.gif)
Concentration gradients form within the electrodes of the cell as current is passed in a single direction (i.e. charge or discharge). The current distribution within the electrode may shift as a result of the salt depletion near the current collector electrode boundary. The concentration gradients approach a pseudo-steady-state after characteristic time, tss. The penetration depth for electrolyte transport in the electrode, Ld, may be derived through a scaling of Eq. 2. A penetration depth larger than the designed electrode thickness suggests that transport in the electrolyte will not limit the full utilization of the active material in the electrode. It is useful to render Eq. 2 dimensionless with pertinent variables to the experiments, such as average electrolyte salt concentration,  , and time to reach a pseudo-steady-state, tss. The variables c and t are scaled in Eqs. 3–5 to reach the dimensionless counterpart identified by an asterisk. The ionic current density i2 is scaled by the electrode current density I. The concentration dependent transport parameters D and to+ are scaled by their value at the average salt concentration.
![Equation ([3])](https://content.cld.iop.org/journals/1945-7111/163/2/A138/revision1/d0003.gif)
![Equation ([4])](https://content.cld.iop.org/journals/1945-7111/163/2/A138/revision1/d0004.gif)
![Equation ([5])](https://content.cld.iop.org/journals/1945-7111/163/2/A138/revision1/d0005.gif)
Inserting the dimensionless variables into Eq. 2 results in the form shown in Eq. 6.
![Equation ([6])](https://content.cld.iop.org/journals/1945-7111/163/2/A138/revision1/d0006.gif)
If we consider electrolyte transport to be predominately in the through plane direction of the electrode, it is convenient to scale the x-coordinate with the penetration depth. Inspection of Eq. 6 suggests Ld should be defined as in Eq. 7. Taking the pseudo-steady-state limit, ∂c/∂t ∼ 0, rendering the derivatives only in the x-coordinate and scaling with the penetration thickness results in the final dimensionless form Eq. 8.
![Equation ([7])](https://content.cld.iop.org/journals/1945-7111/163/2/A138/revision1/d0007.gif)
![Equation ([8])](https://content.cld.iop.org/journals/1945-7111/163/2/A138/revision1/d0008.gif)
The areal capacity of an electrode, QA, is a function of the electrode thickness, L, and volumetric capacity of the electrode, QV. The active material properties in Eq. 9 are the specific capacity QS, the crystal density ρ and the volume fraction ɛAM in the electrode.
![Equation ([9])](https://content.cld.iop.org/journals/1945-7111/163/2/A138/revision1/d0009.gif)
Electrolyte transport within the porous electrode will become limiting if the penetration depth is on the order of or less than the actual electrode thickness. For cases where solid state diffusion of lithium in the active material is not limiting, the electrode areal capacity can be described as a function of the penetration depth. The penetration depth is taken to be proportional to electrode thickness by a factor γ, Eq. 10. Substitution of Eq. 10 in Eq. 9 gives the accessible areal capacity as a function of the electrolyte transport parameters that control the penetration depth and the volumetric capacity of the electrode given in Eq. 11.
![Equation ([10])](https://content.cld.iop.org/journals/1945-7111/163/2/A138/revision1/d0010.gif)
![Equation ([11])](https://content.cld.iop.org/journals/1945-7111/163/2/A138/revision1/d0011.gif)
The accessible electrode areal capacity should decrease with increasing current density at constant active material specific capacity (i.e. solid state diffusion is not limiting). Equation 11 also suggests that increasing the salt diffusion coefficient, concentration, and cation transference number should increase accessible areal capacity. Decreasing tortuosity of the electrode porosity should also serve the same end objective. Interestingly, the volumetric capacity is proportional to ɛAM = (1-ɛ-ɛinact), thus increases in electrode porosity will not necessarily increase the accessible areal capacity. However, increasing the volumetric capacity of the electrode at constant active material volume fraction will increase the accessible areal capacity.
The electrode current density, I, may be defined by Eq. 12 assuming constant C-rate operation where td is the time required for a complete discharge. Substitution of Eq. 12 into Eq. 10 relates the accessible electrode thickness as a function of C-rate used for operation as shown in Eq. 13.
![Equation ([12])](https://content.cld.iop.org/journals/1945-7111/163/2/A138/revision1/d0012.gif)
![Equation ([13])](https://content.cld.iop.org/journals/1945-7111/163/2/A138/revision1/d0013.gif)
The accessible areal capacity as a function of discharge time, Eq. 14, is then given by substitution of Eq. 13 into Eq. 9. As expected, the longer the time of discharge (i.e. smaller C-rate), the higher areal capacity that is accessible by the electrolyte.
![Equation ([14])](https://content.cld.iop.org/journals/1945-7111/163/2/A138/revision1/d0014.gif)
The designed areal capacity of an electrode should not exceed the values calculated by Eq. 11 or 14 for the principal operation conditions of the battery. All values used in this derivation may be found in literature, except for the empirical parameter, γ, that relates the penetration depth to the electrode thickness. We have completed and report here electrochemical experiments to evaluate a proper choice for γ.
The previous works of Newman et al. have included discussions of dimensionless penetration lengths and ratios of characteristic times for transport processes.20–23 The Li-ion work of Doyle et al. and Fuller et al. both used a ratio of discharge time (i.e. C-rate) and characteristic time for electrolyte diffusion within the porosity of the cell sandwich.21,23 In that work, the characteristic time for diffusion was taken as the thickness of the cell sandwich squared divided by the electrolyte diffusivity. The previous workers obviously recognized the importance of salt concentration and the transference number, but those parameters were absent in their dimensionless treatment. Our derivation of a penetration depth directly incorporates the importance of these additional parameters and thus provides unambiguous guidance on how to improve the rate capability of an electrode.
An existing electrochemical model, described in detail in the literature,24,25 of a lithium-ion cell was utilized to examine the applicability of γ using a much wider set of parameters than could easily be accomplished experimentally. Further, the model simulations were used to examine the current, potential, and concentration gradients within the cell as they develop during a discharge. In the model, the general methodology for the transport in the electrolyte follows the development as described above. Concentrated solution theory is used to describe the salt transport through the electrolyte, and volume-averaged transport equations account for the porous separator and composite electrode structure. The electrolyte salt transport equation is combined with Ohm's law-like current expressions for the ionic and electronic currents and the cell's overall current balance. These equations are coupled to the active materials thermodynamic, reaction, and transport expressions for their respective electrodes.
Because of extensive data and model development, in the simulations the positive (i.e. cathode) electrode active material is taken to be LiNi0.8Co0.15Al0.05O2 (NCA) and the negative (i.e. anode) is synthetic graphite. Details on electrode formulation are presented elsewhere.24,25 Conveniently, the negative volumetric capacity is slightly greater than positive such that the electrode thickness for a balanced cell is the same. The negative to positive capacity ratio based on C/10 reversible capacity was 1.1. Within the electrochemical model, the NCA is treated as an intercalation electrode active material,24,25 while the graphite electrode uses a more complex phase-change model to account for the staged discharge.26 The electrolyte is the same as used in the present study, except no additive due to lack of parameters for that specific system.
Results and Discussion
The relationship between electrode loading, current density, electrolyte transport, and measured performance is explored via numerical simulations and electrochemical characterization. The rate capability of the NMC622/Gr electrode pairs is measured and then used to study aging behavior during constant current cycling. The understanding gleamed through experimental measurements and numerical simulation is used to selectively accelerate degradation for the higher electrode loading by increasing the charging current density to an appropriate value. Finally, a discussion is presented on selecting an optimum electrode loading for a desired charge and discharge rate.
Numerical simulations
In the simulations, the NCA/Gr cell is initially fully charged and relaxed at 4.1 volts. Constant current discharges are simulated to a cell voltage of 3.0 volts. Preliminary simulations were conducted by setting the electrode thickness and the discharge time (e.g. 1 hour for C/1) then adjusting the current till the simulated discharge time was within 1% of the set discharge time. A series of simulations were then conducted at increasing electrode thicknesses till the cell discharge capacity began to level off, as seen in Fig. 5 inset for the indicated discharge rates. In Fig. 5 inset, the discharge capacity for the thin electrodes (i.e., <100 μm) is proportional to the electrode thickness according to the positive electrode's volumetric capacity. As the ionic current penetration depth of the positive electrode is approached further increases in thickness do not result in proportionally more capacity. Finally, decreasing the discharge time (i.e. increasing C-rate) also shortens the penetration depth.
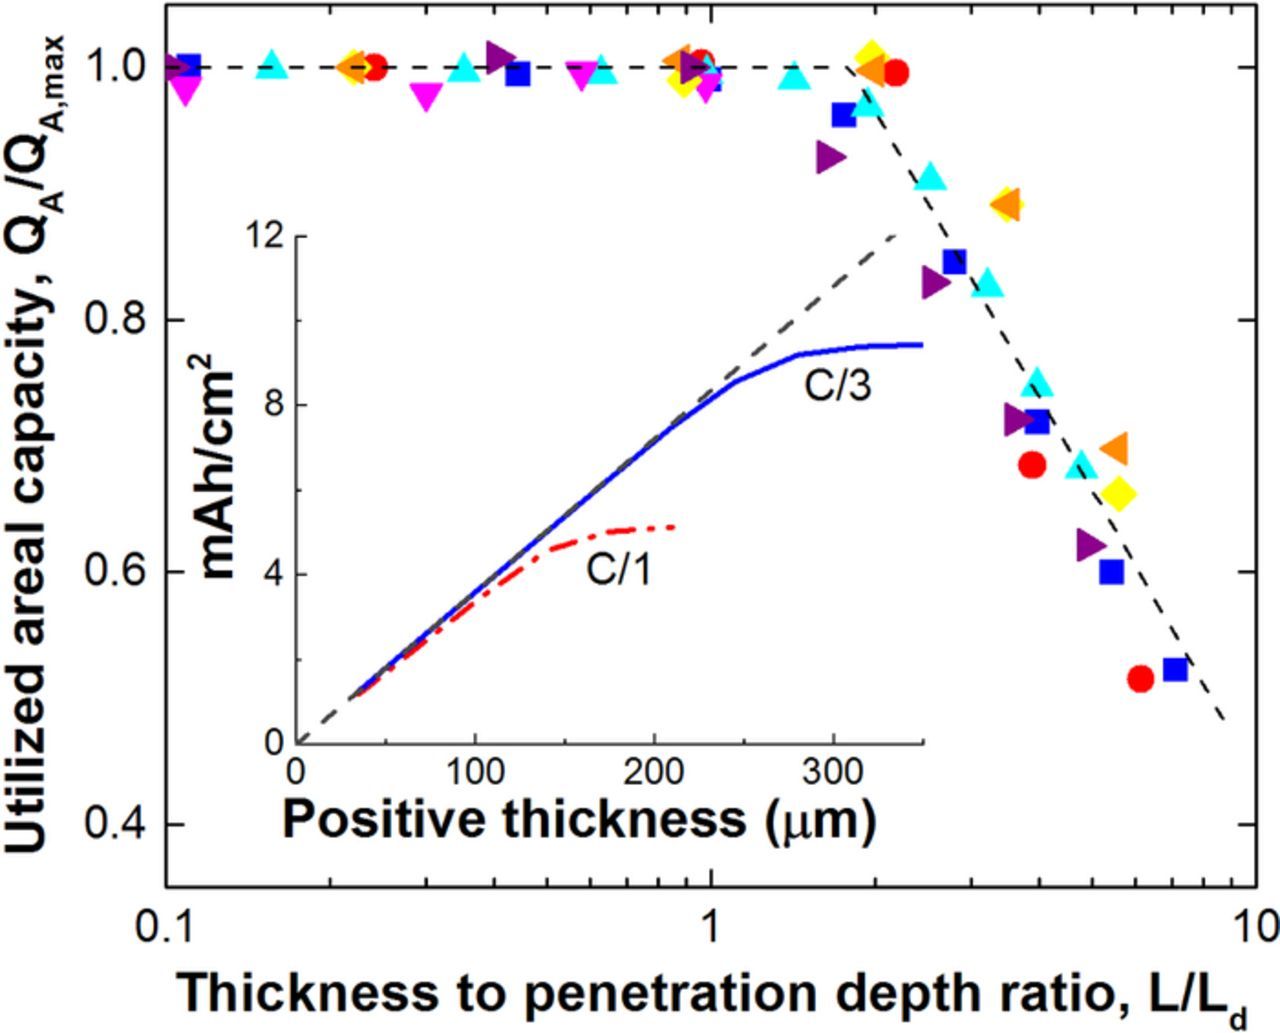
Figure 5. Simulated results of a NCA/Gr cell sandwich normalized capacity for varying electrode thicknesses, current densities, electrode properties, and electrolyte properties. Symbols represent normalized discharge capacity at a constant discharge time or C-rate for different electrode thicknesses that utilize a constant set of physical properties: C/3 (▲), C/10 (▼), 3C (●), 1C (■),1C and 2τ (◂), 1C and 0.5ɛ (▸), 1C and 0.5 (◊). Dashed line represents a least squares best fit of the simulated capacities at 3 V voltage cutoff. (Inset) Electrode areal capacity utilized as a function of positive electrode thickness for the C/1 and C/3 discharge rate. Solid line represents the maximum capacity available for discharge.
A number of different simulations were examined for the NCA/Gr cell chemistry, varying the discharge rate, salt concentration, positive electrode tortuosity and porosity. The results are given in Fig. 5 on a dimensionless semi-log plot of capacity vs. positive electrode thickness. Symbols represent normalized discharge capacity at a constant discharge time or C-rate for different electrode thicknesses that utilize a constant set of physical properties. Using the positive electrode penetration depth for normalization, all the cases fall along the same curve. The dashed line is the least-squares best-fit of the data. The accessible capacity begins to deviate strongly from the available capacity at an electrode thickness of 1.8 times the penetration depth in simulation. Thus, the simulation methodology suggests that the proportionality factor, γ (see Eq. 10), is 1.8 for these parameters values and physics included in the model.
The drop off in utilized areal capacity is a result of concentration gradients that form within the cell during discharge. The salt concentration in the electrolyte at the indicated discharge times is shown in Fig. 6 for a C/1 discharge of thick 245 μm electrodes. A large thickness is chosen to clearly show salt depletion. During discharge, lithium ions travel from the anode to the cathode, this causes a shift in salt concentration in the opposite direction. As the discharge proceeds, for this thick electrode the concentration on the current collector side of the cathode drops to zero. As can be seen in Fig. 7, there is a corresponding drop in the electrode current distribution. It is important to note here that the full cathode is accessible to the ionic current till the salt concentration drops to zero, which can take a significant fraction of the discharge time for a thick electrode (e.g. more than ⅓ of the discharge time in Fig. 5). The time for the electrolyte to reach a pseudo-steady-state increases roughly proportional to the square of the cell thickness and for thick electrode cells it can be quite long.
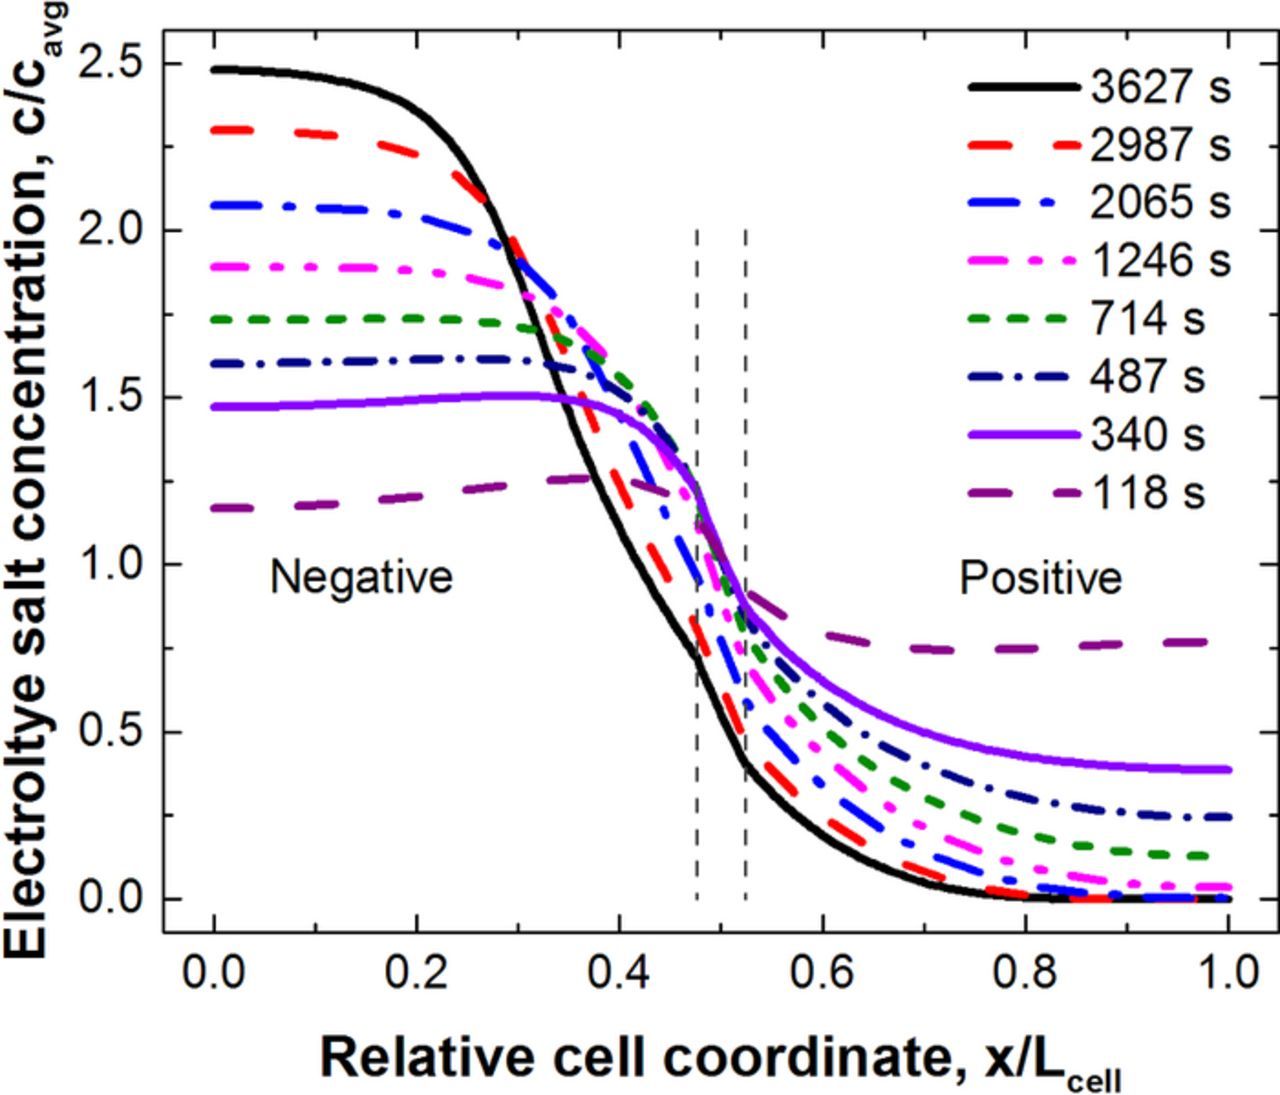
Figure 6. Simulated electrolyte salt concentration as a function of cell coordinate of a NCA/Gr cell sandwich discharged at the C/1 rate. Both positive and negative electrodes were 245 μm in thickness.
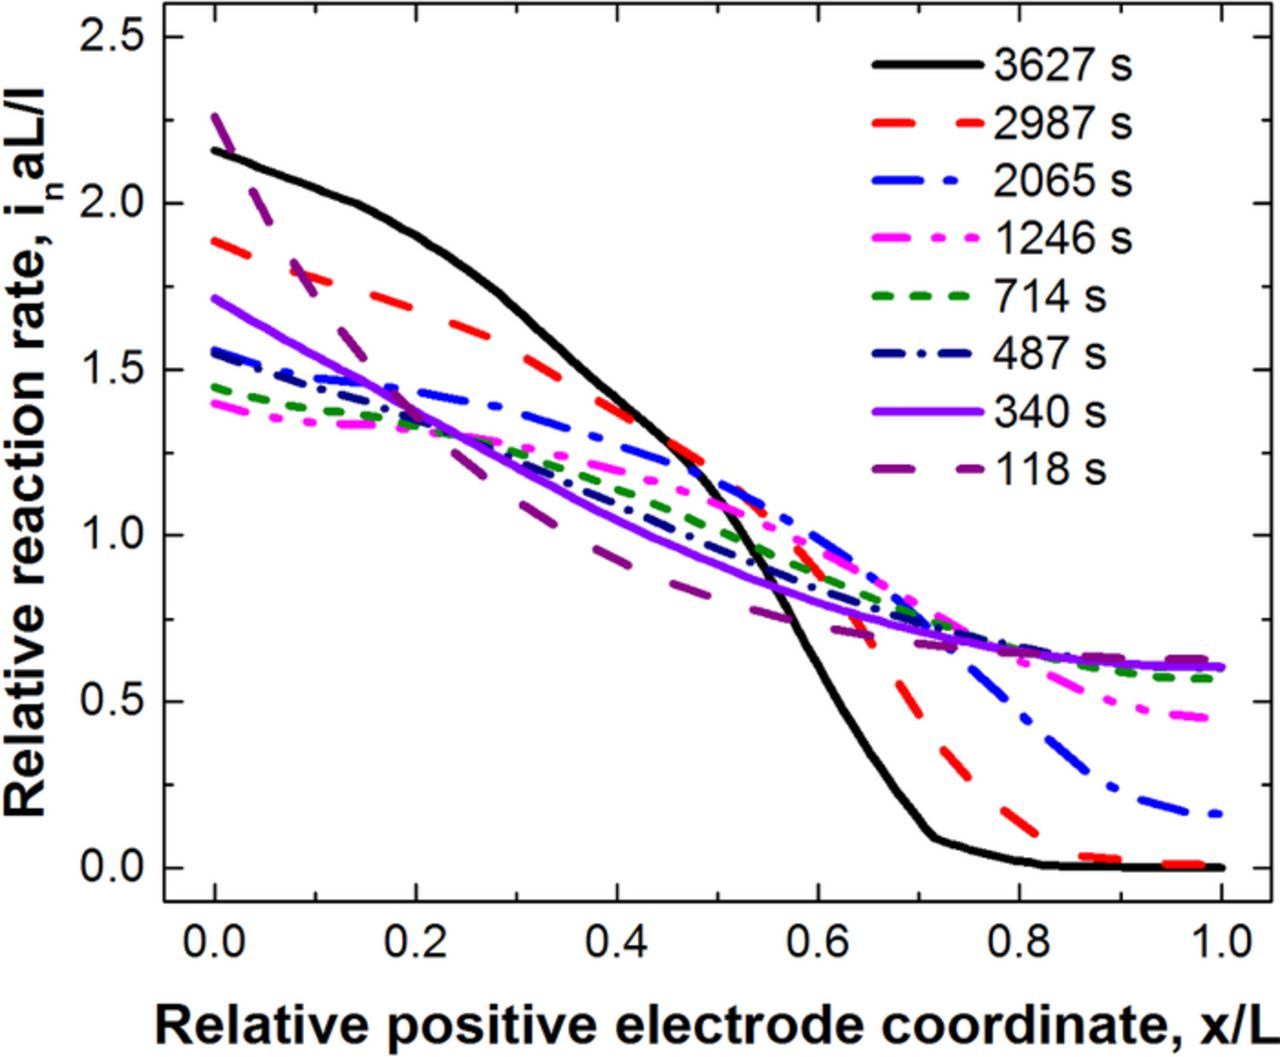
Figure 7. Simulated normalized reaction rate or current distribution as a function of positive electrode coordinate of a NCA/Gr cell sandwich discharged at the C/1 rate. Both positive and negative electrodes were 245 μm in thickness.
An alternate simulation method is utilized to parallel the experimental protocols used in this study. In Fig. 8, the electrode thickness is fixed and the discharge current is increased until the cell capacity starts to fall off similar to rate capability tests common throughout the battery literature. The C-rate used in Fig 8. is based on the slow C/10 capacity as the cell specific rate dependence is only known after the study is complete. Four different electrode thicknesses are examined (i.e. 70, 105, 140, and 175 μm). We remind the reader that this simulated NCA/Gr cell construction composed negative and positive electrodes of equivalent thicknesses for a balanced loading. The simulated results are compared to the correlation (i.e. Eq. 14) for four different values of γ (i.e. 0.6, 0.9, 1.2, and 1.5). Most of the simulations are best fit by the value of 0.9 that is half the value estimated from the above simulations in Fig. 5. One reason for the lower γ value in Fig. 8 is the different definition of the C-rate used here compared to Fig. 5. This difference is removed when plotted as a function of current density rather than C-rate. However, the correlation deviates from the simulation to some extent with the tendency of simulated thinner electrodes to have lower values of γ. We believe this difference to result from the interplay between the time for the electrolyte to reach a pseudo-steady-state and the total discharge time. In any case, testing the cells in this manner should yield a relatively conservative value of γ.
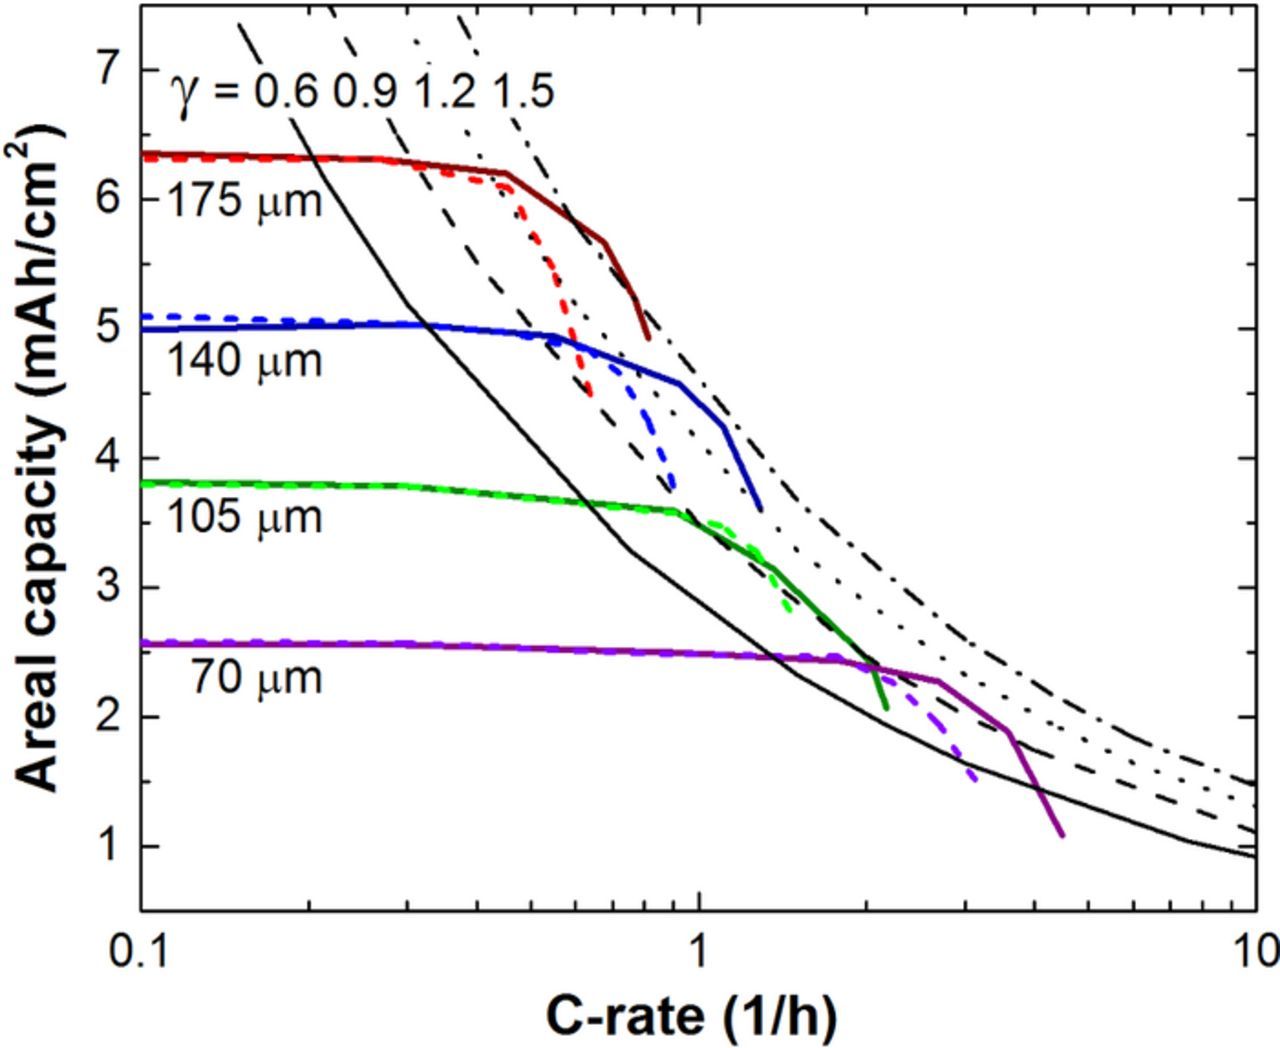
Figure 8. Simulated areal capacities during a rate capability test of a NCA/Gr cell sandwich. Lines of γ, the ratio of electrode thickness to the penetration depth, are shown for comparison. Lower rate capability lines (dashed color) at the same capacity use a tortuosity value twice that of the darker solid lines.
While all the parameters, except γ, in Eq. 14 are estimated from electrode construction or can be found in the literature, there is certainly some variability in their value. The electrolyte transport parameter determinations are often associated with significant uncertainty. The salt diffusion coefficient in the electrolyte and the cation transference number both are a function of salt concentration. Therefore, the use of any method that imposes concentration gradients to determine these values, which is commonly done, must take care to account for this dependency. For the electrode, the simulations use the Bruggeman equation with τ = ɛ−0.5 for the electrode tortuosity.25 More recent studies, specifically on lithium-ion electrodes, suggest a larger value (i.e. approximately a factor of 2 for the NCA electrode and larger for platelet-like graphite).29–31 As shown in Fig. 8 with the lighter colored lines, the higher tortuosity would yield lower break-over currents. Many additional differences exist between how parameters are measured or estimated and what they might actually be in a functioning electrode. For example, the transport properties of the electrolyte are commonly determined by measurement of bulk properties or that when confined within the porosity of a separator. However, porous electrodes utilize a polymeric binder which swells in the presence of electrolyte. Thus lithium transport values will change if the medium is an electrolyte swollen binder matrix. Additionally, positive electrode active material is a collection of secondary particles (∼10 um) that are composed of primary particles (∼0.1 um). The internal porosity within the particle is likely different from the bulk electrode porosity and certainly smaller in length scale. In addition, the coating and drying of the electrode may result in nonuniform porosity and tortuosity throughout the depth of the electrode. All of these parameters would suggest γ would likely be lower in an experiment than in a porous electrode theory simulation using a traditionally derived parameter set. The converse might be obtained if the cell format is large and the internal resistance results in cell heating that improves transport parameters compared to room-temperature values. The prediction of limiting current values is a challenging exercise for any electrochemical system.
Like all dimensionless analysis or analytical approximations, insight is gained through examining a simple expression at the expense of precise representation of the complex physics involved. Combing the analytical expressions with the average transport property values allows one to estimate the onset of limitations in an electrode without running a numerical simulation.
As the salt concentration in the electrolyte goes to zero so does the conductivity and some combination of migration and diffusion hindrance shuts down the reaction at the back of the electrode. The electrode concentration penetration length is essentially an estimate of what fraction of the electrode has a significantly non-zero salt concentration in the electrolyte. The direct impact of migration is taken into account by the lithium ion transference number. For these porous electrodes, there is also a migration penetration length that takes into account the electrolyte conductivity and can also come into play if it is significantly shorter than the concentration penetration length, but it would not limit the fraction of the electrode accessible to current. It would only affect the uniformity of the reaction current in the electrode.
Electrochemical characterization
The pouch cell rate capability at beginning of life illustrates where limiting physics may onset for an electrode pair. The voltage profile for an exemplar cell with 3.3 mAh/cm2 available areal capacity is shown in Fig. 9. This cell, which utilizes ∼76 μm thick positive electrodes, appears to be limited to currents at the 1C rate or lower to maintain >85% of rated capacity. The voltage profiles for discharge rates of C/5 to C/20 are difficult to visually distinguish from one another. Cell polarization on discharge is minimal until the C/2 rate.
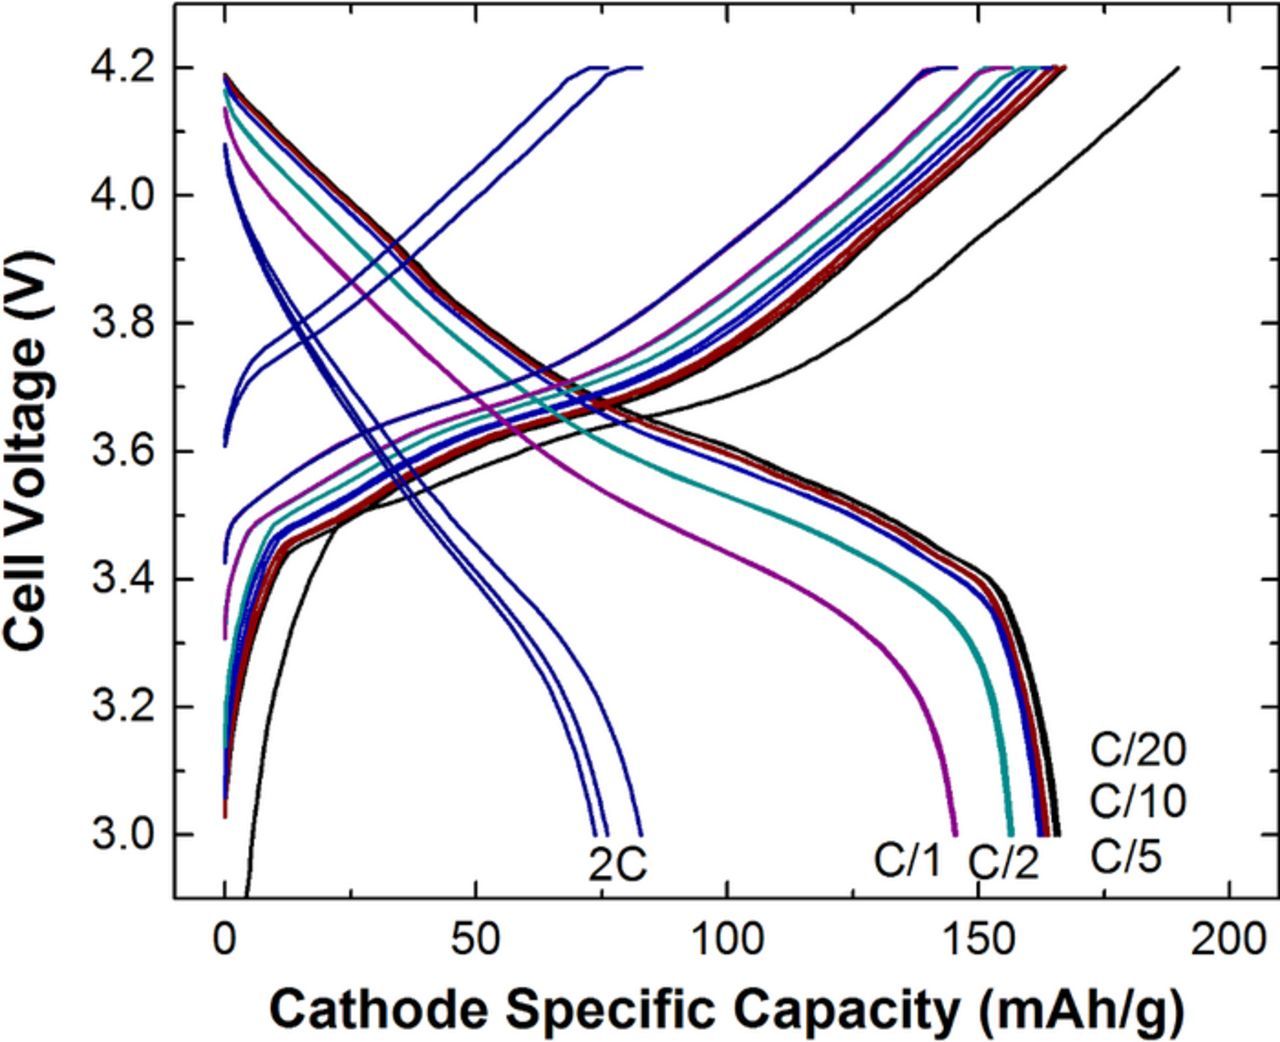
Figure 9. Initial voltage profiles for a 45 mAh NMC622/Gr pouch cell at C/20, C/10, C/5, C/2, 1C, and 2C discharge rate between 3 and 4.2 V utilizing electrodes with 3.3 mAh/cm2 available areal capacities. The charge rates were symmetric to discharge until a maximum of C/3 rate. A voltage hold trickle charged the cell at 4.2 V until the measured current was less than that corresponding to C/20.
A comparison of the rate capability of the entire pouch cell set is shown in Fig. 10. The average of the four cells is plotted for each cell group as a function of C-rate (Fig. 10a) or current density (Fig. 10b). The capacity for each cell group is maintained until a limiting C-rate or current density is reached. The critical C-rate is defined here as the value where the measured capacity is less than 80% of reversible capacity at the C/10 rate. The definition of a percent of rated capacity is not founded on a theoretical basis; rather, 80% of rated capacity was taken as indication of the onset of the transport limitation. In Fig. 10a, the differing electrode loadings display different critical C-rates, with the highest loadings having the lowest critical C-rate. This observation suggests that transport within the intercalation materials is not the primary limitation of cell performance. A solid state diffusion transport limitation inside the particles should be independent of electrode thickness when compared at constant C-rate, where a single particle would see the same current density in each case. When compared as a function of current density, Fig. 10b, the capacity for each cell appears to reach limiting behaviors near a similar current density. This observation suggests that transport within the electrolyte is the limiting factor. As shown above in numerical simulations, concentration gradients form within the electrodes that lead to non-uniform current distributions and underutilization of the electrode. As the current density shifts toward the separator/electrode boundary, the flux into the particles in this region increases to carry the total applied current. As the lithium concentration builds up in particles near the separator/electrode boundary, the electrode potential is driven to more extreme values until it reaches the cell voltage cutoff threshold. Thus transport limitations in the electrolyte result in the underutilization of the capacity of the porous electrode.
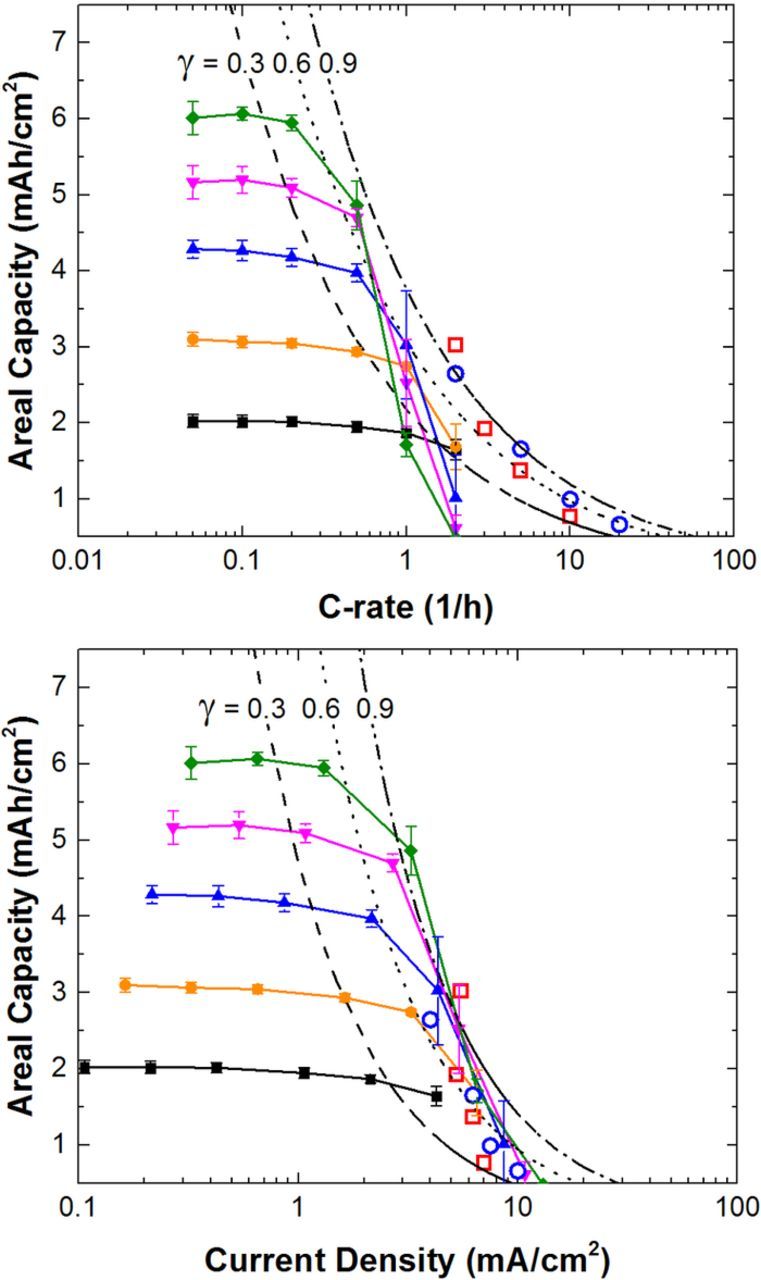
Figure 10. Rate capability study on NMC622/Gr pouch cells of increasing areal capacities shown as a function of C-rate (a) and current density (b). Dashed lines represent differing values of γ = 0.3, 0.6, and 0.9. Open symbols of blue (LFP/Gr) and red (NMC333/Gr) transformed from Zheng et al.10
This study has focused on utilizing high electrode loadings (i.e. thick electrodes). Zheng et al. have reported a rate capability study for graphite negative electrodes coupled with LiNi1/3Co1/3Mn1/3O2 (NMC33) or LiFePO4 (LFP) electrodes of various areal capacities.10 Their study focused largely on thinner electrodes and higher rates.10 We have transformed their results to be on a constant volumetric capacity basis (i.e. QA scaled with  ) and plotted them on Fig. 10 for comparison. The values chosen from Zheng et al. are the capacities corresponding to the maximum areal capacity for a specific C-rate. In other words, the values are from a fitted line between points approximating a critical C-rate. We have also plotted lines of constant γ using Eq. 14. For the 1 M LiPF6 electrolyte used in the experiments, the equations in
The pouch cells were subjected to cycle life testing at the C/3 rate with intermediate diagnostics after the initial rate capability measurement, Fig. 11. The cycling was interrupted on two occasions for lab maintenance. Anomalous capacities from these events were filtered out. All pouch cell groups exhibited modest decreases in capacity with cycling and increasing impedance. However, no electrode-pair cell-group cycling performance showed a dramatic loss in capacity. Very little capacity loss in each cell group is observed when the mean capacity measured at the C/10 rate from cycle 283 is compared to the mean capacity in cycle 5, Table II. All electrode cell groups retain mean capacity values higher than 96% of the cycle 5 C/10 capacity. The thickest electrode of 6.6 mAh/cm2 is the only cell group whose 95% confidence intervals do not overlap between the 5th and 283rd cycle. Repeating the experiment with a larger cell population or more precise testing conditions would be necessary to make a more definitive statement about relative differences in rates of capacity fade.
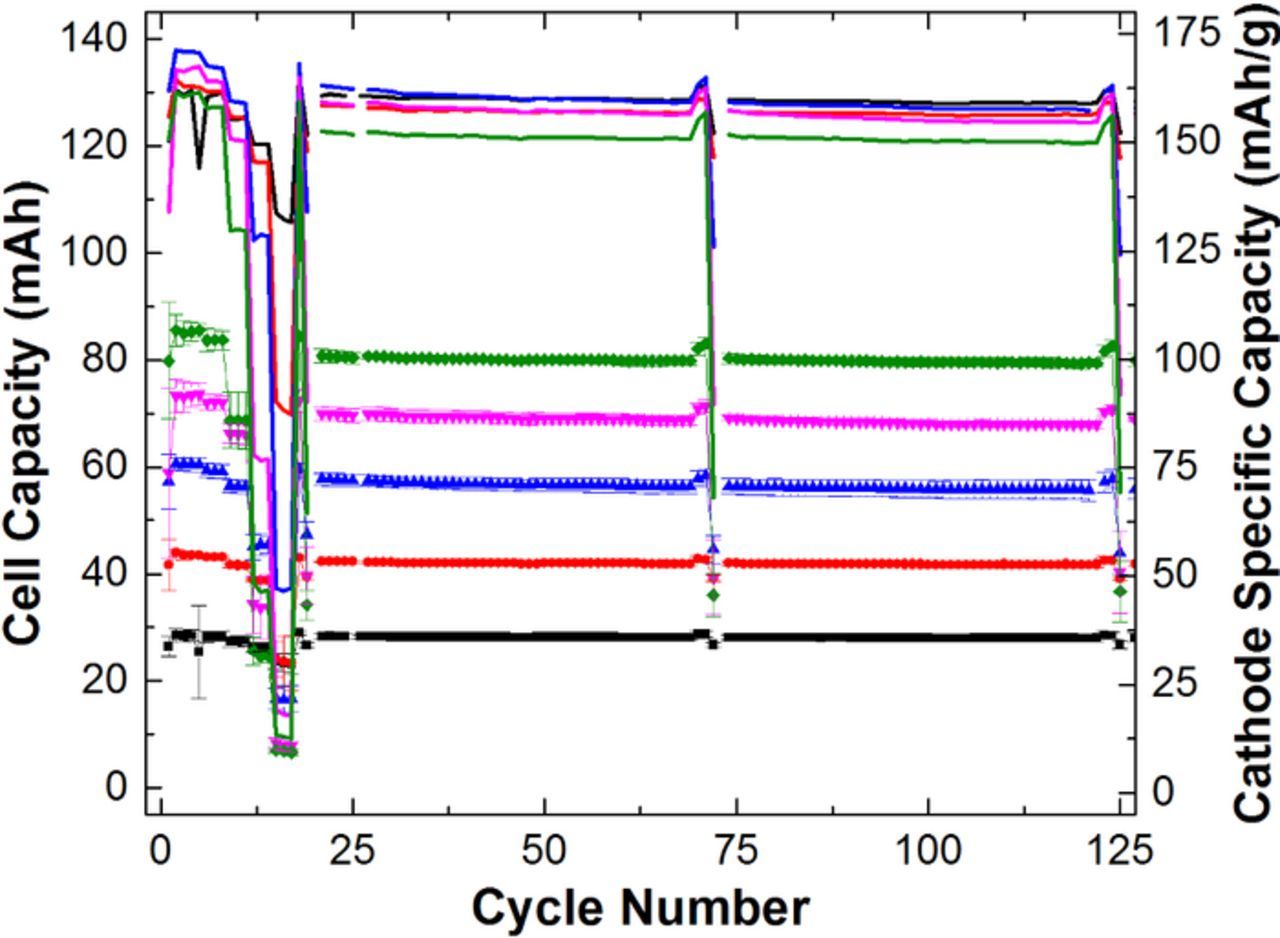
Figure 11. Cell capacity (symbols) and cathode specific capacity (lines) vs cycle number for a series of NMC622/Gr pouch cells of increasing areal capacity. Starting from cycle 20, the cells were charged to 4.2 V at the C/3 rate and held until the current was less than C/20 followed by a C/3 discharge to 3.0 V. The C/10 capacity, C/1 capacity and pulse power capability were measured every 50 cycles. Data shown is the average of each cell group with error bars based on ±2σ shown for the cell capacity.
In the literature, differing reports of capacity retention as a function of electrode loading have been reported. Lu et al. showed only a minor effect of electrode loading on capacity retention at the C/2 rate; whereas, Zheng et al. presented dramatic capacity losses for higher electrode loadings at the C/1 rate.8,10 Both of these studies utilized electrodes less than 110 μm in thickness. In Fig. 11, cell groups using positive electrodes ranging from 48 to 154 μm exhibit low levels of capacity fade at the C/3 rate. We suggest the difference between reported cycling performances is related to concentration gradients in the electrolyte as well as the lithium plating side reaction in the graphite electrode. Lithium plating may occur in the graphite electrode when the surface overpotential is < 0 V vs Li/Li+. Detecting lithium plating in situ is difficult, but various methods, often electrochemical, have been suggested. Irreversible capacity loss is the most commonly invoked technique.
To test for the onset of lithium plating, we increased the charge rate of each cell group to the C/1 rate (determined here by 3× the C/3 rate) starting on the 286th cycle, while still maintaining the trickle charge at 4.2 V. The discharge rate and diagnostic steps were maintained as for the previous 285 cycles. The C/1 rate was selected based on the rate capability plot and Eq. 14 comparison in Fig. 10. We anticipated that this charging rate would accelerate degradation in the thickest electrodes, but not in the thinnest. The capacity retention during the C/1 charging is shown in Fig. 12. The diagnostic cycles are filtered out for clarity, but pertinent results are shown in Table II. The capacity measured at the C/10 rate for cycle 335 demonstrates a large irreversible capacity loss for electrode loadings of 4.4, 5.5, and 6.6 mAh/cm2, Table II. The 2.2 mAh/cm2 cell group shows no statistically significant evidence of accelerated degradation. The 3.3 mAh/cm2 cell group includes two cells with no accelerated degradation, but two cells that displayed a relatively modest capacity fade. This would suggest the 3.3 mAh/cm2 loading is near the maximum capacity for these materials and electrode construction for operation at C/1. This is further demonstrated by increasing the charge rate to 1.5C while maintain the C/3 discharge rate at cycle 549. The 3.3 mAh/cm2 cells exhibit severe capacity loss while the 2.2 mAh/cm2 cells show only a slight decrease in capacity. A closer inspection reveals that one of the 2.2 mAh/cm2 cells has very slight capacity fade while the other two exhibit measureable fade. This would suggest that 2.2 mAh/cm2 cells constructed with higher manufacturing precision should avoid capacity fade at this condition. It would also suggest that this current density is near the maximum before lithium plating occurs for this electrode loading. We note this electrode pair had the most aggressive negative to positive capacity ratio.
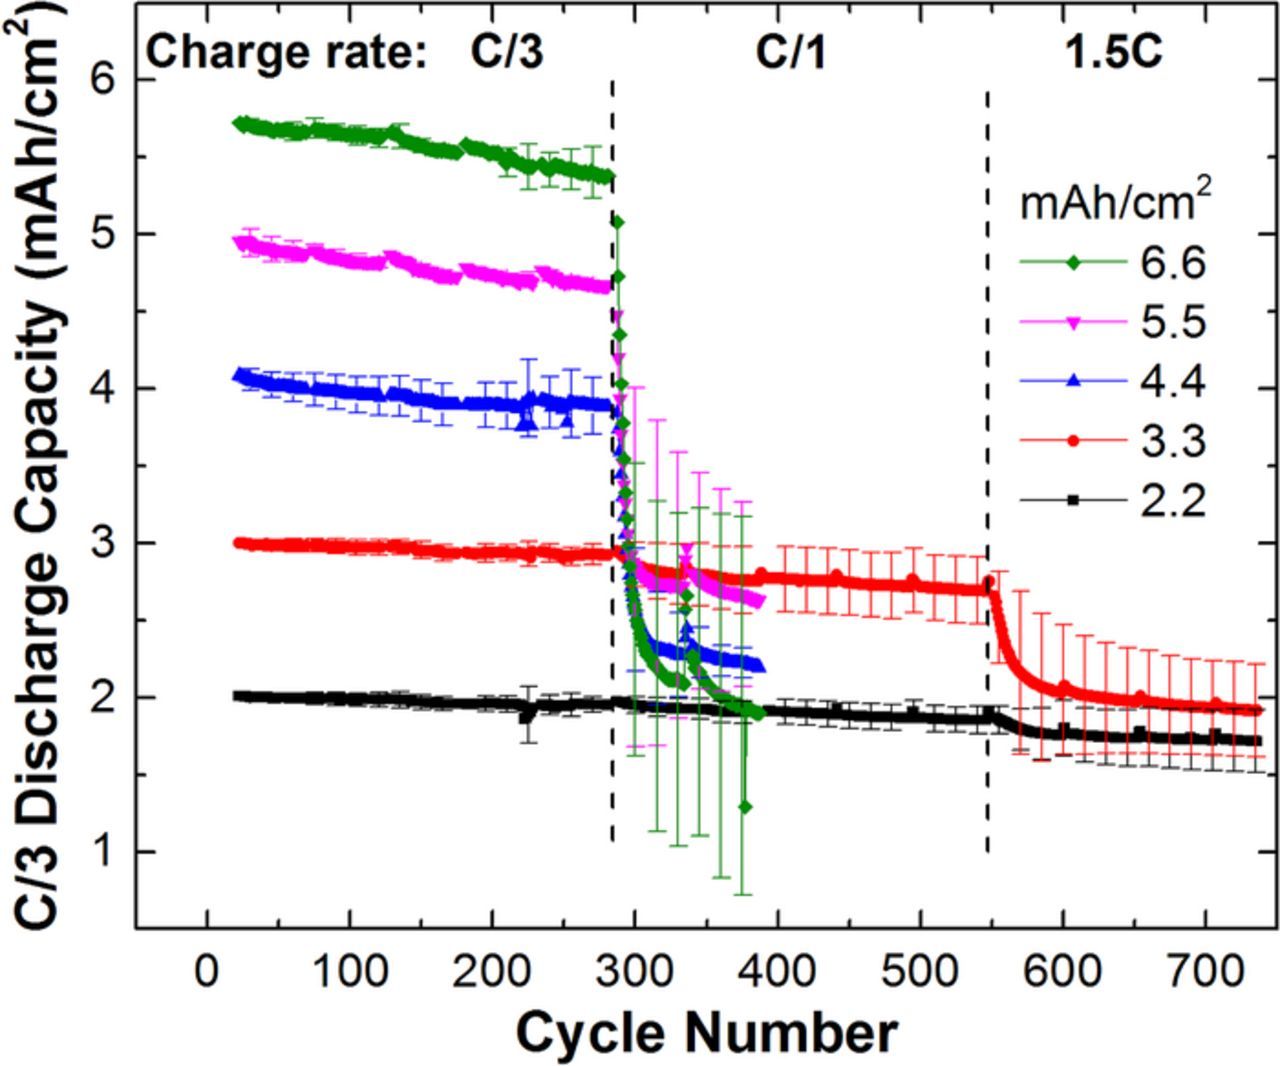
Figure 12. Cell capacity vs cycle number for a series of NMC622/Gr pouch cells of increasing areal capacity. The cycling rate was increased to C/1 charge while maintain the C/3 discharge for the same batch of cells that were previously subjected to ∼280 cycles at no higher than a C/3 charge rate.
The ASI measured for each cell group is shown in Fig. 13 for each 50 cycle increment. Overall, the ASIs increase as the cycle number increases. The ASI for the 5.5 mAh/cm2 cell group appears to be anomalously high as it does not follow the expected trend for electrode thickness. The 5.5 mAh/cm2 pouch cell group is offset >7 Ohm cm2 higher than anticipated. Full-cell coin cells assembled and tested in a similar manner show an ASI value for the 5.5 mAh/cm2 electrodes between the 4.4 and 6.6 mAh/cm2 values as expected. In addition, the shape of the pouch cell polarization during a 10-s current pulse suggests the higher impedance has a small time constant. Thus, we hypothesize the offset in the pouch cell is due to a tab welding or lead connection issue consistent with high-frequency resistance. We do not believe this significantly alters the conclusions drawn in this work.
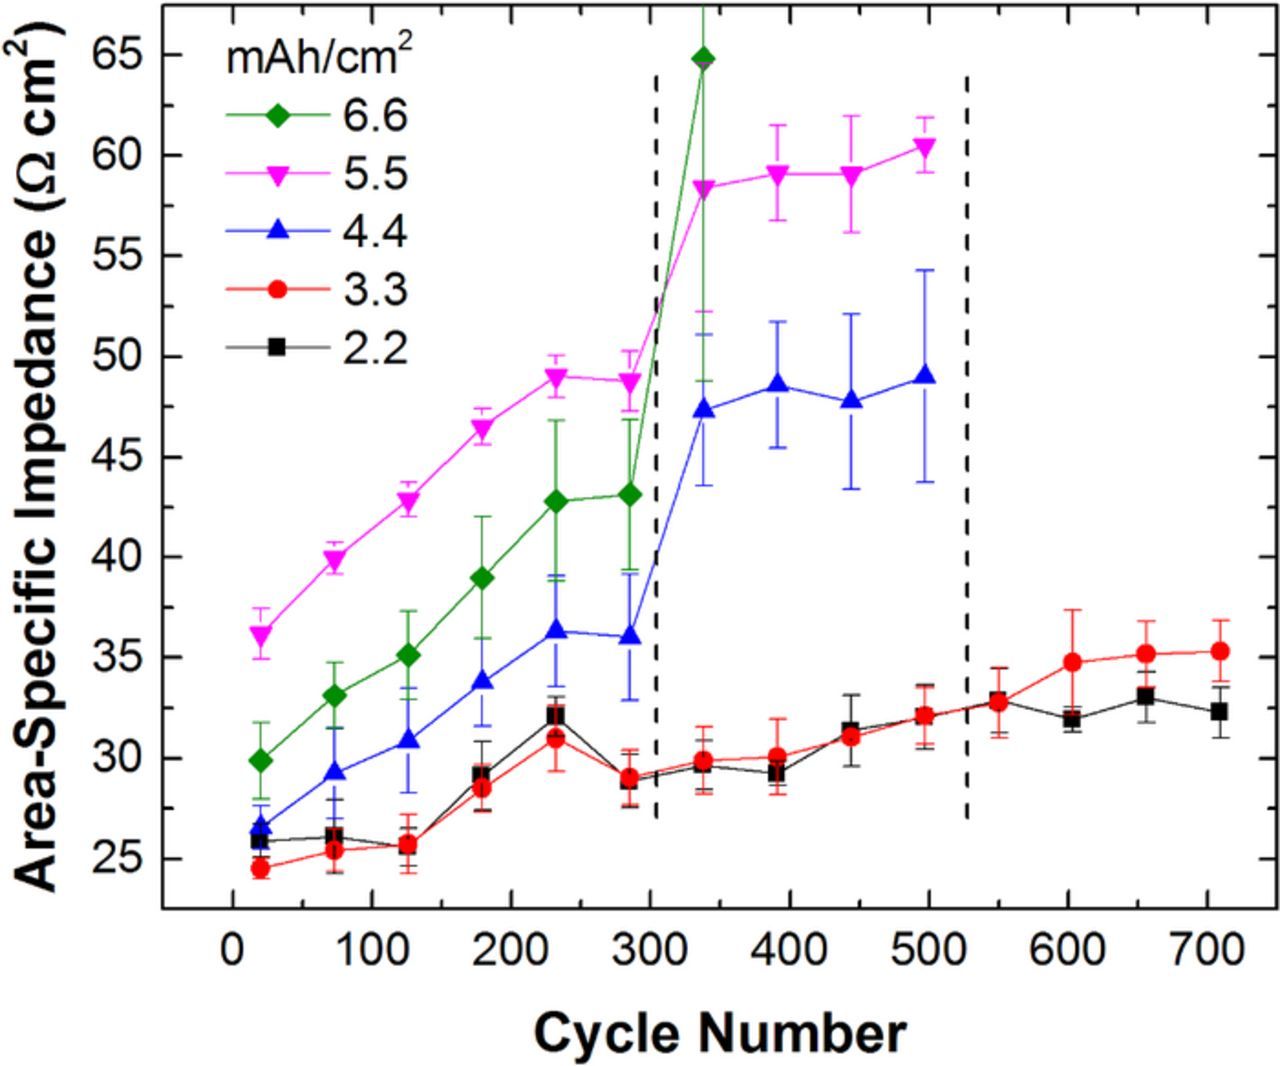
Figure 13. Cell group 10-s, 2C discharge ASI interpolated at 3.75 V as a function of cycle number. Data shown is the average of each cell group with error bars based on ±2σ shown. The lines between points are a guide to the eye only.
Select pouch cells from each cell group were disassembled in a dry room after a 24 hour voltage hold at 3.75 V for visual inspection at the end of cycling. Positive and negative electrodes were washed with dimethyl carbonate. As expected, cells that exhibited large capacity fade showed evidence of large quantities of lithium plating on the surface of the negative electrode, examples shown in Fig. 14. The lithium was observed to be metallic-silver in color. Small pieces of the metallic-silver deposit removed from the electrode reacted much more vigorously (e.g. spark or flame) when put in contact with large quantities of water than pieces of graphite removed from the same electrode. The best performing cell of the 2.2 mAh/cm2 group showed some small quantity of lithium plating when disassembled and visualized, Fig. 14. This suggests the current density was near the tipping point for the onset of lithium plating across the entire area. Small differences in coating weight and electrolyte wetting may initiate lithium plating in some areas before others. A thickness gauge was used to measure the thickness of the electrodes before and after testing. In general, the positive electrode showed little change in thickness. Conversely, the graphite electrode showed increased thickness of 5–10 μm in regions without visual defects compared to the pristine electrodes and dramatically increased thicknesses in regions associated with lithium plating. The graphite electrode of the best performing cell of the 2.2 mAh/cm2 group, Fig. 14, measured an additional 7 μm greater in thickness in lithium plating regions than those without. In cells that exhibited substantial capacity fade (cell groups 3.3, 4.4, 5.5, and 6.6 mAh/cm2), an increase of thickness of 70 μm was common between regions of the cycled graphite electrode with and without obvious lithium plating. In other words, the deposit associated with lithium plating dramatically increased the negative electrode thickness. Higher loading graphite electrodes are omitted from Fig. 14 as they appear similar to the 4.4 mAh/cm2 electrode. Fully discharging (or charging) the 4.4 mAh/cm² cells did not remove the lithium deposits. This indicates that the lithium deposits are not electrically or electrochemically connected to the negative electrode. In addition to lithium plating, graphite was observed to flake off during disassembly around the edges of the punched layer. The severity of the flaking increased as the loading increased. It is unknown if this region was active during the cycling and only disconnected during disassembly. For the 4.4 mAh/cm2 electrode, gold colored graphite, believed to be LiC6, is found in the corners of the layer and is believed to have become electrically isolated at some point during the testing.
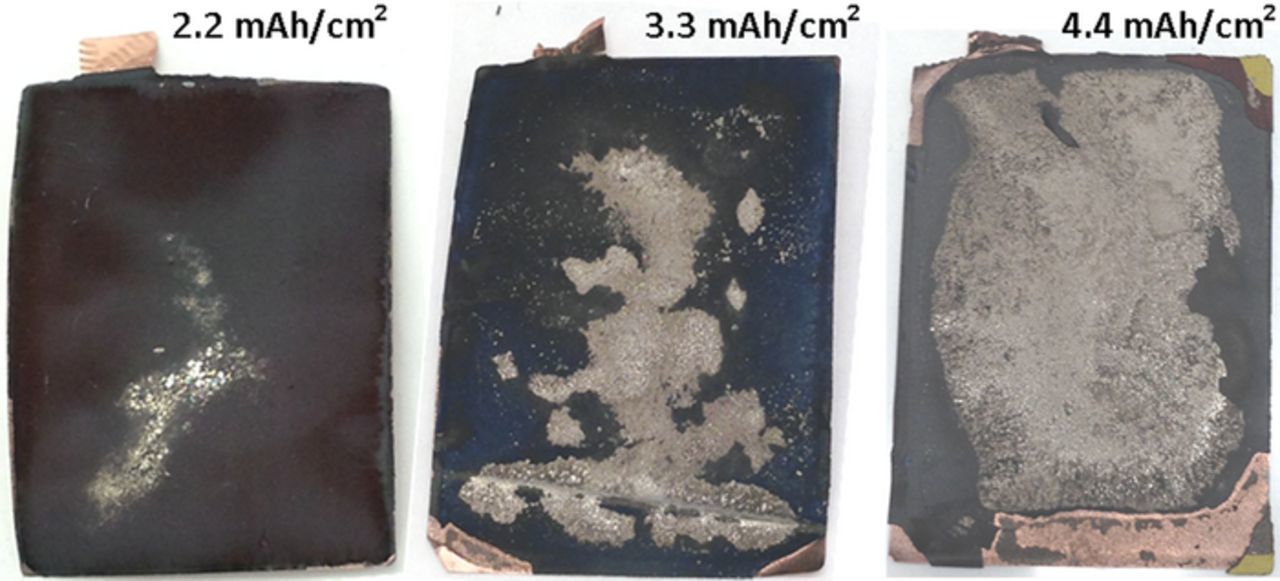
Figure 14. Images of graphite electrode from cell teardown after aging in NMC622/Gr pouch cells. Lithium plating appears as metallic deposits on the surface of the electrode.
Much more work is needed to understand the transition from stable cycling to the onset of transport limitations and side reactions such as lithium plating. Figure 15 is proposed as an early performance map that might be used for electrode design. The critical C-rate for the NMC662/Gr electrodes, γ = 0.6, is plotted along with a more conservative value of γ = 0.3. The available areal capacity for charging the cell may be approximated if one assumes that the parameters in Eq. 14 used for the positive electrode are a reasonable approximation of the negative electrode. The volumetric capacities of the positive and negative electrodes considered in this work are similar in value. We note the γ value may differ for other graphite types such as platelet shaped, common for natural graphite, which exhibits a highly anisotropic electrode tortuosity. In addition, series that represent constant polarization of the graphite electrode from the first (120 mV) and second (90 mV) plateaus are shown. An electrode ASI is required to calculate this current-voltage relationship for the graphite electrode. The ASI of the graphite electrode was estimated from half-cell measurements of 2-sec charge (lithiation) pulses, as described in
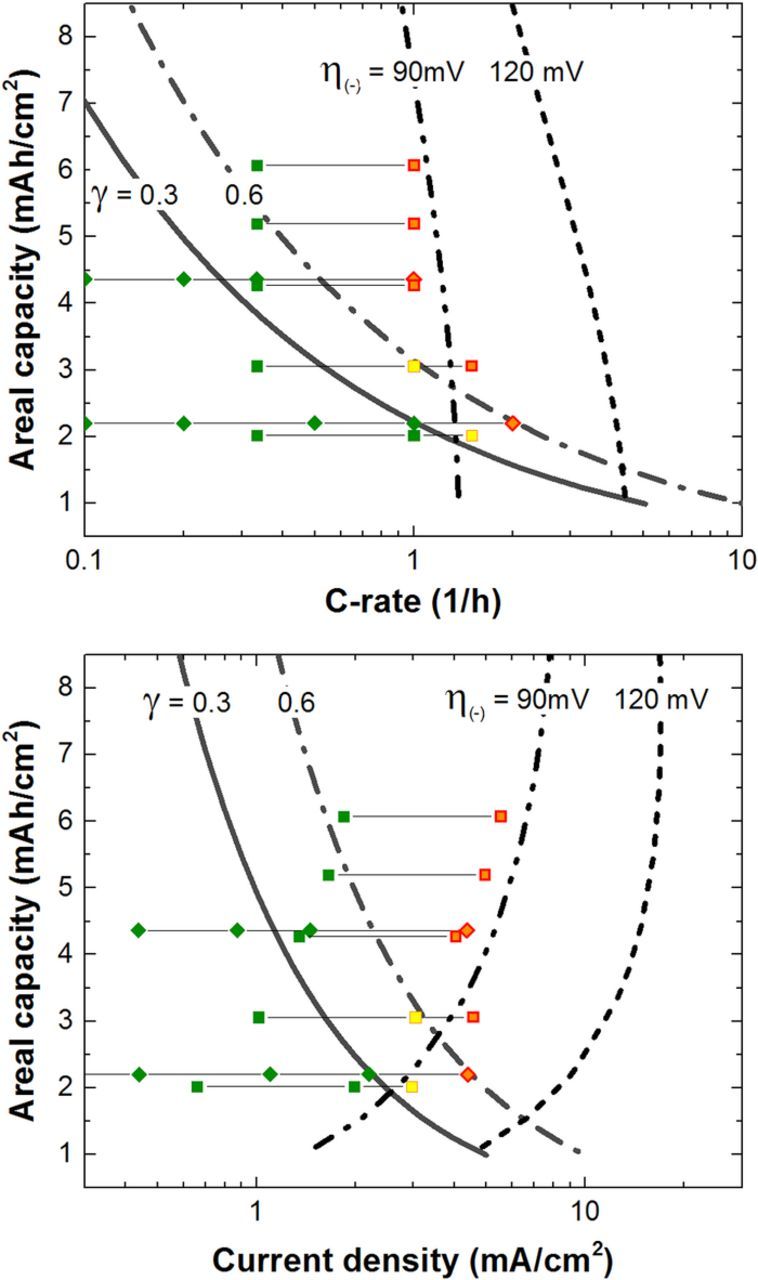
Figure 15. Experimental observations at 30°C of stable cycling (green symbols), onset of capacity fade (yellow symbols) and rapid loss from assumed lithium plating (red/orange symbols) are plotted against lines of mass transport limitation and overpotential limitations for charging. Square symbols are from observations reported in this work while diamonds are from Burns et al. using high precision coulometry measurements.18 Lithium plating on graphite likely sets the electrode loading for various applications.
A guideline may be considered that graphite cells should avoid current densities near or above 4 mA/cm2 on charge unless additional precautions have been made to avoid the side reaction. The line representing a constant overpotential of 90 mV at the negative electrode correlates with the separation between stable cycling and rapid capacity loss for high areal capacities. Electrolyte transport limitations are likely important in this region as the combination of overpotentials lead to lithium plating. For low electrode areal capacities or thicknesses, this line begins to bend toward lower current densities on account of the increasing electrode ASI from diminishing interfacial active area.32 Chandrasekaran reported for a 2 mAh/cm2 cell that simulations indicated conditions thermodynamically favorable to lithium plating occurred at the 2C rate (i.e., 4 mA/cm2).16 There-in, both electrolyte concentration overpotential and interfacial kinetic overpotentials contributed to the favorable conditions for lithium plating. This agrees well with our observations as well as Burns et al.18 Modifications may be made to a graphite electrode to allow for higher rate continuous or pulse charging. These might include a higher negative to positive capacity ratio (N:P ratio), including hard carbon as a physical blend, or selecting a graphite with lower interfacial impedance. Cell designers may also choose to de-rate the charging power capability of the cell when it is on the lower voltage plateau of the graphite electrode. The higher voltage plateau has comparatively lower interfacial impedance and greater overpotential before lithium plating may ensue. Understanding the onset of lithium plating in a graphite electrode requires accurate treatment of transport within the electrolyte and active phases, interfacial kinetics, and real world use of the cell. We note lower temperature operation may drive the design requirement as electrolyte transport properties will decrease in value and the interfacial kinetics for impedance have been shown to be problematic. Future work would be well served to examine the current density design space where interfacial kinetics and electrolyte transport limitations coincide as a function of temperature of operation.
Conclusions
Stable cycling is reported for high loading electrodes when proper current densities are chosen to fully access available capacity and avoid lithium plating side reactions on the negative electrode. The consequence of utilizing high areal capacity electrodes is that the rate of operation is limited by the electrolyte transport and interfacial overpotential in the negative electrode. Therefore, the use profile of the application will dictate what areal capacity may be utilized in a cell design. While constant charge and discharge rates are instructive, examining the life performance under real world operation, such as drive cycles, will answer whether high electrode loadings may be used in transportation applications. In addition, future work that examines more closely the onset of lithium plating as a function of temperature and in the design space where transport and interfacial overpotential intersect will be of great value.
Acknowledgments
Argonne authors gratefully acknowledge support from the Vehicle Technologies Office, Hybrid and Electric Systems, David Howell (Team Lead) and Peter Faguy, at the U.S. Department of Energy, Office of Energy Efficiency and Renewable Energy. The Cell Analysis, Modeling, and Prototyping (CAMP) Facility at Argonne National Laboratory is funded by the U.S. Department of Energy, Office of Energy Efficiency and Renewable Energy, Vehicle Technologies Office. The submitted manuscript has been created by UChicago Argonne, LLC, Operator of Argonne National Laboratory ("Argonne"). Argonne, a U.S. Department of Energy Office of Science laboratory, is operated under Contract No. DE-AC02-06CH11357.
: Appendix A
This porous electrode model formulism is taken from the work of Dees et al.24–26 and based on the large body of work from Newman et al.20–23 The focus of this Appendix is on the electrolyte transport equations and properties. The volume-averaged material balance on the anion of the binary electrolyte for a concentrated solution is Eq. A1. Equation A2 is Ohm's law for concentrated solution binary electrolyte where the conductivity has been modified to an effective value using the Bruggeman correction.
![Equation ([A1])](https://content.cld.iop.org/journals/1945-7111/163/2/A138/revision1/d0015.gif)
![Equation ([A2])](https://content.cld.iop.org/journals/1945-7111/163/2/A138/revision1/d0016.gif)
The electrolyte is treated as a concentrated solution with the pertinent parameter values taken from Gering's advanced electrolyte model and previously confirmed by a series of experimental studies.27,28 Equations A3–A6 show the concentration and temperature dependence of the electrolyte transport parameters.
![Equation ([A3])](https://content.cld.iop.org/journals/1945-7111/163/2/A138/revision1/d0017.gif)
![Equation ([A4])](https://content.cld.iop.org/journals/1945-7111/163/2/A138/revision1/d0018.gif)
![Equation ([A5])](https://content.cld.iop.org/journals/1945-7111/163/2/A138/revision1/d0019.gif)
![Equation ([A6])](https://content.cld.iop.org/journals/1945-7111/163/2/A138/revision1/d0020.gif)
: Appendix B
The negative electrode overpotential, η-, was calculated by using Eq. B1, which assumes an even current density across the electrode and a linear form of the Butler-Volmer kinetics.20,32,33 The electronic, σ, and ionic, κ, conductivities are modified by the porosity and tortuosity of the electrode to produce effective values of 2.2 and 2.1 × 10⁻³ S/cm respectively. The effective path for an invariant current distribution through the electrode scales with L/3 as the current in the phase diminishes as it approaches the end of the path.33 The product of the exchange current density, i0, and the specific interfacial area, a, are treated as inseparable in this work. This formulation ignores concentration gradients within the electrolyte and the intercalation host.
![Equation ([B1])](https://content.cld.iop.org/journals/1945-7111/163/2/A138/revision1/d0021.gif)
The impedance of the graphite electrode was estimated through a number of short duration current pulse studies. Half cells were assembled using lithium metal and the negative electrodes considered in this work. After five formation cycles at the C/10 rate, each cell was discharged (graphite lithiated) to a lithium content of approximately Li0.4C6. Three 10-s lithiation pulses were conducted at the C/5, C/2, and C/1 rates with each separated from each other by a 30 minute rest. The graphite was then lithiated to approximately Li0.75C6 were the pulse sequence was repeated.
The overpotential of the graphite electrodes were separated from the other contributions (i.e. lithium metal, electrolyte in separator, etc) by plotting the 2-s overpotential of all electrodes as a function of tested current density. For high loadings, the ASI associated with lithium metal and other contributions dominated as the cell resistance was invariant with electrode loading. For low loadings, this ASIother may be subtracted off to reach the graphite electrode contributions. The overpotentials are represented well with a linear system similar to Ohm's law, Eq. B2. We hypothesize this is the result of the low current densities in the pulse study and short time durations to avoid significant concentration gradients. The negative electrode ASI is estimated to be 13 Ω cm2 for the 2.2 mAh/cm2 electrode. The interfacial kinetic parameters for the negative electrode are estimated to be ai0 = 0.35 mA/cm3 for Li0.4C6 and ai0 = 0.14 mA/cm3 for Li0.75C6. These values are then used to estimate the overpotential as a function of current density in the main text.
![Equation ([B2])](https://content.cld.iop.org/journals/1945-7111/163/2/A138/revision1/d0022.gif)