Abstract
A 2-D mathematical model of the secondary current distribution in a three-electrode cell is used in order to understand distortion of impedance spectra influenced by the position of the reference electrode (RE) in a cell when one electrode extends past the other. The cell setup consists of a modified coin cell, i.e., working and counter electrodes face each other, and a RE is positioned behind the counter electrode (CE) that has a small hole in it to allow for electrolyte access. This configuration shows large distortion of WE and CE impedance data when taken against the RE. The WE/RE impedance is underestimated and contains a negative impedance contribution from the CE whereas the CE/RE impedance is overestimated and contains a positive impedance contribution from the WE. As supported by simulations, the distortions arise from a radial ionic current flowing from the WE toward the edge of the CE hole, and are minimized through an increase of the electrolyte conductivity, an increase of the separator thickness, or a decrease of the hole size in the CE. The distortions nearly disappear when an additional hole is included in the WE that is perfectly aligned with the hole in the CE. These results should be considered whenever designing a 3-electrode cell where the RE is not sandwiched between the two other electrodes.
Export citation and abstract BibTeX RIS

This is an open access article distributed under the terms of the Creative Commons Attribution 4.0 License (CC BY, http://creativecommons.org/licenses/by/4.0/), which permits unrestricted reuse of the work in any medium, provided the original work is properly cited.
Electrochemical impedance spectroscopy (EIS) proves a powerful technique to analyze limiting phenomena in Li-ion batteries. Analysis of EIS spectra allows in principle to separate out and quantify the various contributions to the overall cell impedance, such as charge transfer at the solid/electrolyte interfaces, diffusion, electrolyte resistance, etc. In order to separate out the effects at anode and cathode, a reference electrode (RE) is introduced in the cell, and impedance is measured between the working electrode (WE) and the RE and between the counter electrode (CE) and the RE. Positioning of the reference electrode turns out to be non-trivial, because for particular three-electrode cell configurations, EIS spectra exhibit distortions and meaningful analysis of the data is not straightforward.
This problem has long been pointed out and investigated in the fuel-cell community. In fuel cells, the electrolyte membrane layer usually extends past that of the electrodes to limit gas mixing, and the RE is positioned at one side of the electrolyte layer, in an area which is not covered with the electrodes. Distortion of the EIS signal was shown to arise whenever the WE and CE are misaligned or are of different surface area, but it is observed as well in the absence of geometrical mismatch, whenever the time constants of the two electrodes differ substantially from each other. Readers are invited to refer to Refs. 1 and 2 for an extensive modeling and experimental study on this type of cell. Other modeling works are detailed as well in the introduction of those references.
To our knowledge, there have been many less studies for the case of batteries. As recommended from a modeling study by Newman and Tiedemann, the best RE location for reliable measurements is between the WE and the CE and reasonably close to the tabs.3 Accordingly, Dollé et al. inserted a microRE made up of a small piece of a plastic Li4Ti5O12 electrode adhered to an isolated copper wire and inserted between the main electrodes and then performed reliable EIS measurements on a plastic MCMB/LiCoO2 pouch cell.4 A similar design was used in other studies throughout the literature.5,6 The main limitation of this cell configuration is that there is always an area of the cell (albeit small) which is shielded by the RE, which may impact the local cell polarization, especially when high-rate charge/discharge experiments are performed. Additionally, two layers of separators are required for such a cell configuration (the RE is inserted in between them), unlike in real cells where a single piece of separator is generally used.
Three-electrode cell setups other than those based on a microRE have been employed for Li-ion-battery studies; The T cell configuration, where the RE is positioned to the side of the 2-electrode sandwich, is frequently used for time-domain and EIS measurements.7,8 Some recent modeling studies, however, demonstrated that the use of this setup may introduce large distortion in the EIS signals of the individual electrodes measured vs. RE, which arises from differences in WE and CE time constants and/or electrode misalignment.9,10 More recently, a cell design aiming to overcome the main limitations of both the microRE setup and the T cell was reported in the literature.11 Its design derives from that of a Swagelok cell, but a coaxial RE is positioned at each side of the cell sandwich. There are holes in the center of both the WE and CE to provide ionic contacts for the REs. A modeling study on this cell by the same authors shows that EIS measurements with this cell should be less prone to distortion, as long as any hole or electrode misalignment is small compared to the separator thickness and that edge effects are prevented.12
Another cell design has recently been developed at Lawrence Berkeley National Lab. The design consists of a modified coin cell, where a coaxial RE is introduced at the back of the CE (Figure 1). Just like in the design from Ref. 11, a hole is punched in the center of the CE in order for the RE to be in ionic contact (Figure 2a). In a modified version, another hole is punched in the WE as well (Figure 2b). This new cell setup is meant to offer the same advantages of a regular coin cell while allowing for an evaluation of the electrochemistry of each electrode individually. In this paper, a modeling-based analysis is conducted in order to understand the origin of impedance distortion and determine the best conditions for obtaining reliable impedance measurements with this new cell setup.
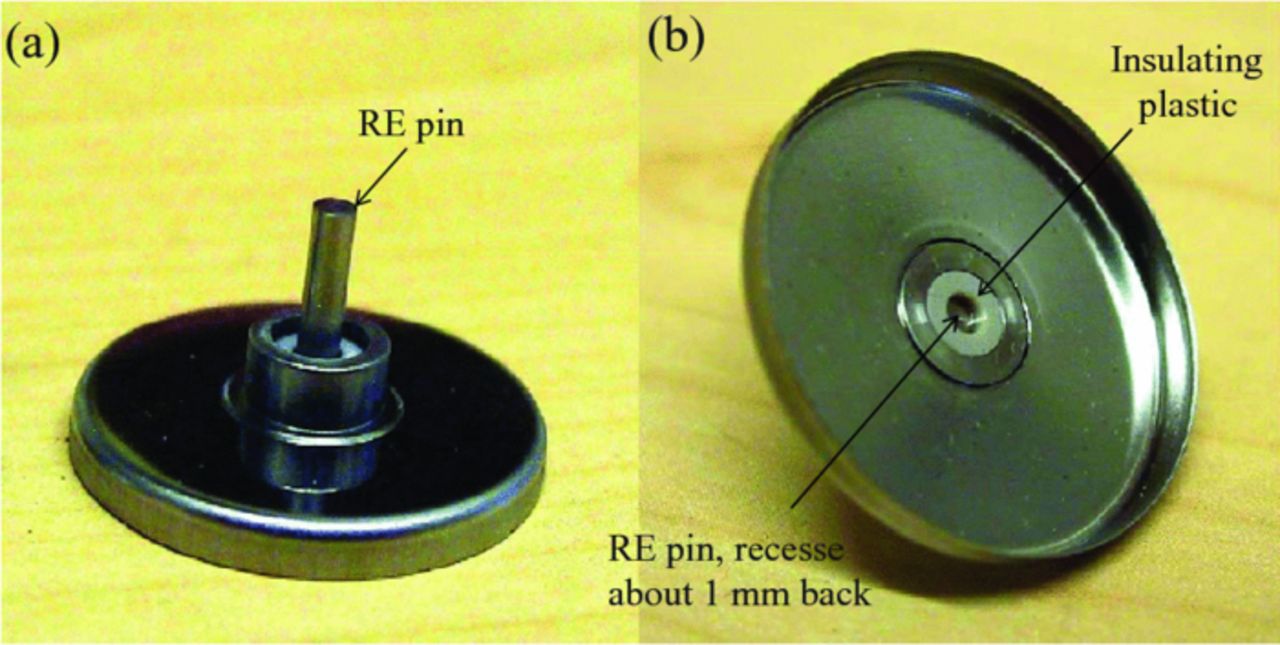
Figure 1. Photograph of the modified side of the coin-cell can. (a) View of the outside of the cell and (b) view of the inside of the cell.

Figure 2. Schematics of two different three-electrode coin cell setups. a) Setup #1 with a hole in the CE only. b) Setup #2 with holes in both the CE and the WE. Active parts of the electrodes are represented with a bold line. There is a second reference electrode (REideal) that is used for simulations of Figure 5a, but which is not present in actual experimental setups.
Experimental
The 3 electrode coin cell is a modification of the 2325 research coin cell made by National Research Council of Canada (NRC). The CE-side cell can is modified by fitting it with an electrical feedthrough which contains the lithium metal reference electrode. The feedthrough consists of an outer casing of 446 (high Cr) stainless steel (SS) alloy which is laser welded into a hole drilled in the center of the cell can (Figure 1a). An insulating cylinder of PEEK or Kel-F plastic is press-fit into the casing, and a 2 mm diameter 304 SS electrical contact pin is press-fit through a hole drilled in the center of the plastic insulator. An edge of the feedthrough casing and one face of the plastic insulator are made flush with the inner surface of the cell can. The inner surface of the 304 SS pin is recessed about 1 mm back from the inner surface of the cell can to allow filling with lithium metal until flush with the inner surface (Figure 1b). During cell assembly, a drop of electrolyte is placed on this lithium reference electrode, which is then covered with a ∼6 mm diameter piece of Celgard 2400 membrane to prevent electrical shorting to the back (current collector) of the CE, which is placed next into the cell can. The CE has a 1 mm hole punched in its center to improve ionic conductivity between the reference electrode and the WE. After the CE is in place, a measured amount (typically 100 μL) of electrolyte is added, followed by the Celgard 2400 membrane separator, followed by the WE, SS disk spacer, disk spring, and CE cell can fitted with an insulating polymer ring, and crimped in a pneumatic press. All cell parts and the press are supplied by NRC except for the electrical feedthrough, electrodes, separator material and electrolyte.
Model Development
Two models are developed in this paper in order to simulate EIS spectra, namely a 2D mathematical model of the coin cell based on the finite-element method (FEM), and an equivalent-circuit model. The majority of the simulations are carried out with the FEM model, which is the most realistic. The equivalent circuit aims to shed light on the origin of the impedance distortion effects in a simpler way, while retaining the essential features of the 2D model.
2-D finite-element model of the cell
The model is based on a secondary current distribution, i.e., Laplace equation is solved in the electrolytic medium (assumed of uniform composition and ionic conductivity),13
![Equation ([1])](https://content.cld.iop.org/journals/1945-7111/161/9/A1253/revision1/jes_161_9_A1253eqn1.jpg)
with Φ2 the electric potential in the electrolyte. The three electrodes are assumed to be good electron conductors, and therefore the potential Φ1 in each of them is considered uniform. At the interface between an electrode i and the electrolyte (represented as a bold line in Figure 2), the current density ii is the sum of a charge-transfer current and a capacitive current
![Equation ([2])](https://content.cld.iop.org/journals/1945-7111/161/9/A1253/revision1/jes_161_9_A1253eqn2.jpg)
where Ri and Ci stand for the charge-transfer resistance and double-layer capacitance of electrode i, respectively. In order to solve for the impedance, the above set of equations is transformed into frequency space
![Equation ([3])](https://content.cld.iop.org/journals/1945-7111/161/9/A1253/revision1/jes_161_9_A1253eqn3.jpg)
where complex variables are capped with a tilde sign, j is the imaginary number, and f is the frequency. Complex impedances are calculated as follows
![Equation ([4])](https://content.cld.iop.org/journals/1945-7111/161/9/A1253/revision1/jes_161_9_A1253eqn4.jpg)
where  is the complex current flowing through the cell, between the WE and the CE. It is evaluated by integrating the current density over the active surface of the working (or counter) electrode.
The model structure is fairly similar to others that have been recently published in the literature.10,12 The main difference lies in the geometry; only a thin slice of the cell (i.e., a cross section of the cell along its diameter) is simulated in this work, hence the model is 2-D as opposed to published models which are 3-D. A 2-D cross-section model in rectangular coordinates is selected here rather than a 2-D axisymmetric model in cylindrical coordinates; although slight differences between the simulation results of the two models are expected, there is a more direct analogy between the cross section model and the equivalent-circuit model that is introduced in the next subsection.
The model is coded in COMSOL Multiphysics (finite-element method) and about 60,000 elements are used for each simulation. Note that with the above set of equations, the current density can be nonzero in some parts of the RE, while the overall current flowing through the RE is set to zero in the model. Parameters used in the model are listed in Table I unless otherwise mentioned in the text.
Table I. Model parameters for base case simulations with both the FEM model and the equivalent circuit model.
| Parameter | Symbol | Value |
|---|---|---|
| Geometric | ||
| Separator thickness (μm) | dWE-CE | 25 |
| Thickness of the electrodes (μm) | δ | 20 |
| Size of the WE and CE (mm) | del | 14 |
| Distance between the back of the CE and the RE (μm) | dCE-RE | 25 |
| Size of the RE (mm) | dRE | 1.8 |
| Size of the hole in the CE (mm) | dhole | 1 |
| Length of the second reference electrode REideal (μm) | dREideal | 10 |
| Physical | ||
| Effective conductivity (S/m) | κ | 0.2 |
| Charge-transfer resistance at the WE (Ω m2) | RWE | 1.5 10−3 |
| Double-layer capacitance at the WE (F/m2) | CWE | 0.01 |
| Charge-transfer resistance at the CE (Ω m2) | RCE | 1.5 10−3 |
| Double-layer capacitance at the CE (F/m2) | CCE | 1 |
| Charge-transfer resistance at the RE (Ω m2)* | RRE | 1.38 10−3 |
| Double-layer capacitance at the RE (F/m2)* | CRE | 0.01 |
Equivalent-circuit model
The model is based on the equivalent electrical circuit of Figure 3. It features a cell where there is a mismatch in lengths between the WE and the CE and where the RE is located in the mismatch area. The WE is partially uncovered by a CE on the right hand side. It can be viewed as a simplified model of the three-electrode coin cell (Figure 2a) along its radial dimension, with the cell edge at the left hand side and the cell center at the right hand side of Figure 3. Each electrode is modeled with a number of "thru-plane" Randles elements of impedance  with XE standing either for WE or CE. Randles elements of a single electrode are connected together on the current-collector side. On the electrolyte side, they are connected to both the corresponding Randles element of the facing electrode and to the adjacent series of elements through in-plane electrolyte resistors
  . The actual RE location is at node nCE + 1, i.e., the first node for which the WE does not face the CE. The ideal RE is taken at node 1. Impedances of both the WE and the CE measured vs. RE and REideal are represented by means of arrows in Figure 3, just like is done with voltages. The choice of this representation is explained in the following.

Figure 3. Equivalent circuit featuring a three-electrode cell where the working electrode is partially uncovered with the counter electrode, and the reference electrode sits in the uncovered area and faces the WE.
There are 2n + nCE − 1 variables, among which n (= nWE) normalized currents  at each node of the WE, nCE normalized currents
  at each node of the CE, and n − 1 normalized in-plane currents
  . Normalization is with respect to the total current
  flowing through the WE (or CE) and therefore all currents denoted as lowercase
  in this work are dimensionless quantities. The 2n + nCE − 1 equations that are needed to solve for these variables derive from Kirchoff's laws, i.e.,
![Equation ([5])](https://content.cld.iop.org/journals/1945-7111/161/9/A1253/revision1/jes_161_9_A1253eqn5.jpg)
![Equation ([6])](https://content.cld.iop.org/journals/1945-7111/161/9/A1253/revision1/jes_161_9_A1253eqn6.jpg)
![Equation ([7])](https://content.cld.iop.org/journals/1945-7111/161/9/A1253/revision1/jes_161_9_A1253eqn7.jpg)
![Equation ([8])](https://content.cld.iop.org/journals/1945-7111/161/9/A1253/revision1/jes_161_9_A1253eqn8.jpg)
in which  , and
, and  stands for the Randles impedance and is expressed as
![Equation ([9])](https://content.cld.iop.org/journals/1945-7111/161/9/A1253/revision1/jes_161_9_A1253eqn9.jpg)
with rXE the charge-transfer resistance of an element of the XE electrode, defined as rXE = nRXE, cXE the double layer capacitance of an element of the XE electrode, defined as  , and
, and  the thru-plane electrolyte resistance of an element of the XE electrode, defined as
  . In-plane electrolyte resistance
  relates to the conductivity according to
  . Parameters dWE-CE, del, and κ are as defined in Table I.
All normalized current variables are readily solved for in Matlab by matrix inversion, and the various impedance contributions highlighted as arrows in Figure 3 are calculated in a similar way as one would do with voltages, e.g.,
![Equation ([10])](https://content.cld.iop.org/journals/1945-7111/161/9/A1253/revision1/jes_161_9_A1253eqn10.jpg)
This is so because currents are normalized to the total current flowing through the cell. Indeed, the voltage between WE and REideal is expressed as
![Equation ([11])](https://content.cld.iop.org/journals/1945-7111/161/9/A1253/revision1/jes_161_9_A1253eqn11.jpg)
Using Kirchoff's voltage laws, the following relations between the different impedance contributions arise
![Equation ([12])](https://content.cld.iop.org/journals/1945-7111/161/9/A1253/revision1/jes_161_9_A1253eqn12.jpg)
and
![Equation ([13])](https://content.cld.iop.org/journals/1945-7111/161/9/A1253/revision1/jes_161_9_A1253eqn13.jpg)
Results and Discussion
Figure 4 represents typical impedance spectra experimentally measured on a Li-ion coin cell using setup #1 (Figure 2a). The two-electrode impedance signal (measured between the WE and CE, Figure 4a) is composed of two semi-circular contributions or more in the intermediate-frequency range (2 Hz – 200 kHz) that usually correspond to charge transfer in parallel with double-layer charging at the electrodes or to the contribution of passive films. There is a low frequency-impedance contribution (<2 Hz) that originates from Li diffusion in the solid phase of the electrode and possibly in the liquid phase as well.14 The impedance contributions of the two electrodes are lumped into the overall signal. In Figure 4b, the contributions of each electrode, measured vs. RE, are represented. Still, the CE mid-frequency signal contains two contributions or more, whereas the WE signal exhibits both a capacitive and a seemingly inductive contribution. The "inductive" contribution is the manifestation of distortion effects, likely related to the cell setup and RE position, as it is demonstrated in the following.
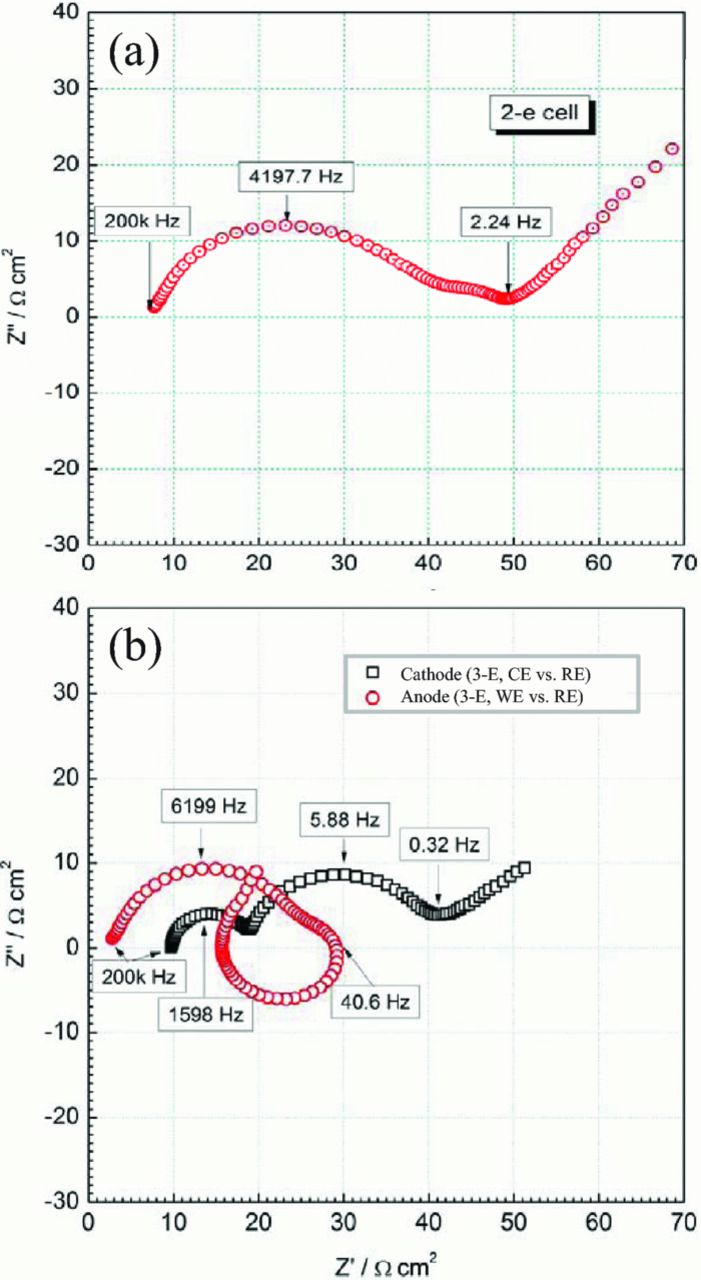
Figure 4. Typical EIS data from a three-electrode cell, with setup #1 (See Figure 2a). (a) Full-cell impedance spectrum (b) Impedance spectra of each electrode, measured vs. RE.
Simulations with the FEM model are done using input parameters from Table I, unless otherwise mentioned. The electrolyte effective conductivity is calculated considering the room temperature conductivity of 1 mol/L LiPF6 in EC/DEC 1:1 reported in Ref. 15 along with 40% porosity for the separator. The Bruggeman correction is used to estimate tortuosity. Values of charge-transfer resistances are similar to those reported for a Li metal electrode (e.g., RLi = 1.38 10−3 Ω m2 according to Albertus et al.16) and lie in a similar range as those of porous electrodes as well, if normalized to the geometric surface area of the electrode. Typical values for double-layer capacitances are generally in the range of a few F/m2 and about two orders of magnitude lower when capacitance relates to charge separation in a passive film.17 Values of capacitances at both WE and CE are selected that differ by two orders of magnitude so that the characteristic time constants of the electrodes are different from each other, which makes the analysis of the impedance spectra more visual, as is detailed below.
Simulated impedance spectra with the FEM model are represented in Figure 5 for two different locations of the RE; in Figure 5a, impedance of the WE and CE are measured vs. REideal whereas in Figure 5b they are measured vs. RE (Refer to Figure 2a for the position of RE and REideal). REideal is positioned following recommendations of Ref. 3, i.e., it is located midway between the WE and the CE electrodes, and far (≫ separator thickness) from the hole in the CE. Impedance spectra of Figure 5a are well in agreement with those expected from theory, i.e., both WE/REideal and CE/REideal spectra consist of a semi-circle with the same resistance and with characteristic frequencies of ∼10,000 and ∼100 Hz, respectively [remind that fc = 1/(2πRC)]. The two semi-circles are located at the same high-frequency resistance, which corresponds to half the value of that in the impedance signal between the WE and the CE, and which reflects that REideal is located halfway between WE and CE electrodes.

Figure 5. Influence of the reference electrode position on the simulated impedance spectra; (a) Spectra are measured vs. REideal, (b) Spectra are measured vs. RE (Setup #1, see Figure 2a for geometric details).
The situation is very different whenever spectra are measured vs. RE (Figure 5b). The CE/RE spectrum contains two distorted semi-circles, with characteristic frequencies of ca. 10,000 and 100 Hz. The high-frequency semi-circle likely corresponds to a "distortion" of the signal by the WE. The WE/RE spectrum contains two contributions as well, including a capacitive one at high frequency (ca. 10,000 Hz) and an "inductive" contribution at lower frequency. The resistance associated with the 100-Hz contribution of the CE/RE spectrum is larger than expected from theory and shown for the CE/REideal, whereas that associated with the 10,000-Hz contribution of the WE/RE spectrum is smaller than expected. Furthermore, unlike in Figure 5a, high-frequency resistances of the WE/RE and CE/RE spectra are not equal, with that of the WE/RE spectrum being much smaller than that of CE/RE spectrum. A careful look at the electrolyte potential distribution of Figure 6a allows one to understand this behavior: the electrolyte potential near the RE is very similar to that near the face of the WE; this is because there is much less current flowing in this area, leading to a minor drop of the electrolyte potential between the uncovered WE and RE when compared with that between WE and REideal. In other words, an electrode in a hole behind the CE where the hole is larger than the separator appears to be placed very close to the face of the WE. Because the impedance is calculated based on the total current flowing through the WE, it comes out that the high-frequency resistance measured between WE and RE looks much smaller than expected based on the physical distance between these electrodes.
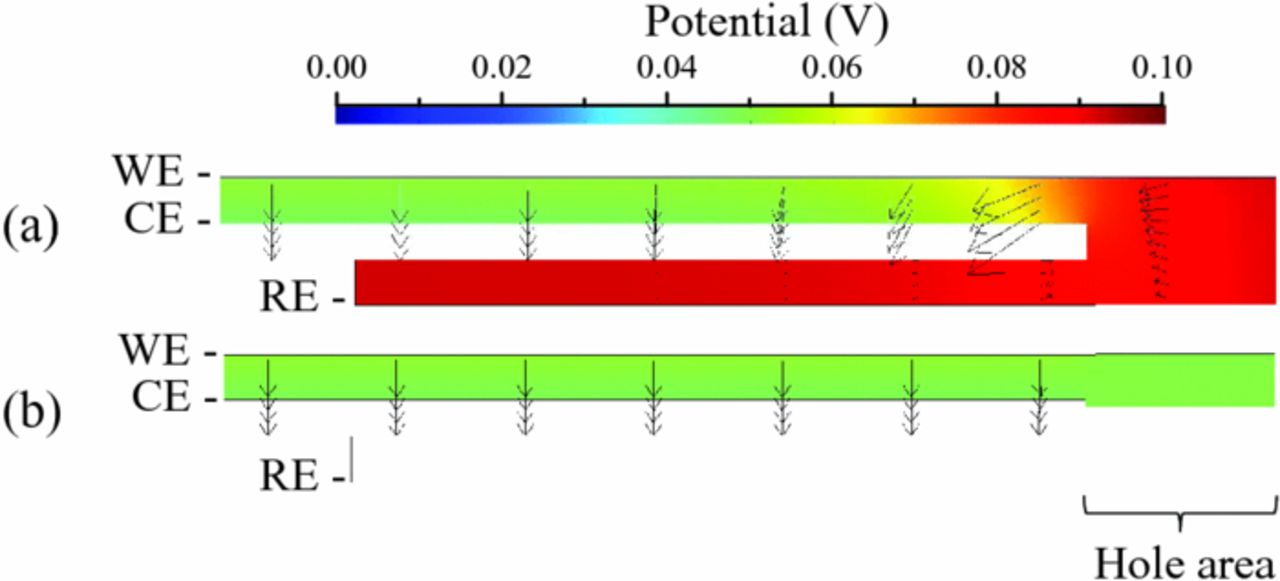
Figure 6. Simulated electrolyte potential (surface plot) and current density (arrows) in the case of (a) setup #1 and (b) setup #2, for a steady-state situation, where a cell potential of 10 mV is set.
At this stage, it is interesting to look at equivalent-circuit simulations in order to scrutinize the origin of the distortions of the impedance signals. The various impedance contributions represented with arrows in Figure 3 are simulated and represented in Figure 7a. Although not fully similar to the simulations with the FEM model (Figure 5b), the two types of simulations agree fairly well with each other on a qualitative basis.  is lower-than-expected and the opposite is true for
  . Additionally,
  exhibits an "inductive" contribution, even though it is lower in magnitude compared with that from the FEM simulation. This simplified model sheds light on the origin of the signal distortions: the quantity
  , which is subtracted from the ideal WE impedance
  and added to the ideal CE impedance
  to yield the distorted signals
  and
and  , respectively, reads
![Equation ([14])](https://content.cld.iop.org/journals/1945-7111/161/9/A1253/revision1/jes_161_9_A1253eqn14.jpg)

Figure 7. (a) Simulated impedance diagrams using the equivalent-circuit model. The various contributions plotted here are represented in Figure 3. Top frame clearly illustrates how the seemingly "inductive" loop in  at low frequency originates from the "negative-impedance contribution" of the RE electrode
  . (b) Breakdown of ZRE-REideal in its four main terms. Equivalent-circuit simulations are done with n = 70, nCE = 65, and del = 7 mm (i.e., half of the coin cell dimension).
It comes out that distortions then arise because of the nonzero value of the normalized in-plane ionic currents  's. Simulations show that the in-plane current flows from the uncovered WE toward the edge of the CE, and therefore it substantially departs from zero near the edge of the CE at k = nCE. The in-plane current vanishes on within a short distance as we get in the area where the two electrodes face each other. Figure 7b represents several contributions of
  close to the CE edge. It shows that
  is tiny compared with
  , and therefore
  is well approximated by summing only a few contributions in the CE edge area (e.g., four in Figure 7b),
![Equation ([15])](https://content.cld.iop.org/journals/1945-7111/161/9/A1253/revision1/jes_161_9_A1253eqn15.jpg)
 is positivec and made up of a positive high-frequency resistance, as well as a distorted arc covering the frequency range of both the WE and the CE. This simple analysis reveals that the so-called "inductive" loop in the WE spectrum (vs. RE) arises from the subtraction of
  from the ideal WE impedance. Therefore, the term "negative-impedance" contribution should be preferred over "inductive" contribution.
By analogy with the equivalent-circuit model, the same analysis can be carried out on the actual cell geometry. In Figure 8a, impedances of both the WE and the CE measured vs. RE and REideal are represented by means of arrows, just like we did in the equivalent circuit of Figure 3.
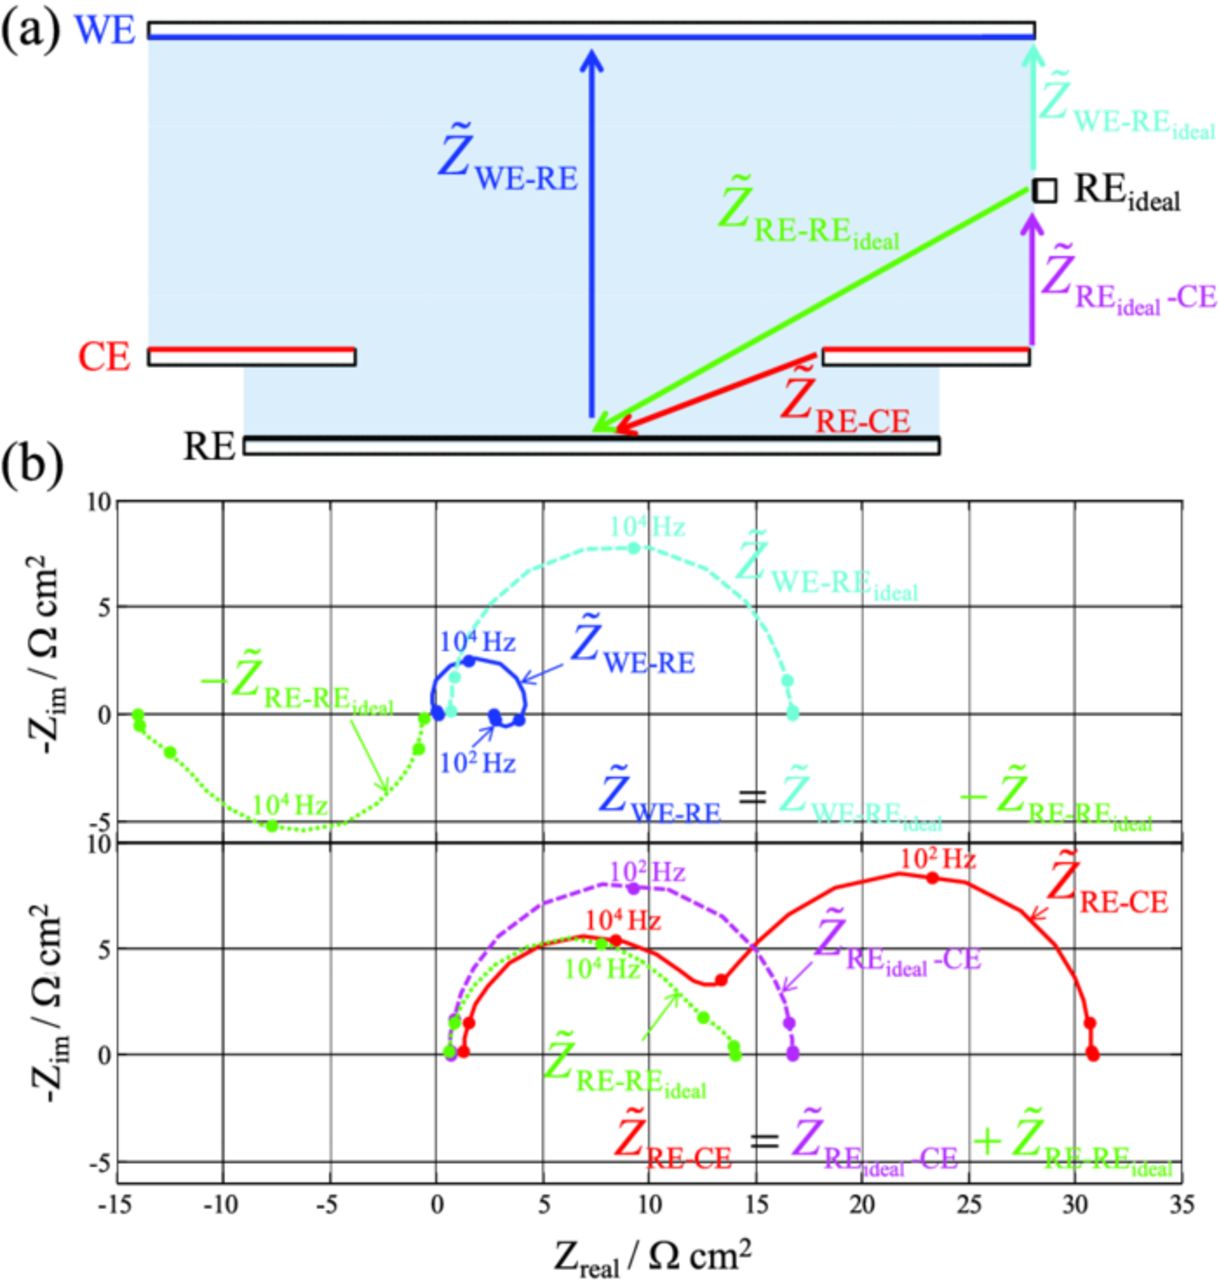
Figure 8. (a) Schematics of the cell setup #1 where the various impedance contributions are represented in a similar fashion as in the equivalent circuit of Figure 3 and (b) Nyquist plot of the various contributions simulated with the FEM model.
The impedance of RE, measured vs. REideal, and denoted  , is non zero, as it is seen in Figure 8b where it is represented in green. WE/RE impedance is obtained by subtracting
  from WE/REideal impedance, whereas that of CE is obtained by adding
  to CE-REideal impedance. Similar to the equivalent circuit, the
  contribution arises from the radial ionic current flowing from the WE area uncovered with the CE toward the edges of the hole in the CE, as seen in Figure 8a in which ionic currents are represented as arrows.
Now that the origin of the distortions has been identified, a parameter-sensitivity is performed with the FEM model in order to figure out ways to alleviate them, or in other words, to bring  as close to zero as possible through minimizing radial ionic currents in areas where mismatches in alignment between the WE and CE are experienced.
Figure 9 represents simulations of the impedance spectra for different values of the electrolyte conductivity. As the conductivity increases, WE/RE and CE/RE spectra look more and more like those expected from theory (i.e., WE/REideal and CE/REideal, respectively, Figure 5a); The high-frequency semi-circle of the CE/RE spectrum progressively vanishes along with an increase of the WE/RE impedance. Although the "negative-impedance" loop disappears totally at infinite electrolyte conductivity (there is no influence of the RE position anymore in this condition), it increases in a nearly similar fashion as the main contribution at lower conductivity values.
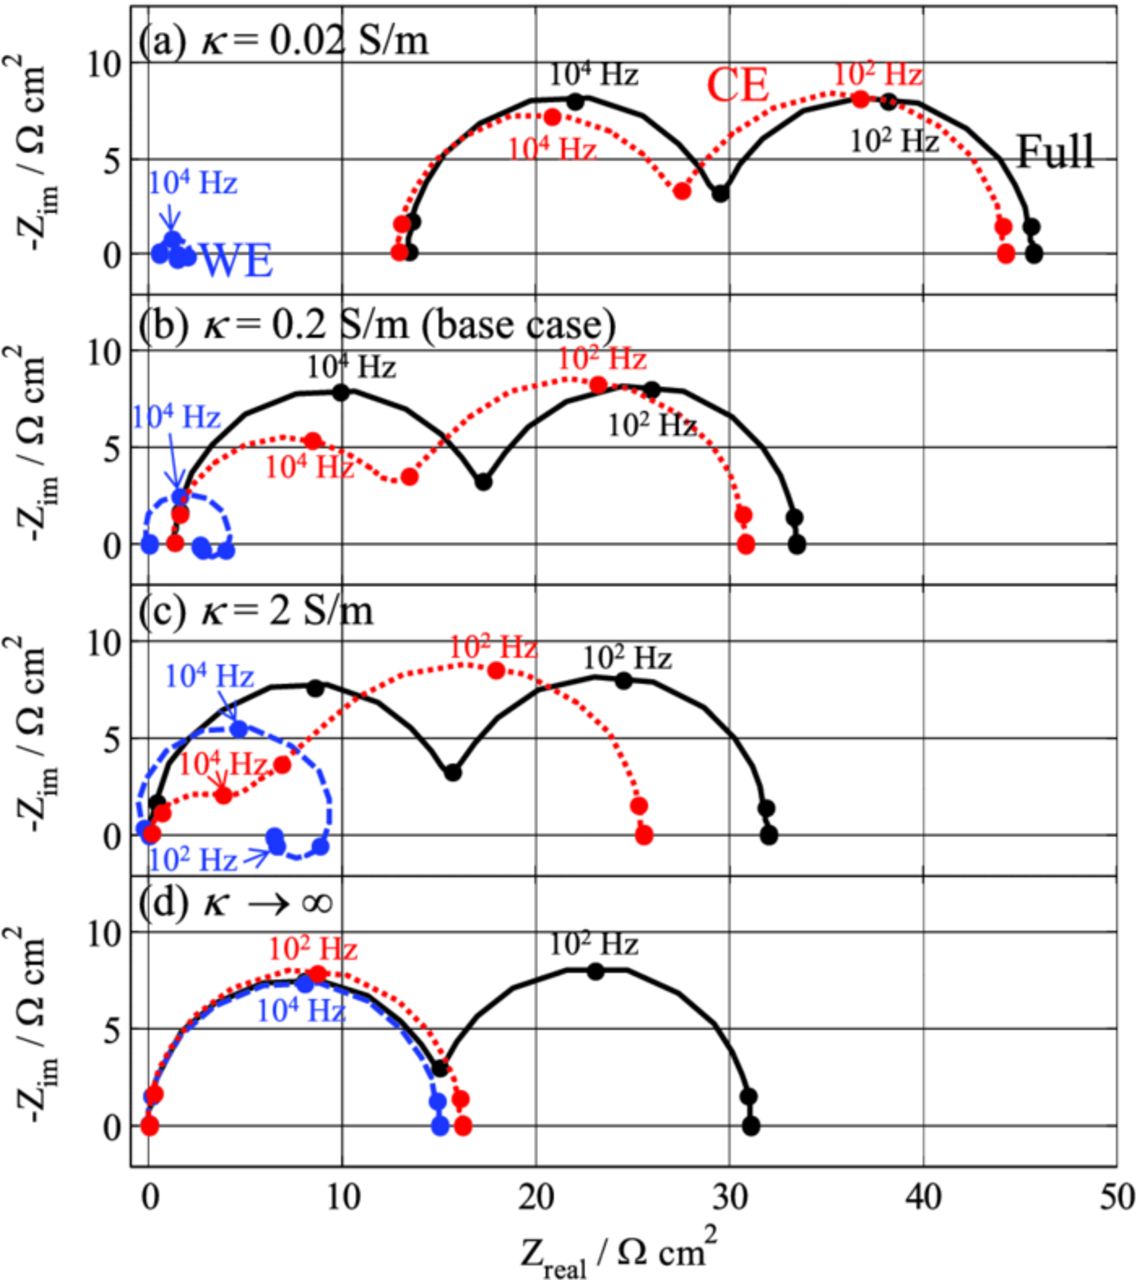
Figure 9. Influence of the electrolyte conductivity on the impedance spectra simulated with the FEM model (Setup #1).
Conclusions are nearly similar when the separator thickness increases instead of the conductivity (Figure 10). In the range of values used for the simulations of Figure 10, the main effect of increasing the thickness is an increase of the WE/RE impedance accompanied by a decrease of the high-frequency loop of the CE/RE spectrum. The "negative-impedance" contribution of the WE/RE signal increases with the separator thickness. The high-frequency intercept of the WE/RE spectrum increases faster than that of the CE/RE spectrum with the separator thickness, and as a consequence, it becomes larger than that of the CE/RE for a 1 mm-thick separator. One should note that there is no ideal separator thickness that allows the WE/RE and CE/RE contributions to approach those of WE/REideal and CE/REideal, respectively. This is something that has been tried with REs placed to the side of cells where the WE overlaps the CE but to no avail.
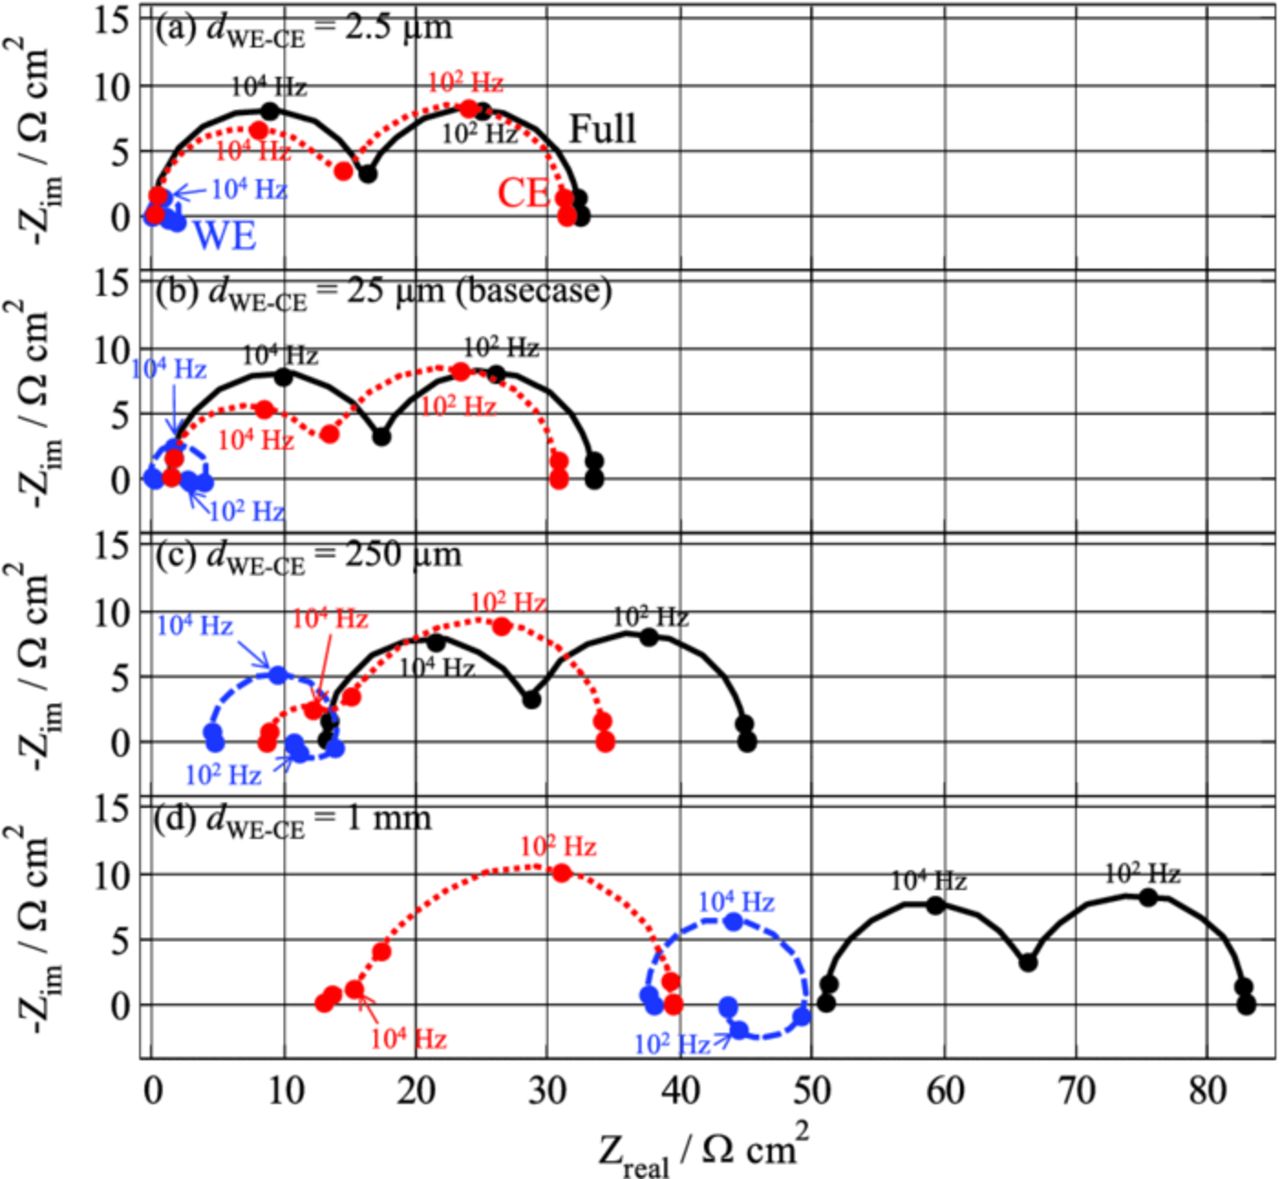
Figure 10. Influence of the separator thickness between the WE and the CE on the impedance spectra simulated with the FEM model (Setup #1).
The influence of the size of the hole in the CE is also examined (Figure 11). Unlike the previous two parameters, the decrease of the hole size has a two-fold effect; in addition to a decrease of the high-frequency semi-circle of the CE/RE spectrum and an increase of the WE/RE impedance, the "negative-impedance" loop of the WE/RE spectrum progressively vanishes as well. The consequence is that spectra simulated for a very small hole size (e.g., 1μm, Figure 11d) exhibit almost no distortion. The only slight difference between these spectra and those measured vs. REideal (not shown here) is the high-frequency intercept, which is almost zero for the CE/RE spectrum, and which is in line with a very small ohmic drop between the RE and the CE. This is the opposite of the basecase situation (hole size of 1 mm) where the small ohmic drop is between the RE and the WE, as noted previously.

Figure 11. Influence of the size of the hole in the CE on the impedance spectra simulated with the FEM model (Setup #1).
At this point, let us summarize the main results of the simulations based on setup #1. An increase of the electrolyte conductivity or an increase of the separator thickness or both are shown to partially correct for the lower-than-expected WE/RE impedance and larger-than-expected CE/RE impedance observed for the base-case cell setup (Figure 5b). Similarly, an increase of the charge-transfer resistance of the electrodes would yield the same effect (results not shown here). However, these findings are of little practicality; usually, electrolyte conductivity and electrode resistances are not adjustable and low values of separator thickness are preferred, especially when the rate capability of the electrodes is being evaluated as well. Furthermore, simulation results show that these parameters have little or no effect on the "negative-impedance" contribution of the WE/RE spectrum. A decrease of the hole size in the CE would be more interesting in order to minimize distortion of the impedance spectra, but unfortunately, punching a hole of a micron size or less in an electrode is impractical, and, even if doable, there are additional problems, such as ensuring a good ionic contact between the WE/RE and the CE/RE through such a small hole.
The sensitivity of other parameters was studied with setup #1, such as the size of the RE and its distance from the back of the CE. Decreasing the size of the RE to a value lower than the hole size decreases the WE/RE impedance and increases the high-frequency semi-circle in the CE/RE spectrum. These larger distortions result from the larger distance created between the RE and the CE compared to the base case, whereas that between the WE and the RE remains unchanged. Changing the distance of the RE from the back of the CE, however, has little to no effect on the simulations, because both CE-RE and WE-RE distances are changed simultaneously.
A way around the distortion problem is to punch a hole in the WE and align it with that in the CE. Such a cell design is illustrated in Figure 2b (Setup #2). Simulation results using this setup are represented in Figure 12 for different values of the hole size (same size in both the WE and CE). The presence of a hole in the WE nearly completely suppresses the distortion effects described above for setup #1. As seen in Figure 6b, the electrolyte potential near the RE is similar to being placed in between the WE and CE, just like for REideal. Furthermore, no in-plane current is observed. Hence,  approaches zero. Unlike for the case of setup #1, the hole size has little effect on the simulated spectra; the main effect is a decrease of the high-frequency intercept of the CE/RE spectrum along with an increase of that of the WE/RE spectrum upon decreasing the hole size. The reason behind that is the same as already discussed in Figure 11 for setup #1.

Figure 12. Influence of the size of the hole in the CE and WE on the impedance spectra simulated with the FEM model (Setup #2). The hole has the same size in both electrodes.
Unfortunately, a perfect alignment of the two holes within the size of the separator (<25 μm) might be experimentally tricky, and therefore it is of interest to look at how a misalignment between the two holes impacts the impedance measurements. Figure 13 represents simulated spectra for different values of hole shifts, ranging from 0 to 500 μm (the edge of a hole aligns with the center of the other at this latter value). The larger the shift between the two holes, the larger is the distortion of the impedance spectra. Again, the CE/RE spectrum is larger-than-expected and contains a parasitic semi-circle which is a distortion from the WE. Conversely, the WE/RE spectrum is lower-than-expected, with a distortion from the CE that is not necessarily showing up as a "negative-impedance" contribution (e.g., Figure 13c), unlike in most of the previous simulations based on setup #1. As pointed out in Ref. 12 where simulations are done on a modified Swagelok cell with coaxial REs, this shift between the two holes should be less than the separator thickness (typically ca. 25 μm) for distortion effects to be acceptable. One should keep in mind, though, that achieving such a good alignment between the two holes remains an experimental challenge.
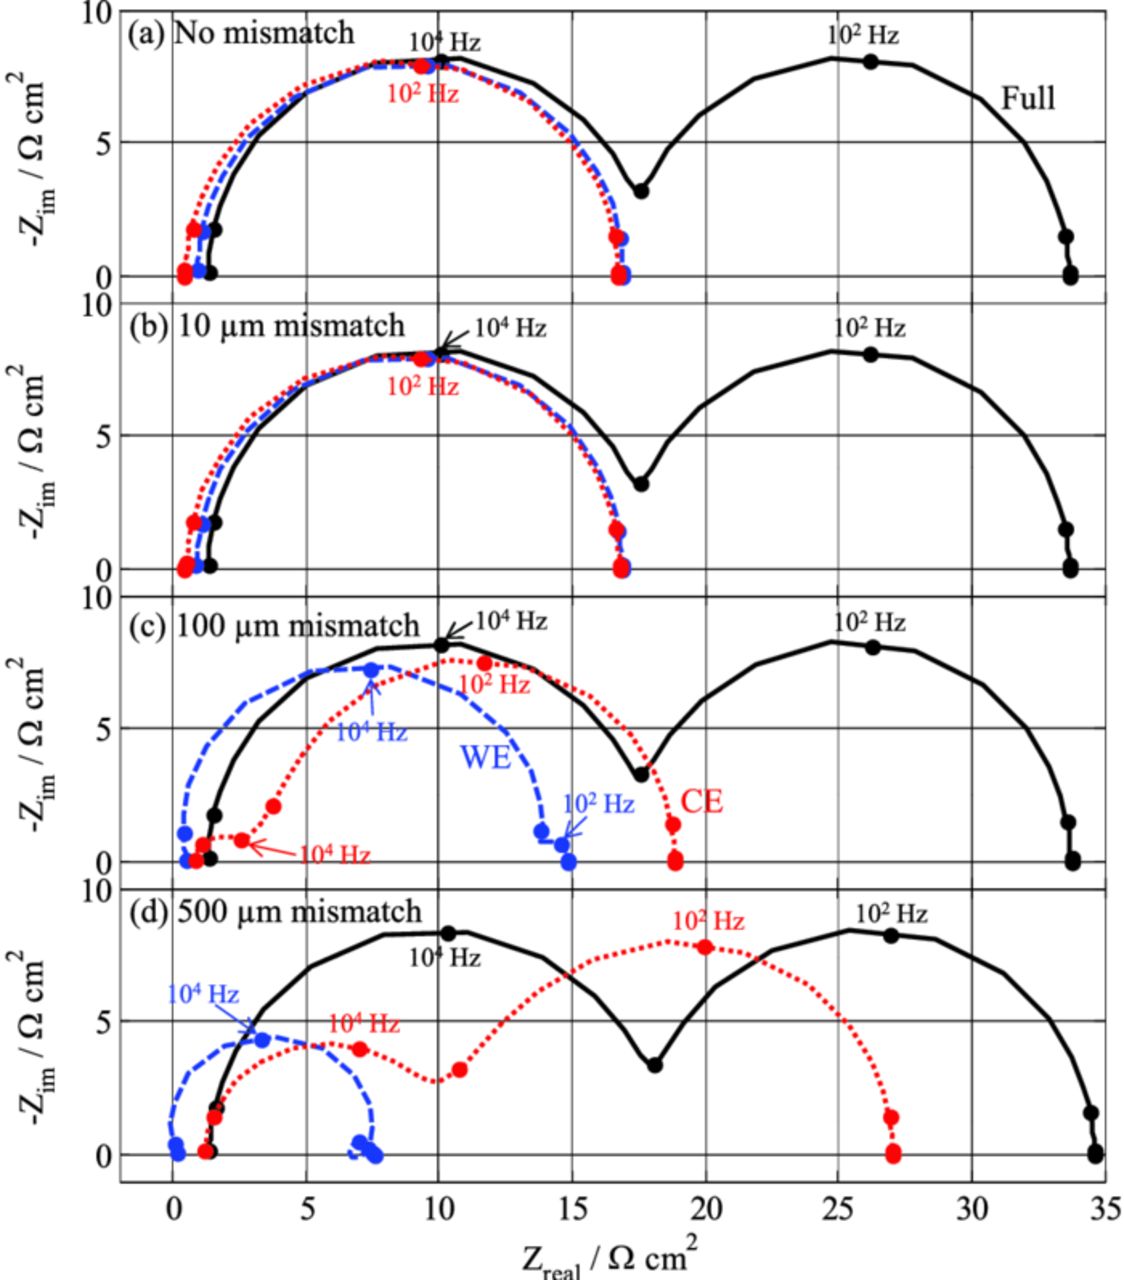
Figure 13. Influence of a mismatch between the holes in the WE and the CE on the impedance spectra simulated with the FEM model (Setup #2).
Conclusions
This paper reports on finite-element and equivalent-circuit simulations, which are carried out in order to understand distortions in impedance spectra that may arise from the RE positioning in a three-electrode cell. The finite-element model of current and potential distributions is based on flat electrodes and neglecting concentration gradients (i.e., secondary current distribution), but it is still able to capture the main distortion effects encountered in measuring impedance spectra of a Li-ion battery. Simulations show that a RE positioned across from a partially uncovered WE (i.e., where there is a hole in the CE) results in distorted impedance spectra, with the overall WE/RE impedance being lower than expected and the overall CE/RE impedance being larger than expected when compared to results obtained for a reference located between the WE and CE. In general, the summation of impedance of the WE/RE and CE/RE is equivalent to that obtained from the WE/CE cell; however, the CE/RE will show a larger than expected impedance contribution from the CE and an additional contribution from the WE. Complementary to that, the WE/RE shows a smaller than expected contribution from the WE and a negative "inductive effect" from the CE. An analysis of the simulation reveals that these distortions arise from a positive impedance contribution of the RE (vs. an ideally-located RE, e.g., a microRE positioned in between the WE and CE) that adds to the ideal CE signal and subtracts from the ideal WE signal. This impedance contribution is the result of a radial ionic current flowing from the uncovered portion of the WE toward the edges of the hole in the CE, as demonstrated by equivalent-circuit simulations. A parameter-sensitivity study showed that the distortions are minimized through an increase of the electrolyte conductivity, an increase of the separator thickness, or a decrease of the uncovered area of the WE by the CE. From this analysis, a new setup is proposed where a hole is punched in the center of both the WE and CE, which nearly prevents any distortion of the spectra providing that the holes are closely aligned within a distance equal to the thickness of the separator.
Acknowledgment
This work was partly supported by the Assistant Secretary for Energy Efficiency and Renewable Energy, Office of Vehicle Technologies of the U.S. Department of Energy under Contract No. DE-AC02-05CH11231, under the Batteries for Advanced Transportation Technologies (BATT) Program.
Footnotes
- c
By positive, it is meant positive real part and negative (capacitive) imaginary part. Conversely, by negative, it is meant negative real part and positive (inductive) imaginary part.