Abstract
Sulfonated diels alder poly(phenylene) (SDAPP), alternative aromatic hydrocarbon membranes for vanadium redox flow batteries (VRFBs) are characterized using electron paramagnetic resonance (EPR). Membranes soaked in sulfuric acid and vanadyl sulfate are analyzed to determine the membrane environment in which the vanadyl ion (VO2+) diffuses in the membranes. These results are compared to Nafion 117 membranes. In contrast to Nafion, the VO2+ in SDAPP membranes exists in two different environments. The results of analysis of rotational diffusion determined from fits the EPR spectral lineshapes in comparison with previously reported permeation studies and measurements of partitioning functions reported here suggest that the diffusion pathways in SDAPP are considerably different than in Nafion.
Export citation and abstract BibTeX RIS

This is an open access article distributed under the terms of the Creative Commons Attribution 4.0 License (CC BY, http://creativecommons.org/licenses/by/4.0/), which permits unrestricted reuse of the work in any medium, provided the original work is properly cited.
Vanadium redox flow battery (VRFB) technology has been investigated as an energy storage system for grid applications.1–3 While the battery architecture is generally similar to that of a proton exchange membrane fuel cell (PEMFC), the chemistry of the VRFB is substantially more complex. In particular, the presence of metal ions and sulfuric acid electrolyte adds additional levels of complexity due to the interactions of the electrolyte with all the material components. One major area of interest is the behavior of the vanadium ions and sulfuric acid in the ion exchange membrane that separates the negative and positive electrolytes. The membrane resistance and permeability have been shown to be responsible for many of the limits in battery operation.4 Also, the perfluourinated membranes currently used predominately in the battery systems are one of the most expensive components in the cell, second only to the cost of the vanadium itself. As such, significant effort has been given to developing membranes for VRFB applications.5
Earlier work on alternative membranes for PEMFC applications has resulted in a preponderance of publications detailing this chemistry and comparing the less expensive hydrocarbon membranes to perfluourinated membranes.6–7 While this information is useful for advancements in membranes for VRFB application, it does not obviate a thorough understanding of the effects of the additional components of the VRFB in order to tailor membrane characteristics to further benefit the needs of VRFB operation. These include minimizing vanadium ion accessibility to the membrane in order to minimize vanadium crossover, maintaining a high proton conductivity, and retaining these characteristics in the presence of the acidic electrolyte without degradation.
In the presence of concentrated electrolytes, such as the solutions of ∼5 M (or greater) acid and 1.5 M (or greater) vanadium used in the VRFB, the Donnan exclusion of anions from the membrane is overcome. Consequently, the membrane imbibes acid and vanadium in addition to water. This dramatically complicates the description of transport in the membrane. The previous understanding of transport within the pores of a membrane, developed over decades, must be augmented to take the more complicated pore fluid composition into account. Work in this area is in early stages.
Previously we described the uptake of metal ions, acid and water into membranes and the effects of the presence of these species on transport. We showed that the presence of acid at high concentration bathing the membrane dehydrates the membrane while also promoting uptake of acid into the membrane.8 The concentration of acid through which VO2+ diffuses is the primary controlling factor on its permeation rate through the membrane, with very large decreases in permeation rate associated with increasing acid concentration to the practical 5 M range.
These phenomena were first described for Nafion and other PFSA membranes. Aromatic ionomers are one option for replacing perfluorinated polymers due to their stability and tailor-able range of chemical structures.9 Sulfonated diels alder poly(phenylene) (SDAPP) membranes are aromatic cation exchange membranes that have been investigated previously for both VRFB8,10 and PEMFC11 applications. Membrane properties that have been shown to significantly affect transport in the membrane include the dehydrating effects of acid in the membrane as well as vanadium ion uptake and mobility in the membrane.12–15
The effects of the components of the VRFB environment (i.e. exposure to acid, ion and counter ions, and water) on SDAPP membranes include decreased conductivity, vanadium crossover and water uptake in higher acid concentrations as well as lower ion exchange capacities (IEC).16 Nonetheless, high performance of cells can be obtained with existing membranes. Here, we delve further into understanding the effects of acid and IEC on the vanadium environment in the SDAPP membrane to build a strong fundamental platform to aid further membrane development and modeling works.
More specifically, we use Electron Paramagnetic Resonance (EPR) studies of vanadium species to probe the local environment and local mobility of these species in membranes. Earlier EPR studies of vanadium uptake into Nafion membranes17–19 and characterizations of probe mobility in ionomer membranes20–21 have illustrated the suitability of this approach. Significant differences in behavior are observed for vanadium in the sulfonated Diels-Alder poly(phenylene) membranes studied in this work.
Experimental
Membrane preparation
SDAPP membranes with IEC of 1.4, 1.7, and 2.2 were used as received from Sandia National Laboratories. The synthesis and casting has been described previously.11 Nafion 117, purchased from Ion Power Inc., was pretreated by soaking in 3% H2O2 (Fisher Scientific), DI water, 1 mol·dm−3 H2SO4 (Alfa Aeser) and DI water for 1 hour at 85°C to remove residual organic and metallic impurity then stored in DI water until use.
Vanadyl ion (VO2+) uptake
Membrane samples were dried in a vacuum oven at 50°C overnight and weighed immediately after removal from the oven. Samples were then soaked in VOSO4 and H2SO4 solutions ranging from .1–1 M VO2+ and 0–5 M H2SO4 for 72 hours. Samples were then removed from the solutions, excess solution blotted off with a Chemwipe and weighed again to determine the mass of vanadium and solution uptake before being placed in solutions of 5% nitric acid for 72 hours to leach the VO2+ from the membranes. The concentration of VO2+ in the nitric acid was determined by electron paramagnetic resonance (EPR) (Magnettech, GMB) using a flow through capillary tubing that ensured solution running the length of the cavity to ensure no position change of the samples in the cavity. A series of standards were used to calculate the concentration measured with EPR. Partitioning was determined by calculating the molal concentration in the membrane from the mass of the solution and the vanadium uptake in comparison to the molal concentration outside of the membrane. Membranes were soaked in successive solutions until no VO2+ was detected in the acid solution. While small vanadium signals remained in the membranes after leaching, it is very difficult to compare the concentration in the membrane to what was collected in the solution or to quantify vanadium in the membrane because 1) the sizes of the membranes vary, which can be determined by mass, but 2) it is difficult to position the membrane in the same place in the cavity of the EPR which leads to changes in the signal intensity and 3) the membranes, lacking lossy acid solutions, in general, give a stronger signal than the solution in capillary. Ultimately, the difference between the signal seen in a membrane prior to leaching and after leaching is at least 2 orders of magnitude.
VO2+ in the membrane environment
SDAPP and Nafion membrane samples were cut into long strips and soaked in 1 M VOSO4 and 0–5 M H2SO4 for 72 hours. The samples were individually removed from solution, blotted dry and encased in Teflon tubing. Electron Paramagnetic resonance spectra were collected on a Bruker EMX X-band spectrometer. The spherical cavity geometry, not available in the Magnettech spectrometer, facilitates data collection of the hydrated SDAPP, which curled into a ball upon removal from solution. The resulting spectra were fit using the easyspin program written for use with MATLAB software, maintained by Stefan Stoll.22 The chili algorithm was used for the slow motion regime of the membrane environment and spectra were fit using the Nelder/Mead simplex method scaled with a quadratic baseline. The fits were confirmed with The NLS EPRLF program of Freed and coworkers, which includes the nonsecular terms,23–24 allowing a better fit of the vanadium nuclear spin of I = 7/2, but not a significantly different one. To account for the strong vanadium nuclear spin of I = 7/2, the high-field approximation was avoided by setting pS = −1,0,1 in the easyspin basis set.
Results and Discussion
Figures 1 and 2 offer a qualitative comparison of the EPR spectra of vanadium imbibed in SDAPP and Nafion membranes. In general, the lineshape of the vanadium signal in Nafion shows a pattern consistent with a much higher rotational rate than SDAPP. However, in SDAPP at lower acid concentrations, there is an emergence of a second vanadium environment which is more like that seen in Nafion. The emergence of these peaks is indicated in the detailed plots in Figures 1D and 1E as well as compared to the Nafion lineshape via dashed lines in figures 1F and 1G. From all the lineshapes it is evident when the membranes are imbibed in VO2+ in water there is a significant amount of exchange broadening that results (red lines, Fig. 1). Broadening, which is concentration dependent, would be expected to be a result of some combination of high molar uptake or restricted volume within the membrane. It occurs when the species bearing unpaired electrons 'encounter' each other to a significant extent. Multiple components in ion exchanged hydrocarbon membranes have been observed previously and have been attributed to inhomogeneity in the pore/channel size as well as changes in the hydrophobicity of the hydrocarbon back-bone compared to perfluorinated membranes.21,25
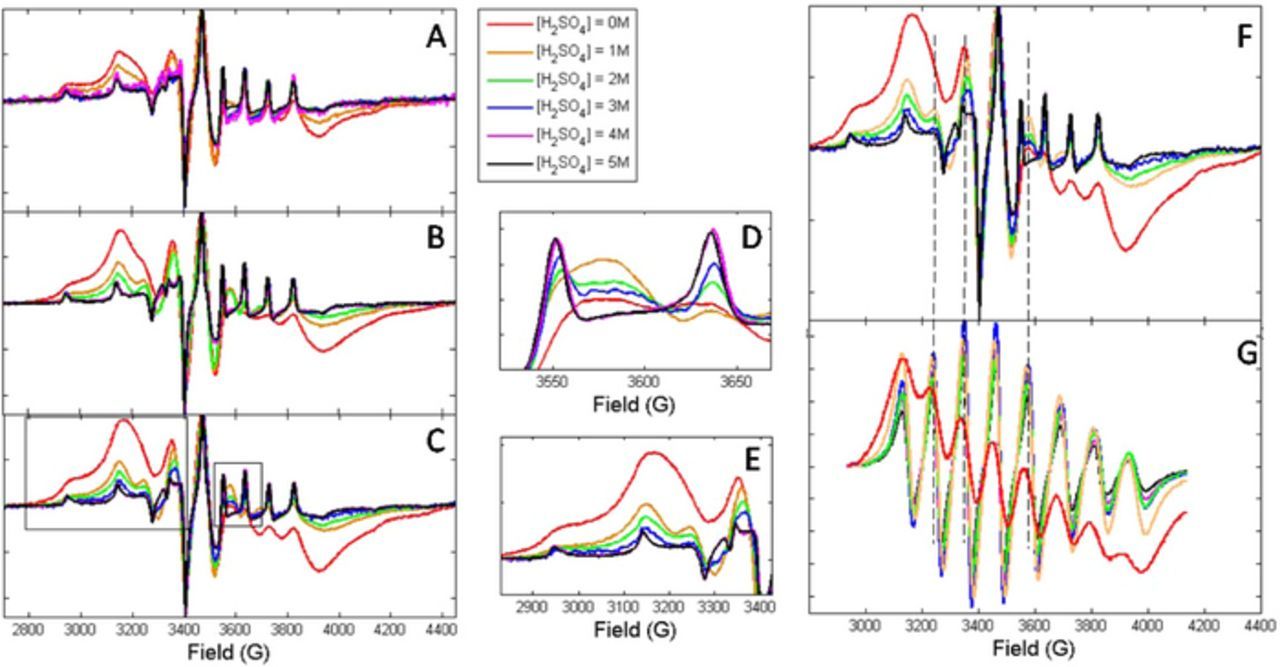
Figure 1. Effect of acid on spectral lineshape of membranes soaked in 0.1M VOSO4 and varying concentrations of sulfuric acid, see legend. A) SDAPP1.4, B) SDAPP 1.7, C) SDAPP 2.2, D-E) Details from SDAPP2.2, indicated in boxes in C. F) SDAPP2.2 for direct comparison to G) Nafion, dashed lines indicate evidence of Nafion-like component N in SDAPP spectra.

Figure 2. Comparison of the effect of acid on the spectral lineshape of the three SDAPP membranes.
When the lineshapes for each SDAPP membrane are compared side by side (Fig. 2) for the different soaking solution concentrations, it can be seen that in 5 M H2SO4 soaking solution, the VO2+ lineshape for each of the SDAPP membranes overlaps. As the acid concentration decreases, the signal lineshapes for VO2+ in SDAPP 1.7 and 2.2 diverge more significantly than SDAPP 1.4 from the signal collected from the membranes soaked in 5 M acid.
An example of the results from fitting with easyspin is shown in Figure 3 for the full data set taken of the SDAPP 2.2 membrane. At lower acid concentrations, the Nafion-like component merges in the fit as a second vanadium environment in the membrane. The two components will be labeled component S and component N for simplicity, with N as the Nafion-like component. In general, the correlation time for component N is lower than that of component S, indicating a higher rotational rate of the VO2+ ion that exists in the environment defined by component N.
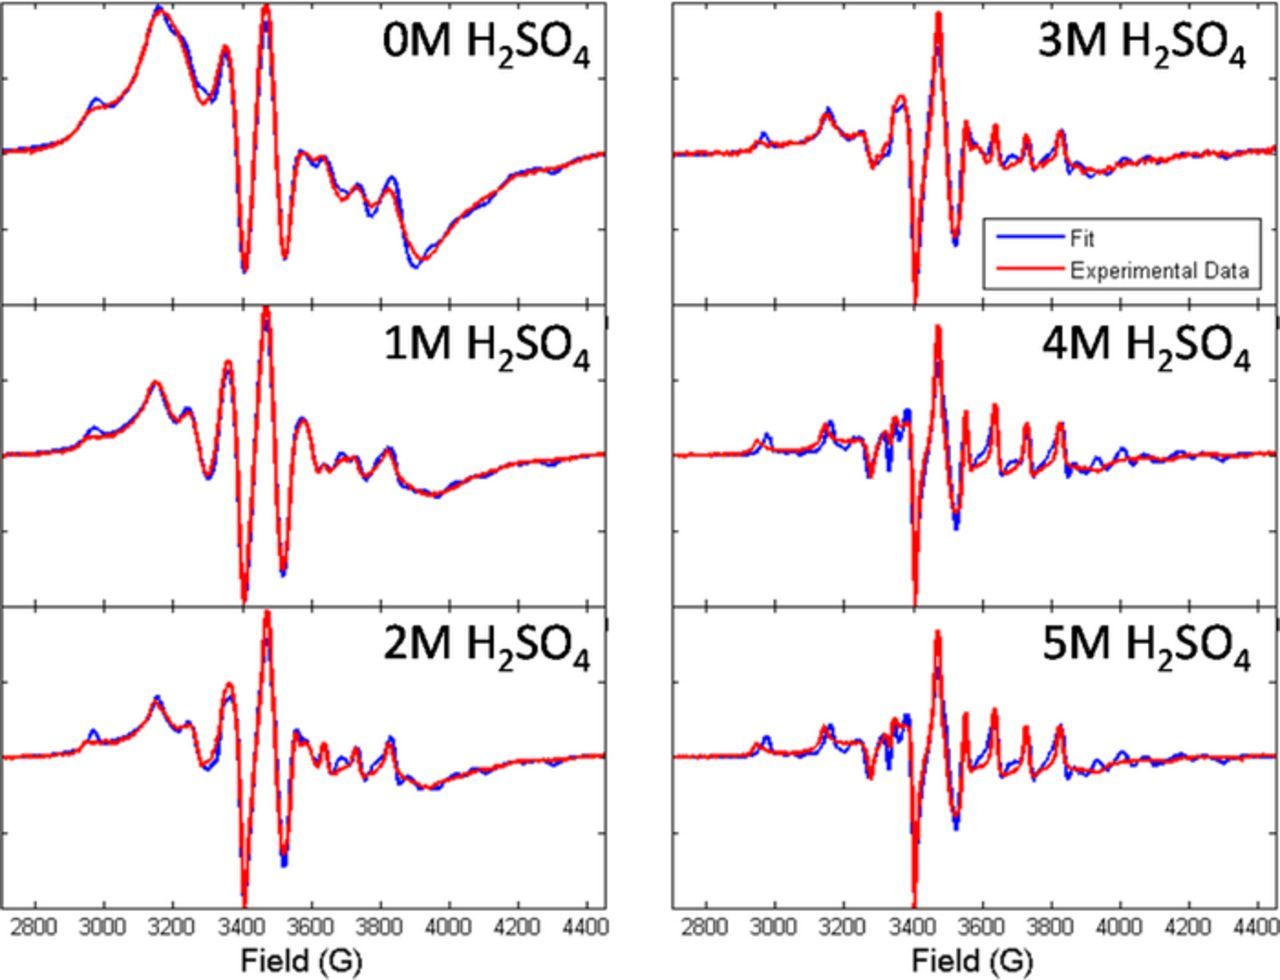
Figure 3. Examples of fits to the experimental data for the entire acid range of SDAPP 2.2 membrane.
The parameters that remained largely independent of acid concentration, as determined from the results of the best fits for all SDAPP and Nafion spectra including values for g⊥ and g∥ and A⊥ and A∥, are shown in Table I. The two individual components observed in SDAPP membranes are labeled N and S and the results of fitting parameters are shown separately. The second set of A values listed for component N are due to a shift in A observed in the membranes (both SDAPP and Nafion) soaked in 0M H2SO4. This shift to a smaller A-perpendicular occurs in the case in which lineshape broadening is significant, a point that will be discussed in more depth below. Otherwise, these parameters remained stable for the entire acid concentration regime.
Table I. Lineshape parameters independent of acid concentration. Components S and N indicated in parenthesis.
| g⊥ (S) | g∥ (S) | g⊥ (N) | g∥ (N) | τc, s (S) | A⊥, G (S) | A∥, G (S) | A⊥, G (N) | A∥, G (N) | |
|---|---|---|---|---|---|---|---|---|---|
| SDAPP1.4 | 1.996 | 1.945 | 1.995 | 1.947 | 3.27 × 10⁻⁸ | 77.9 | 188.0 | 77.4, 64.1 | 188.4, 209.6 |
| SDAPP1.7 | 1.997 | 1.946 | 1.997 | 1.946 | 3.20 × 10⁻⁸ | 78.2 | 186.9 | 77.3, 64.1 | 190.9, 216.7 |
| SDAPP2.2 | 1.997 | 1.947 | 1.995 | 1.945 | 2.94 × 10⁻⁸ | 78.5 | 186.5 | 77.4, 62.0 | 190.5, 218.1 |
| Nafion | - | - | 1.992 | 1.951 | - | - | - | 78.2, 57.9 | 188.1, 220.1 |
| Solution (see Fig. 6) | 1.991 | 1.943 | 5.1 × 10⁻¹¹ | 71.2, 68.8 | 198, 204 |
Other parameters that were used in the fitting included the correlation time, exchange broadening, and the weight of the two components. The correlation time for component S changed very little with increasing acid concentration in the soaking solution, and is also listed in Table I. Figures 4A–4C shows the changes of the remaining parameters with acid concentration. Figure 4A shows the weight percentage of component N present in the membrane sample. ('Weight' here refers to the weighted value of the fit results, not mass weight, but as EPR intensity is related to number of moles of probe, the value should reflect a percentage of VO2+ ions in each component.) At higher acid concentrations, the percentage of component N drops to nearly 0, disappearing completely at higher acid concentrations in the higher IEC membranes. Due to the low amount of component N, the other parameters plotted in Figs. 4B and 4C only are given for samples where the percentage is higher than 10% as fits with lower percentages of component N understandably often resulted in unrealistic and inconsistent parameters. Figures 5A–5C shows the vanadium uptake, solution uptake, and partition coefficient of vanadium in the membranes.
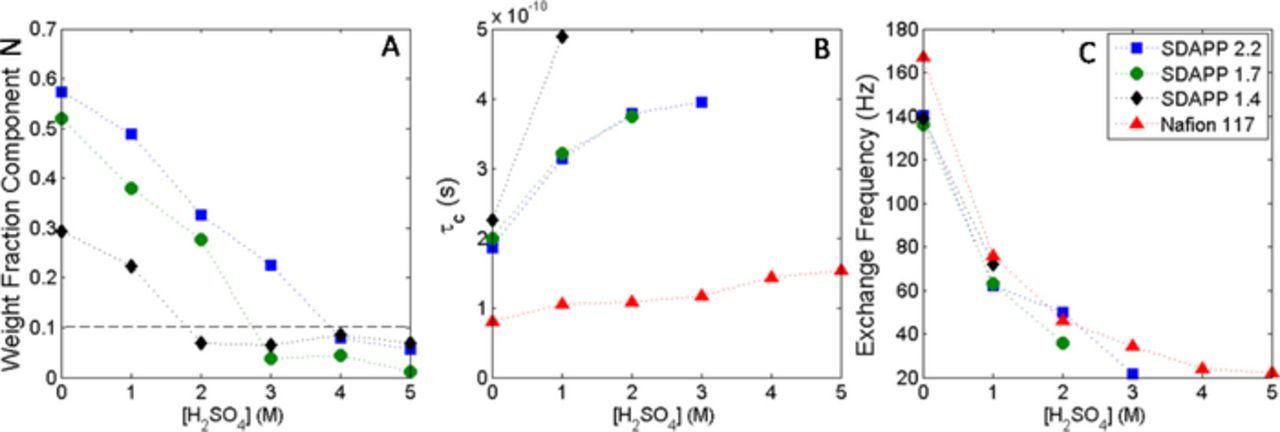
Figure 4. Parameters resulting from the fitting of the lineshape for the three SDAPP membranes and Nafion. A) Weight fraction of component N in SDAPP membranes. Dashed line indicates the region above which fits were more consistent. B) Correlation time and C) exchange frequency.
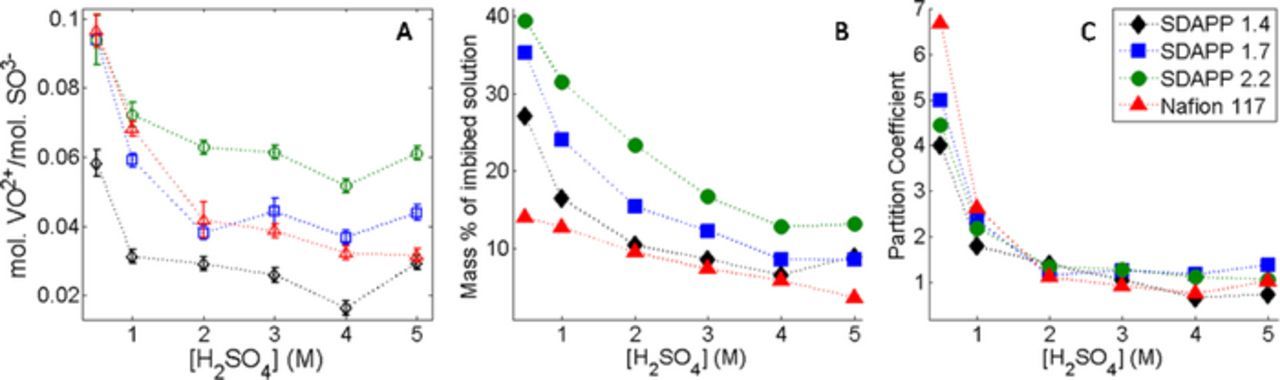
Figure 5. Results of uptake measurements for Nafion and SDAPP membranes. A) moles of VO2+ imbibed per mole of SO3− in membrane, B) total mass of imbibe solution (includes water and possible sulfuric acid and sulfate anions) C) Partitioning Coefficient determined from molal concentration.
The frequency of encounters allowing for spin exchange increases at lower acid concentrations, when the moles of vanadium increase in the membrane, Figure 5A. In general, spin exchange is concentration dependent thereby increasing with increased moles or decreased volume. The highest exchange rate corresponds to the N component of membranes soaked in vanadium and water. These samples also showed a systematic decrease in A⊥. Spin exchange has been shown to draw the outer EPR lines toward the center of the spectrum. In cases where this effect more prominent, reencounters are considered important, suggesting that in the confined volume of the membrane the VO2+ ions spend more time sharing a solvent cage.26–27 This is evident in both SDAPP and Nafion membranes. Figure 6 shows a comparison of the EPR spectra of .1, and 0.75 M VOSO4 in solution with the spectrum of the Nafion sample soaked in .1 M VOSO4 in water, with fits. Even a visual examination of the lineshapes show increased broadening in the membrane in comparison to even 0.75 M VOSO4 in solution. The exchange rates measured from the fits for .1 M, .25 M, .5 M and .75 M and in the membrane respectively are 0 Hz, 32 Hz, 39 Hz, 69 Hz and 166 Hz. Additionally, the A⊥ and A∥ values for the solution samples vary from 71.2–68.8 G and 198–204 G.
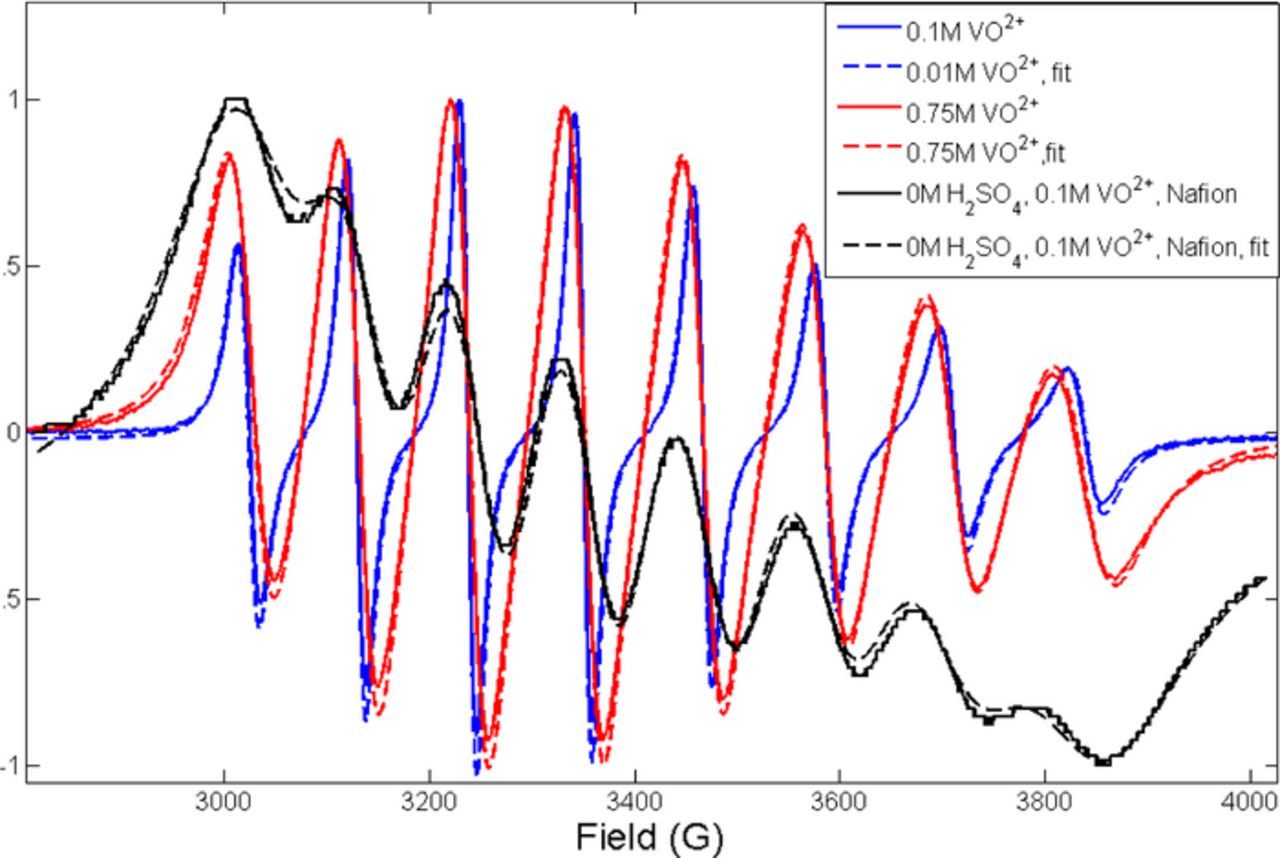
Figure 6. Comparison of VO2+ lineshape in solution and in Nafion. Exchange frequency increases with concentration, but is significantly higher in the membrane.
The values of τc (Fig. 4B) for component N decrease with decreasing acid concentration in the soaking solution. As the relationship between τc and the rotational rate, DR, is τc = 1/6DR the decreasing values indicate an increasing rotational rate of the VO2+ ions in a regime with increased solvent uptake, Figure 4B. Although component N is described as the 'Nafion like' component, the τc values are higher and the exchange frequency slightly lower than those measured in the Nafion membrane.
The rotational diffusion, DR, can be described by the Stokes-Einstein-Debye relation:
![Equation ([1])](https://content.cld.iop.org/journals/1945-7111/163/1/A5229/revision1/d0001.gif)
Where kB is Boltzmann's constant, T is temperature, η is viscosity and r is the hydrodynamic radius, which for the VO2+ ion is 3.1 Å28–29 based on an average of values reported in the literature. Meanwhile, translational diffusion is described by the Stokes-Einstein relation:
![Equation ([2])](https://content.cld.iop.org/journals/1945-7111/163/1/A5229/revision1/d0002.gif)
Such that the relationship between DR and DT when the Stokes-Einstein equations are valid is:
![Equation ([3])](https://content.cld.iop.org/journals/1945-7111/163/1/A5229/revision1/d0003.gif)
If we consider first the τc value determined from the fit of 0.1 M VO2+ ion, 5.01 × 10⁻¹¹ s, this corresponds to DR of 3.32 × 10⁹ s−1 and, using equation 3, a DT of 2.88 × 10⁻¹⁰ m2s−1. This value for DT is in agreement with those previously reported in the literature.30–31 Moving onto a comparison of rotational rates in the membranes, translational diffusion can be assessed from permeation rates for Nafion published previously and partition evaluated from uptake measurements in Fig. 4A. The DT can be determined from that information such that:
![Equation ([4])](https://content.cld.iop.org/journals/1945-7111/163/1/A5229/revision1/d0004.gif)
Where P is permeability and K is the partitioning coefficient that describes the concentration of VO2+ that absorbs into the membrane in comparison to the concentration of the soaking solutions. Because the density and volume of solution in the membrane is not directly known, but the mass of solution imbibed is, molal concentrations were used to assess the partitioning coefficient.
Table II shows a comparison of DT determined using equations 3 and 4 in Nafion. The DT values determined using Eq. 3 and DR from the spectral fits are higher than values assessed from the permeation and partitioning values using Eq. 4. There are a number of possible explanations for this discrepancy, which is highlighted by the % difference between the two calculations for the ease of the reader. The first is the possibility that the solvent cage around the VO2+ ion in the membrane shields the ion from the changes in viscosity and diffusion. This departure from Stokes-Einstein behavior has been observed in measurements of tracer diffusion in colloid suspensions.32,33 However the departure from SE in rod suspensions of high viscosity was observed in both the translational and the rotational diffusion, though the effect is generally stronger in the measurement of rotational diffusion. The difference between a colloidal solution and the solution in the membrane is that the colloidal particles are included in determining the viscosity for the SE calculation. In the membrane, the diffuser rotates and translates through solution filled pores and it is the viscosity of the solution in the pores that effects diffusion.
Table II. Diffusion coefficients for Nafion membrane determined from the rotational diffusion via the Stokes-Einstein equation (Eq. 3) and from the permeability and partitioning coefficients.
| [H2SO4], M | Partition Coefficient | Permeability m2s−1 | DT from permeability14 Eq. 4, m2s−1 | DT from DR, Eq. 3, m2s−1 | %Difference |
|---|---|---|---|---|---|
| 0 | 26.6 | 1.3 × 10⁻⁹ | 4.9 × 10⁻¹¹ | 1.4 × 10⁻¹⁰ | 65.0% |
| 0.5 | 6.4 | 1.5 × 10⁻¹⁰ | 2.4 × 10⁻¹¹ | 1.2 × 10⁻¹⁰ | 80.0% |
| 1 | 3.2 | 4.6 × 10⁻¹¹ | 1.5 × 10⁻¹¹ | 1.1 × 10⁻¹⁰ | 86.4% |
| 2 | 1.5 | 2.1 × 10⁻¹¹ | 1.4 × 10⁻¹¹ | 1.1 × 10⁻¹⁰ | 87.3% |
| 3 | 1.2 | 1.1 × 10⁻¹¹ | 8.9 × 10⁻¹² | 9.6 × 10⁻¹¹ | 90.7% |
| 4 | 0.9 | 5.1 × 10⁻¹² | 5.7 × 10⁻¹² | 7.9 × 10⁻¹¹ | 92.8% |
| 5 | 0.8 | 1.0 × 10⁻¹² | 1.5 × 10⁻¹² | 7.3 × 10⁻¹¹ | 97.9% |
With two motion regimes, diffusion in SDAPP membranes is less straight forward, as seen in Table III. As such, an approximation was made using the weight of the two components from the fit to establish an average value for DT from DR of the VO2+ ions imbibed in the SDAPP membranes. A reduced rotational mobility is observed in component S of SDAPP in comparison to the rotational mobility in Nafion. Overall, DT values determined from permeability measurements reported previously8 trend higher in Nafion than SDAPP membranes.
Table III. Diffusion Coefficients for SDAPP membranes determined from the rotational diffusion via Stokes-Einstein equation (Eq. 3) and from the permeability and partitioning coefficients shown in Figure 5.
| [H2SO4], M | DT from Permeability, m2s−1 Eq. 48 | DT from DR, m2s−1, Eq. 3 | %Difference |
|---|---|---|---|
| SDAPP1.4 | |||
| 0.5 | 1.7 × 10⁻¹² | 1.1 × 10⁻¹¹ | 84.5% |
| 1 | 1.6 × 10⁻¹² | 6.8 × 10⁻¹² | 76.5% |
| 2 | 6.7 × 10⁻¹³ | 1.3 × 10⁻¹² | 48.6% |
| 3 | 2.3 × 10⁻¹³ | 7.3 × 10⁻¹³ | 68.5% |
| 4 | 5.4 × 10⁻¹⁴ | 6.2 × 10⁻¹³ | 91.3% |
| 5 | 3.8 × 10⁻¹⁴ | 5.8 × 10⁻¹³ | 93.4% |
| SDAPP1.7 | |||
| 0.5 | 1.3 × 10⁻¹¹ | 2.9 × 10⁻¹¹ | 55.2% |
| 1 | 1.4 × 10⁻¹¹ | 1.7 × 10⁻¹¹ | 17.6% |
| 2 | 5.4 × 10⁻¹² | 1.1 × 10⁻¹¹ | 50.9% |
| 3 | 1.5 × 10⁻¹² | 1.9 × 10⁻¹² | 21.1% |
| 4 | 6.1 × 10⁻¹³ | 8.6 × 10⁻¹³ | 29.1% |
| 5 | 1.9 × 10⁻¹³ | 7.4 × 10⁻¹³ | 74.3% |
| SDAPP2.2 | |||
| 0.5 | 1.5 × 10⁻¹¹ | 3.3 × 10⁻¹¹ | 54.5% |
| 1 | 1.1 × 10⁻¹¹ | 2.3 × 10⁻¹¹ | 52.2% |
| 2 | 6.1 × 10⁻¹² | 1.3 × 10⁻¹¹ | 53.1% |
| 3 | 3.5 × 10⁻¹² | 8.7 × 10⁻¹² | 59.8% |
| 4 | 2.2 × 10⁻¹² | 2.9 × 10⁻¹² | 31.8% |
| 5 | 6.4 × 10⁻¹³ | 1.2 × 10⁻¹² | 46.7% |
Another possible explanation for the discrepancy between the DT determined from permeability and DT from DR is that permeability is measured only accounting for the thickness of the membrane, which may not adequately represent the path length of the VO2+ diffusion. This extended path length through the membrane can be described as the tortuosity factor, which lowers the effective diffusivity through the membrane. In a hydrated Nafion membrane, tortuosity values ranging from 2–3 have been reported, and increase by an order of magnitude at very low membrane hydration levels.34,35 By defining DT from permeability as effective diffusion, Deff and designating DT from DR as the actual diffusion, Do we can determine tortuosity values by back calculating permeability using a correction for the diffusion path length:36
![Equation ([5])](https://content.cld.iop.org/journals/1945-7111/163/1/A5229/revision1/d0005.gif)
Where l is the membrane thickness originally used in the permeability calculation and L is the diffusion path length. The results for all membranes are shown in Table IV. The tortuosity factor approaches literature values for water diffusion in hydrated Nafion as acid concentration in the soaking solutions decreases. At the highest acid concentrations, the tortuosity is similar to values reported for extremely dehydrated Nafion (λ < 4).34 Exposure to sulfuric acid has been shown to dehydrate the membrane as well as incorporate sulfuric acid and sulfate ions into the pores. Tortuosity values are reported in Table IV.
Table IV. Tortuosity values for Nafion and SDAPP membranes.
| Tortuosity | ||||
|---|---|---|---|---|
| [H2SO4], M | Nafion | SDAPP1.4 | SDAPP1.7 | SDAPP2.2 |
| 0 | 2.9 | - | - | - |
| 0.5 | 5.1 | 6.0 | 2.2 | 2.3 |
| 1 | 7.3 | 4.3 | 1.2 | 2.0 |
| 2 | 7.5 | 2.2 | 2.0 | 2.1 |
| 3 | 10.7 | 3.1 | 1.3 | 2.5 |
| 4 | 13.9 | 11.6 | 1.4 | 1.3 |
| 5 | 48.7 | 15.4 | 3.8 | 1.8 |
DT was determined from the average DR of the components present in SDAPP membranes. The resultant average tortuosity values are lower in SDAPP than in Nafion. SDAPP 1.7 and 2.2 show very little change in diffusion path length with acid concentration. At higher acid concentrations, the VO2+ ions with slow rotational mobility dominated the spectra, leading to the lower values of DT from DR that were not seen in Nafion. SDAPP 1.4 tends toward higher tortuosity values overall and it is probable that the low ion exchange, in general being an outlier from the other two membranes, is below or near the percolation threshold leading to lower diffusion, permeability, uptake and conductivity. On a qualitative level, these results suggest a different mechanism of VO2+ transport in SDAPP membranes and Nafion and a varying effect of acid exposure to the membranes. Our results reflect the presence of two distinct environments for the vanadium species in SDAPP membranes, with radically different characteristic mobility. This discussion points to the interpretation that the rotational diffusion constants are associated with local motions of the ion, in contrast to those derived from permeation. We interpret tortuosity effects to derive primarily from the polymer morphology. This then implies that the major reason for lower overall permeation of vanadium species through the hydrocarbon membrane is the stronger interactions of the ions with their local polymer environment. This points, generally, to the possibility of manipulating polymer chemistry (though not necessarily morphology) to affect cross-over.
Conclusions
Unlike in Nafion membranes, VO2+ ion exists in multiple environments in SDAPP membranes. As such, the prevalence of a component characterized by lower rotational mobility is partly responsible for lower permeability of VO2+ in SDAPP membranes. Assessment of tortuosity of the diffusion path in the membranes suggests a different diffusion mechanism in the hydrocarbon membranes. It also suggests that local interactions with the matrix are behind the lower overall permeability of vanadium ions through the hydrocarbon polymer. To further investigate this, future work will focus on increasing the thickness of the membrane in permeability measurements to fully analyze possible nonlinearities in dependence of permeability on thickness.
Acknowledgments
We gratefully acknowledge the support of this work by the NSF-funded TN-SCORE program, NSF EPS-1004083, under Thrust 2. This work was also supported in part by the U.S. Department of Energy, Office of Electricity Delivery and Energy Reliability (Dr. Imre Gyuk) and by the Office of Naval Research. We would also like to acknowledge the Bioanalytical Resources Facility at the University of Tennessee for use of the Bruker EPR instrument.