Abstract
Membrane electrode assemblies were degraded by voltage cycling in hydrogen/air atmosphere. The impact of degradation on fuel cell performance was measured by various electrochemical characterization techniques. Loss of electrochemically active surface area was correlated to kinetic voltage losses at low current density as well as losses at high current density due to oxygen transport limitations. It was found that the oxygen transport resistance scales proportionally to the inverse of normalized platinum surface area. The change in the catalyst layer structural properties due to voltage cycling was visualized by electron microscopy. A new method of calculating changes in platinum loading of degraded samples by transmission electron microscopy is presented and shows redistribution of platinum in the catalyst layer due to platinum dissolution.
Export citation and abstract BibTeX RIS

This is an open access article distributed under the terms of the Creative Commons Attribution Non-Commercial No Derivatives 4.0 License (CC BY-NC-ND, http://creativecommons.org/licenses/by-nc-nd/4.0/), which permits non-commercial reuse, distribution, and reproduction in any medium, provided the original work is not changed in any way and is properly cited. For permission for commercial reuse, please email: oa@electrochem.org.
On the way to commercialization of low temperature proton exchange membrane (PEM) fuel cells in automotive applications, fuel cell durability and cost are two major challenges.1 While a reduction of the precious metal content in membrane electrode assemblies (MEA) has a direct cost benefit, it also affects the performance and long-term stability of the electrode. During operation, the platinum (Pt) catalyst suffers from loss of electrochemically active surface area (ECSA) due to load cycling, which lowers the fuel cell performance.2 Changes in the electrode potential due to load cycling lead to dissolution of Pt and particle growth due to subsequent redeposition of mobile Pt species on larger particles, often referred to as Ostwald ripening.3–5 The conditions that favor Pt dissolution have been extensively studied in recent years.6–13
The impact of loss of normalized Pt surface area, i.e. the product of ECSA and Pt loading which is also called roughness factor (in cm²Pt/cm²geo), on the activation overpotential either due to a reduction in Pt loading or ECSA loss is well understood.14 The consequences of a reduction in Pt surface area on voltage loss at high current density due to an increase in oxygen transport resistance have been subject to research in recent years.15–19 Greszler et al.16 investigated oxygen transport resistance in electrodes with different Pt loadings. They found a linear relation between total oxygen transport and the inverse of the electrode roughness factor and hypothesized that the cause of this relation could be interfacial transport of oxygen through the ionomer film covering Pt particles, as discussed in the literature.20,21 Similar measurements in low loaded electrodes confirmed this finding.17 The proposed inverse relation between roughness factor and the interfacial oxygen transport resistance only holds in the limit of small resistance to through-plane oxygen diffusion, which is usually not the case for representative electrodes. This limit can be circumvented by investigating electrodes with a constant thickness and varying roughness factor, as is the case in diluted electrodes. However, the same can also be achieved by degrading the Pt catalyst through voltage cycling, which leads to Pt particle growth and consequently a change in roughness factor while the electrode thickness stays constant. As Greszler et al. note, comparing polarization curves of electrodes with reduced Pt loading and reduced Pt surface area by voltage cycling, "it is possible that these performance losses are both caused by the local platinum surface resistance which becomes more significant as the local flux increases due to reduced available platinum surface area".16 This effect was indeed observed by Jomori et al.18 in MEAs aged by voltage cycling between 0.7 and 0.9 V.
The aim of this study is to visualize the changes in the electrode due to catalyst degradation and correlate them to the electrochemically measured parameters and fuel cell performance. In the context of measuring the oxygen transport resistance at changing roughness factor it is important to avoid carbon corrosion when aging the MEA by voltage cycling, as this would lead to cathode thinning and a change in the pore structure of the electrode.22,23 Therefore aged MEAs were subjected to a detailed microscopic post mortem analysis in order to confirm which failure mechanisms were dominant in the MEA. Information about the layer thickness was extracted from scanning electron microscopy (SEM), while Pt particle growth was verified by transmission electron microscopy (TEM). Electrode porosity was monitored by 3D reconstruction of images from focused ion beam scanning electron microscopy (FIB-SEM) and Pt distribution in the cathode was measured using scanning transmission electrode microscopy with energy dispersive X-ray spectroscopy (STEM-EDX).
Experimental
Electrochemical
Commercial membrane electrode assemblies (MEA) with an active area of 45 cm² and a Pt catalyst on a high surface area support were used. The Pt loading was 0.25 mg/cm² on the cathode and 0.10 mg/cm² on the anode. The membrane had a thickness of 15 μm with a reinforcement layer. Sigracet SGL 25BIH gas diffusion layers (GDL) were used on both anode and cathode.
The cell was operated at differential flow conditions, i.e. at constant flow and high stoichiometries to minimize along-the-channel variations of the reactant concentrations and create as homogeneous reaction conditions as possible over the entire active area. A parallel channel flow field was used in all tests.
In order to degrade the samples, voltage cycling in hydrogen-air atmosphere was applied as an accelerated stress test (AST). As a baseline, a square wave cycle between 0.6 V and open circuit voltage, which was around 0.95 V, with a dwell time of 2 seconds at each potential was used. During voltage cycling the cell was operated at 100% relative humidity (RH), 2.5 bar/2.7 bar absolute pressure on cathode/anode with constant gas flow of 11.3 slpm air/4.5 slpm H2 on the cathode/anode. As the tested samples were part of a larger study on Pt dissolution, a variation of the baseline square wave potential cycle was applied to some samples; an overview is given in Table I. Samples A and B were used for post mortem analysis after the AST. Samples C-F were used for analysis of changes in oxygen transport resistance. Sample E had a different MEA configuration than the rest of the samples, but with the same Pt loading on the cathode. Sample F was, in addition to voltage cycling, exposed to regular simulated start-up and shut-down cycles at 68°C, i.e. pressurizing the cathode and letting air cross over to the anode24 in order to trigger carbon corrosion.
Table I. Overview of tested samples, applied AST and ECSA loss. The numbers in brackets refer to dwell time at upper and lower potential for square wave cycling or scan rate for triangular wave cycling.
| Sample | Ageing cycle | ECSA loss |
|---|---|---|
| A | Square wave (2s), 0.4–0.95 V, 100% RH, 70°C, 460 h | 48% |
| B | Square wave (2s), 0.6–0.95 V, 100% RH, 90°C, 400 h | 77% |
| C | Triangular wave (0.088 V/s), 0.6 – 0.95 V, 100% RH, 90°C, 400 h | 52% |
| D | Square wave (2s), 0.6–0.95 V, 100% RH, 90°C, 80 h | 45% |
| E | Square wave (2s), 0.6–0.95 V, 100% RH, 90°C, 300 h, different MEA | 62% |
| F | Square wave (2s), 0.6–0.95 V, 100% RH, 90°C + sim. start up/ shut down, 240 h | 57% |
Polarization curves in hydrogen-air atmosphere were measured at 68°C, 100% relative humidity, 2.5 bar/2.7 bar absolute pressure on cathode/anode and constant gas flow of 11.3 slpm air/4.5 slpm H2 on the cathode/anode.
Electrochemically active surface area (ECSA) was determined by cyclic voltammetry using the hydrogen adsorption/desorption method. The impedance of the cell was measured by electrochemical impedance spectroscopy (EIS) in H2/N2 atmosphere. An equivalent circuit model22,25 was used to calculate the ohmic resistance and the protonic resistance in the cathode layer using Z-View software.
Oxygen transport resistance was measured with the limiting current density method.26 The limiting current density was measured at oxygen concentrations of 1%, 1.5%, 2%, 2.5% and at each oxygen concentration at pressures of 1.2 bar, 1.5 bar, 2.0 bar, 2.5 bar and 3.0 bar. During the limiting current density measurement the cell was operated at 68°C, 75% relative humidity and constant gas flow of 4.5 slpm H2 on the anode and 9 slpm of diluted air on the cathode.
Microscopy
MEA samples for SEM imaging were cut as rectangular (25 mm × 10 mm) sections from the middle of the cell and embedded in EpoThin epoxy resin, polished with the Struers Tegra polishing system and carbon coated using Leica EM ACE600 high vacuum coater. The Hitachi SU8030 FESEM was used to acquire SEM images of the cross-sections at 200x, 500x, 1000x and 5000x magnification, using the accelerating voltage of 15 kV, beam current 15 μA, working distance 8 mm, and low-angle backscattered election mode. Catalyst layer thickness was measured using SEM images and an in-house developed macro for Image Pro image processing software.
To obtain the porosity and pore size distribution of the samples, FIB-SEM sectioning and imaging was performed using FEI Helios NanoLab 650 dual beam system. The MEA rectangular cross-sectional samples were sandwiched between graphite plates in a special sample holder for cross-sectional analysis and FIB-SEM was performed on the cathode side of the cross-section. Automatic slicing of the catalyst layer was performed using a 30 keV accelerating voltage Ga+ ion beam gun, with the layer cross-section tilted 52° from the vertical electron beam direction, to be perpendicular to the milling ion beam. 24 pA ion beam current was used to slice about 400 slices with 10 nm slice thickness. High resolution secondary electron (HRSEM) images were recorded after each slice using 2 keV electron beam energy and 50 pA electron beam current, and through-the-lens detector (TLD). Images were processed, reconstructed and pore size distribution was determined using internally developed algorithms similar to those discussed in Reference 27 for registration, tilt correction, segmentation and pore size distribution using sphere fitting approach.
MEA samples for TEM imaging and EDX mapping were prepared by cutting small, triangular pieces of MEAs (GDL was removed) and embedding in TTE resin (trimethylolpropane triglycidyl ether and 4 4'-methylenebis (2-methylcyclohexylamine)). Samples were microtomed to ∼100 nm thin sections using a Leica Ultracut UCT ultramicrotome (Leica Mikrosystem, Wien, Austria). The sections were deposited on 100-mesh Cu TEM grids for TEM analysis.
Ultramicrotomed MEA cross-sections were analyzed using FEI TEM Osiris microscope with an accelerating beam voltage of 200 kV. To obtain Pt particle size distribution, high resolution TEM images were collected at a magnification of 180 kx. 200 particles were imaged and measured for each sample, and particle size distribution obtained using Image J image processing software.
Elemental analysis and distribution of each sample was examined by collecting EDX elemental maps (768 × 768 pixels) at 7000x magnification in STEM mode, using the ChemiSTEM EDX detector system. Screen current was ∼ 2 nA, camera length 220 mm, beam dwell time 1000 μs, and the EDX signal was collected for 1 cycle, resulting in total electron dose of 6·104 e−/nm2. This dose was selected as sufficient to collect a statistically relevant EDX signal, but cause minimal damage to the samples. For qualitative and quantitative elemental analysis, EDX maps were processed using Esprit (Bruker) software. Background subtraction and de-convolution of all detected elements was performed. Elements such as Cu, Fe, Ni and Zr present in the EDX spectra were de-convoluted but not accounted for in the elemental analysis since they originate from scattered signals produced inside of the TEM column. Processed maps (Qmaps) resulted in quantified EDX spectra and text files containing X-ray net counts, mass % and atomic % for every element and in every pixel in the map. The obtained maps and net count data sets were used for further quantification of Pt loading and distribution.
Results and Discussion
Electrochemical characterization
In Figure 1a, polarization curves at beginning of life (BOL) and during the accelerated stress test are shown. The polarization curves were corrected for ohmic resistance and cathode catalyst layer proton resistance using EIS data.28 The ohmic cell resistance was assumed to be constant across the entire polarization curve, while the voltage loss associated with catalyst layer protonic resistance was corrected for non-uniform current distributions using the model in Ref. 28. The model assumes negligible oxygen transport limitation and therefore, will lead to an underprediction of proton transport losses when, due to oxygen transport losses, the reaction shifts toward the GDL-catalyst layer interface. During the AST ohmic resistance was nearly constant, decreasing by 5% in sample A and 10% in sample B at the end of the test, while protonic resistance decreased by 15% for both samples. Both aged MEAs show performance losses in the kinetic region as well as at high current density. These losses are higher in sample B, which was aged at 90°C. The voltage losses at small current densities are dominated by the activation overpotential ηORR for the oxygen reduction reaction (ORR), approximated by the simple, rearranged Tafel equation for a first order reaction14
![Equation ([1])](https://content.cld.iop.org/journals/1945-7111/165/6/F3241/revision1/d0001.gif)
where i is the current density, R the universal gas constant, T the temperature, α the cathodic charge transfer coefficient, F Faraday's constant, ix the current density associated with hydrogen crossover across the membrane, f the roughness factor and i0, s the specific exchange current density for the ORR depending on temperature and oxygen partial pressure in units of AcmPt−2. ηORR depends logarithmically on the inverse of the ECSA, therefore ECSA losses due to voltage cycling will lead to a higher activation overpotential. Cyclic voltammetry measurements confirm that sample B has higher ECSA losses than sample A (Figure 2), which is expected due to the higher temperature during voltage cycling,29,30 and matches well with the polarization curves in Fig. 1a. In order to calculate the increased activation overpotential ηORR due to ECSA loss, the specific exchange current density i0, s was measured in H2/O2 atmosphere. For the adjustment of i0, s for temperature and oxygen partial pressure, literature values for the kinetic reaction order19 and the activation energy of the ORR were used.14 Correcting the polarization curves for increased activation overpotential (Equation 1) due to lower ECSA in addition to ohmic losses (Figure 1b) reduces the differences to the BOL polarization curve at current densities smaller than 0.5 A/cm². The additional voltage loss at high current density after voltage cycling is associated with oxygen transport limitations13 and cannot be explained by an increase in activation overpotential only.
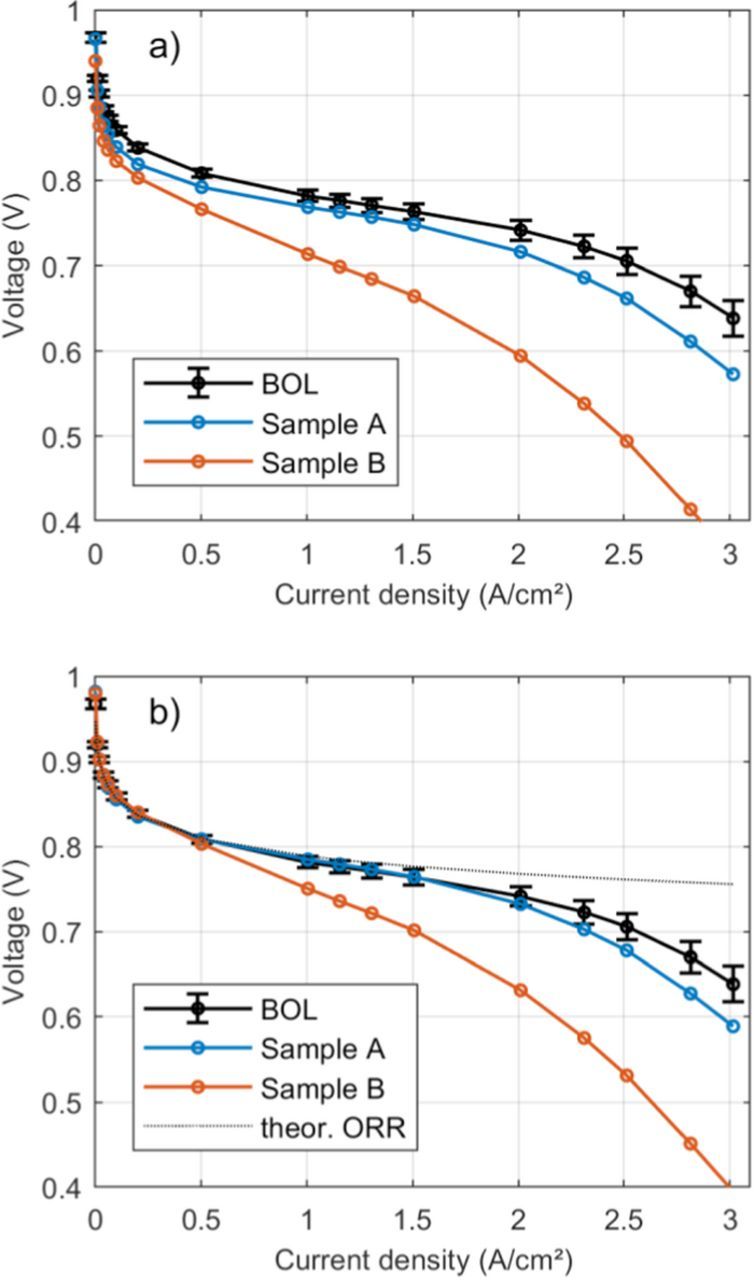
Figure 1. a) Polarization curves at BOL and after voltage cycling corrected for ohmic resistance. b) Polarization curves from a) additionally corrected for ECSA loss. The black dashed line corresponds to a theoretical polarization curve with only kinetic losses with a Tafel slope of 69 mV/dec. The BOL polarization curve is the average of measurements on 10 different fresh samples. Error bars correspond to 95% confidence intervals.
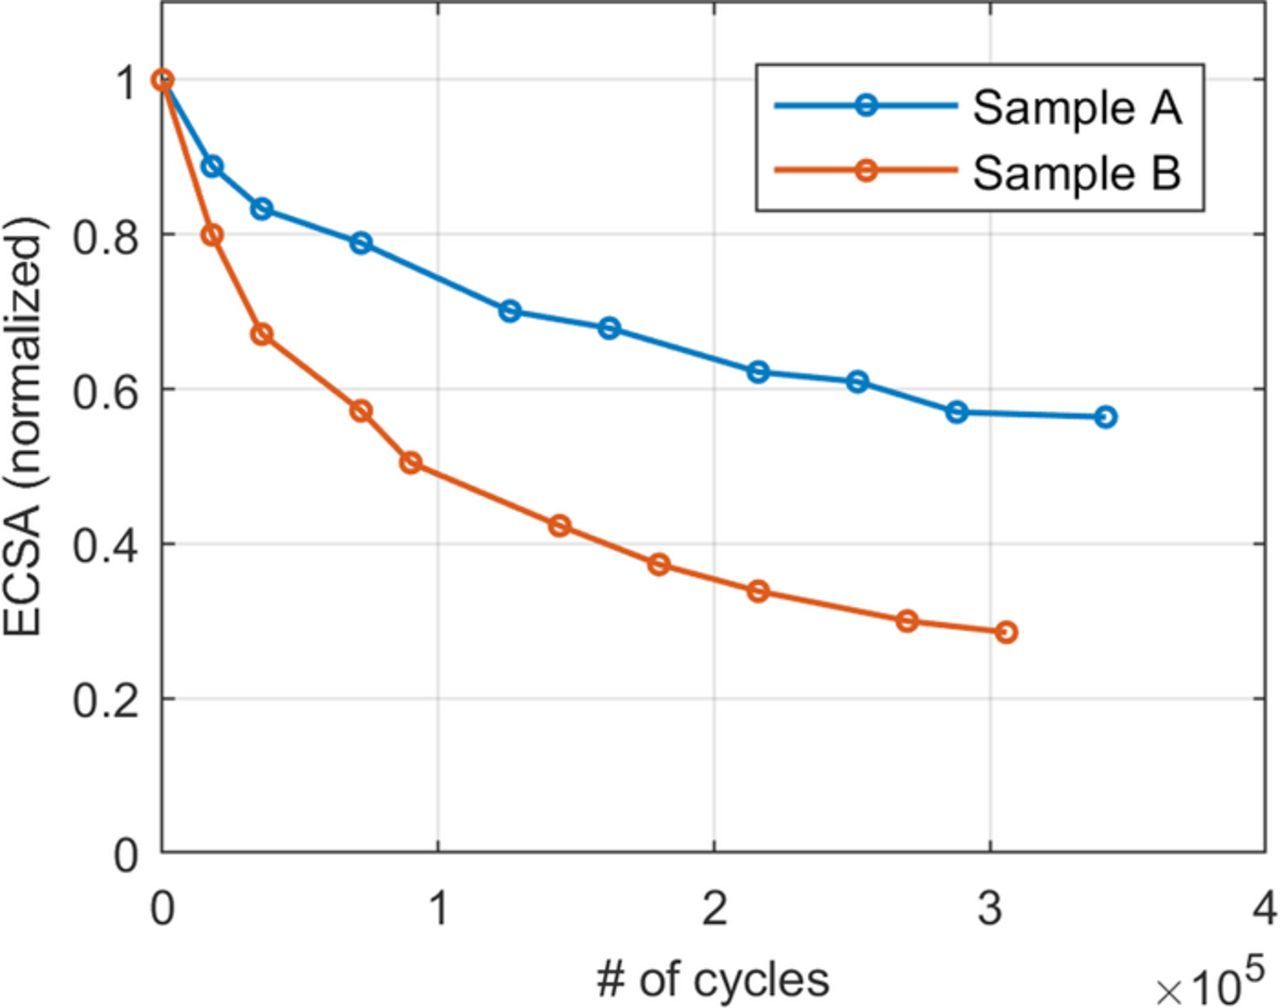
Figure 2. Normalized ECSA during voltage cycling.
Microscopy
In order to visualize the failure mechanism caused by the accelerated stress test, various advanced characterization techniques were applied post mortem. Exemplary SEM images for fresh and aged samples are shown in Figure 3a–3c. In both aged samples a Pt band in the membrane is clearly visible. This is a hallmark of Pt dissolution that has been reported before in aged samples.5,31 The location of the Pt band depends on the relative difference of hydrogen and oxygen partial pressure.32 As these parameters were held constant at the same values for both samples, the location of the Pt band in the membrane is identical. While the intention of the accelerated stress testing was to trigger only catalyst degradation, operation at high temperatures and OCV could also lead to membrane thinning3 and carbon corrosion.33 Thickness measurements (Figure 3j) show no significant thinning of layers for sample A. The more strongly degraded sample B exhibits a slight trend toward lower thickness of cathode and membrane, though error bars of the thickness measurements overlap with BOL values. While the overall catalyst layer structure of sample B seems to be intact, the onset of carbon corrosion cannot be ruled out. It should be noted that a thinning of layers could also originate from MEA compression.34 Even in a fresh sample that was only subject to conditioning and performance measurements, i.e. where carbon corrosion could be ruled out, variations in thickness that correlated with the channel-landing pattern of the flow field were observed in this study.
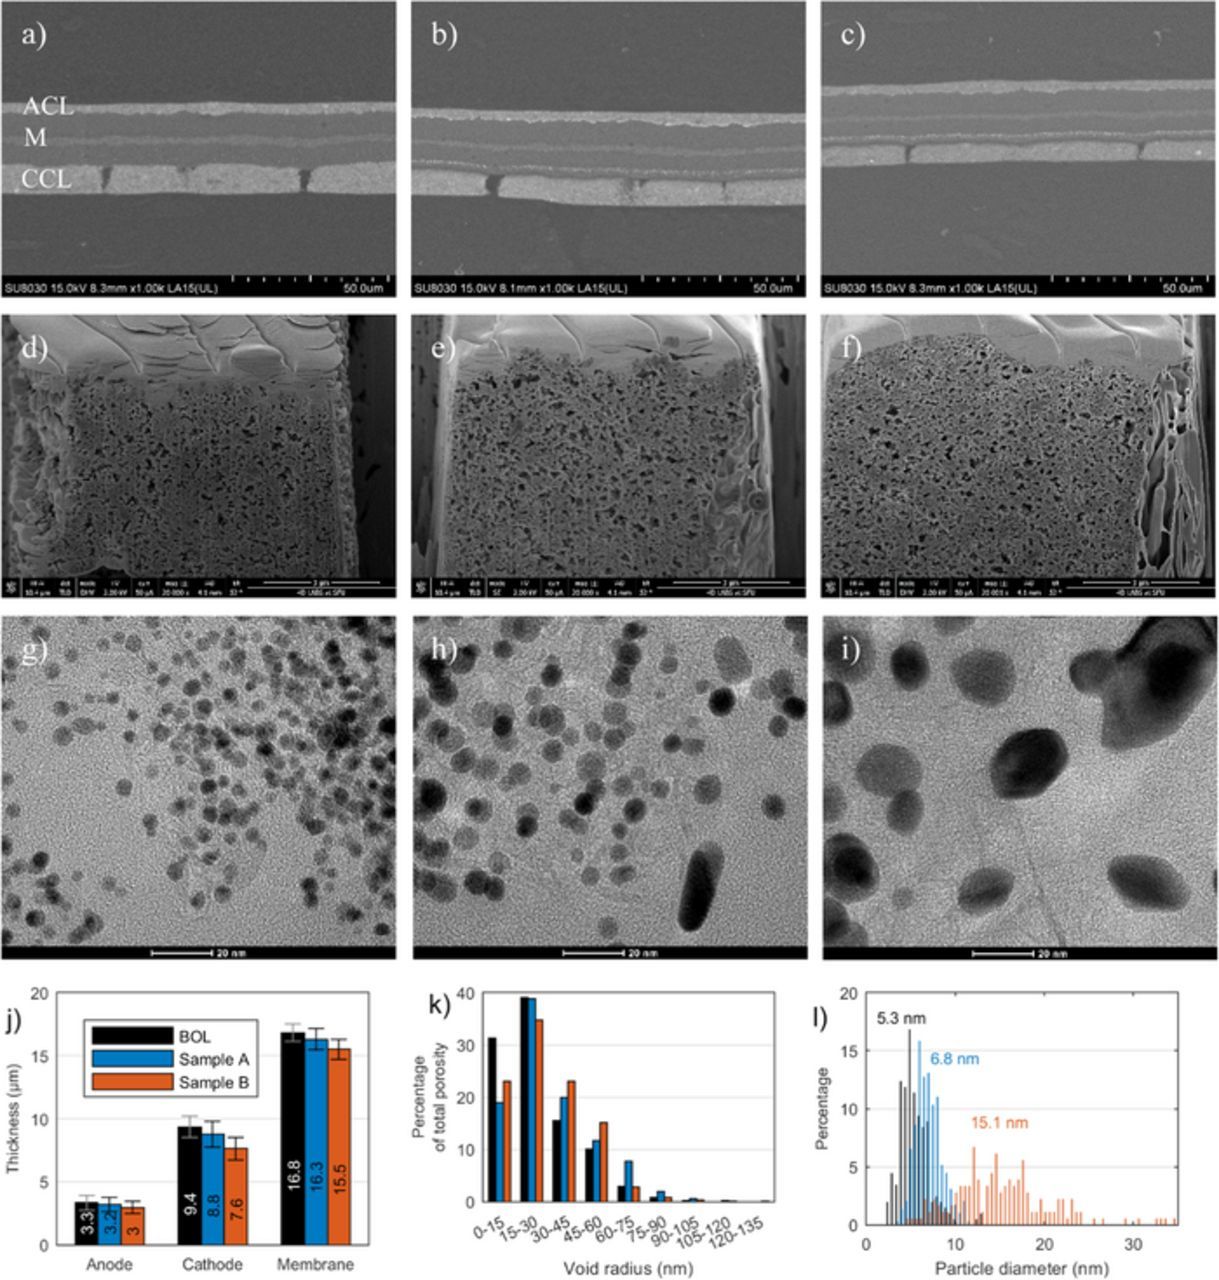
Figure 3. SEM (a-c), FIB-SEM (d-f) and TEM (g-i) images of BOL, sample A and sample B from left to right. a-c) In each image the orientation of the sample is the same as indicated in a): anode catalyst layer (ACL), membrane (M) and cathode catalyst layer (CCL) from top to bottom. d-f) Each image has the same orientation; the through-plane direction of the cathode catalyst layer is from left (MPL side) to right (membrane side). g-i) The imaged samples were cut from the cathode catalyst layer. j) Thickness measurements extracted from SEM images. k) Pore size distribution extracted from 3D reconstruction of FIB-SEM images. l) Pt particle size distributions extracted from TEM images.
Exemplary images of FIB-SEM microscopy are shown in Figure 3d–3f. Results of 3D reconstruction are summarized in Table II and Figure 3k. The tortuosity of the samples in x and y direction decreased by 10% after the AST and stayed constant in z direction, which is the direction of the FIB cuts. The aged samples exhibit a shift in pore size distribution to larger pores, however the overall porosity of the cathode remains unchanged. This could be interpreted as an onset of carbon corrosion, with the smallest pores collapsing and a higher share of large pores as a result. While the AST at the higher temperature in sample B compared to sample A results in a thinner cathode, there are no obvious differences in pore structure due to the higher temperature.
Table II. Porosity and tortuosity results from 3D reconstruction of FIB-SEM images. x refers to the through plane direction from MPL to membrane, y and z are in plane directions, with z being the cutting direction of the FIB.
| Sample | Porosity | Tortuosity X | Tortuosity Y | Tortuosity Z |
|---|---|---|---|---|
| BOL | 0.399 | 1.84 | 1.93 | 1.25 |
| A | 0.404 | 1.66 | 1.79 | 1.24 |
| B | 0.405 | 1.77 | 1.75 | 1.23 |
TEM analysis (Figures 3g–3i) confirms that Pt particle growth from Ostwald Ripening is the main mechanism for ECSA loss during voltage cycling. Pt particles grow from 5.3 nm to 15.1 nm in average particle size at 77% ECSA loss (Figure 3l). This correlates well with theoretical particle sizes under the assumption of perfectly spherical Pt particles. At BOL, the average measured value deviates less than 1 nm from the theoretical value. In the degraded samples, the deviation is less than 2 nm for sample A and less than 4 nm for sample B; the higher deviation is expected as the agglomerated particles are not perfect spheres in the degraded samples.
The formation of a Pt band in the membrane is also confirmed by STEM-EDX analysis (Figure 4c). Furthermore, the analysis revealed that a Pt depleted layer is developing at the cathode-membrane interface during degradation. This can be seen clearly in STEM-EDX maps (Figures 4b, 4c). The Pt depleted layer is most pronounced in the most degraded sample B, i.e. the sample with most loss of Pt surface area. In this sample the Pt depleted layer has a thickness of more than 1 μm at the cathode-membrane interface. The catalyst layer morphology is still intact in this region, as the ionomer structure can be distinguished clearly. In the remaining non-depleted part of the cathode the agglomeration of Pt particles is visible.
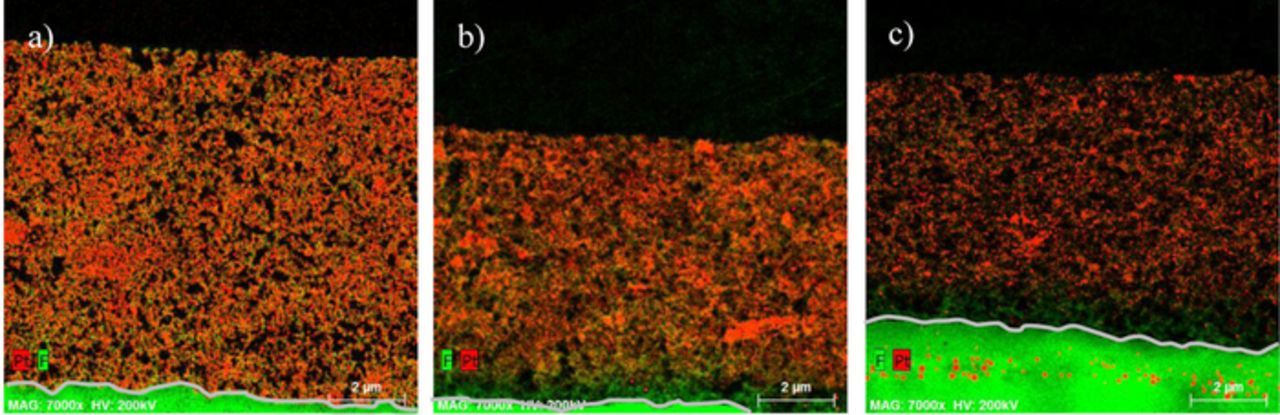
Figure 4. STEM-EDX maps of the cathode catalyst layer of a fresh sample, sample A and sample B from left to right. The EDX signal is color coded with green representing the fluorine signal and red representing the Pt signal. The gray line traces the cathode-membrane interface.
Pt loading and loss from the cathode was quantified using STEM-EDX net count data sets. The method is based on the fact that X-ray net count signal from the measured catalyst layer region is proportional to the Pt amount (grams, concentration or thickness) in the measured volume35 (represented as measured map area AEDX_map defined by the selected map size, multiplied by the microtomed slice thickness τslice, which is set by the microtome settings or can be measured). This approach is based on the ζ-factor method developed by Watanabe et al.,36 applied to the specific case of Pt. The ζ-factor approach states that the measured element characteristic X-ray intensity IA is proportional to the mass-thickness ρt and the element concentration CA in a thin-film specimen. For a specific case of thin Pt the standard ζ-factor approach would be described by
![Equation ([2])](https://content.cld.iop.org/journals/1945-7111/165/6/F3241/revision1/d0002.gif)
where ζPt is a proportionality factor, IPt is the characteristic X-ray intensity of Pt, ρPt is the Pt density, tPt is the sample thickness, CPt is the Pt concentration in the sample (one n case of pure Pt), and De is the electron dose. After rearranging we obtain:
![Equation ([3])](https://content.cld.iop.org/journals/1945-7111/165/6/F3241/revision1/d0003.gif)
In our method, we define a proportionality parameter aPt between Pt X-ray intensity and Pt thickness, as follows (taking into account the effect of variation of the electron dose on IPt):
![Equation ([4])](https://content.cld.iop.org/journals/1945-7111/165/6/F3241/revision1/d0004.gif)
making aPt equivalent to:
![Equation ([5])](https://content.cld.iop.org/journals/1945-7111/165/6/F3241/revision1/d0005.gif)
Therefore our approach is equivalent to the ζ-factor approach. The method is applicable if negligible X-ray absorption and fluorescence are assumed for the high atomic number Pt.
The proportionality factor aPt between the averaged Pt X-ray net counts per pixel, NPt, and Pt thickness, τPt, was obtained by measuring a standard sample, with the known Pt amount or loading. The proportionality factor was determined for the same mapping conditions (dose) used in the experiment and using a comparable sample (e.g., layers with relatively comparable density and composition). Once the proportionality factor is determined, Pt X-ray net counts can be used to calculate the Pt loading in each measured area, using Figure 5 and Equation 6
![Equation ([6])](https://content.cld.iop.org/journals/1945-7111/165/6/F3241/revision1/d0006.gif)
with the above definitions as well as the Pt mass in the measured area mPt, the geometrical area Ageo, the Pt volume in the measured area VPt, the length of the measured area xmap and the catalyst layer thickness τCL.
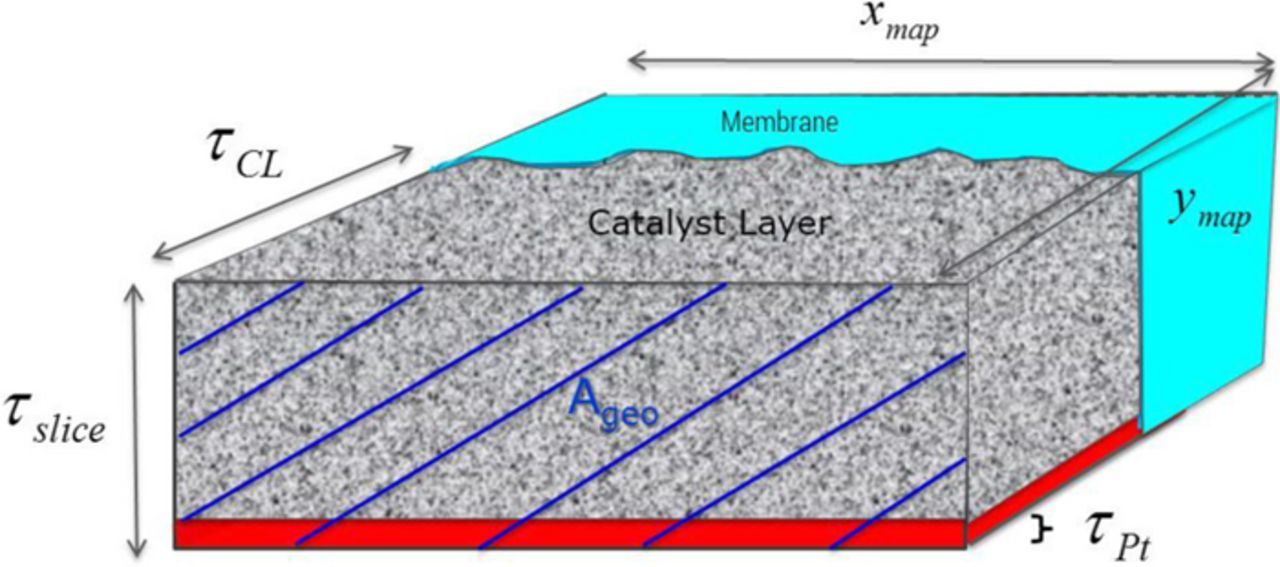
Figure 5. Schematic representation of microtomed MEA cross sections.
The thickness of the microtomed slice, or more precisely of the measured area of interest, was determined by application of the ζ-factor method to the carbon signal measured in epoxy-only area which was in a close proximity to the catalyst area of interest
![Equation ([7])](https://content.cld.iop.org/journals/1945-7111/165/6/F3241/revision1/d0007.gif)
where IC is the characteristic X-ray intensity of carbon, CC is the carbon concentration in epoxy (considered constant), ρ is density of the epoxy area (constant), ζC is a proportionality factor (constant), De is the electron dose, t is the sample (slice) thickness, Ne is the electron counts in a unit electric charge (constant), IP is the beam current and τ is acquisition time (kept constant in our experiments). By combining all constants in a proportionality factor ae, we obtain the final equation which can be used to determine the area (slice) thickness t. Plotting the carbon X-ray intensity change IC with the beam current IP results in a linear relationship, where sample thickness can be determined from the slope ae × t, if ae is known. ae was determined by applying the same method to a sample of a known thickness (measured by electron tomography), details of which are explained in a manuscript in preparation. Therefore, for each area of interest, thickness was measured "in-situ" and applied to Equation 6.
Pt loading profiles (Figure 6) reveal a uniform distribution of Pt in the electrode at BOL. The average loading of 0.24 mg/cm² is close to the specified loading and there is no gradient in Pt loading. On the other hand, both aged samples exhibit a gradient in Pt loading toward the membrane. The Pt distribution is less uniform with peaks in local Pt loading 50% higher than the average BOL Pt loading, which signals significant Pt agglomeration and redistribution in the electrode. The analysis revealed that Pt loss from the catalyst layer is only 4 wt% for sample A, and 8 wt% for the more strongly degraded sample B. The loss mainly occurs at the interface between catalyst layer and membrane, thereby reducing the local Pt loading close to zero in this region. The loss of Pt is possibly having an effect on local performance, but overall ECSA loss is caused by Pt agglomeration and particle growth.
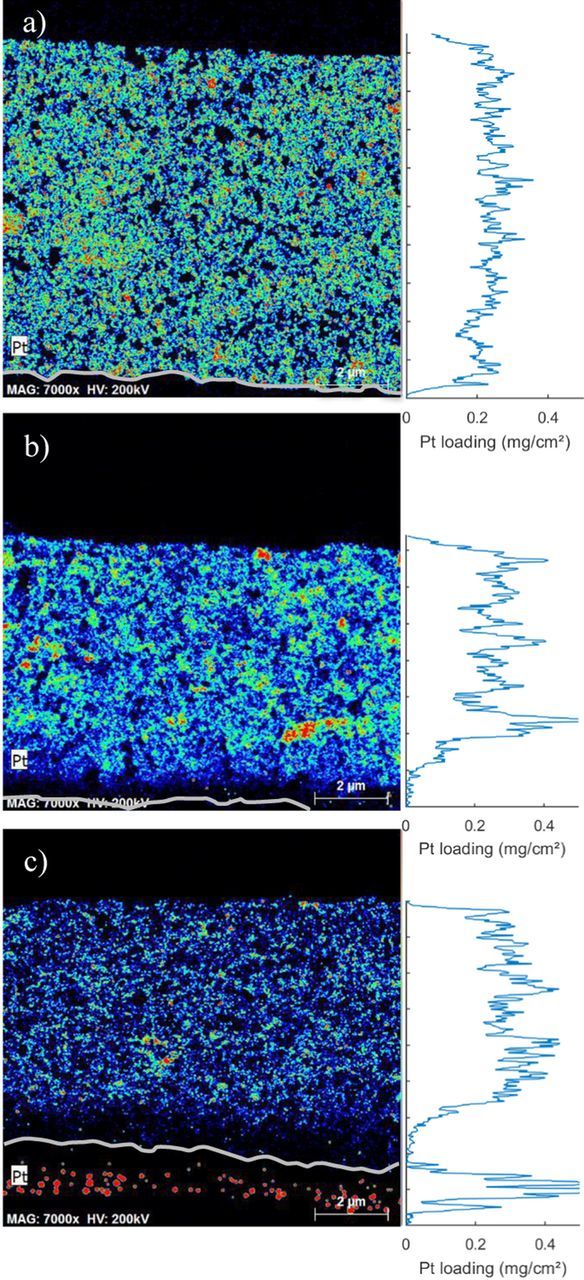
Figure 6. STEM-EDX maps of a fresh sample, sample A and sample B from top to bottom. Pt intensity is color coded from blue (low) to red (high). Pt loading calculated from Pt intensity line scans using Equation 6 is plotted on the left of the STEM-EDX maps. The gray line traces the cathode-membrane interface.
Determination of oxygen transport resistance
To further investigate the voltage losses at high current density in Figure 1, the oxygen transport resistance of fresh and degraded samples was determined experimentally. Following Baker et al.,26 this can be done at limiting current density when the local oxygen concentration at the surface of Pt atoms approaches zero; the total oxygen transport resistance RT under these conditions can be approximated as
![Equation ([8])](https://content.cld.iop.org/journals/1945-7111/165/6/F3241/revision1/d0008.gif)
where ilim is the limiting current density and cO2, channel the oxygen concentration in the channel.
The total oxygen transport resistance RT can be assumed to separate into a pressure dependent part RP that is the sum of the contributions to oxygen transport resistance from multi-component gas diffusion in the channel, the diffusion medium (DM) and the microporous layer (MPL), and a pressure independent part RNP that can be associated with transport resistances in the electrode26
![Equation ([9])](https://content.cld.iop.org/journals/1945-7111/165/6/F3241/revision1/d0009.gif)
RNP can be further separated into two parts16,17
![Equation ([10])](https://content.cld.iop.org/journals/1945-7111/165/6/F3241/revision1/d0010.gif)
where RKnudsen corresponds to local oxygen transport resistance due to Knudsen diffusion in the electrode pores, f is the electrode roughness factor and RPt is a local transport resistance near the Pt surface. This local transport resistance could originate from ionomer interfacial transport as discussed in the literature.20,21
It should be noted that under limiting current density conditions the assumption of differential conditions does not hold in the configuration used in this study. The low oxygen concentrations needed for the measurement are achieved by diluting air with nitrogen at a constant overall gas flow. Given the rather large active area in this study compared to previous studies in the literature,16,17,26 these low oxygen concentrations correspond to stoichiometries of λ < 3, thus the change in oxygen concentration along the channel by reactant consumption is not negligible. Therefore, the average of cell inlet and outlet oxygen concentrations is used in the following. Despite disadvantages in terms of accuracy of the numerical value of RT, this approach is valid as the focus in this study was on the relative difference in oxygen transport resistance of a given sample after degradation. The measurement of the limiting current and determination of RT was carried out on different samples than the ones examined in post-mortem analysis (see Table I) with a degradation state comparable to sample A.
Figure 7a shows the measured oxygen transport resistance of a BOL sample and after degradation. The overall oxygen mass transport resistance at different pressures fits well to a linear trend. The y-axis intercept is a proxy for the non-pressure dependent oxygen transport resistance RNP.26 From this diagram RNP can be calculated according to26
![Equation ([11])](https://content.cld.iop.org/journals/1945-7111/165/6/F3241/revision1/d0011.gif)
with the intercept and slope from the plot of RT against pressure, the partial pressure of water pW, the atmospheric pressure pa, the binary diffusion coefficients of oxygen relative to nitrogen and water DON and DOW, a dimensionless constant representing the flow-rate dependent part of the channel transport resistance Bch, the number of channels in the flow field N, the length of the flow channel L, the channel depth d and the inlet flow rate of dry gases Qdry. In absence of further knowledge about the constant Bch, Bch is set to 1 as in Ref. 26, noting that a change to Bch = 2 changes the values of RNP by 8% at BOL. Also, the constant is identical for all measurements as the cell hardware and operating conditions are not changed, so while an uncertainty in Bch will have an effect on the absolute value of RNP, it will not affect the relative differences between different measurements.
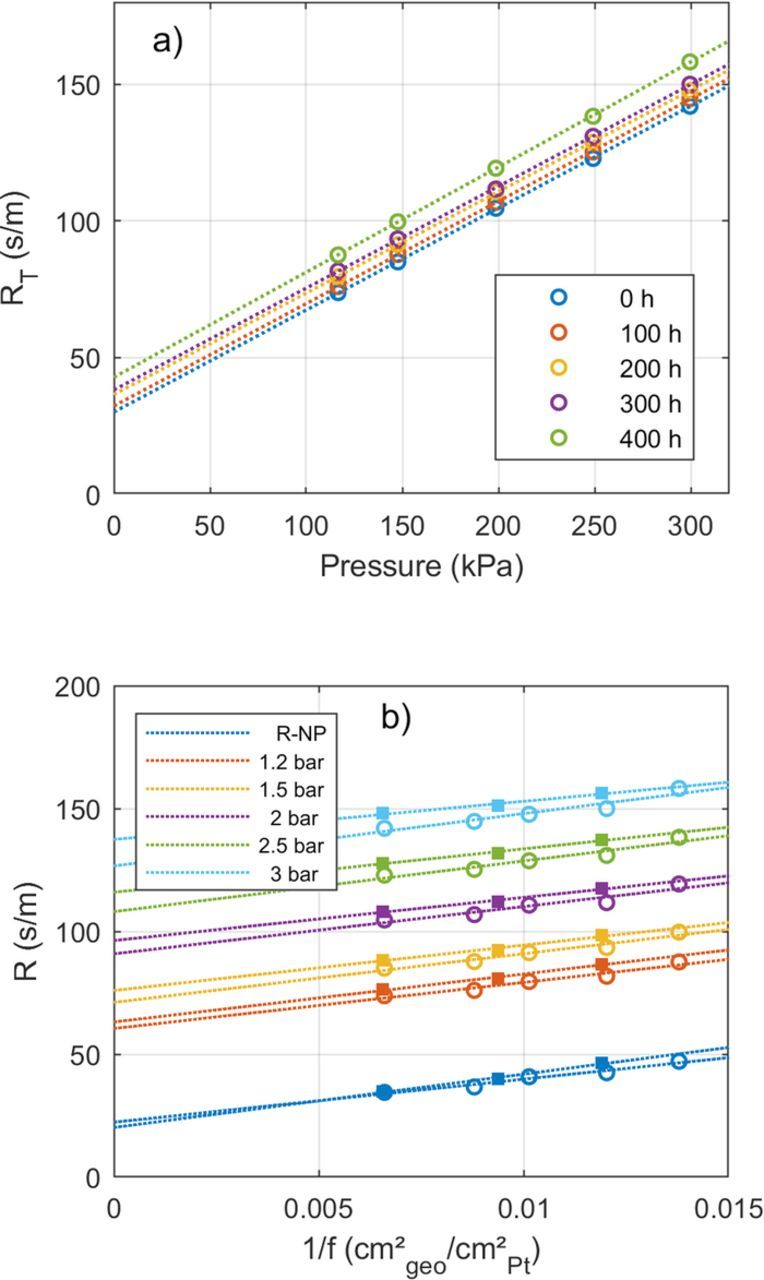
Figure 7. a) Oxygen transport resistance plotted against pressure during the AST after various hours of voltage cycling. Each data point represents the average of RT at 4 different oxygen concentrations. b) Oxygen transport resistance during voltage cycling plotted against the inverse roughness factor. The y-axis corresponds to RT for the data collected at the five different pressures, for the data labelled RNP just RNP is shown. Hollow circles and filled squares represent data for two different samples C and D. Each data point represents the average of RT at 4 different oxygen concentrations. The dotted lines are linear fits at each given pressure. The results of the linear fit are given in Table III.
The slope of the linear fit does not change in the degraded samples in Figure 7a, which indicates that the oxygen transport characteristics of the DM and MPL do not change. This is in line with the expectation that the voltage cycling does not induce significant degradation in these layers. However the y-axis intercept, and consequently RNP increases, so the main change in the oxygen transport characteristics due to voltage cycling is taking place in the electrode.
Figure 7b shows the relation of oxygen transport resistance against the inverse of roughness factor following a linear trend. The linear trend is observable at all pressures; also, RNP follows this linear trend. This finding supports the hypothesis that in MEAs aged by voltage cycling, there is a similar increase in oxygen transport resistance as observed in low Pt-loading electrodes.16,17,19 The SEM images (Figure 3b) confirm that the thickness of the samples is maintained, but the roughness factor is changing due to Ostwald ripening. This corresponds to the same conditions as in diluted electrodes. The linear trend is similar for both samples in Figure 7b, even though the duration of voltage cycling differed by a factor of 5. This corroborates that ECSA loss and not time in operation is the main driver for the increase in RT. The offset in RT between the two samples is most likely due to sample-to-sample variation. Statistics of RT measurements for 12 different fresh samples yield a standard deviation of 5% of the value of RT at a given pressure.
According to Equation 10, the y-axis intercept of RNP can be associated with the Knudsen diffusion resistance, while the slope of RT against 1/f can be considered the local transport resistance near the Pt surface RPt. While the slopes at different pressures deviate up to 18% from the average slope (Table III), the average values of both samples C and D are in good agreement. The measured values of RPt of 19 s/cm are in the range of values reported in the literature, that range from 4.8 s/cm,17 to 10–17 s/cm16 to 3–5 s/cm37 to 17 – 100 s/cm.20 At BOL the local transport resistance accounts for around one third of RNP and Knudsen diffusion resistance for the other two thirds of RNP. After voltage cycling the contributions of both resistances are roughly the same size.
Table III. Results of linear fit of RT against 1/f at different pressures in Figure 7b for three different samples C, D, E. The numbers highlighted in bold correspond to the average slope with 95% confidence intervals.
| Regression slope (10³ s/m) RPt | Regression intercept (s/m) | R² | |||||||
|---|---|---|---|---|---|---|---|---|---|
| Pressure (kPa) | C | D | E | C | D | E | C | D | E |
| RNP | 1.75 | 2.17 | 2.70 | 22.3 | 20.2 | 26.6 | 0.97 | 0.99 | 0.97 |
| 120 | 1.87 | 1.96 | 2.78 | 60.8 | 63.1 | 48.7 | 0.96 | 0.99 | 0.98 |
| 150 | 1.98 | 1.85 | 2.72 | 70.8 | 75.9 | 57.0 | 0.96 | 0.98 | 0.97 |
| 200 | 1.93 | 1.76 | 2.85 | 91.4 | 96.3 | 68.3 | 0.91 | 0.99 | 0.98 |
| 250 | 2.06 | 1.77 | 2.90 | 108.7 | 115.9 | 80.9 | 0.93 | 0.99 | 0.98 |
| 300 | 2.13 | 1.56 | 2.81 | 127.2 | 137.4 | 94.2 | 0.92 | 0.97 | 0.99 |
| 1.96 ± 0.15 | 1.84 ± 0.24 | 2.79 ± 0.09 | |||||||
In order to confirm the above result, the measurement was repeated on sample E with the same Pt loading, but a different MEA configuration. While the absolute values of RT and RPt differ from measurements on samples C and D because of the different MEA configuration, the linear trend of RT against 1/f is also present in sample E. This proves that the measurement is robust and valid for different materials.
Effect of carbon corrosion on oxygen transport resistance
The linear relationship between 1/f and RT is only valid if the catalyst layer structure does not change. Triggering carbon corrosion in addition to Pt dissolution will lead to a disproportionally large increase in RT (Figure 8). Sample F was exposed to regular simulated start-up and shut-down cycles, i.e. pressurizing the cathode and letting air cross over to the anode.24 This will lead to a hydrogen/air boundary when hydrogen is reapplied on the anode, which causes high potentials and carbon corrosion on the cathode.38 From the SEM image in Figure 8c, the thinning of the cathode compared to a fresh sample (Figure 3a) is obvious. At the beginning of the accelerated stress test the increase in RT follows the same linear trend as for samples C and D (Figure 8b), indicating a limited tolerance of the MEA to the applied air soaks. With increasing number of simulated start-up and shut-down cycles, RT deviates from the linear trend and starts to increase rapidly, which indicates a drastic change in the catalyst layer structure as expected from carbon corrosion and confirmed by the SEM analysis. The pressure dependent oxygen transport resistance is not increasing as strongly as RT due to the simulated start-up and shut-down cycles. RP increased by 14% at the end of the test compared to RNP increasing more than threefold, which supports the assertion that the main degradation is taking place in the electrode not the diffusion medium.
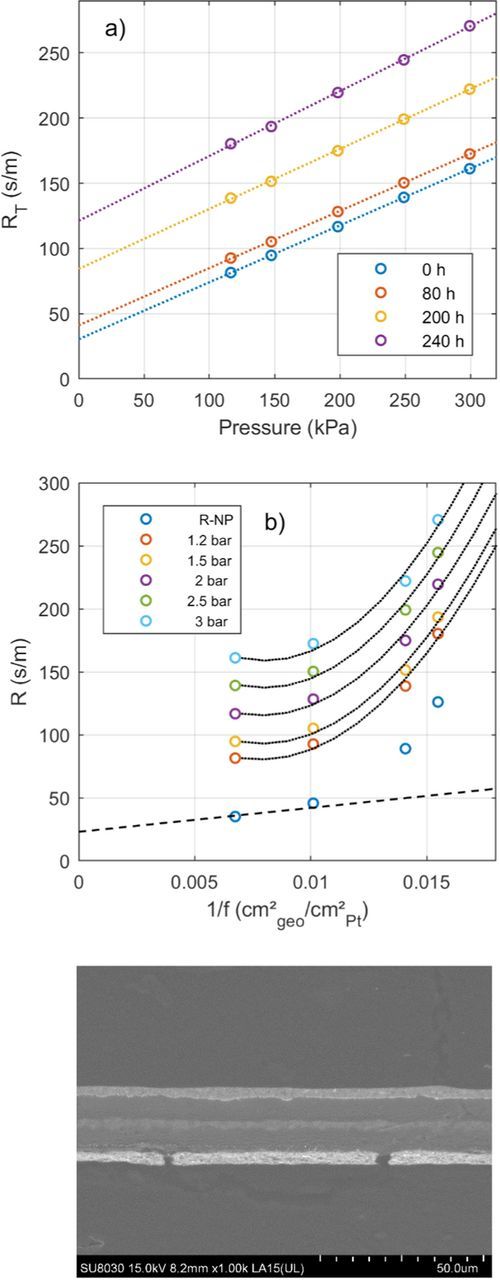
Figure 8. Oxygen transport resistance during a combined Pt dissolution and carbon corrosion accelerated stress test. a) RT plotted against pressure during the AST after various hours of voltage cycling. Each data point represents the average of RT at 4 different oxygen concentrations. b) Oxygen transport resistance plotted against the inverse roughness factor. The y-axis corresponds to RT for the data collected at the five different pressures, for the data labelled RNP just RNP is shown. Each data point represents the average of RT at 4 different oxygen concentrations. The black dotted lines are quadratic fits to the data and serve as a guide to the eye. The black dashed line is a linear fit to the data using the average value of RPt = 19 s/cm from Table III as the slope. c) SEM image of the sample.
Effect of oxygen transport resistance on voltage loss
With the knowledge of the linear relation in Equations 9 and 10 and the parameters in Table III, the additional oxygen transport resistance due to ECSA loss can be calculated. This allows the calculation of voltage losses due to limited oxygen transport in the electrode and the reduction in the voltage gap between BOL and aged polarization curves in Figure 1. The voltage loss associated with reduced oxygen concentration in the electrode is given by13
![Equation ([12])](https://content.cld.iop.org/journals/1945-7111/165/6/F3241/revision1/d0012.gif)
with the kinetic reaction order of the ORR γ19 and the oxygen partial pressure in the channel pO2, ch. The resulting polarization curves of fresh and aged samples corrected for ECSA loss, ohmic losses and oxygen transport resistance are shown in Figure 9 along with a theoretical polarization curve that is limited only by kinetic losses. For the fresh sample, the correction yields good results up to roughly 2 A/cm². The same goes for sample A, which was only aged by voltage cycling. In sample B, the correction only yields satisfying results in the kinetic region, with losses not captured by the model starting to increase from 0.5 A/cm². As sample B exhibits slight cathode thinning, the onset of carbon corrosion with the associated larger increase in oxygen transport resistance could be an explanation for this behavior. While the overall porosity of the catalyst layer does not change in sample B, a collapse of small pores with diameters below the resolution limit of the microscope could lead to an increase in oxygen transport losses. Carbon corrosion is also known to increase the hydrophilicity of the carbon in the catalyst layer,39 resulting in an increase in water accumulation and, thereby mass transport losses at lower current densities. Oxygen transport resistances in the electrode, and oxygen transport resistances due to flooding in the diffusion medium are not included in the one-dimensional model in Equation 12 and a more sophisticated, multi-phase model is necessary to capture the losses in cell voltage.40
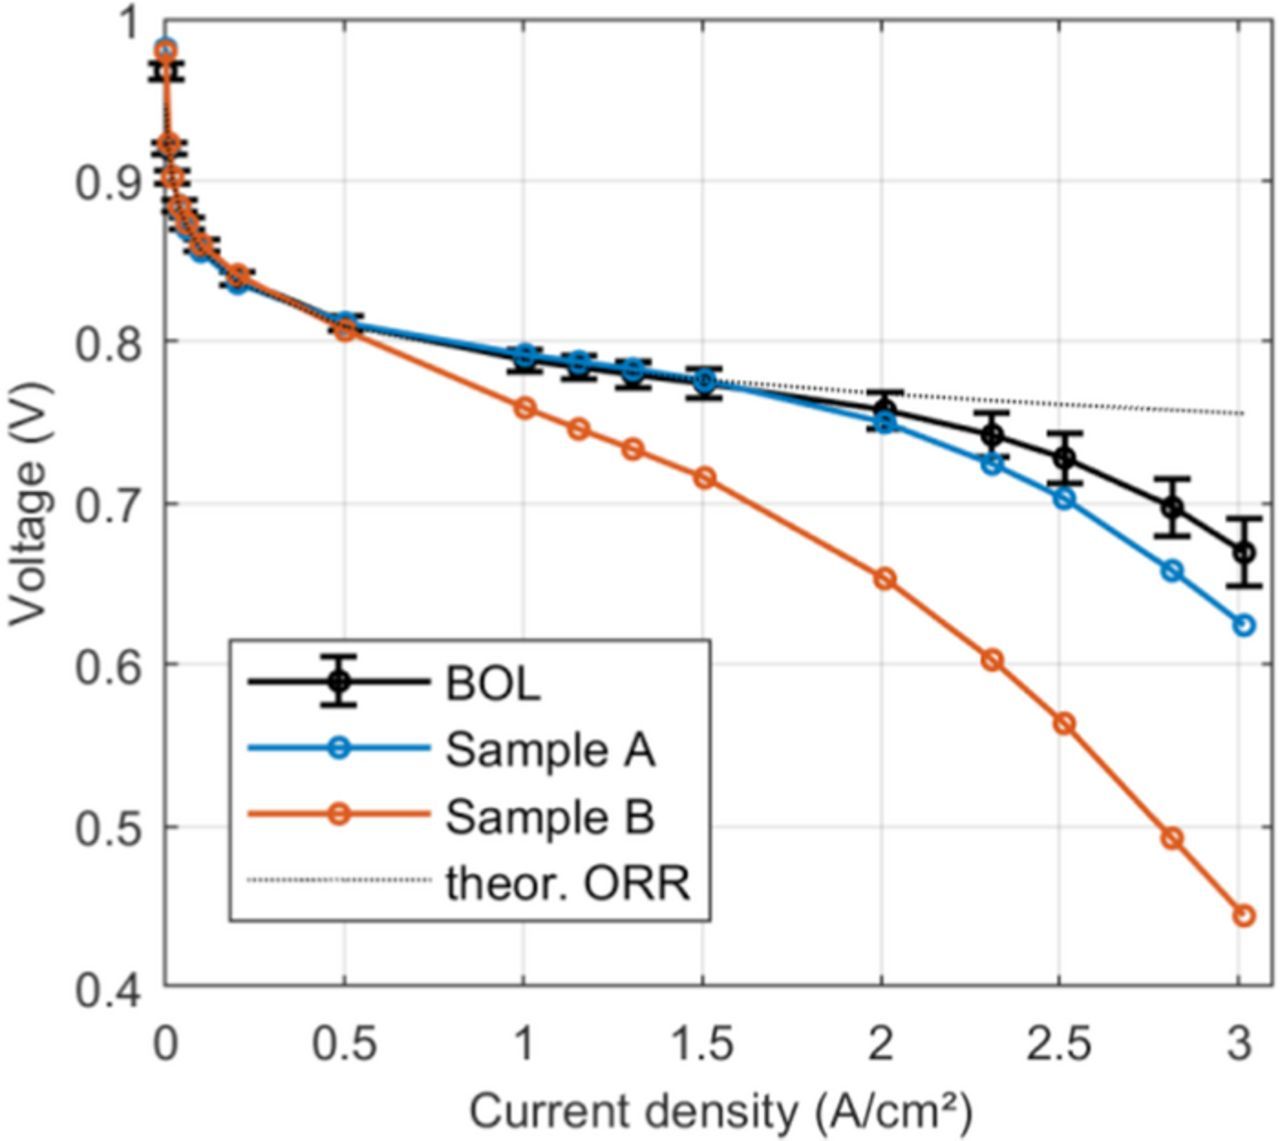
Figure 9. Polarization curves at BOL and after voltage cycling corrected for ohmic resistance, ECSA loss and oxygen transport resistance.
At high current density, further voltage losses lead to deviations from the theoretical performance curve even for the fresh sample. These deviations can be attributed to the simplifying assumptions made to derive the analytical model used to fit the data, which does not account for changes in ionomer hydration state at varying current density and changes in the ORR distribution due to mass transport. The latter changes are particularly important at high current density due to the presence of liquid water in the MEA, which is not accounted for by the analytical model. Limiting current density measurements were carried out at 75% RH in order to avoid flooding in the electrode while the polarization curves were measured at 100% RH. At fully humidified conditions and especially at current densities larger than 1.5 A/cm² it is reasonable to assume that liquid water is present in the electrode and diffusion medium. Pores in the electrode or DM blocked by liquid water will further increase the oxygen transport resistance,41 which is not captured by the oxygen transport resistance measurement in this study. As water in the cell is produced proportionally to current density, this could lead to the observed increasing voltage losses at higher current density. Simulations at similar operating conditions40 show that at high current density a model accounting for two-phase flow yields better agreement to experimental data than a single phase model, which supports the hypothesis that increased oxygen transport losses in the electrode and diffusion medium due to liquid water in the electrode are a likely cause for the remaining deviations in Fig. 9. The model in this study does not account for a non-uniform reaction distribution, e.g. due to Pt redistribution in the cathode. The formation of a Pt depleted region at the membrane-cathode interface could lead to an increase in ohmic cell resistance as part of the electrode would now effectively be inactive and act as an additional part of the membrane. This expected increase in cell resistance however was not observed in the measurement, indicating that the effect might be small under normal operating conditions. At high current density, oxygen limitations due to transport resistances can lead to a shift of the reaction zone toward the cathode-GDL interface causing an additional protonic voltage loss. Assuming that close to the limiting current density the reaction zone moves to within 1 μm of the cathode-GDL interface due to the Pt redistribution and oxygen limitations the additional protonic voltage loss can be estimated. For values of Nafion conductivity of 0.15 S/cm,42 ionomer volume fraction in the catalyst layer of 0.3543 and a Bruggemann correction factor of 1.643 the resulting increased resistive voltage loss at 3 A/cm² is about 86 mV, which would not be accounted for in the presented model. This additional voltage loss is on the order of the discrepancy between the BOL polarization curve and the theoretical curve in Figure 9.
Conclusions
In this study the effect of voltage cycling on the performance of state-of-the-art automotive MEAs as well as their electrode microstructure was investigated.
It was shown that the oxygen transport resistance increases after voltage cycling due to ECSA loss and scales proportionally to the inverse of the electrode roughness factor in a similar way as reported for low Pt loading MEAs. This effect can be associated with ionomer interfacial transport on the surface of the Pt particles and has to be taken into consideration when designing low Pt loading electrodes that meet the lifetime criteria for automotive applications. The observed relation only holds if other degradation mechanisms are not triggered; carbon corrosion in particular will lead to a significantly larger increase in oxygen transport resistance.
Post mortem electron microscopy supported the electrochemical analysis. SEM verified that layer thickness and pore size distribution were not strongly affected by voltage cycling. TEM on the other hand revealed significant redistribution of Pt in the MEA due to Pt particle growth, Pt band in the membrane and a Pt depleted layer at the membrane-cathode interface. Quantification of the Pt mass in the electrode verified that more than 92% of Pt mass is still present in the electrode after voltage cycling, confirming that Pt particle growth is the main source of ECSA loss.
With this approach it is possible to predict the performance of a degraded sample simply by measuring or modeling the ECSA over the lifetime of the MEA. This approach is valid as long as Pt dissolution and Pt particle growth are the main degradation mechanisms occurring in the MEA and carbon corrosion is avoided.
Acknowledgments
The authors want to thank Max Cimenti, Mickey Tam and John Berring from AFCC for support with the experimental protocols and interpretation of the experimental data.
ORCID
Alexander Kneer 0000-0002-4786-0505
Jasna Jankovic 0000-0001-8267-9560
Marc Secanell 0000-0002-7549-0863