Abstract
Efficient conduction of both electrons and cations (e.g., Li+) has a profound effect on the current and capacity of lithium-based batteries. With this study, we focus on cathode effects, with the preparation of pure silver hollandite materials with variable silver ion content within (intra-tunnel) and on the surface of α-MnO2 tunneled materials, followed by the measurement and analysis of impedance and electrochemistry data. Specifically, pure AgxMn8O16-y materials with low (x = 1.13) and high (x = 1.54) intra-tunnel silver content are compared with AgxMn8O16-y·aAg2O (a = 0.25, 0.63, 1.43) composites prepared via a new Ag2O coating strategy. When the Ag2O (a = 0, 0.25) content is low, the material with higher intra-tunnel silver (x = 1.53) content delivers up to ∼5-fold higher capacity accounted for by a ∼10-fold lower impedance than its lower intra-tunnel silver (x = 1.13) counterpart. In the presence of high Ag2O content (a = 0.63, 1.43), both composites exhibit comparable impedance but the lower intra-tunnel silver (x = 1.13) composite delivers up to ∼1.5-fold higher capacity than higher intra-tunnel silver composite, highlighting the key role of Li+ transport under those conditions. Our results demonstrate material design strategies which can significantly increase electronic and ionic conductivities.
Export citation and abstract BibTeX RIS

This is an open access article distributed under the terms of the Creative Commons Attribution Non-Commercial No Derivatives 4.0 License (CC BY-NC-ND, http://creativecommons.org/licenses/by-nc-nd/4.0/), which permits non-commercial reuse, distribution, and reproduction in any medium, provided the original work is not changed in any way and is properly cited. For permission for commercial reuse, please email: oa@electrochem.org.
Manganese oxide based materials are the subject of a number of electrochemical studies associated with electrical energy storage applications due in part to their relatively low cost and high theoretical capacity. In particular, α-MnO2 (hollandite or cryptomelane), has corner- and edge-sharing MnO6 octahedra which interlink to form square tunnels consisting of 2 octahedra × 2 octahedra with 0.46 nm diameters.1–4 Mono or divalent cations often partially occupy the tunnel interior leading to manganese being mixed valent Mn3+/4+.5–7 A member of this class of materials, silver hollandite (AgxMn8O16)8 has found application as a sorbent and catalyst under a wide array of applications.9–12 Silver hollandite is conceptually appealing as a battery cathode because the Ag+ center provides the opportunity to be electrochemically active and reduce to Ag0 in-situ.13 Further, if the Ag+ within the tunnel is not electrochemically active, it can provide internal structural support to the tunnel. The synthesis and electrochemical properties of pure silver hollandite have been reported where the material can deliver a capacity of >180 mAh/g.14,15
Successful cathode materials for secondary lithium battery applications demand high power output and long-term cycle stability.16 In order to achieve this, facile transport of both lithium ions and electrons is needed. A strategy that has been used to address one or both of these issues is to surface coat the electroactive cathode materials, as coatings can successfully provide a number of important functions. As an example of a protective mechanism, Al2O3 coated Li2MnO3 exhibited improved specific discharge capacity, cycling stability, and mitigated charge transfer impedance when compared to LiMnO2;17 Al2O3 coated Li[Li0.20Mn0.54Ni0.13Co0.13]O2 showed improved capacity retention of ∼98% after 32 cycles compared to ∼77% retention in the pure materials.18
Coatings can also serve to improve electronic conductivity. For example, carbon coatings of active materials have been used for battery relevant materials.19–22 The conductivity of carbon can be affected by a variety of factors, including physical dimensions, purity and directionality, and is typically in a range of 3.3 × 10² to 3 × 10⁵ S/m.23 Ag metal is an excellent electrical conductor with a conductivity of 6.30 × 10⁷ S/m.23 Due to the rarity of Ag, Ag2O is typically surface deposited in small amounts, where the surface of the target material is decorated with small spheres of Ag2O, forming a composite. For example, composites of Cr2O3-Ag2O were prepared which showed higher capacity and capacity retention compared to that of Cr2O3 (641 mAh/g);24 Further, the composite CuCrO2-Ag2O exhibited a resistance of 63 Ω after discharge (Ag+ + e- → Ag0) compared to 344 Ω for CuCrO2, highlighting the improved conductivity due to the Ag0 deposits on the surface of CuCrO2.
In addition to the effects of Ag2O deposited on the surface of electroactive materials to generate composites, the formation of Ag0 metal during the electrochemical reduction of structural Ag+ (Ag+ contained within the crystal lattice) was confirmed in the case of silver vanadium phosphorus oxide (Ag2VO2PO4). For Ag2VO2PO4, the two Ag+ are contained within the VO2PO42− lattice,25 but Ag0 is observed as small deposits on the particle surfaces and detected by X-ray diffraction. Notably, upon Ag0 formation, a reduction in impedance of ∼15000 fold compared to the original material is observed.26
For tunneled manganese oxides (α-MnO2), a variety of cations can be observed within the tunnels, including Ag+, yielding materials of the general formula AgxMn8O16-y. Specifically, we reported that Ag1.16Mn8O14.8 exhibit a 7-fold increase in discharge capacity relative to Ag1.63Mn8O15.6, due largely to the oxygen deficiencies associated with Ag1.16Mn8O14.8.27 To examine a possible role of Ag+ in the electrochemistry of AgxMn8O16-y, we developed a Ag2O precipitation strategy to prepare AgxMn8O16-y·aAg2O composites for the first time, providing variable amounts of Ag2O spherical deposits on the AgxMn8O16-y nanorod surface. Herein, we report the syntheses of the composites and the characterization, including X-ray diffraction (XRD), thermogravimetric analysis (TGA), Fourier transform infrared spectroscopy (FTIR) and Transmission electron microscopy (TEM). We also interpret the effects of both the intra-tunnel Ag+ as well as the Ag2O surface deposits on the composite electrochemistry using galvanostatic reduction and electrochemical impedance spectroscopy (EIS) measurements.
Experimental
Materials synthesis
Silver hollandite was prepared via ambient pressure reflux with reagent mixtures containing different Ag/Mn ratios using a method previously reported.13,15 The abbreviation AgxMn8O16-y, where x = Ag content, is used here for simplicity. Ag2O coated AgxMn8O16-y was synthesized via a coprecipitation reaction as follows. The above synthesized AgxMn8O16-y powder was added to a N2 degassed AgNO3 solution at 0°C with vigorous stirring to obtain a suspension. A solution of NaOH was added to the AgxMn8O16-y suspension. Three different molar ratios, 2:1, 1:1 and 1:2 of AgxMn8O16-y to Ag2O were prepared with 1:1, 1:2 and 1:4 molar ratios of AgxMn8O16-y to AgNO3. The abbreviation Ag1.13Mn8O16-y·aAg2O is used for simplicity. After chemical precipitation, the as-prepared samples were washed with DI water and dried in vacuo. Pure Ag2O was also synthesized using the same method without adding silver hollandite.
Materials characterization
Powder X-ray diffraction (XRD) was employed to characterize the crystal structure and estimate crystallite sizes. The XRD patterns were measured using a Rigaku Smart Lab X-ray diffractometer with Cu Kα radiation and Bragg−Brentano focusing geometry. An MDI JADE version 8.5.3 software with ICDD and NIST databases was used for search-match analysis. A TA Instruments SDT Q600 was used to collect simultaneous thermogravimetric analysis/differential scanning calorimetry (TGA/DSC) for determination of oxygen content of silver hollandite samples according to the method previously described.27 A Thermo Scientific Nicolet iS10 spectrophotometer with attenuated total reflectance accessory (ATR) was applied in the wave number range from 4000 cm−1 to 500 cm−1 for FT-IR. A Thermo Scientific ICAP 6300 radial inductively coupled plasma optical emission spectrometer (ICP-OES) was used for the quantitative Ag and Mn determination. Transmission electron microscopy (TEM) data was collected by a transmission electron microscope (JEOL JEM 1400) equipped with a Gatan CCD camera.
The ratios of AgxMn8O16-y to Ag2O were determined using the following method. First, the Ag/Mn ratio of the parent silver hollandite was determined. Then, the total Ag (from both hollandite and silver oxide) and Mn amounts were determined for the coated materials. The value of a in AgxMn8O16-y·aAg2O was then calculated according to the silver amount in hollandite and in silver oxide.
Electrochemical testing
Electrodes were prepared by pressing pellets of the as-synthesized materials and the densities of the pellet electrodes are shown in Table I. Coin type cells were fabricated within an argon glove box with lithium metal anodes and 1 M LiPF6 in 70/30 (V/V) dimethyl carbonate/ethylene carbonate electrolyte. Intermittent discharge with a current density of 1 mA/g was employed. The discharge process was stopped every 1% of theoretical capacity three times and every 5% of theoretical capacity for the remainder of the test. AC impedance measurements were measured after ∼12 h at OCV using a BioLogic VSP impedance analyzer with a 10 mV amplitude and a frequency range of 100 kHz to 0.1 Hz. The Nyquist plots were normalized assuming a zero intercept at the high frequency x-axis intercept for comparison of RCT. Equivalent circuit analysis was performed using Z-view software.1628
Table I. Densities of the pellet electrodes.
| Compound Stoichiometry | Pellet density |
|---|---|
| AgxMn8O16-y·aAg2O | (g/cm3) |
| Ag1.13Mn8O15.15 | 2.36 |
| Ag1.13Mn8O15.15·0.25Ag2O | 2.66 |
| Ag1.13Mn8O15.15·0.63Ag2O | 2.51 |
| Ag1.13Mn8O15.15·1.43Ag2O | 2.64 |
| Ag1.54Mn8O15.48 | 2.35 |
| Ag1.54Mn8O15.48·0.25Ag2O | 2.71 |
| Ag1.54Mn8O15.48·0.63Ag2O | 2.61 |
| Ag1.54Mn8O15.48·1.43Ag2O | 2.40 |
Results and Discussion
Material characterization
The XRD patterns of representative as-prepared hollandites are presented in Figure 1, red traces, for low (a) and high (b) silver content. All peaks can be indexed to the reference pattern (JCPDS card No. 97-006-015). The XRD patterns for samples coated with Ag2O show intense PXRD reflections at 34°, 37° and 56° 2θ, in agreement with cubic Ag2O, Figure 1, green traces. Samples prepared with lower Ag2O content gave less intense XRD peaks consistent with the ability to tune the coating amount. For samples with low levels of Ag2O, XRD could not readily discern the peaks corresponding to the silver oxide phase.29 The presence of lower amounts of the Ag2O coating was confirmed by alternate techniques, as described below.
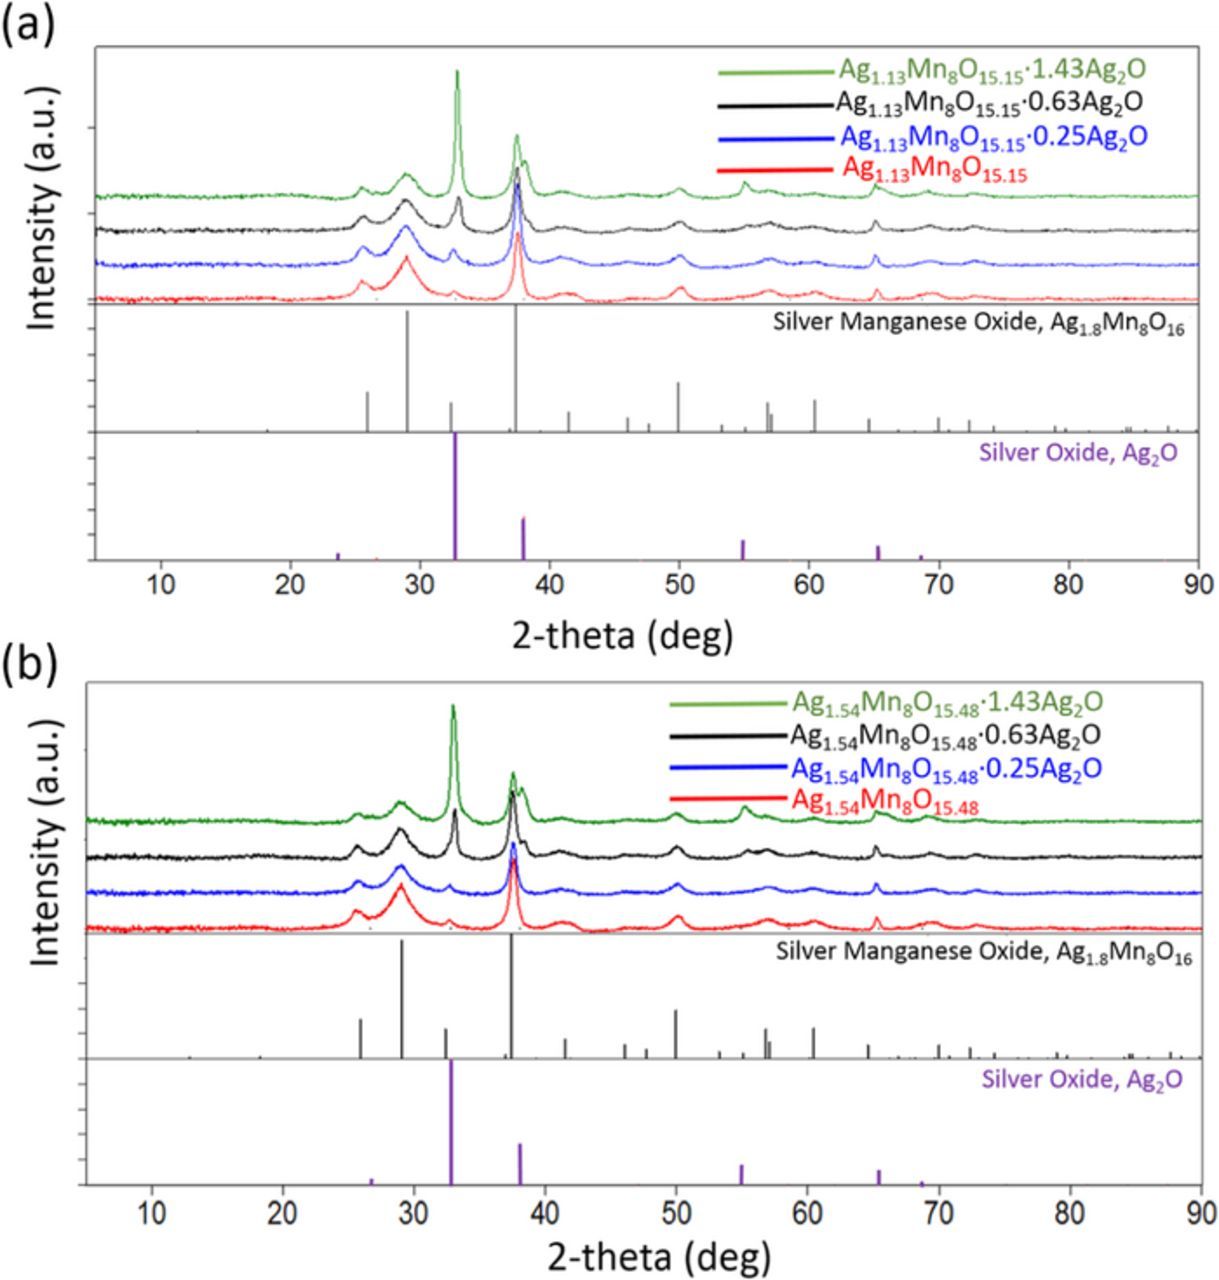
Figure 1. XRD patterns of (a) Ag1.13Mn8O15.15 and (b) Ag1.54Mn8O15.48 coated with different ratios of Ag2O.
Empirical formulas for all the materials were determined by ICP-OES in conjunction with TGA. Typical as-prepared hollandites resulted in of AgxMn8O16-y, x = 1.13 and x = 1.54, for the low silver and high silver materials, respectively. The oxygen contents of y = 15.15 (x = 1.13, low silver) and 15.48 (x = 1.54, high silver) were determined yielding formulas of Ag1.13Mn8O15.15 and Ag1.54Mn8O15.48.27 The fraction of Ag2O in the final precipitate was roughly proportional to the AgxMn8O16-y: Ag ratio used during synthesis, Table II.
Table II. Empirical formulas for Ag2O coated AgxMn8O16-y determined by ICP-OES and TGA.
| Reactant Ratio | Product Stoichiometry |
|---|---|
| AgxMn8O16-y:AgNO3 | AgxMn8O16-y·aAg2O |
| Ag1.13Mn8O15.15:AgNO3 = 1:1 | Ag1.13Mn8O15.15·0.25Ag2O |
| Ag1.13Mn8O15.15:AgNO3 = 1:2 | Ag1.13Mn8O15.15·0.63Ag2O |
| Ag1.13Mn8O15.15:AgNO3 = 1:4 | Ag1.13Mn8O15.15·1.43Ag2O |
| Ag1.54Mn8O15.48:AgNO3 = 1:1 | Ag1.54Mn8O15.48·0.25Ag2O |
| Ag1.54Mn8O15.48:AgNO3 = 1:2 | Ag1.54Mn8O15.48·0.63Ag2O |
| Ag1.54Mn8O15.48:AgNO3 = 1:4 | Ag1.54Mn8O15.48·1.43Ag2O |
FTIR spectra were recorded for all the samples, Figure 2. Pure Ag2O demonstrates two main peaks at 1380 and 881 cm−1, consistent with previously published data at 1379 and 901 cm−1.30 As the Ag2O/Ag1.13Mn8O15.15 ratio increases, the FTIR spectra continue to demonstrate the silver hollandite peaks, while the peaks detected at ∼1380 cm−1 increase. The XRD and FTIR data indicate that the silver hollandite structure remains intact throughout the coating procedure31 with no apparent change of Ag1.13Mn8O15.15 lattice constants despite the presence of Ag2O.
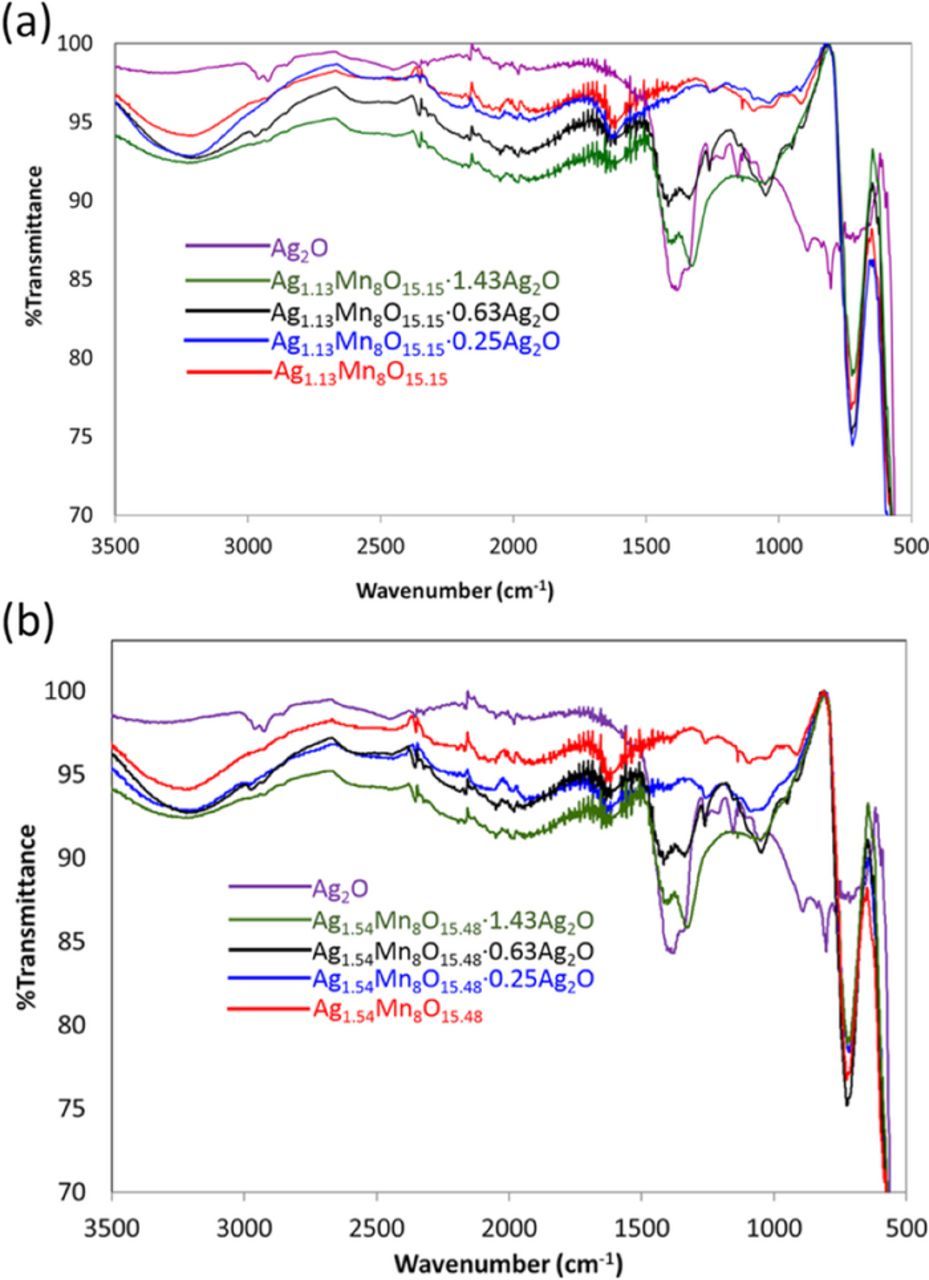
Figure 2. FT-IR of (a) Ag2O, Ag1.13Mn8O15.15, Ag1.13Mn8O15.15·0.25Ag2O, Ag1.13Mn8O15.15·0.63Ag2O and Ag1.13Mn8O15.15·1.43Ag2O (b) Ag2O, Ag1.54Mn8O15.48, Ag1.54Mn8O15.48·0.25Ag2O, Ag1.54Mn8O15.48·0.63Ag2O and Ag1.54Mn8O15.48·1.43Ag2O.
The presence of a silver rich composition to the nanoparticle coating was confirmed by TEM, Figure 3. As-prepared Ag1.13Mn8O15.15 and Ag1.54Mn8O15.48 (Figures 3a, 3b) are ∼15 nm diameter nanorods with smooth surfaces. With increasing Ag2O content, nanoparticles up to size 5∼10 nm are visible on the surface of the nanorods (Figures 3g, 3h). HAADF-STEM and STEM-EDS images confirmed these particles contain mostly silver, Figure S1, suggesting these are the deposited Ag2O. It can be seen in all images that the deposited nanoparticles are distributed uniformly.
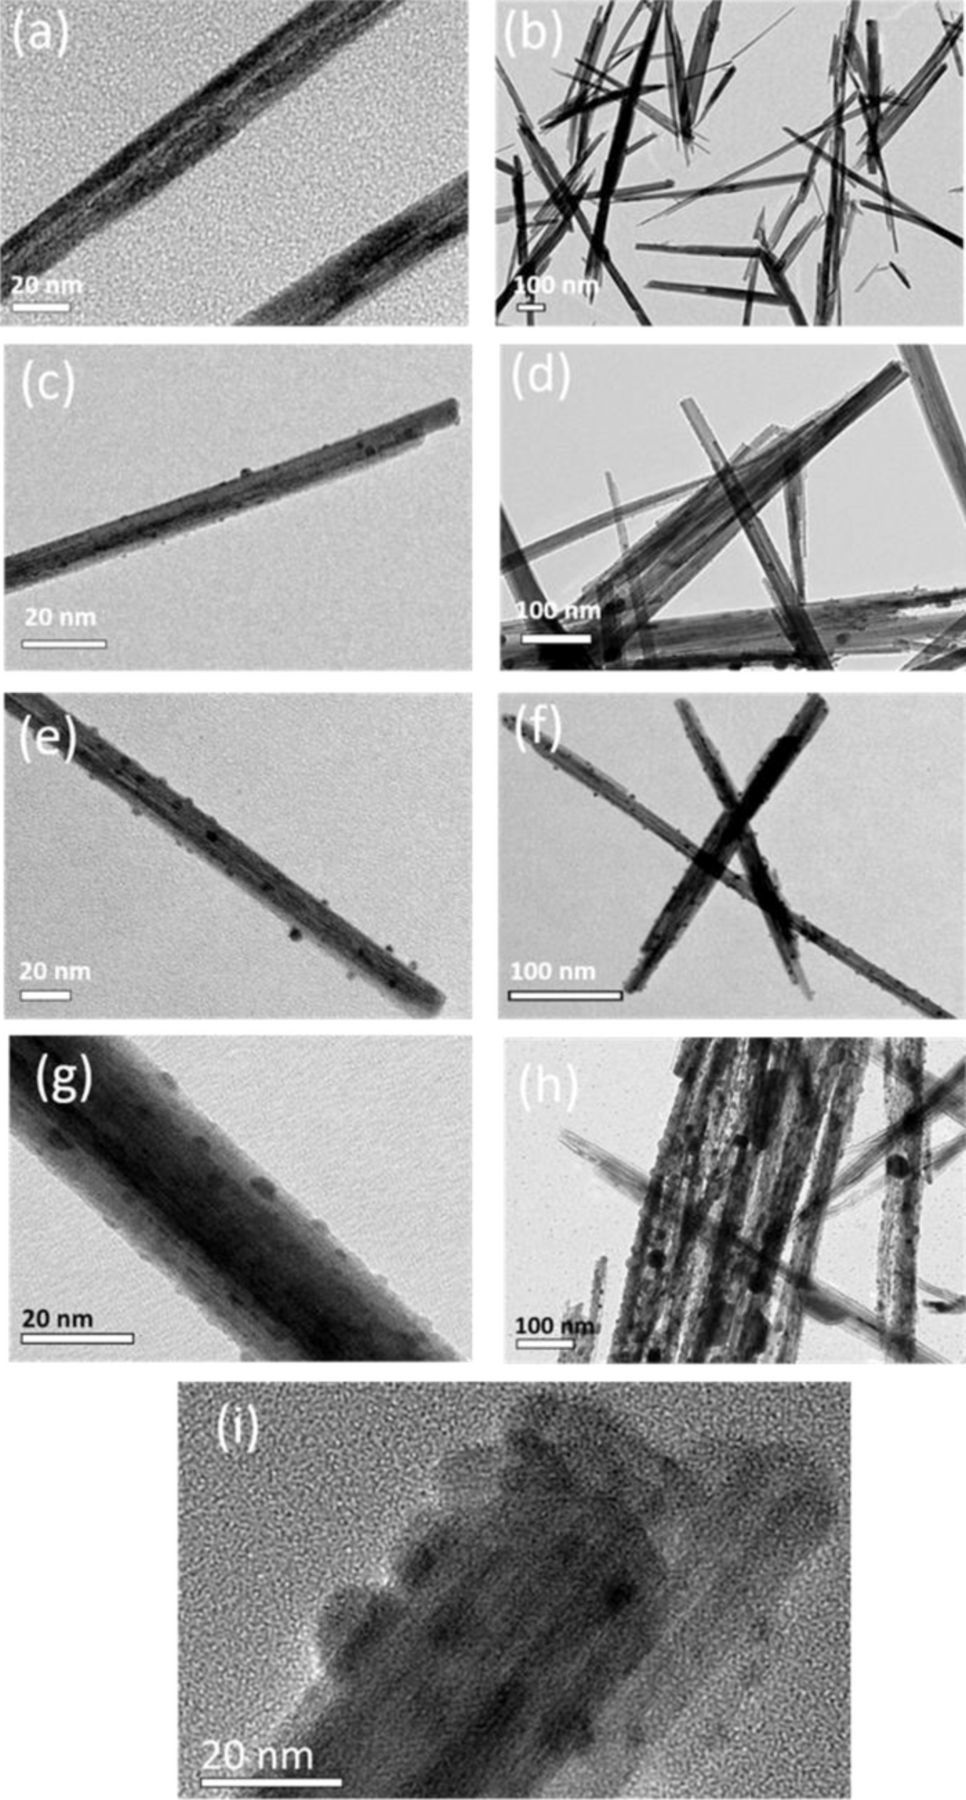
Figure 3. High and low magnification TEM images of (a) and (b) Ag1.54Mn8O15.48, (c) and (d) Ag1.54Mn8O15.48·0.25 Ag2O, (e) and (f) Ag1.54Mn8O15.48·0.63Ag2O, (g) and (h) Ag1.54Mn8O15.48·1.43Ag2O (i) High resolution TEM for Ag1.54Mn8O15.48·1.43Ag2O.
Electrochemical analysis
Lithium anode electrochemical cells were prepared using Ag2O, AgxMn8O16-y and the AgxMn8O16-y·aAg2O composites as cathodes. Electrochemical impedance spectroscopy was used to characterize the cells before and after reduction. The Nyquist plots of all cells showed a similar characteristic semicircle, Figures 4–8. The data were fitted to an equivalent circuit consisting of a resistor (Rs), a parallel combination of a resistor (Rct1) and a constant phase element (CPE), the other parallel combination of a resistor (Rct2) and CPE and a Warburg element (open, W0), Table III.
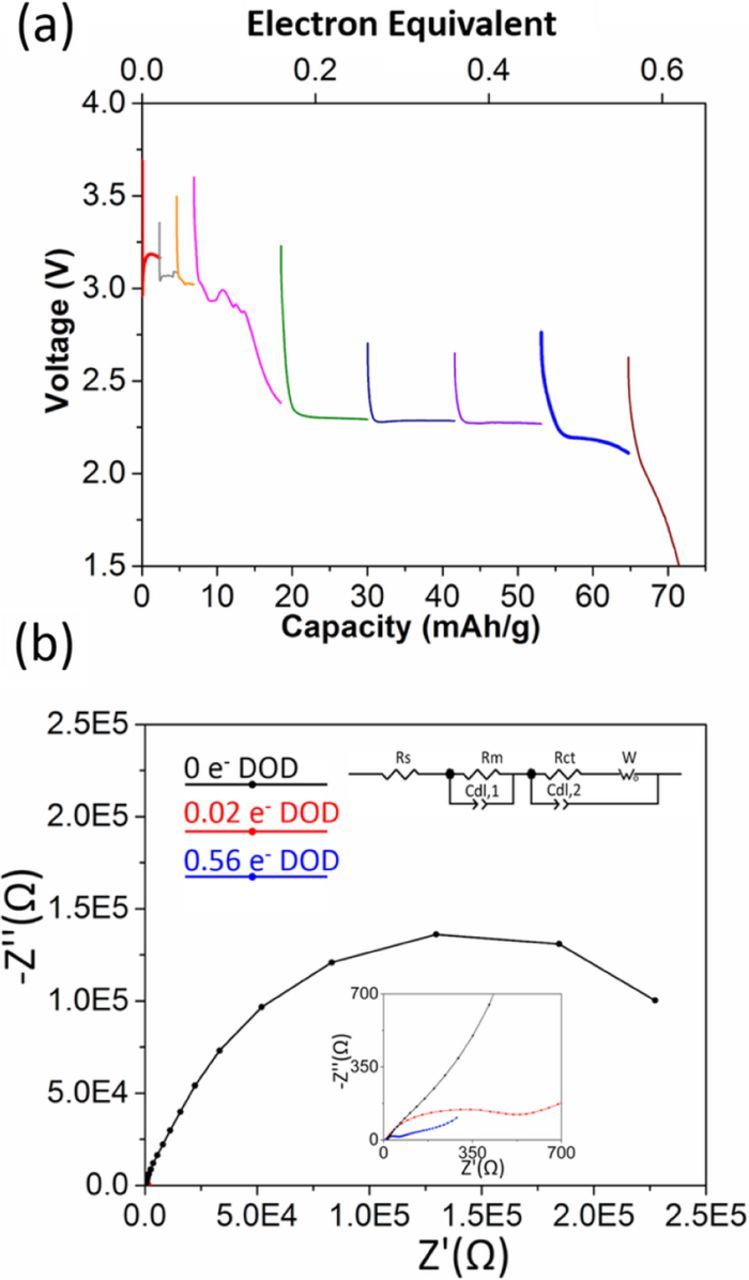
Figure 4. (a) Voltage of Li/Ag2O electrochemical cells discharged under galvanostatic control (b) Nyquist plots of Ag2O cells before and after the battery test, inset: Equivalent circuit used for mathematical fit.
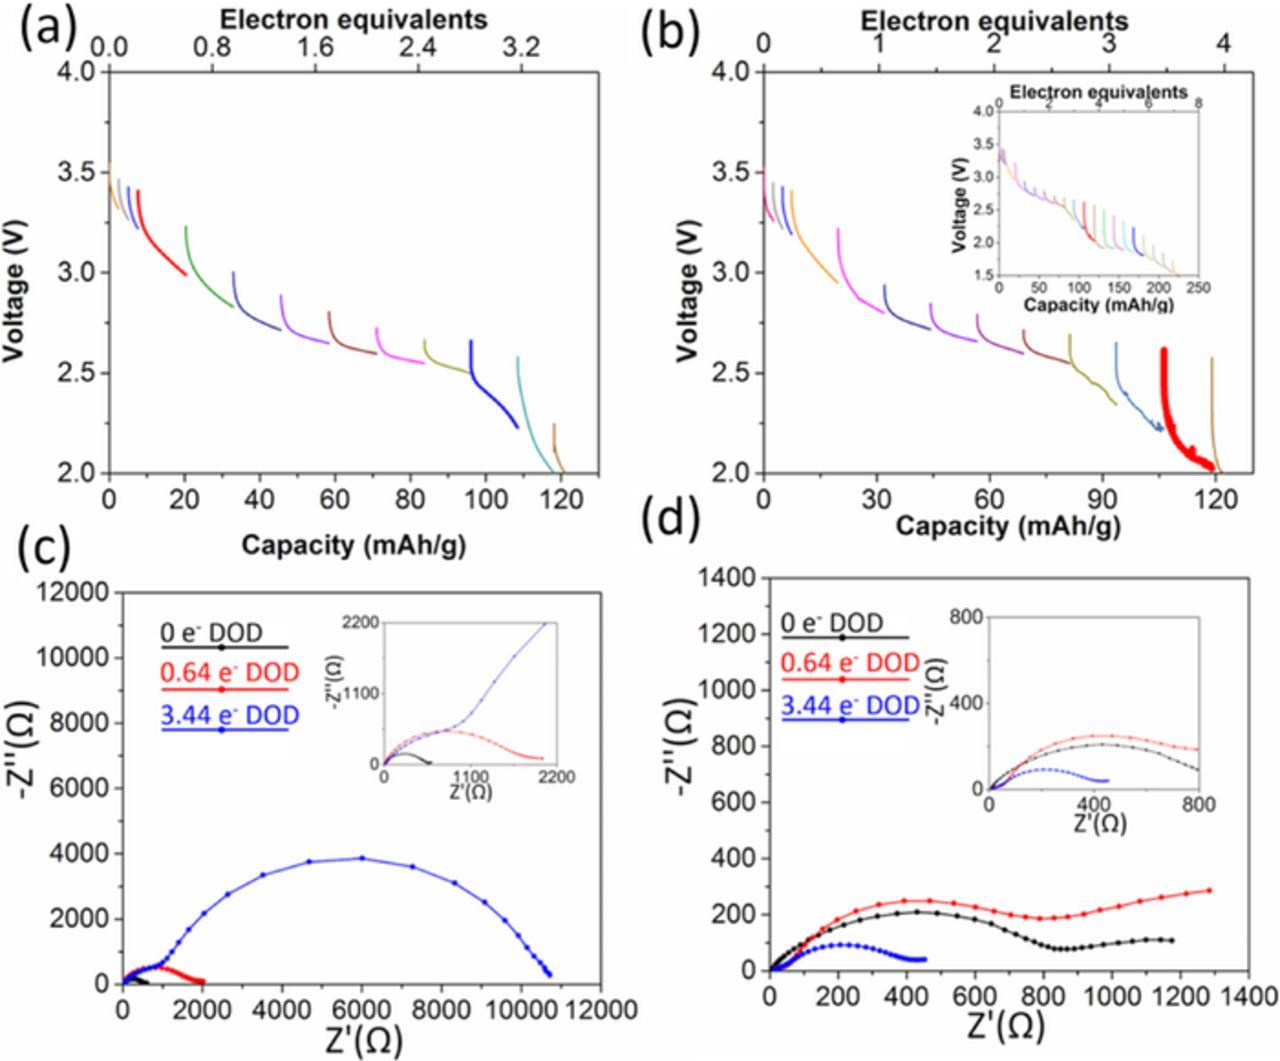
Figure 8. Voltage of (a) Li/Ag1.13Mn8O15.15·1.43Ag2O and (b) Li/Ag1.54Mn8O15.48·1.43Ag2O electrochemical cells discharged under galvanotatic control. Nyquist plots of (c) Ag1.13Mn8O15.15·1.43Ag2O and (d) Ag1.54Mn8O15.48·1.43Ag2O cells before and after the battery test.
Table III. Results of fit of AC impedance data to resistance elements of equivalent circuit model shown in Figure 4b inset.
| Materials | DOD | Rs (Ω) (error) | Rm+Rct (Ω) |
|---|---|---|---|
| Ag2O | 0 e− | 14 (3%) | 3E5 |
| 0.02 e− | 10 (1%) | 503 | |
| 0.56 e− | 7 (1%) | 176 | |
| Ag1.13Mn8O15.15 | 0 e− | 4 (4%) | 2717 |
| 0.08 e− | 10 (2%) | 5251 | |
| 0.64 e− | 11(4%) | 30306 | |
| Ag1.54Mn8O15.48 | 0 e− | 25 (18%) | 975 |
| 0.08 e− | 46 (16%) | 465 | |
| 1.44 e− | 62 (5%) | 7025 | |
| Ag1.13Mn8O15.15·0.25Ag2O | 0 e− | 3 (1%) | 450 |
| 0.24 e− | 4 (2%) | 1468 | |
| 1.04 e− | 11 (2%) | 10923 | |
| Ag1.54Mn8O15.48·0.25Ag2O | 0 e− | 4 (4%) | 511 |
| 0.64 e− | 10 (1%) | 788 | |
| 1.44 e− | 37 (2%) | 60655 | |
| Ag1.13Mn8O15.15·0.63Ag2O | 0 e− | 5 (9%) | 883 |
| 1.44 e− | 9 (2%) | 348 | |
| 3.44 e− | 3 (11%) | 4891 | |
| Ag1.54Mn8O15.48·0.63Ag2O | 0 e− | 5 (9%) | 1266 |
| 3.84 e− | 35 (4%) | 4047 | |
| 7.44 e− | 27 (2%) | 1344 | |
| Ag1.13Mn8O15.15·1.43Ag2O | 0 e− | 9 (15%) | 314 |
| 0.64 e− | 2 (21%) | 1954 | |
| 3.44 e− | 3 (11%) | 10980 | |
| Ag1.54Mn8O15.48·1.43Ag2O | 0 e− | 2 (56%) | 1031 |
| 3.84 e− | 7 (44%) | 1001 | |
| 5.84 e− | 5 (47%) | 386 |
A pure Ag2O cathode was characterized as a control. The voltage profile is shown in Figure 4a, where the initial loaded voltage of 2.96 V recovers to 3.1–3.2 V within the first 0.004 molar electron equivalents of reduction. This phenomenon of voltage increase upon reduction has been observed previously in the discharge of Ag2VO2PO4 and was attributed to Ag0 nanoparticle formation,32 with concomitant decrease in resistance. For the Li/Ag2O cell, ∼1000-fold reduction in impedance was observed upon reduction by 0.02 molar electron equivalents (501 Ω) compared to that before discharge (339560 Ω), Figure 4b. Discharge continues with two voltage plateaus, at ∼3.1 V, and 2.2 V until ∼0.52 electron equivalents (∼65 mAh/g) followed by a steeper decrease. Notably, cell resistance continued decreasing with depth of discharge to a final value of 176 Ω at a voltage of 1.5 V. Above 2.2 V, Ag2O contribution to capacity (20 mAh/g, 0.17 electron equivalents) is small. For the electrode sample with maximum Ag2O content (Ag1.54Mn8O15.48·1.43Ag2O), a maximum contribution to capacity of 6 mAh/g above 2.2 V can be ascribed to Ag2O based on mass.
The discharge profiles of pure pellets comprised of only Ag1.13Mn8O15.15 or Ag1.54Mn8O15.48 materials are shown in Figures 5a and 5b, respectively. Both hollandite materials show abrupt decreases in their voltages upon initial reduction. Above 2.2 V, Ag1.13Mn8O15.15 discharges 0.24 electron equivalents and delivers 8 mAh/g capacity. In contrast, Ag1.54Mn8O15.48 delivers 1.04 electron equivalents and 31 mAh/g. This is the first direct observation of hollandite with high Ag content delivering higher capacity during electrochemical reduction compared to low Ag content hollandite.27 This observation may be attributed to limited electronic conductivity, as shown in the AC impedance of Ag1.13Mn8O15.15 and Ag1.54Mn8O15.48 before and after discharge in Figures 5c and 5d. The initial impedance is ∼3000 Ω and ∼1000 Ω for Ag1.13Mn8O15.15 and Ag1.54Mn8O15.48, respectively. Upon discharge to 0.08 electron equivalents the impedance for the Ag1.13Mn8O15.15 cell increased to ∼5000 Ω while the impedance for Ag1.54Mn8O15.48 decreased to ∼500 Ω. Further reduction led to increased impedance in both cases with a more significant increase for Ag1.13Mn8O15.15 at a lower molar electron equivalent than Ag1.54Mn8O15.48 (see Table III).
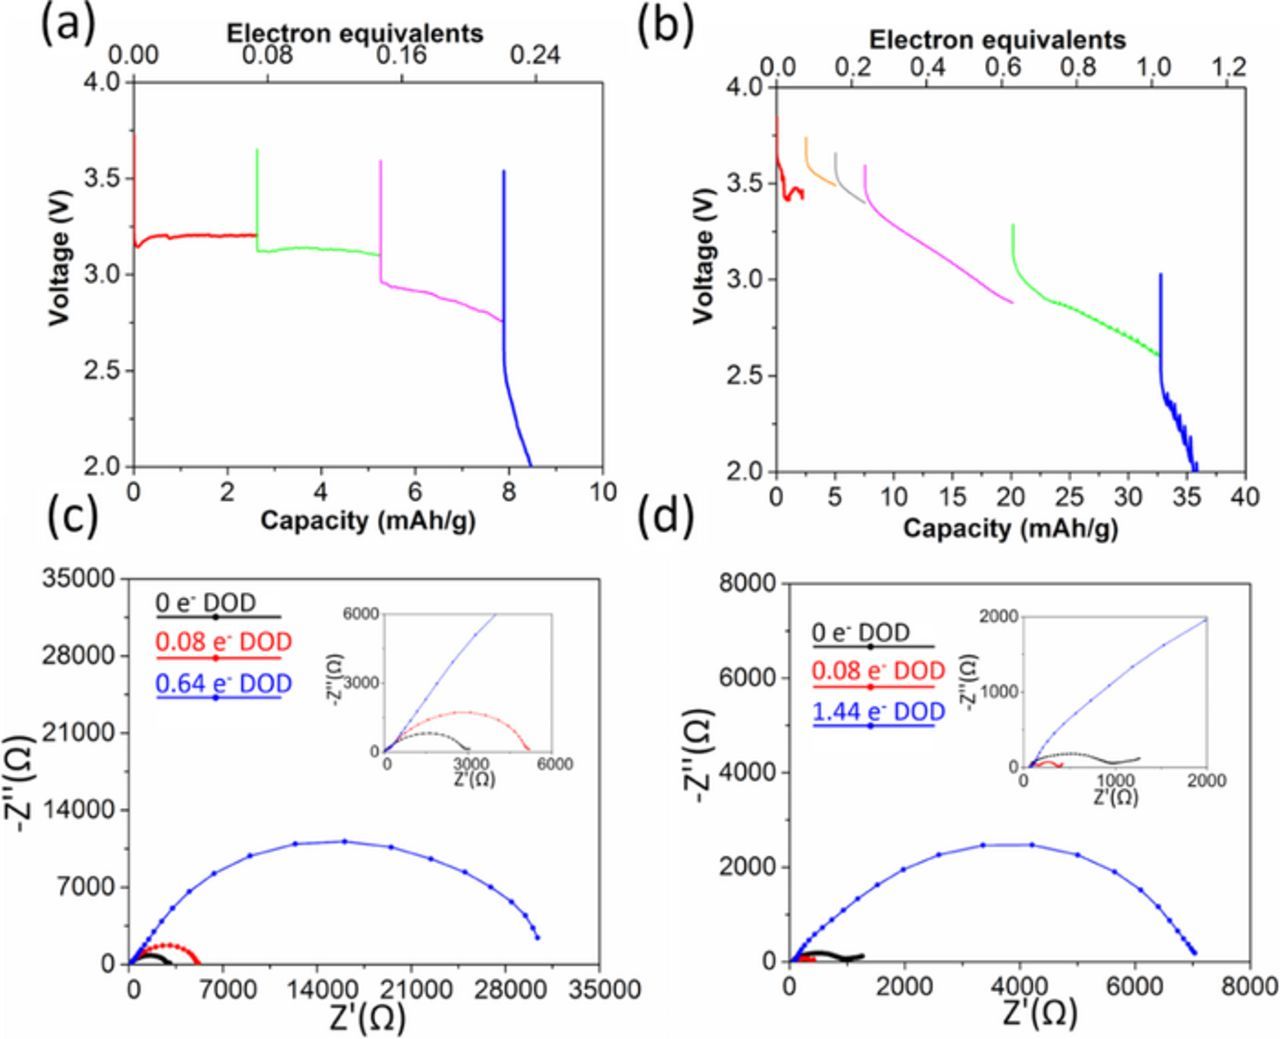
Figure 5. Voltage of (a) Li/Ag1.13Mn8O15.15 and (b) Li/Ag1.54Mn8O15.48 electrochemical cells discharged under galvanostatic control. Nyquist plots of (c)Ag1.13Mn8O15.15 and (d) Ag1.54Mn8O15.48 cells before and after the battery test.
Lithium cells using Ag1.13Mn8O15.15·0.25Ag2O or Ag1.54Mn8O15.48·0.25Ag2O as cathodes showed sloping voltage profiles with discharge, Figures 6a and 6b. Above 2.2 V, Ag1.54Mn8O15.48·0.25Ag2O delivered the higher capacity, 46 mAh/g, compared to 30 mAh/g for Ag1.13Mn8O15.15·0.25Ag2O, higher than that of Ag1.54Mn8O15.48 and Ag1.13Mn8O15.15 (31 mAh/g and 8 mAh/g, respectively). The Nyquist plots for the cells are shown in Figures 6c and 6d. The initial impedance is ∼500 Ω for both materials (Table III), which represents a substantial decrease relative to the uncoated silver hollandite. Notably, the impedance increases with discharge. For Ag1.13Mn8O15.15·0.63Ag2O and Ag1.54Mn8O15.48·0.63Ag2O, (Figures 7a and 7b) the initial loaded voltage of 3.19 V and 3.23 V recovers to 3.23 V and 3.32 V within the first 0.01 electron equivalents of inserted Li+. With further discharge, the voltage profiles of both materials slope, and the Ag1.13Mn8O15.15 structure now outperforms Ag1.54Mn8O15.48, delivering ca. 90 vs. 65 mAh/g above 2.2 V. This correlates with an observed reduced impedance during initial discharge for Ag1.13Mn8O15.15 (Figure 7c). We note both Ag1.13Mn8O15.15·0.63Ag2O and Ag1.54Mn8O15.48·0.63Ag2O showed an increase in impedance with continued discharge (Table III), further suggesting Mn reduction rather than continued formation of Ag0.
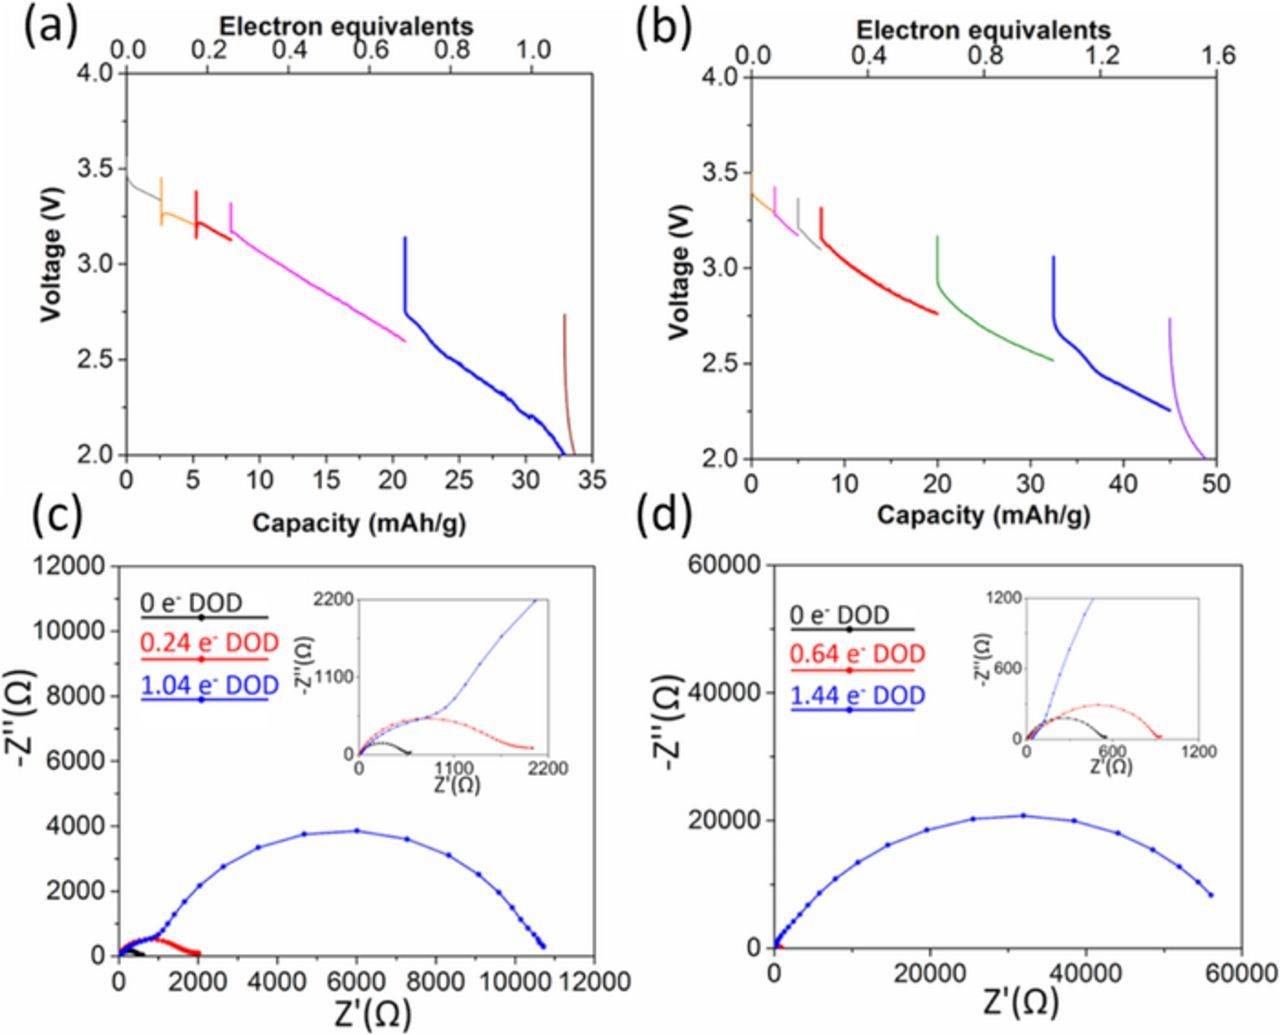
Figure 6. Voltage of (a) Li/Ag1.13Mn8O15.15·0.25Ag2O and (b) Li/Ag1.54Mn8O15.48·0.25Ag2O electrochemical cells discharged under galvanostatic control. Nyquist plots of (c) Ag1.13Mn8O15.15·0.25Ag2O and (d) Ag1.54Mn8O15.48·0.25Ag2O cells before and after the battery test.
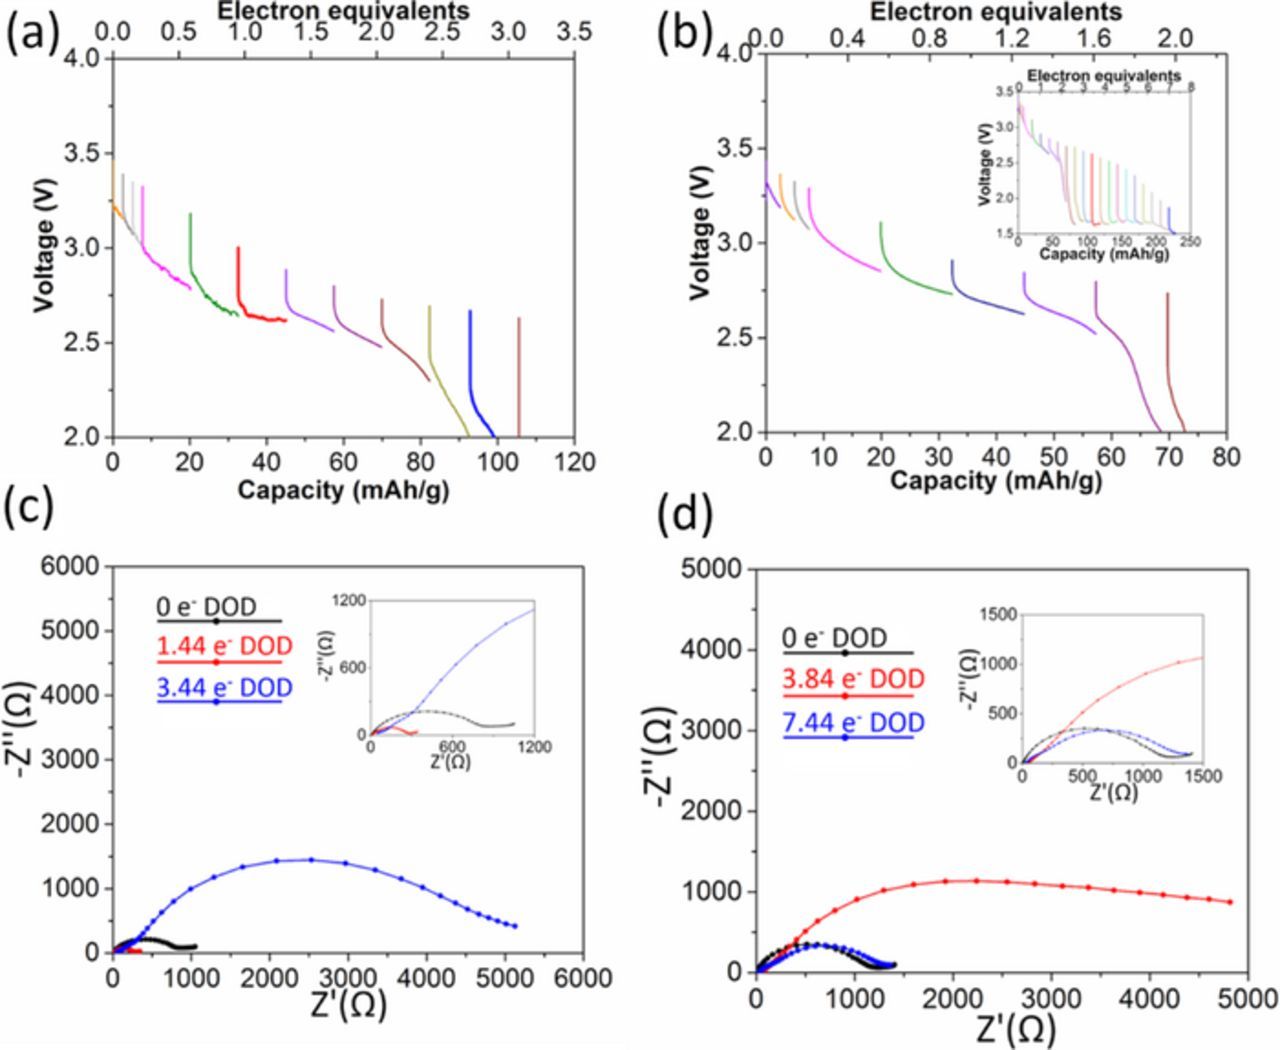
Figure 7. Voltage of (a) Li/Ag1.13Mn8O15.15·0.63Ag2O and (b) Li/Ag1.54Mn8O15.48·0.63Ag2O electrochemical cells discharged under galvanostatic control. Nyquist plots of (c) Ag1.13Mn8O15.15·0.63Ag2O and (d) Ag1.54Mn8O15.48·0.63Ag2O cells before and after the battery test.
The discharge profiles of Ag1.54Mn8O15.48·1.43Ag2O and Ag1.13Mn8O15.15·1.43Ag2O are shown in Figures 8a and 8b. Both curves showed sloping profiles, and above 2.2 V Ag1.13Mn8O15.15 yielded higher capacity than Ag1.54Mn8O15.48. Notably, above 1.5 V the capacity of the Ag1.54Mn8O15.48·1.43Ag2O cell reaches 230 mAh/g, which is the highest value of all the cells discussed above. The high capacity can be attributed to significantly lower impedance at high levels of discharge (Table III), concurrent with the appearance of Ag metal by XRD (Figure 9).
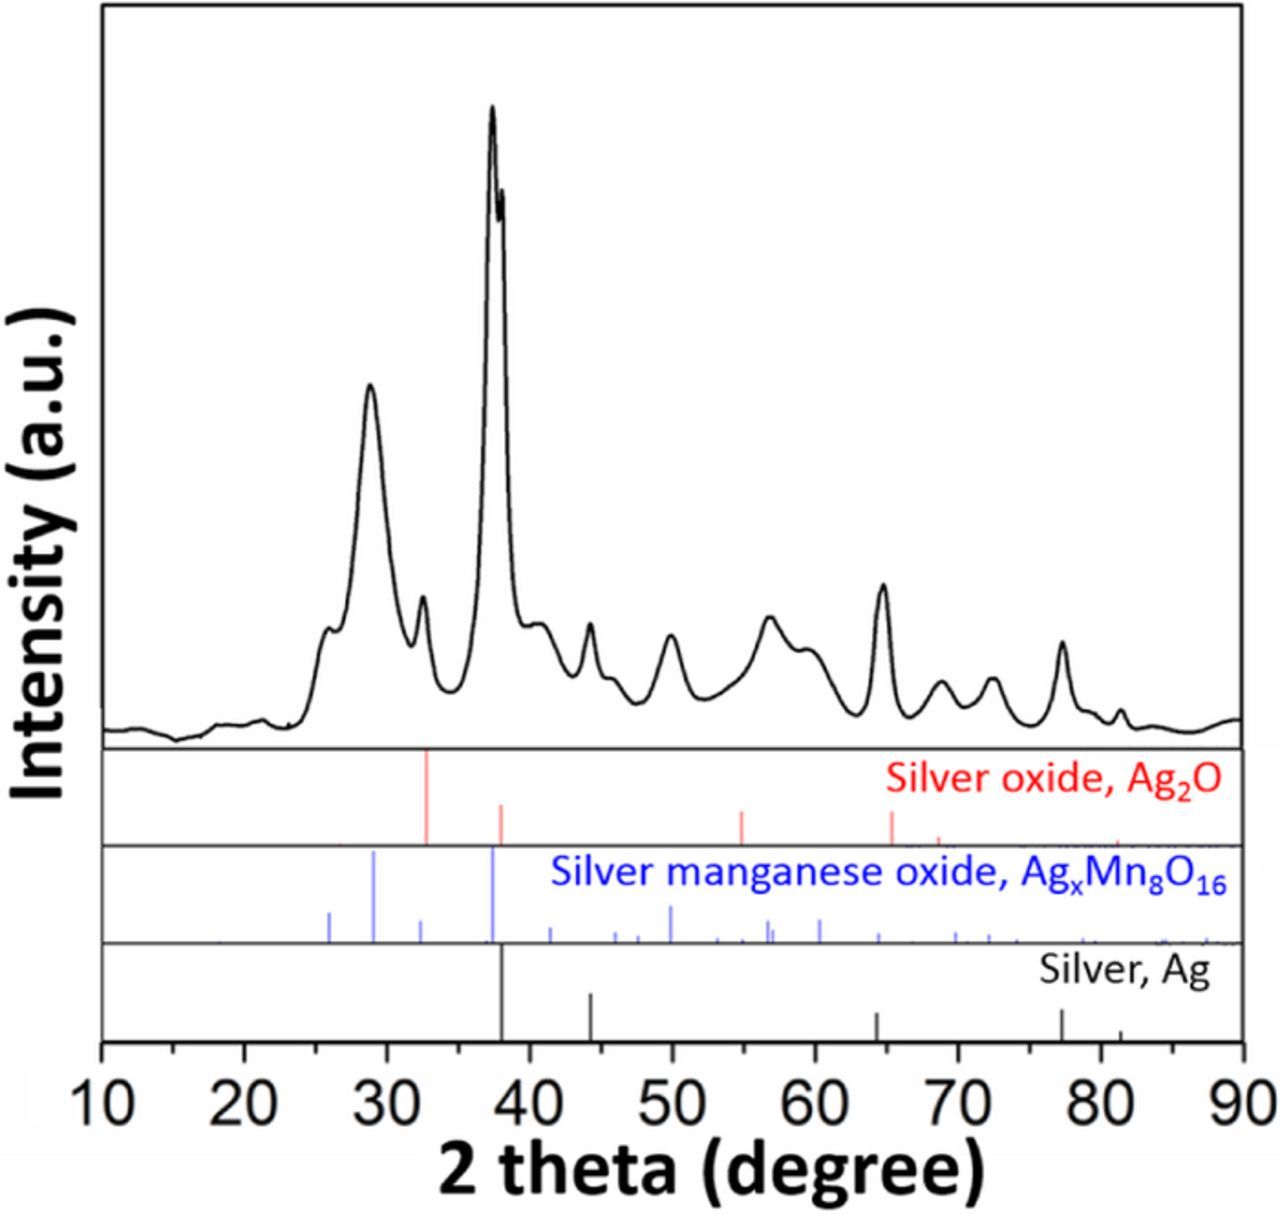
Figure 9. XRD patterns of Ag1.54Mn8O15.48·1.43Ag2O after discharging to 3.2 e−.
A plot of energy density above 2.2 V vs. the Ag2O content in the pure AgxMn8O16-y materials and the AgxMn8O16-y·aAg2O composites compares the electrochemistry of lower silver (x = 1.13) and higher (x = 1.54) intra-tunnel silver containing materials, Figure 10. For materials with no (a = 0) or low (a = 0.25) Ag2O content, the higher intra-tunnel silver material (x = 1.54) exhibits higher energy density, which can be ascribed to 2–10x lower impedance values. At higher Ag2O values (a = 0.63 or 1.43) the lower intra-tunnel silver material (x = 1.13) exhibits higher energy density as well as lower impedance. Thus, despite the lower amount of silver, Li+ conduction becomes a more significant contributor to deliverable energy density once electron conduction is available. This trend generally holds for delivered capacity for the series of materials as well, Figure 10 inset.
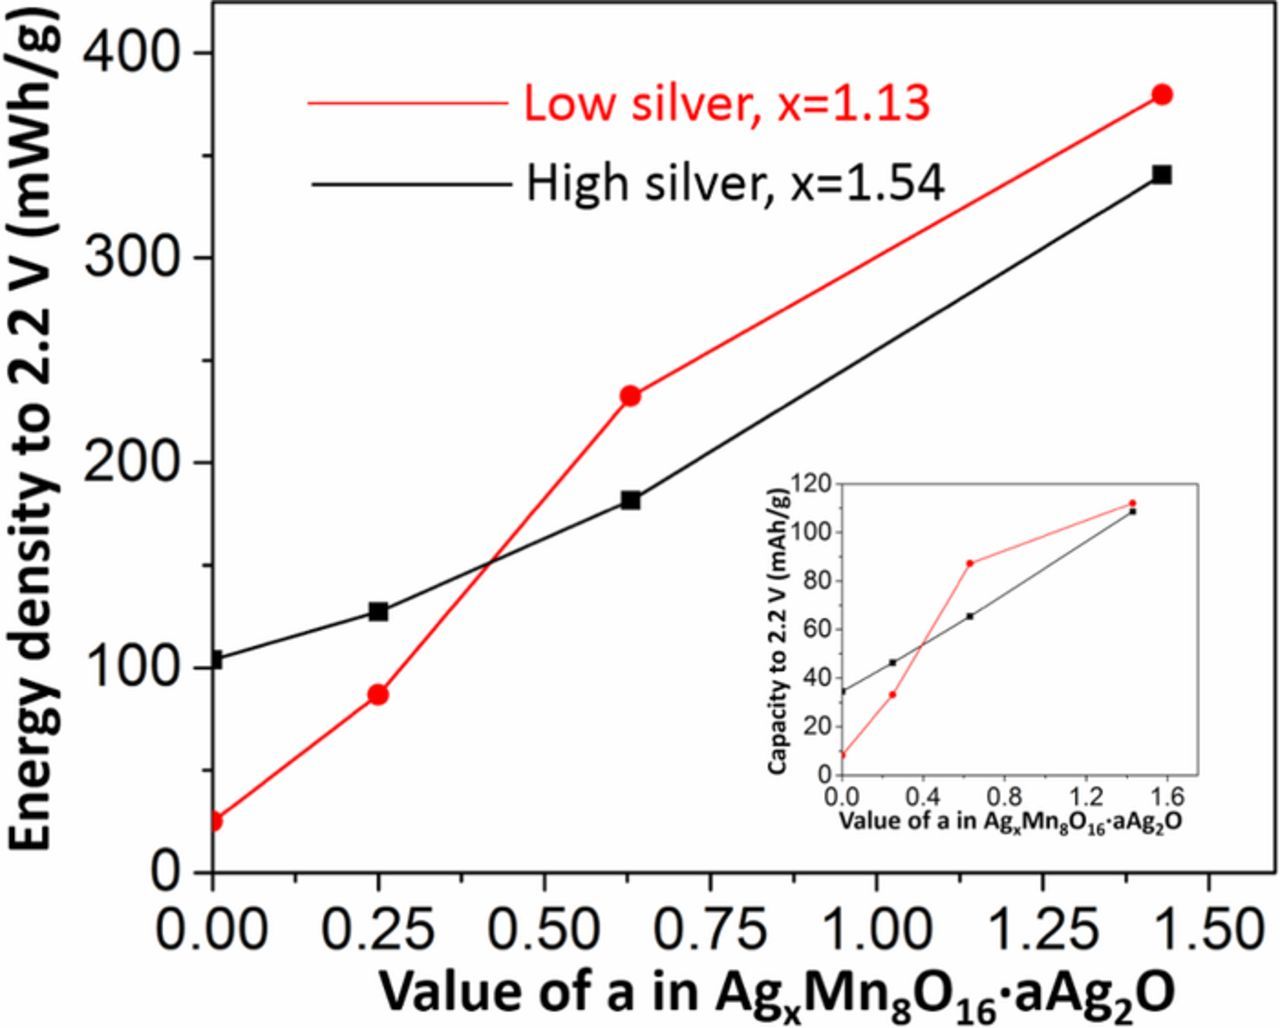
Figure 10. The relationship between Ag2O content and the energy density above 2.2 V for two hollandites of different tunnel Ag concentration, inset: the relationship between Ag2O content and the capacity.
Conclusions
We have shown that a coprecipitation method allows for coating silver oxide on silver hollandite nanorods, preparing AgxMn8O16-y·aAg2O composites. XRD, FT-IR and TEM confirm the presence of Ag2O on the surface of the as-synthesized samples. The ratio of AgxMn8O16-y to Ag2O in each sample was quantified using ICP-OES results. Electrochemical measurements under intermittent galvanostatic discharge and AC impedance indicate that the impedance of the AgxMn8O16-y·aAg2O composites is lower than the pure AgxMn8O16-y. A capacity as high as 230 mAh/g was delivered by the Ag1.54Mn8O15.48·1.43Ag2O composite. The quantity of Ag+ in the tunnel correlates with increased capacity under conditions of limiting electron access where Ag1.54Mn8O15.48 delivers higher capacity than Ag1.13Mn8O15.15. For the Ag2O containing composites, with low levels of Ag2O (a = 0.25) Ag1.54Mn8O15.48·0.25Ag2O delivers higher capacity than Ag1.13Mn8O15.15·0.25Ag2O. However, with higher levels of Ag2O (a = 0.63 or 1.43) the Ag1.13Mn8O15.15·aAg2O composites deliver higher capacity. This study illustrates that Ag2O coatings can significantly impact functional electrochemistry through contribution to reduced impedance and can lend insight into the structure/function relationships associated with electrochemistry in electron rich or electron limited environments.
Acknowledgment
This research was supported by the Center for Mesoscale Transport Properties, an Energy Frontier Research Center supported by the U.S. Department of Energy, Office of Science, Basic Energy Sciences, under award #DE-SC0012673. TEM work was supported by the U.S. Department of Energy, Office of Basic Energy Science, Division of Materials Science and Engineering, under Contract No. DE-SC0012704.