Abstract
The kinetics of hydrogen evolution and hydrogen oxidation reactions (HER/HOR) in alkaline electrolyte on Pt/C and a Pt/C/Ni(OH)2 bi-functional electrocatalyst were studied. The objective was to investigate the enhancement of hydrogen evolution activity of Pt in alkaline environments in presence of transition metal hydroxides, and to determine the optimum concentration of Ni(OH)2 to be added to maximize catalytic activity. The catalysts were prepared by mixing colloidal dispersions of nanosized Ni(OH)2 with a commercially-sourced Pt/C catalyst dispersed in water. Rotating disk electrode (RDE) measurements were performed in 0.1 M KOH at temperatures ranging from 273.15 K to 303.15 K, and the HOR/HER kinetic currents, obtained after IR and mass transport corrections, were fitted using the Butler-Volmer equation to estimate the exchange current densities at each temperature. Arrhenius plots showed very similar activation energies for Pt/C (35 ± 6 kJ/mol) and the bi-functional catalysts (38 ± 6 kJ/mol) –Pt/C/X%Ni(OH)2. The maximum exchange current density (2.44 ± 0.07 mA cm−2Pt at 303.15 K) was obtained with the catalyst containing 10 wt% Ni(OH)2, and was 2.4 times higher than for Pt/C (1.03 ± 0.07 mA cm−2Pt at 303.15 K). The bi-functional catalysts were evaluated in a hydroxide-exchange membrane water electrolyzer operated with ultrapure water, and outperformed Pt/C by about 0.15 V across the entire current density range.
Export citation and abstract BibTeX RIS

This is an open access article distributed under the terms of the Creative Commons Attribution 4.0 License (CC BY, http://creativecommons.org/licenses/by/4.0/), which permits unrestricted reuse of the work in any medium, provided the original work is properly cited.
There are ongoing efforts to develop stable anion exchange membranes (AEMs) to be employed as solid electrolytes in alkaline membrane fuel cells (AMFCs), hydroxide-exchange membrane water electrolyzers and in other alkaline electrochemical devices, so as to take advantage of the distinct and attractive benefits of operating in alkaline environments.1–3 These advantages include the possibility of using cheaper non-platinum-group-metal (non PGM) electrocatalysts for both the hydrogen evolution/oxidation (HER/HOR) and the oxygen evolution/reduction reactions (OER/ORR), the option to employ stainless steel flow fields and endplates (with the subsequent reduction in costs), and more flexibility in the choice of fuels.1,4,5 However, operation in alkaline electrolyte has also important drawbacks, especially the sluggish kinetics for the HER/HOR. This problem is an important aspect currently affecting alkaline water electrolyzers and chlor-alkali electrolyzers, both of which can benefit from the development of efficient HER catalysts with optimum performance under alkaline operation.6,7
The low concentration of protons in alkaline electrolytes and the lower activity of noble metals toward HER/HOR are the main reasons contributing to the sluggish hydrogen evolution (HER) reaction in alkaline electrolyte.8–13 Pt electrocatalysts, show considerably lower activity in alkaline electrolyte when compared to acidic electrolyte.14–18 The commonly accepted mechanism for hydrogen evolution in alkaline electrolyte involves the following two steps:15
![Equation ([1])](https://content.cld.iop.org/journals/1945-7111/164/13/F1307/revision1/d0001.gif)
![Equation ([2])](https://content.cld.iop.org/journals/1945-7111/164/13/F1307/revision1/d0002.gif)
![Equation ([3])](https://content.cld.iop.org/journals/1945-7111/164/13/F1307/revision1/d0003.gif)
where * stands for the catalyst free active site, and Had for the H atoms adsorbed onto the catalyst active site. It is generally accepted that the Volmer step is the rate determining step (r.d.s.) for the overall reaction under alkaline conditions. Under these assumptions, the kinetic expression for HER/HOR in alkali resembles the Butler–Volmer equation:19
![Equation ([4])](https://content.cld.iop.org/journals/1945-7111/164/13/F1307/revision1/d0004.gif)
where ik is the kinetic current density for the catalysts under evaluation (mA/cm2Pt; i0 the exchange current density (mA/cm2Pt); β is the symmetry factor, which is near 0.5 in the overpotential range observed in HER/HOR;20 F is Faraday's constant (96,485 C/mol); R is the gas constant (8.3144 J/mol K); T is the absolute temperature (K); and η is the reaction overpotential (V).
The reaction pathways are similar in acidic and alkaline electrolytes, but because of the activated water dissociation step, the HER activities for most catalysts in alkaline electrolyte are usually about two orders of magnitude lower than in acid.16,18,21,22 In contrast to the fast kinetics of the hydrogen evolution/oxidation reactions on Pt in acidic electrolyte that makes quantification experimentally difficult, the lower reaction rates under alkaline conditions make the accurate measurement of the kinetic parameters feasible. The very large exchange current density (i0) for the HER/HOR on Pt in acid electrolytes leads to a wide range of experimental values being reported in the literature. For example, HOR exchange current densities measured by the rotating disk electrode technique were reported to be on the order of 1 mA cm−2Pt.16,23,24 Gasteiger and coworkers, have clearly demonstrated, that after iR correction, the experimental current of the HOR/HER could not be distinguished from the Nernstian diffusion overpotential, and because the latter assumes infinitely fast reaction kinetics, it is not reasonable trying to extract kinetic rates for the HOR/HER on Pt in acid using RDE kinetic data.25,26 However, microelectrode measurements on Pt/C,27 Pt(polycrystalline),26 or Pt/C-based gas-diffusion electrodes28 can be employed to obtain more accurate values for HER/HOR exchange current densities. The values reported by employing these techniques were in the range from 24 to 50 mA/cm2Pt.26–28
Markovic and coworkers as well as Feliu and coworkers have performed extensive studies of Pt activity on low-index single-crystal Pt surfaces to obtain useful kinetic information not accessible when studying polycrystalline surfaces.15,16,21,29–38
In the case of HER HER & HOR, the analysis of the oxidation peaks in the cyclic voltammograms revealed two types of adsorbed hydrogen on the surface of the Pt crystals: 1) a highly-bonded state, equivalent to under-potential deposited hydrogen that it is not involved in the reaction but has a blocking effect; and 2) a weakly bonded intermediate involved in the reaction. The reaction rate depends on the availability of free surface Pt sites to permit the dissociation of H2 (HOR) or the recombination of weakly bonded Had intermediates (HER). Since the coverage of Pt surface by Had is potential dependent, so is the reaction rate. The results showed that the HER and HOR activity increased in the order [(110) > (100) > (111)]. The activity of Pt (110) facets was considerably larger that for the other single-crystal surfaces, and almost matched the results obtained by other authors for polycrystalline Pt in alkaline electrolytes (KOH and NaOH).17,26,39 Their model describes the kinetic data and the trends observed reasonably well, but it has some difficulties in explaining the large activity obtained on the (110) orientation when compared with (100) and (111) orientations, in the presence of Pt surfaces fully covered by adsorbed species.
Danilovic and coworkers showed that Ni electrodes modified by deposition of Ni(OH)2 nanoclusters had four times higher HER activity than bare Ni surfaces.8 A similar boost of HER rates (of different magnitudes) was observed for related transition metals (V and Ti), group 10 (Ru, Ir, and Pt), and group 11 metals (Cu, Ag, Au). The higher activity on the Ni(OH)2/M surfaces (3–5 times more than on the bare M surfaces) was explained by the authors as a consequence of the dissociation of water being promoted at the edges of Ni(OH)2 clusters. The adsorbed hydrogen then diffuses onto the Pt active sites, where it recombines to generate hydrogen. Reducing the barrier for water dissociation results in reaction rates approaching those in acid electrolytes. The assumptions under this mechanism imply that the presence of a bi-functional catalyst with hydrophilic domains promotes the dissociation of water and the production of hydrogen intermediates that then adsorb onto the nearby Pt surfaces (and recombine into molecular hydrogen), thereby enhancing the overall HER reaction. Such an effect has been observed by several authors employing bi-functional catalysts containing transition metal oxides (i.e. nickel hydroxide) co-deposited onto platinum, iridium, ruthenium and nickel electrocatalysts.8,10
In this study, we investigated the HOR/HER kinetics on Pt/C and Pt/C/X%Ni(OH)2 bi-functional catalysts (with different Ni(OH)2 loadings) at different temperatures using the RDE technique. The primary objective was to study the enhancement of HER activity of Pt catalysts in alkaline environments in the presence of Ni(OH)2, and to determine the optimal concentration of Ni(OH)2 in such catalysts. The best performing (RDE) bi-functional catalysts were evaluated in a hydroxide-exchange membrane water electrolyzer operated with ultrapure water to demonstrate its practical applicability and the significance of the RDE results.
Experimental
Synthesis and characterization of Ni(OH)2 nanoparticles
Nickel hydroxide was synthesized following the method described by Sutto.12 The reaction of potassium superoxide with a nickel acetate solution result in the formation of near unit-cell sized nanoparticles. The following procedure yields approximately 4 g of Ni(OH)2 nanopowder: 1) 4.27 g of potassium superoxide (60 mmol; 2-fold molar excess) was added very quickly and under intense stirring to 200 mL of 0.15 M nickel acetate (30 mmol); 2) the resulting suspension was kept under intense stirring for another 2 minutes; 3) 100 mL of methanol was added to quench the reaction and stop nanoparticle growth; 4) the nanoparticles were collected by centrifugation (at 14,000 rpm for 15 min) and washed with deionized water until the wash water had a neutral pH. The solid was dried in a vacuum oven at 30°C and stored until its use.
Deposition of Ni(OH)2 on Pt/C catalyst
The preparation of the Pt/C/Ni(OH)2 catalyst comprised three steps: 1) the synthesis of nano-sized nickel hydroxide, 2) the suspension of the nickel hydroxide and commercial Pt/C (46.1%Pt on high surface area carbon; TEC10E50E from Tanaka K. K.) in water, and c) the mixing of both suspensions followed by drying to obtain the bi-functional catalyst. To synthesize Pt/C/10%Ni(OH)2 catalyst, 0.25 g of nano-sized Ni(OH)2 was suspended in 150 mL of deionized water, sonicated for 2 hours in an ice bath to get a well-dispersed and homogeneous colloidal suspension (Horn sonicator, QSonica), and mixed with 1 g of Pt/C suspended in another 150 mL of deionized water (previously dispersed by sonication for 5 min). The suspension was stirred overnight to allow the Ni(OH)2 to adsorb onto the Pt/C catalyst. Finally, the water was removed using a rotavapor (60°C under vacuum) to obtain the Pt/C/10%Ni(OH)2 catalyst.
Rotating ring disk experiments
The HER/HOR reaction rates on Pt/C and Pt/C/X%Ni(OH)2 were measured electrochemically using a rotating disk electrode (RDE). The electrochemical characterization was performed in a three-compartment electrochemical cell in hydrogen-saturated 0.1 M potassium hydroxide electrolyte at temperatures ranging from 273.15 K to 303.15 K. The temperature was controlled by using a jacketed glass electrochemical cell and a thermostatic bath. The RDE setup comprised a glassy carbon disk (d = 5 mm; 0.1964 cm2) as the primary working electrode, a saturated silver/silver chloride (Ag/AgCl) as the reference electrode, and a Pt mesh as the counter electrode. The GC electrode was attached to a rotator (Pine Instruments) to control the rotation rate, and the potential was controlled using a Solarton multichannel potentiostat (model 1480 Multistat). Note: We have selected to work with a Pt counter electrode as it is highly improbable that Pt oxidation and dissolution from the counter electrode would occur in an alkaline electrolyte (KOH), without the presence of Pt complexing anions (i.e. chloride), and at potentials of less than 0.25 V vs. RHE.
The catalyst (Pt/C or Pt/C/X%Ni(OH)2) was deposited onto the GC electrode using the following protocol. A catalyst ink was prepared by sonication (QSonica Q700 sonicator) of 26.7 mg of Pt/C, 9.5 mL of ultrapure water, 3 mL of isopropanol, and 250 μL of Nafion solution (Sigma Aldrich; equivalent weight 1100, 5 wt% solution in aliphatic alcohols). The Nafion solution employed in the experiments was previously neutralized (to avoid the acidity of Nafion affecting the reaction environment) by adding a stoichiometric amount of 1 M KOH. The function of the Nafion (potassium form) is to act as binder for the electrode components to avoid the catalyst falling off the RDE electrode during rotation. Nafion-bonded electrodes are known to have good gas permeabilities (characteristic of perfluorinated backbones) and are hence suitable for electrode manufacture. The hydroxide ion conduction is provided by the supporting electrolyte (0.1M KOH). Neutralized Nafion is widely employed as binder in RDE experiments to evaluate catalyst activity in alkaline environments.13,25,40–42
The ink was diluted 1:10 with 24 vol% isopropanol/water and sonicated to assure a proper dispersion of the catalyst. The GC was polished with 0.05 μm alumina slurry (Pine Instruments) for at least 10 minutes to achieve a mirror-like finish. 10 μL of well-dispersed, diluted catalyst ink was deposited onto a freshly polished GC electrode using a micropipette. The ink was dried with the electrode rotating at 300 rpm in an inverted position, to prevent particle settling and/or aggregation, and to yield uniform electrode films .43 This thin-film electrode, with a Pt loading of 5 μg cm−2disk was employed as the working electrode for the experiments below. A similar procedure was employed to deposit the Pt/C/X%Ni(OH)2 catalyst.
To get the polarization curves for HOR/HER, the potential of the working electrode was swept from −0.4 V to −1.2 V vs. Ag/AgCl at a scan rate of 5 mV s−1. All the potentials in this work are referenced vs. the reversible hydrogen electrode (RHE). However, a Ag/AgCl reference electrode was used for convenience in the experiments. A calibration of the Ag/AgCl electrode vs. the RHE was done prior to the start of the experiments (RHE = Ag/AgCl + 0.973 V). The corresponding disk current, representing the rates for HOR and/or HER was measured. The applied potentials (EAppl) were IR corrected (EIR Corr) using the following equation:
![Equation ([5])](https://content.cld.iop.org/journals/1945-7111/164/13/F1307/revision1/d0005.gif)
where I was the current and Rhf was the high frequency resistance measured using impedance spectroscopy. The cell resistance was measured immediately after RDE measurements using impedance spectroscopy. The measurement was done at open circuit potential (DC current of 0) by applying an AC voltage perturbation of 15 mV, in the frequency range 100 kHz to 0.1 Hz. The intercept of the impedance with the real axis at high frequencies (Rhf) was taken as the cell resistance and was used to obtain the iR-free potential of the working electrode. The cell resistances were measured for each experiment but were approx. 65 Ω at 275.15 K and decreased to about 35 Ω at 303.15 K.
The measurements were performed at disk rotation rates of 400, 900, 1600 and 2500 rpm. The data from the kinetic and mixed-control regions was used in further kinetic analysis. Mass-transport effects in the measured currents were removed by employing the following equation (quasi-reversible reaction):44
![Equation ([6])](https://content.cld.iop.org/journals/1945-7111/164/13/F1307/revision1/d0006.gif)
where i is the current density,  , α is the symmetry factor (1-electron reaction), i0 is the exchange current density, F is the Faraday constant, ν is the kinematic viscosity of the electrolyte, DO is the diffusion coefficient for the oxidized species, DR is the diffusion coefficient for the reduced species, CO* is the bulk concentration of the oxidized species (far from the electrode surface), CR* is the bulk concentration of the reduced species, and ω is the RDE rotation rate. We wish to highlight that the current density (i) in Equations 6 and 7 is based on the Pt surface area (electrochemically active area of the Pt catalyst). The equation shown above can be also be expressed as follows:
![Equation ([7])](https://content.cld.iop.org/journals/1945-7111/164/13/F1307/revision1/d0007.gif)
Where il, C = 0.62FD2/3Ov− 1/6ω1/2CO*, and il, A = 0.62FD2/3Rv− 1/6ω1/2CR* are the Levich currents for the oxidation and reduction reactions, and B(η) is a constant for each electrode potential. The plot of the inverse of the current (at a fixed electrode potential) vs. the inverse of the square root of the rotation rate yields a straight line whose intercept with the y-axis is the inverse of the kinetic current.
This procedure was employed to remove any mass-transport effects present during HER and HOR and to obtain the kinetic currents shown in the graphs. The exchange current densities for HER/HOR were obtained by fitting the experimental kinetic data to the Butler-Volmer equation. Each catalyst was evaluated at least three times using fresh electrodes for each run. The error bars in the plots represent standard errors.
Hydroxide-exchange membrane water electrolyzer performa-nce
The performance of Pt/C/Ni(OH)2 electrocatalyst was evaluated (and compared with Pt/C) in a hydroxide-exchange membrane water electrolyzer. Electrolyzer experiments were performed in a 25 cm2 single cell (Fuel Cell Technologies Inc.) operating with ultrapure water (18.2 MΩ; Millipore Direct Q5 system). The cell was modified by replacing the original anode graphite plate with a corrosion-resistant titanium plate (with 1 mm × 1 mm single serpentine flow channels) to avoid carbon corrosion.
The membrane electrode assemblies (MEAs) were prepared by sandwiching an anion exchange membrane (Tokuyama A201 AEM; 28 μm) between two gas diffusion electrodes (GDEs), each with an active area of 25 cm2. Note: No heating or mechanical pressing was applied while sandwiching the AEM between the GDEs. GDEs were fabricated by painting the catalyst ink over a gas diffusion layer (GDL) using an airbrush. We used two different GDLs: 1) carbon paper (25BCH from SGL Carbon; Thickness = ∼235 μm) for the cathode side, and 2) a corrosion-resistant porous titanium plate for the anode side (525 μm). The catalyst ink consisted of 0.15 g catalyst, 3.2 g isopropanol/water (1/1 wt) and 1.286 g of 5 wt% solubilized AEM binder (Tokuyama AS-4). The mixture was treated in a horn ultrasonicator (QSonica Q700) for 10 minutes to obtain a homogeneous ink and it was applied to the gas diffusion layers using an airbrush. Pt/C or Pt/C/10%Ni(OH)2 were used as the hydrogen evolution electrocatalysts (cathode); Iridium oxide (B.E.T. surface area of 185 m2g−1) was used as the oxygen evolution electrocatalyst (anode). Electrodes with 0.66 mgPtcm−2 on the cathode and 2.85 mgIrO2cm−2 on the anode were employed. The loading of solubilized AEM binder in the electrodes was 30 wt% (dry weight). The AEM and the GDEs were ion exchanged to the hydroxide form, just before starting the experiments, by immersion in 1M KOH for 2 hours. They were washed with ultrapure water and assembled in a nitrogen environment within a glove bag (Aldrich AtmosBag) to minimize exposure to atmospheric carbon dioxide. The experiment was conducted inside a glove bag filled with nitrogen, with the recirculating water tank under continuous nitrogen bubbling. Ultrapure water was fed to the anode and recirculated to a storage tank, which was maintained at 50°C, at a flow rate of 400 mLmin−1. The absence of water feed at the cathode simplifies the operation and facilitates the recovery of dry hydrogen. The water required for the cathode half reaction (2H2O → H2 + 2OH−) is supplied by diffusion through the membrane from the anode side.
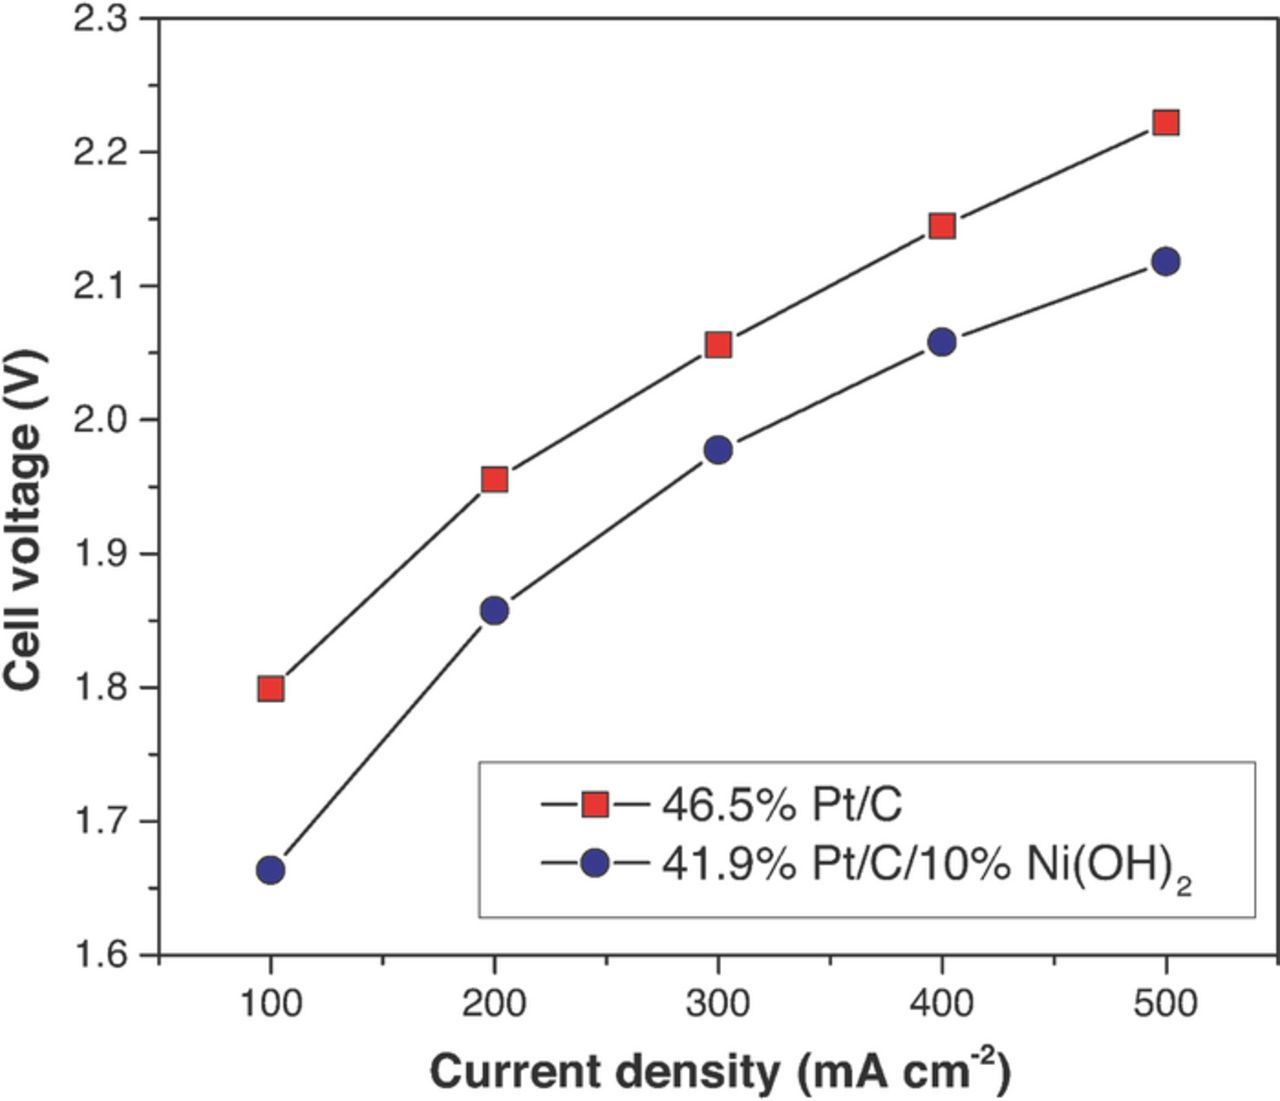
Polarization curves were obtained at 50°C by stepping the current density from 100 mAcm−2 to 500 mAcm−2 in increments of 100 mAcm−2. The system was held at each current for at least 2 minutes to allow pseudo-steady-state conditions. The acquisition was stopped when the cell voltage increased above 2.2 V.
X-ray photoelectron spectroscopy and spectra deconvolution
X-ray photoelectron spectroscopy (XPS) experiments were performed to analyze the electronic environment of the Pt catalysts. The measurements were performed on a Physical Electronics 5000 VersaProbe II Scanning ESCA instrument equipped with an Al Kα (1486.6 eV) X-ray source, with a pass energy of 50 eV. The C 1s peak (284.8 eV) was used as an internal reference to calibrate the absolute binding energy. The peaks were deconvoluted and quantified using Igor Pro (version 7.04) software by employing XPST (X-ray Photoelectron Spectroscopy Tools) fitting macros (Author: Dr. Martin Schmid, Philipps University Marburg). The baseline was subtracted by using a Shirley background function.
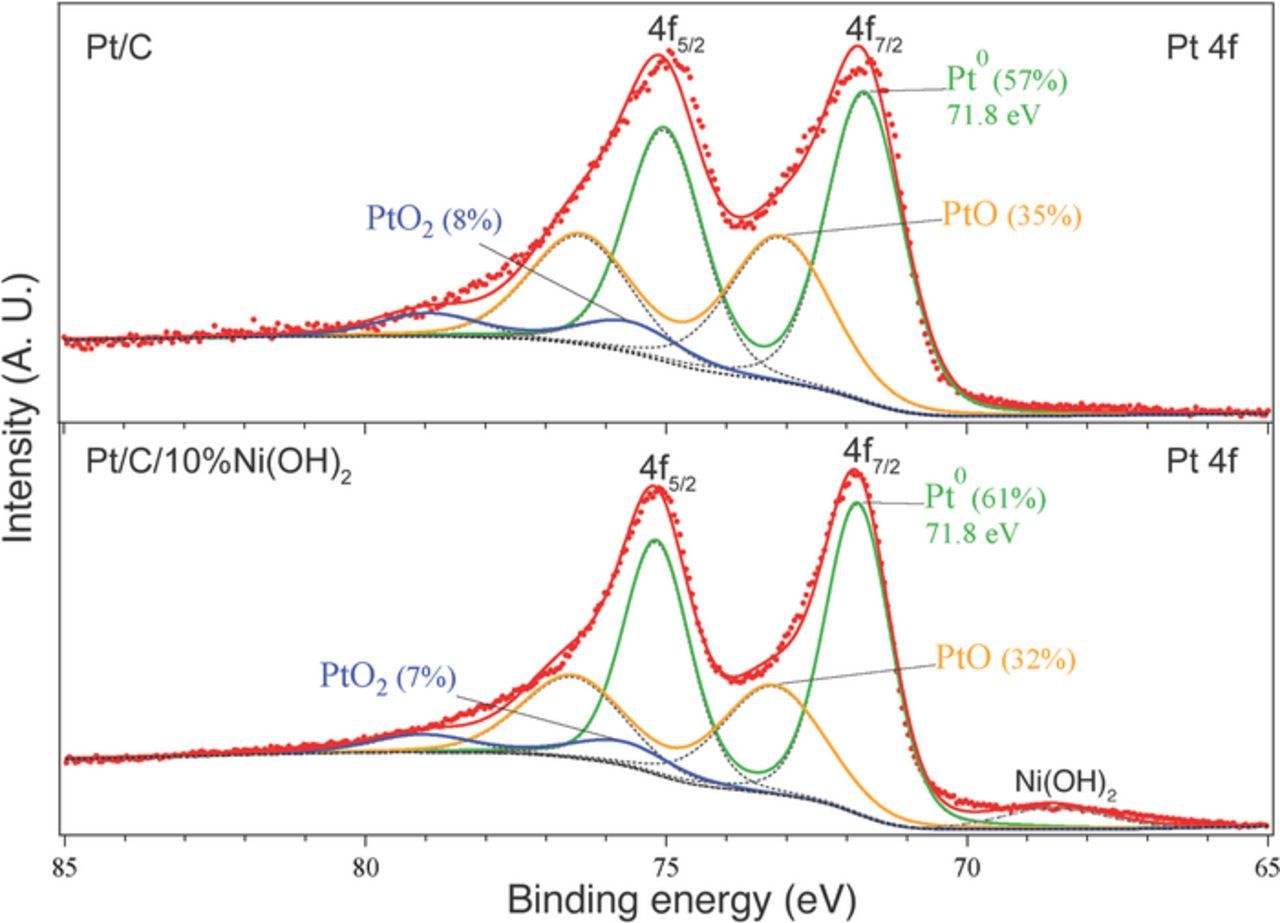
The 4f XPS spectra of Pt (doublet peak shift of 3.33 eV) was fitted in the energy range from 65 to 85 eV to 3 doublet peaks corresponding to: 1) metallic Pt (Pt0, 4f7/2 at 71.8 eV), 2) PtO (Pt2+, shifted 1.4 eV vs Pt0 peak), and 3) PtO2 (Pt4+, shifted 3.9 eV vs Pt0 peak). We found that the position of Pt0 4f7/2 peak was shifted 0.8 eV vs bulk Pt metal (71.0 eV), as a consequence of the presence of very small nanoparticles in the Pt/C catalyst (2–3 nm).
Results and Discussion
Synthesis and characterization of catalyst: X-Ray diffraction (XRD), transmission electron microcopy (TEM), and Pt catalyst electrochemically active surface area (Pt ECSA)
X-ray diffractograms (Figure 1a) were used to confirm the synthesis of nanosized nickel hydroxide and to obtain a quantitative estimate of their crystallite size. The peaks associated with β-nickel hydroxide were observed at 2θ values of 20°, 33°, 38°, 52°, 59°, 62.5°, 70° and 73° representing the (001), (100), (101), (102), (110), (111), (200) and (201) Bragg's reflections of the hexagonal structure of the crystalline lattice (space group P-3 m1).45 XRD peak broadening was employed to estimate crystallite size (Scherrer equation). The presence of broad peaks confirmed the presence of a nanosized material. The anisotropic broadening (i.e. broadening for (001) plane was much more than for the (100) plane), indicating the presence of nanoplatelets with a crystallite size of 9 Å in the c direction (perpendicular to the layers) and 56 Å in the a-b plane. TEM images confirmed the XRD results. Ni(OH)2 nanoparticles with sizes ranging between 10–30 nm were found in the Pt/C/Ni(OH)2 catalysts (see Figure 1b). The Pt/C catalyst had an average Pt particle size of 2.5 nm with a narrow distribution.46 Pt nanoparticles were seen to be uniformly dispersed on the carbon-support for all the Pt/C/Ni(OH)2 catalysts.
Figure 1. a) XRD diffraction patterns of nano-sized Ni(OH)2; b) TEM of the catalysts.
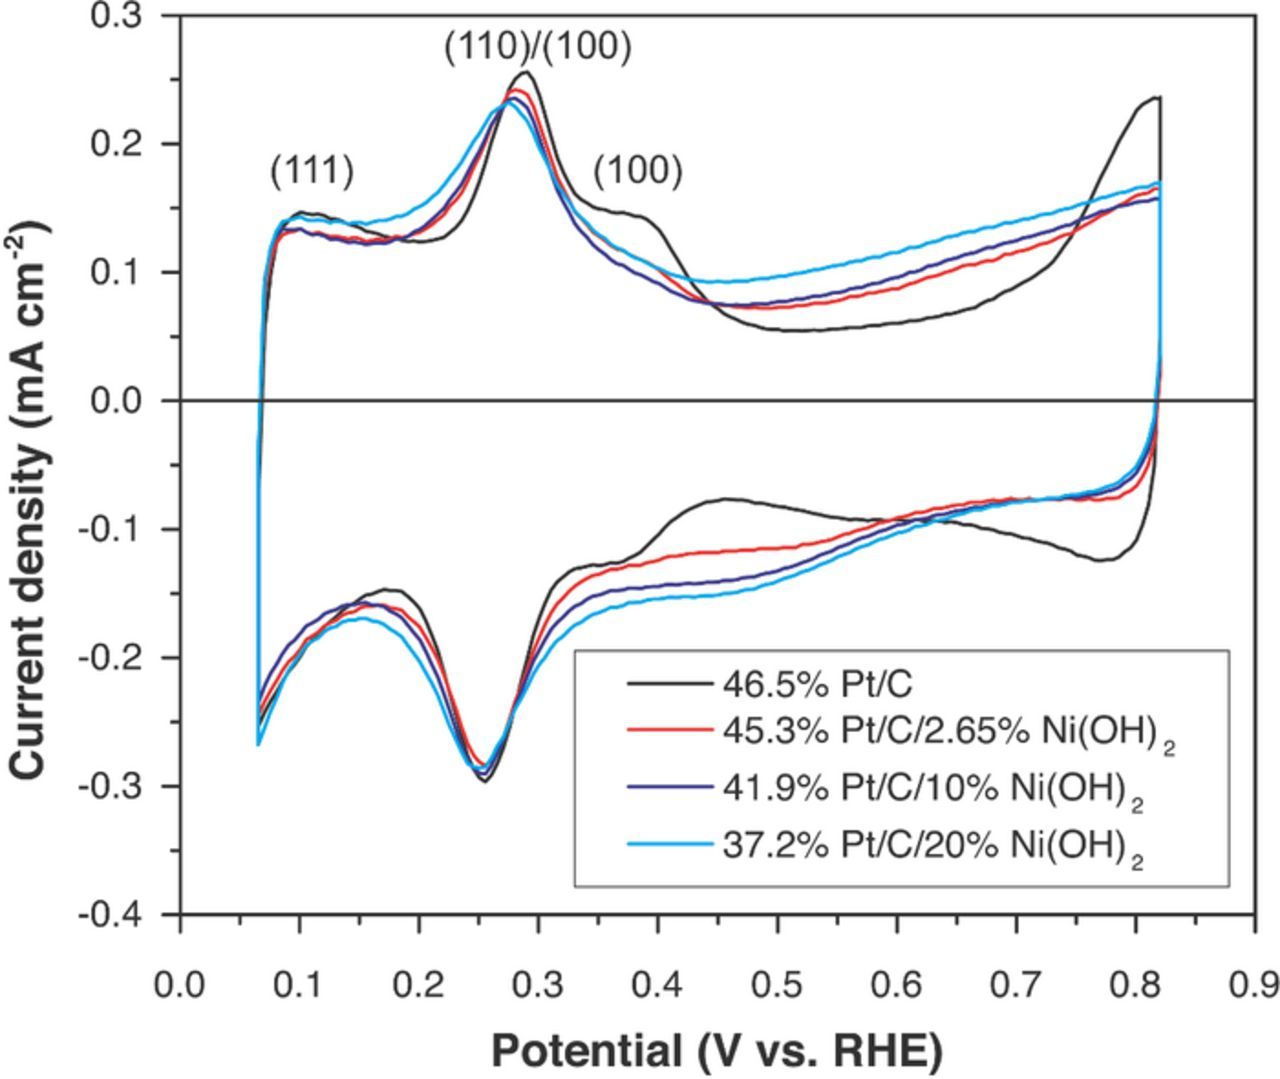
Cyclic voltammgrams (CVs) in nitrogen degassed 0.1 M potassium hydroxide are shown in Figure 2. CVs were performed at a scan rate of 20 mVs−1 in the potential range 0.05 V to 0.8 V (vs. RHE) to estimate the electrochemically active surface area (ECSA) of the Pt in the electrocatalysts. The CV for Pt/C clearly showed, as reported elsewhere, a hydrogen underpotential deposition region (approx. 0.05 to 0.5 V vs RHE), a double-layer region with no noticeable faradaic reactions (0.5–0.6 V vs RHE), and the region where Pt gets covered by oxides (> 0.6–0.7 V vs. RHE).15,25,47 The Pt–H desorption peaks at 0.3 and 0.4 V were ascribed to the oxidation of hydrogen adsorbed on Pt 110 and Pt 100 planes, respectively.15,21 The peak at the lowest potential corresponded to the oxidation of hydrogen adsorbed on 111 facets of the Pt nanoparticles. The Pt ECSA was obtained by integrating the H desorption peaks, subtracting the double-layer charge (baseline), and dividing the resulting charge by the Pt loading (17.3 μg cm−2) and the normalization factor of 210 μg cm−2.15,48 The Pt ECSA of 46% P/C was 52 ± 3 m2 g−1 m2 g−1. A decrease in the hydrogen desorption peak at approx. 0.35 V vs. RHE (Pt 100) was observed upon incorporation of Ni(OH)2 nanoparticles into the catalyst. Slight differences in the shape of the peak at c.a. 0.3 V were also detected. After deposition of Ni(OH)2 nanoparticles, a reduction of the Pt ECSA was observed for all the catalysts synthesized in this work (see Table I). The Pt ECSA for the catalyst having 10 wt.% Ni(OH)2 nanoparticles was 27.2 m2 g−1 (A decrease of 48% when compared with pristine Pt/C). These results were the consequence of Pt being partially covered by the Ni(OH)2, and therefore rendered inaccessible.
Figure 2. Cyclic voltammograms (in nitrogen degassed 0.1M KOH) on Pt/C, Pt/C/5%Ni(OH)2, Pt/C/10%Ni(OH)2, and Pt/C/20%Ni(OH)2 electrocatalysts.
Table I. Pt ECSA, HER/HOR (in 0.1M KOH) exchange current densities (i0 at 303.15 K), and activation energies for Pt/C, Pt/C/2.65%Ni(OH)2, Pt/C/5%Ni(OH)2, Pt/C/10%Ni(OH)2, and Pt/C/20%Ni(OH)2 electrocatalysts.
| Catalyst | Pt ECSA (m2/g) | i0 (at 303.15 K; mA/cm2Pt) | Ea (kJ/mol) |
|---|---|---|---|
| 46.5%Pt/C | 52 ± 3 | 1.03 ± 0.07 | 35 ± 6 |
| 45.3%Pt/C/2.65%Ni(OH)2 | 41 ± 2 | 2.08 ± 0.05 | 38 ± 6 |
| 44.2%Pt/C/5%Ni(OH)2 | 31 ± 2 | 2.30 ± 0.14 | 37 ± 5 |
| 41.9%Pt/C/10%Ni(OH)2 | 27 ± 2 | 2.44 ± 0.07 | 38 ± 5 |
| 37.2%Pt/C/20%Ni(OH)2 | 25 ± 2 | 2.26 ± 0.16 | 37 ± 6 |
HER/HOR activity in RDE experiments, and evaluation of the HER catalyst performance in a hydroxide-exchange membrane water electrolyzer
Nickel hydroxide as well as other transition metal hydroxides (iron, cobalt or manganese hydroxides) had previously been identified as highly active co-catalysts for the HER in alkaline electrolyte.8–11,49 Figure 3 compares the HER activity (half-cell polarization curves in RDE electrode) for the Pt-Ni(OH)2 catalysts containing 0 to 20 wt% Ni(OH)2, showing the current density (based on the glassy carbon disk electrode with the same Pt loadings) vs. IR corrected potential at 1600 rpm and 303.15 K. An increase on both HER and HOR current densities was observed for the bi-functional catalysts containing Ni(OH)2 when compared with pristine Pt/C. The maximum currents were observed for the catalyst containing 10 wt% Ni(OH)2 (ca. 60% more HER current than Pt/C at an overpotential of 50 mV). The enhancement of the HER activity of Pt catalyst after deposition of Ni(OH)2 was probably not caused by changes in the Pt catalyst itself, but rather was a consequence of the bi-functional nature of the catalyst as discussed earlier.8–11,49 XPS performed on Pt/C and Pt/C/10 wt%Ni(OH)2 did not reveal any significant differences in Pt 4f peaks (Figure 4). Pt 4f peaks were deconvoluted as described in the Experimental section, no shift in the Pt peaks corresponding to Pt0, PtO and PtO2 were observed. Pt/C/Ni(OH)2 exhibited a slightly lower proportion of PtO when compared with Pt/C (32% vs 35%). However, it is improbable that these differences can play any role in HER catalyst activity, since Pt is most probably in its reduced state (without the presence of any oxides) at the potentials involved during HER (less than 0 V vs. RHE).
Figure 3. Comparison of HOR/HER polarization curves on Pt/C, Pt/C/2.65%Ni(OH)2, Pt/C/5%Ni(OH)2, Pt/C/10%Ni(OH)2, and Pt/C/20%Ni(OH)2. Temperature: 303.15 K; RDE rotation rate: 1600 rpm; Electrolyte: Nitrogen-degassed 0.1M KOH.
Figure 4. XPS spectra (Pt 4f) for Pt/C and Pt/C/10%Ni(OH)2.
Figures 5 and 6 summarize the RDE experiments performed on Pt/C and the 4 bi-functional catalysts (Pt/C/2.65%Ni(OH)2, Pt/C/5%Ni(OH)2, Pt/C/10%Ni(OH)2, and Pt/C/20%Ni(OH)2). The effect of RDE rotation rate on current density is shown in Figure 5. The variation of HER rate at moderate overpotentials (0–100 mV) was observed for every catalyst tested, but the changes with rotation rate were more pronounced than in similar papers studying HER/HOR in single-crystal and polycrystalline Pt surfaces.15,25 In some instances the current density increased by 100% (i.e. from 5 to 10 mA cm−2) when the rotation rate was increased from 400 rpm to 2500 rpm. In contrast, Wenchao and coworkers,25 and Markovic and coworkers15 reported a negligible variation in the HER current with rotation rate.
Figure 5. Effect of RDE rotation rate on HOR/HER polarization curves on a) Pt/C, b) Pt/C/2.65%Ni(OH)2, c) Pt/C/5%Ni(OH)2, d) Pt/C/10%Ni(OH)2, and e) Pt/C/20%Ni(OH)2 electrocatalysts. Temperature: 303.15 K; Electrolyte: Nitrogen-degassed 0.1M KOH.
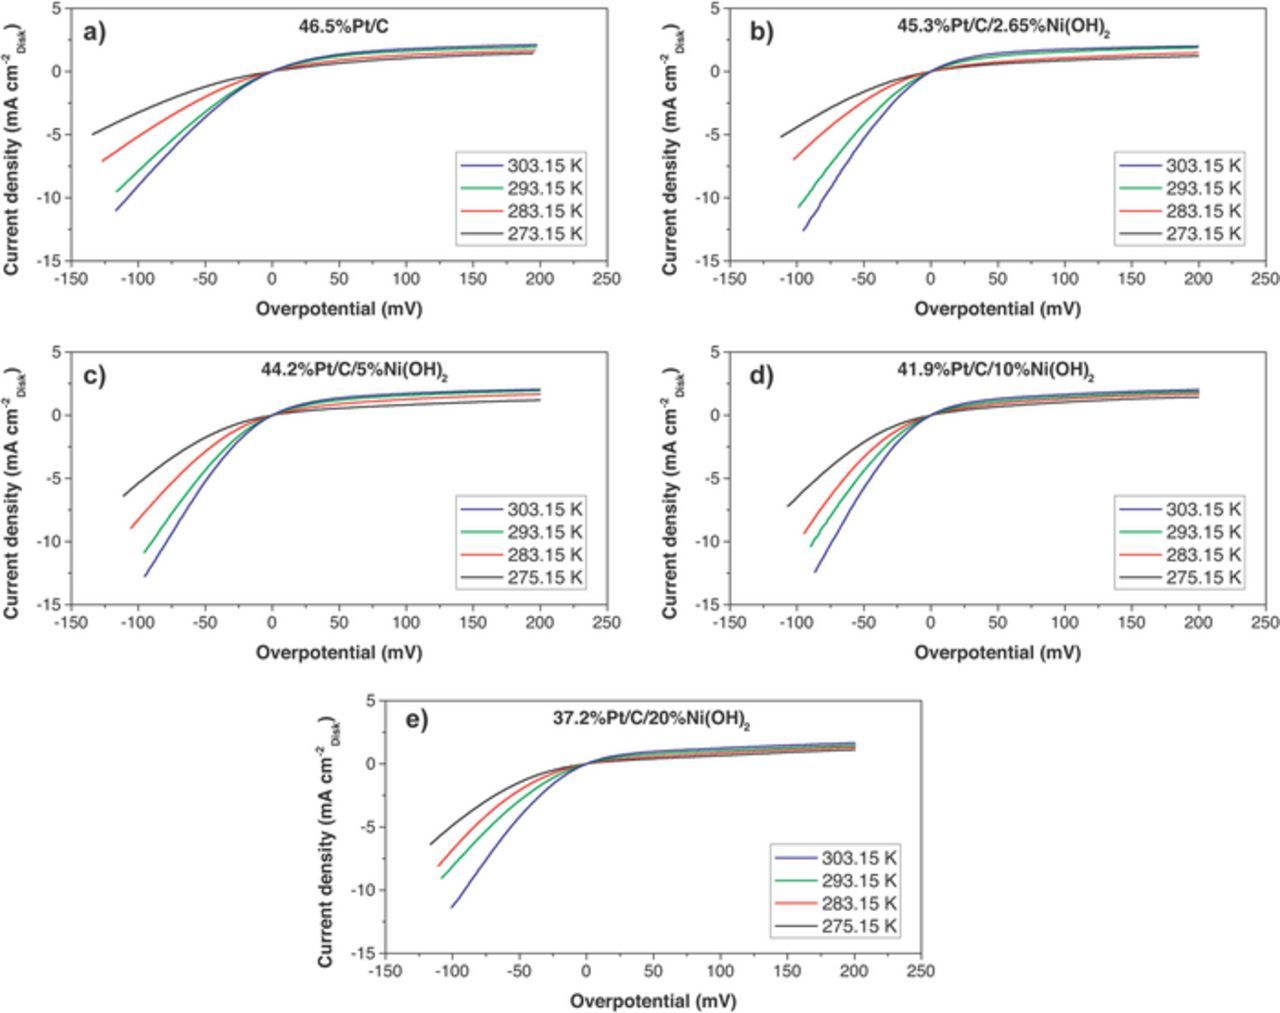
Figure 6. Effect of temperature on HOR/HER polarization curves on a) Pt/C, b) Pt/C/2.65%Ni(OH)2, c) Pt/C/5%Ni(OH)2, d) Pt/C/10%Ni(OH)2, and e) Pt/C/20%Ni(OH)2 electrocatalysts. RDE rotation rate: 1600 rpm; Electrolyte: Nitrogen-degassed 0.1M KOH.
The effect of temperature on HER/HOR current densities is shown in Figure 6. All the catalysts were evaluated at 4 temperatures (273.15 K, 283.15 K, 293.15 K and 303.15 K) and 4 rotation rates (400, 900, 1600 and 2500 rpm), and the experiments were performed at least three times to assure reproducibility.
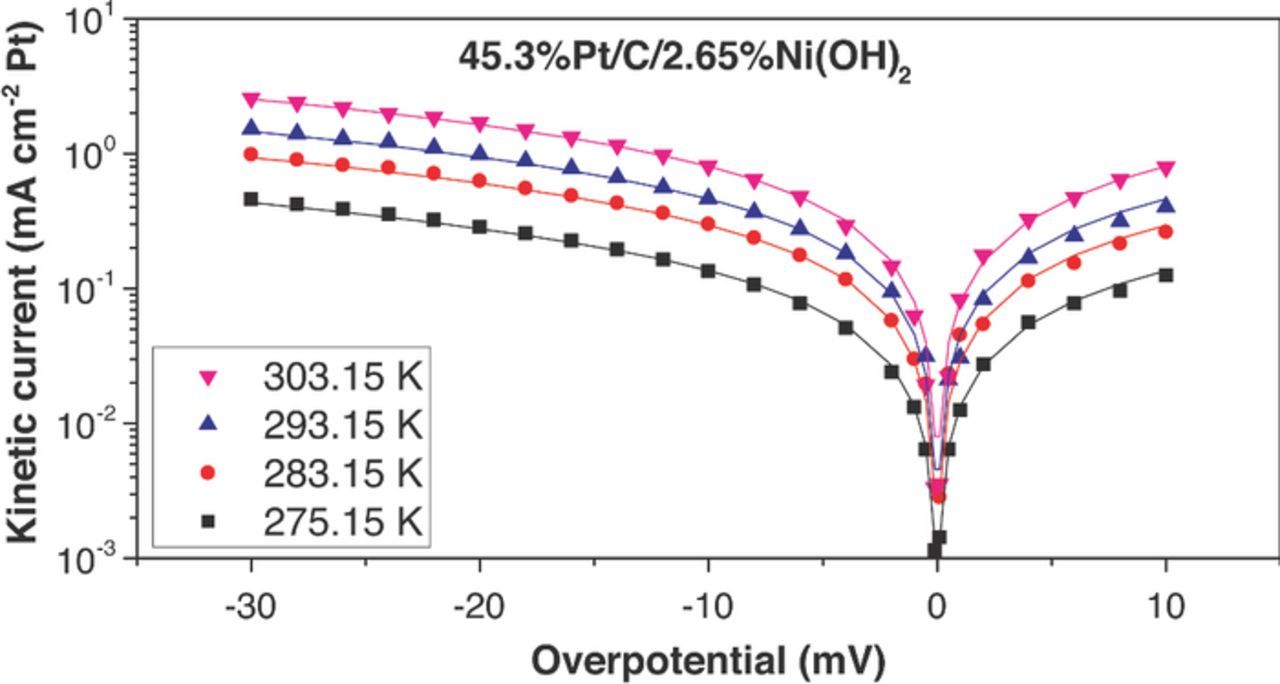
Kinetic current densities were obtained after IR correction of the applied potential. Mass-transport correction (Equations 6 and 7) was performed for both anodic and cathodic currents in the mixed-control regions. The plots of 1/i vs. w−0.5 (Equation 7) employed to perform the mass-transport correction (to obtain the kinetic currents) have been added to the Electronic Supporting Information (For Pt/C, Figures S1-S4; For Pt/C/10%Ni(OH)2, Figures S5-S8). For a better comparison of the catalysts, the kinetic currents obtained through the mass-transport correction were expressed in terms of Pt surface area (Pt ECSA). Pt loading in the glassy carbon electrode (5 μg cm−2) and the ECSA measured in an independent experiment (See Figure 2 and Table I) were employed to calculate the specific-surface (Pt) kinetic currents shown in Figures 7 to 11 (as dots). We observed the same trends described in previous paragraphs. All the bi-functional catalysts (Pt/C/X%Ni(OH)2) had higher specific-surface kinetic current densities than Pt/C. And, the maximum specific-surface kinetic currents were found for the catalyst containing 10 wt% Ni(OH)2.
Figure 7. HOR/HER measured kinetic current densities (dots) on Pt/C electrocatalyst in 0.1 M KOH and their fit to the Butler–Volmer equation (α = 0.5, lines). The HOR/HER kinetic current densities were obtained from iR-corrected polarization curves and were corrected for mass transport resistance in the HOR and HER branches.
Figure 8. HOR/HER measured kinetic current densities (dots) on Pt/C/2.65%Ni(OH)2 electrocatalyst in 0.1 M KOH and their fit to the Butler–Volmer equation (α = 0.5, lines). The HOR/HER kinetic current densities were obtained from iR-corrected polarization curves and were corrected for mass transport resistance in the HOR and HER branches.
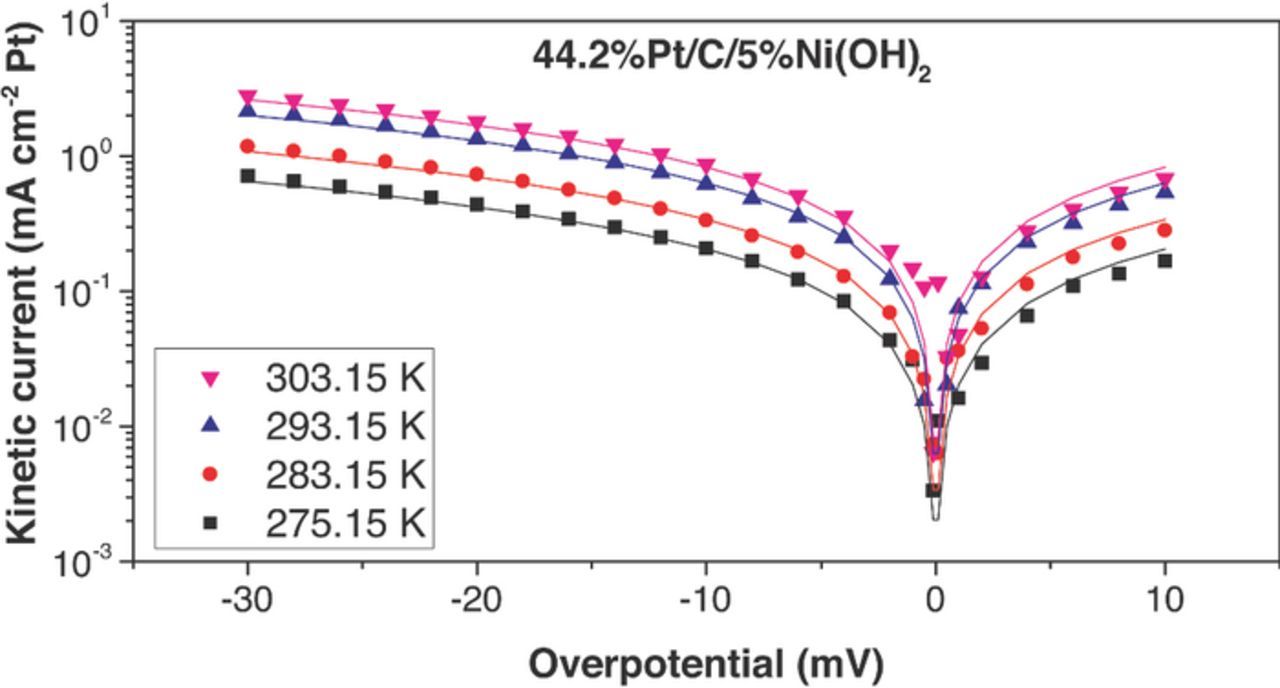
Figure 9. HOR/HER measured kinetic current densities (dots) on Pt/C/5%Ni(OH)2 electrocatalyst in 0.1 M KOH and their fit to the Butler–Volmer equation (α = 0.5, lines). The HOR/HER kinetic current densities were obtained from iR-corrected polarization curves and were corrected for mass transport resistance in the HOR and HER branches.
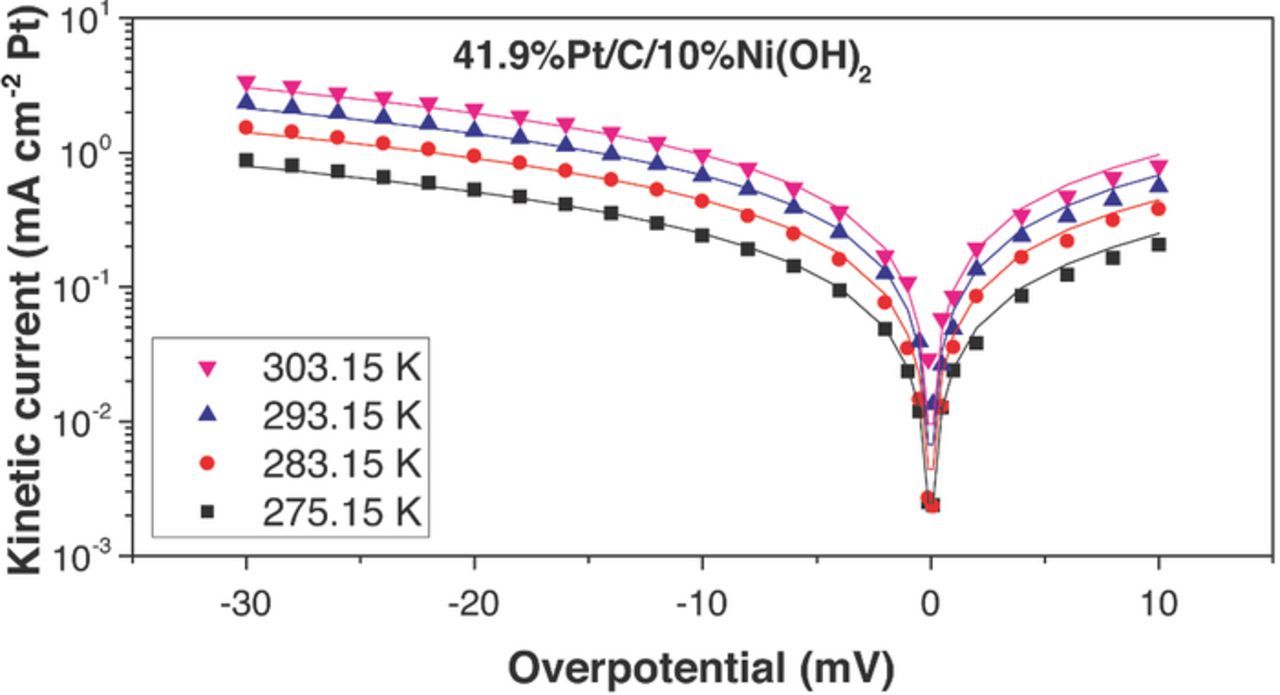
Figure 10. HOR/HER measured kinetic current densities (dots) on Pt/C/10%Ni(OH)2, electrocatalyst in 0.1 M KOH and their fit to the Butler–Volmer equation (α = 0.5, lines). The HOR/HER kinetic current densities were obtained from iR-corrected polarization curves and were corrected for mass transport resistance in the HOR and HER branches.
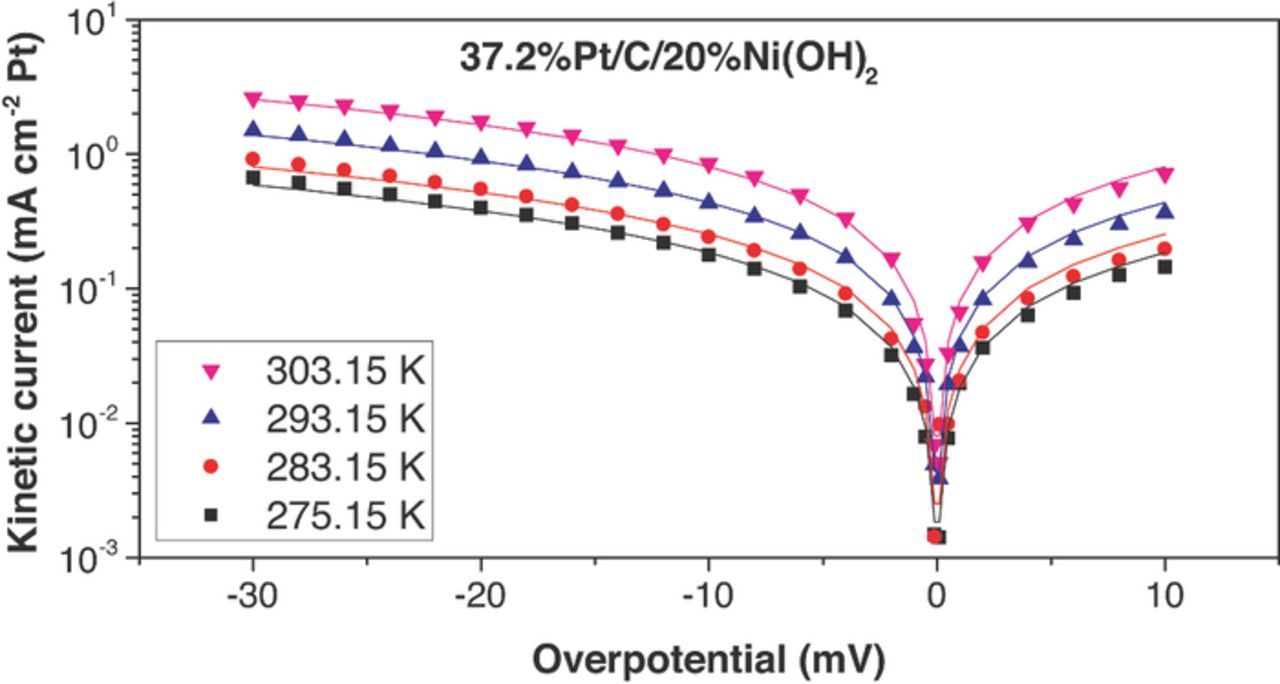
Figure 11. HOR/HER measured kinetic current densities (dots) on Pt/C/20%Ni(OH)2 electrocatalyst in 0.1 M KOH and their fit to the Butler–Volmer equation (α = 0.5, lines). The HOR/HER kinetic current densities were obtained from iR-corrected polarization curves and were corrected for mass transport resistance in the HOR and HER branches.
HOR current densities below 80% of the diffusion limited current density were employed in the mass-transport correction to minimize errors in the estimation of the kinetic currents, which can become substantial as the current densities approach the mass transport limited current densities.25 The maximum HOR current densities plotted in Figures 7 to 11 and employed in subsequent analysis correspond to maximum overpotentials (HOR) of about 10 mV. For HER, current densities below 2 mA /cm2GC disk were considered for the kinetic analysis (this is equivalent to keeping the overpotentials below 30 mV). Hydrogen oversaturation and bubble generation can introduce artifacts that are difficult to correct using Equations 6 and 7.25
The HOR/HER exchange current densities (i0) on Pt/C/X%Ni(OH)2 were estimated by fitting the HOR/HER kinetic current densities (calculated as described in previous paragraphs) to the kinetic expression that describes the reaction rate (Butler–Volmer; Equation 4). It was assumed that the first electron transfer (Volmer step) was the rate determining step, and that this was followed by a fast-chemical recombination step (Tafel step) or a fast second electron transfer (Heyrovsky step). The Heyrovsky step usually becomes important when the Tafel step is not fast enough.
The fitting curves (continuous lines) are shown along the experimentally calculated kinetic currents (dots) in Figures 7 to 11. The exchange current densities at 303.15 K are shown in Table I. A β value of 0.5 was employed in all the fittings. i0 for Pt/C was estimated to be 1.03 ± 0.07 mA/cm2Pt (303.15 K), which was 30–65% larger than previously published values for similar catalysts – for example: 46%Pt/C, Tanaka, K. K., i0 = 0.65 mA/cm2Pt; Polycrystalline Pt disk, i0 = 0.82 mA/cm2Pt.25 All the catalysts containing Ni(OH)2 had higher exchange current densities than pristine Pt/C. The maximum exchange current densities were obtained with the catalyst containing 10 wt% Ni(OH)2 (2.44 ± 0.07 mA cm−2Pt at 303.15 K), and they were about 2.4 times higher than Pt/C. Arrhenius plots (Figure 12) showed a similar activation energy for Pt/C (35 ± 6 kJ/mol) and Pt-X%Ni(OH)2 –all the bifunctional catalysts had activation energies in the range 38 ± 6 kJ/mol). The unchanged activation energy suggests the reaction mechanism and the rate limiting step does not change for the bi-functional catalyst; The first electron transfer continues to be the rate determining step.
Figure 12. Arrhenius plots showing the temperature dependence of the HER/HOR exchange current densities.
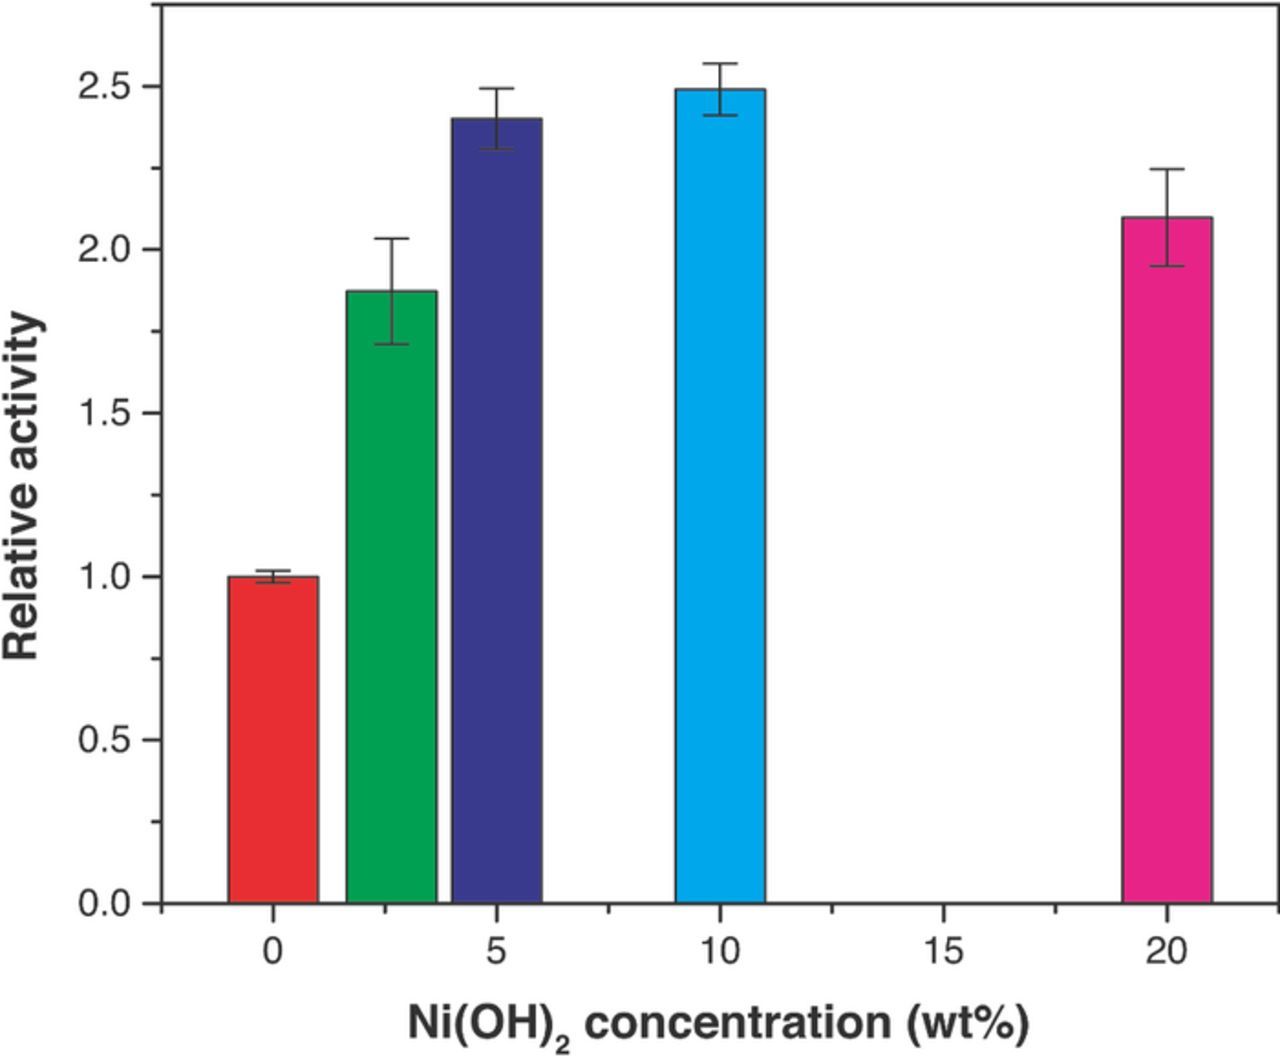
Figure 13 shows the relative activities for the bi-functional electrocatalysts (Pt-X%Ni(OH)2) toward HER/HOR. The relative activities were calculated by dividing the exchange current density for each bi-functional catalyst by the exchange current density for Pt/C. Since all the catalysts have the same activation energy, the relative activities do not change with temperature. The maximum relative activity was found for Pt/C/10%Ni(OH)2 electrocatalyst (2.4 times the exchange current density found for Pt/C). An increase of the Ni(OH)2 content in the catalyst above 10 wt.% did not result in an increase of catalyst activity. Rather, a slight decrease in the relative activity was observed. This decrease cannot be explained by the blockage of the Pt by the Ni(OH)2, since the activities and relative activities have been normalized based on the Pt ECSA of the catalysts. Possible explanations include poorer contact with the Pt catalysts at larger loadings (i.e. due to aggregation) or a saturation effect (water splitting reaction rate enhancement is not possible after reaching a certain loading of Ni(OH)2).
Figure 13. Effect of the concentration of Ni(OH)2 deposited onto Pt/C on the relative activities of the bi-functional electrocatalysts toward HER/HOR.
Figure 14 depicts a possible mechanism to explain the enhancement of HOR/HER in alkaline electrolyte in presence of Ni(OH)2. It is similar to the mechanism proposed by Markovic and coworkers in that it involves the hydroxide nanoclusters facilitating water splitting.8–11,49 However, in this mechanism, we have assumed of all the nickel hydroxide participates in the bi-functional mechanism and not only the edges of Ni(OH)2 clusters in contact with the Pt. We think our mechanism better explains the results obtained. It can explain why the activity does not keep increasing when the concentration of Ni(OH)2 is raised above 10%, even though it is evident that higher loadings will result in the presence of more edges between Pt and Ni(OH)2 nanoclusters.
Figure 14. Schematic representation of the HER/HOR on Pt/C-Ni(OH)2 bi-functional electrocatalyst. Ni(OH)2 provides active sites for the adsorption of reactive OHad, and Pt provides the active sites for the dissociative adsorption of H2 to form Had, that later reacts with OHad to generate the water product.
For HER, water dissociates onto the surface of Ni(OH)2 nanoclusters in a manner similar to that proposed by Danilovic and coworkers, to form adsorbed hydroxide and hydrogen species.8,9 Later, adsorbed hydrogen diffuses to an adjacent Pt surface, where it recombines electrochemically with another adsorbed hydrogen to form molecular hydrogen. For HOR, molecular hydrogen adsorbs dissociatively onto a Pt surface and later it spills over to the adjacent Ni(OH)2 nanoclusters, where it recombines with hydroxide to form water –hydrogen spillover to adjacent Ni(OH)2 clusters occurs through changes in Ni oxidation state. This mechanism does not impose the condition that the reactions must occur in the interface and relies on a known concept in chemical catalysis, namely the spillover effect. Spillover involves the transport of active species adsorbed or formed on a first surface onto another surface –i.e. hydrogen dissociative adsorption onto Pt metal, and later moving onto an adjacent reducible metal oxide like Ni(OH)2.50
The efficacy of the bi-functional HER catalyst in a hydroxide-exchange membrane water electrolyzer was also evaluated. Pt/C/10% Ni(OH)2 was found to be more efficient than Pt/C for hydrogen production in the water electrolyzer (see Figure 15). A reduction of 0.15 V in the overpotential compared to Pt/C was observed across the entire range of overpotentials.
Figure 15. Electrolyzer polarization curves for MEAs prepared with Pt/C and Pt/C/10%Ni(OH)2 HER catalysts. OER catalyst: IrO2; Temperature: 50°C; Catalyst loadings were 2.85 mg IrO2 cm−2 and 0.66 mg Pt cm−2.
Conclusions
Kinetics of hydrogen oxidation and hydrogen evolution reactions in alkaline electrolyte was analyzed on Pt/C and a Pt/C/Ni(OH)2 bi-functional electrocatalysts with different Ni(OH)2 concentrations. The catalysts were prepared by mixing colloidal dispersions of nano-sized Ni(OH)2 with a Pt/C catalyst dispersed in water followed by solvent removal under vacuum. RDE measurements were performed in 0.1M KOH at temperatures ranging from 273.15 K to 303.15 K to obtain HOR/HER kinetic currents. The Butler-Volmer kinetic expression was employed to estimate the exchange current densities at each temperature and for each catalyst. The maximum exchange current densities were found for Pt/C/10 wt% Ni(OH)2, and they were 2.4 times higher than for Pt/C (1.03 ± 0.07 mA cm−2Pt at 303.15 K). Arrhenius plots showed a similar same activation energy for Pt/C (35 ± 6 kJ/mol) and the bi-functional catalysts (in the range 38 ± 6 kJ/mol). The bi-functional catalysts were also tested in a hydroxide-exchange membrane water electrolyzer that was run with ultrapure water at 50°C. The use of Pt/C/10 wt% Ni(OH)2 resulted in approx. 0.15 V lower overpotential than Pt/C across the entire current density range. Thus, bi-functional catalysts containing Ni(OH)2 or other bi-functional catalysts exploiting the same mechanisms are promising electrocatalysts for H2 production in hydroxide-exchange membrane water electrolyzers.
Acknowledgments
We thank the Department of Energy Small Business Innovation Research (SBIR) program (grant number DE-SC0007574, Phase II.B) for funding this research. The authors have no competing interests or other interests that might be perceived to influence the results and discussion reported in this paper.
ORCID
Javier Parrondo 0000-0003-4306-2351


