
Abstract
In this study, the influence of ionomer content in IrO2/TiO2 anode electrodes for a proton exchange membrane (PEM) electrolyzer is investigated (Nafion 212 membrane; 2.0 mgIr cm−2 / 0.35 mgPt cm−2 (anode/cathode)) and the contributions of ohmic losses, kinetic losses, proton transport losses in the electrodes, and mass transport losses to the overall cell voltage are analyzed. Electrolysis tests are performed with an in-house designed high pressure electrolyzer cell at differential pressure up to 30 bar. The best performance is obtained for an ionomer content of 11.6 wt% and a cell voltage of 1.57 V at 1 A cm−2 and less than 2 V at 6 A cm−2 (ambient pressure, 80°C). Performance losses at lower ionomer contents are the result of a higher proton conduction resistance. For higher ionomer contents, on the other hand, performance losses can be related to a filling of the electrode void volume by ionomer, leading to a higher O2 mass transport resistance, an increased electronic contact resistance, and the electronic insulation of parts of the catalyst by ionomer. At high pressure operation, the performance corrected by the shift of the Nernst voltage increases with H2 pressure and we propose a new explanation for this effect.
Export citation and abstract BibTeX RIS

This is an open access article distributed under the terms of the Creative Commons Attribution 4.0 License (CC BY, http://creativecommons.org/licenses/by/4.0/), which permits unrestricted reuse of the work in any medium, provided the original work is properly cited.
In the course of the transition from fossil-based to renewable energy sources, hydrogen technology has gained considerable attention during the past decades. Proton exchange membrane (PEM) electrolyzers are well suited to be coupled with intermittent energy sources such as wind and solar and could provide electrolytic hydrogen for long-term energy storage or fuel cell mobility. At the moment, the large-scale application of PEM electrolyzers is still hindered by their high capital costs.1,2 One attempt to overcome this challenge is to increase the H2 output by operating an electrolyzer at current densities much higher than the values typically reported in the literature (1–2 A cm−2).2 Recent publications have shown that current densities of 5 A cm−2 and higher are possible.3,4 Another factor that can be economically beneficial is the operation at high pressure because it allows direct storage of H2 without subsequent mechanical compression. However, high-pressure operation leads to more demanding materials requirements, imposes additional safety precautions, and reduces the faradaic efficiency due to a higher gas permeation through the membrane.5,6 It was reported that an operating pressure of 30–45 bar could be a good compromise,7 with differential pressure operation ( ≈ ambient pressure) being more efficient than balanced pressure operation (
 ≈
≈  ).8 However, increasing the current density and the operating pressure of an electrolyzer will increase the cell voltage, leading to a lower overall voltage efficiency and thus higher operating costs. Since the latter are, along with the capital costs, one of the main cost drivers for large-scale applications,9 minimizing cell voltage at high current densities and pressures is essential for economic competitiveness. Therefore, a careful analysis of the various voltage loss contributions is necessary to identify how material parameters and operating conditions influence PEM electrolyzer performance, and how the MEA (membrane electrode assembly) can be modified to minimize the overall cell voltage.
The difference between the measured cell voltage and the reversible cell voltage comprises kinetic losses, ohmic losses, losses associated with proton transport in the electrodes, and mass transport losses. The hydrogen evolution reaction (HER) kinetics on platinum, which is typically used as cathode catalyst in PEM electrolyzers have been shown to be very fast, so that high reaction rates can be obtained at very low overpotentials.10–13 On the other hand, the kinetics for the oxygen evolution reaction (OER) on the anode are orders of magnitude slower, so that substantial overpotentials are observed even with iridium based catalysts, which are usually used because they provide the best compromise between activity and stability.14 One strategy to improve their mass specific activity (i.e., the activity normalized by the mass of noble metal), is to maximize the noble metal dispersion by supporting thin films or nanoparticles of iridium (oxide) on high surface area support materials like TiC,15 TaC,16 TiO217 or Ti.18 Another approach is to increase the intrinsic activity of the OER catalyst, and several modifications were examined like fluorine doped iridium oxide,19 IrxRuyO220 and IrxRuyTazO2.21
The ohmic resistance of an electrolyzer includes the electronic contact resistance, mostly between the bipolar plate flow-fields and the porous transport layer (PTL) as well as the membrane's proton conduction resistance. To reduce the contact resistance and increase the durability of the flow-fields, Au or TiN coatings are often applied to titanium-based flow-fields.22,23 The resistance of the membrane can account for significant voltage losses, especially under operation at high current densities. It can be reduced by employing thinner membranes, but this adjustment increases the hydrogen permeation (often referred to as "crossover") through the membrane, leading to a lower faradaic efficiency, particularly at high operation pressure and low current densities.
The influence of proton conduction resistance in the electrodes has been studied for PEM fuel cells24–27 and could also play a role in PEM electrolysis, especially when the content of the proton conducting ionomer in the electrodes is low. So far, only few studies have examined the effect of ionomer content in the electrodes on PEM electrolyzer performance.28,29 They showed a significant influence of ionomer content on the electrolyzer performance, which was attributed to changes in the catalyst/ionomer interfacial resistance and/or catalyst layer resistance. However, only current densities up to 1.5 A cm−2 were discussed and a complete understanding of the effect is still missing.
Finally, mass transport resistances can add significant voltage losses as reported by Suermann et al., who performed an analysis of the voltage losses for a PEM electrolysis cell at operating pressures ranging from 1–100 bar.3 In contrast to what would generally be expected, they did not observe a significant increase of cell voltage with pressure. This unexpected behavior was also reported in other studies,5,6 but a satisfying explanation of the phenomenon is still missing.
In this work, the influence of the MEA's ionomer content in the anode electrode layer on electrolyzer performance is investigated, and the various voltage losses which contribute to the overall performance loss are quantified. We also introduce a new small active-area (5 cm2) single-cell electrolyzer cell design for high pressure operation, with which we study the effect of varying hydrogen pressure (1–30 bara) on the electrolysis performance under differential pressure conditions ( = ambient pressure).
Experimental
Membrane electrode assembly (MEA) preparation and cell assembly
MEAs with an active area of 5 cm2 were prepared by a decal transfer method. For the hydrogen cathode electrodes, platinum supported on Vulcan XC72 carbon (46.7 wt% Pt/C; TEC10V50E from Tanaka, Japan) was used as catalyst. For the oxygen anode, IrO2 supported on TiO2 (IrO2/TiO2 with 75 wt% iridium; Elyst Ir75 0480 from Umicore, Germany) was used. Catalyst inks were prepared from catalyst powder, 2-propanol (purity ≥ 99.9%, from Sigma Aldrich), de-ionized (DI) water (18 MΩ cm) and Nafion ionomer solution (20 wt% ionomer; D2021 from IonPower, USA). ZrO2 grinding balls (5 mm diameter) were added and the components were mixed for 24 hours using a roller mill to achieve a homogenous suspension. The ink was then coated onto ETFE foil (25 μm thick, FP361025 from Goodfellow, UK) utilizing a Mayer-rod coating machine. After drying, the electrodes were hot-pressed onto a Nafion 212 membrane (50 μm thick; from Quintech, Germany) for 3 min at 155°C at a pressure of 2.5 MPa. The catalyst loading was determined by weighing the ETFE decals before and after the decal transfer step, using a microbalance (± 1 μg; from Mettler Toledo, Germany). For the hydrogen cathode electrodes the loading was 0.35 ± 0.05 mgPt cmMEA−2 and the ionomer to carbon weight ratio was fixed at 0.6/1. The ionomer content of the oxygen anode electrodes was varied between 2.2 and 28.0 wt% relative to the total weight of the electrode. The anode catalyst loading was 2.00 ± 0.25 mgIr cmMEA−2 for the electrodes with an ionomer content between 3.9–28.0 wt% and 1.46 ± 0.10 mgIr cmMEA−2 for the sample with 2.2 wt% ionomer. Sintered titanium (from Mott Corporation, USA) with a porosity of ∼50% and a thickness of 280 ± 10 μm as well as a carbon fiber paper (TGP-H-120T from Toray, no MPL, 20 wt% PTFE) with a thickness of 370 ± 10 μm were used as porous transport layers (PTL) at the anode and at the cathode, respectively. The MEA was placed between the PTLs and sealed with virgin PTFE foil. Sealings with an appropriate thickness were chosen to achieve a 25% compression of the carbon PTL. (under the applied compression, the titanium PTL can be considered incompressible).
Physical characterization
Cross-sectional scanning electron microscopy (SEM) measurements were performed with a JEOL JCM-6000Plus NeoScope scanning electron microscope at an accelerating voltage of 15 kV to determine electrode thickness. MEA cross-sections were prepared by cryo-fracturing MEAs in liquid nitrogen. 5 values for the electrode thickness were measured at three different locations to account for inhomogeneities in the electrode thickness. High resolution SEM images were taken with a JEOL JSM-7500F scanning electron microscope with an accelerating voltage of 1 kV. The Brunauer-Emmet-Teller (BET) surface area was determined by adsorption of liquid nitrogen on the catalyst powder with a Quantachrome Autosorb-iQ after outgasing for 6 hours at 200°C.
Electrochemical characterization
Tests were performed on an automated test station from Greenlight Innovation equipped with a potentiostat and booster (Reference 3000 and 30 A booster, Gamry). All measurements were done at 80°C cell temperature; deionized (DI) water was pre-heated to 80°C and fed to the anode side of the electrolysis cell at a rate of 5 ml min−1. Polarization curves were recorded at hydrogen pressures between 1–30 bara absolute pressure. The oxygen side was always kept at ambient pressure. For the high pressure tests, the product gas at the anode side of the cell was diluted with nitrogen (100 nccm) to prevent the development of an explosive gas mixture which otherwise could be formed by the permeation of H2 through the membrane into the anode compartment. After a warm-up step under N2 atmosphere to reach the desired temperature, the cell was conditioned by ramping the current to 1 A cm−2 and holding this value for 30 min. Subsequently, galvanostatic polarization curves were recorded at current densities starting at 0.01 and increasing to 6 A cm−2. Each current step was held for 5 min, before recording the cell voltage to ensure stabilization. A slight improvement in cell performance was typically observed for the first two polarization curves, while it remained constant afterwards. Consequently, the first two polarization curves can be regarded as an additional conditioning step and were not included in the data analysis shown here. AC impedance measurements in a range of 10 Hz–20 kHz with current perturbations of ±200 mA were carried out at each current step to determine the high frequency resistance (HFR), which was obtained from the high-frequency intercept of the Nyquist plot with the real axis. CVs of the IrO2/TiO2 anode electrode were recorded at a scan rate of 50 mV s−1 at 80°C. The anode working electrode was flushed with H2O at a flow rate of 5 ml min−1, while the cathode counter electrode was purged with dry H2 at 50 ml min−1.
Ohmic loss correction
To identify the contribution of different kinds of voltage losses, polarization curves were first corrected by the HFR, which is considered to be the sum of the membrane resistance Rmemb and the electronic resistance (sum of contact resistances between flow-fields and PTLs and bulk PTL resistances), Rel. To validate this correlation, Rel and Rmemb were measured separately: Rel as described in the next section and Rmemb by a conductivity measurement. For the latter, a piece of Nafion 212 membrane was assembled in an in-plane conductivity cell (BekkTech, USA) and placed in liquid water at 80°C. The conductivity was determined from the HFR measured via AC impedance spectroscopy after immersing the membrane in water for more than 20 h to ensure that the membrane is fully hydrated.30
Electrolyzer Cell Hardware
The electrolyzer cell design used in this study is presented in Fig. 1. The cell consists of aluminum end plates (s. (1) in Fig. 1), which are compressed by 12 M8 screws. In order to regulate the temperature during experiments, heating rods are mounted into the end plates and two fans are placed at each side of the cell. The cell temperature is measured by two thermocouples situated in the center of the two flow-fields. Copper current collectors (s. (3) in Fig. 1) are used to connect the power supply cables to the cell. Between the end plates and the current collectors, 2 mm thick Gylon (type 3545, from Garlock, USA; s. (2) in Fig. 1) patches are placed for electronic insulation of the end plate from the rest of the cell. The Gylon also provides a more equal distribution of the compressive force on the sealing and the active-area of the cell. Single serpentine flow-fields with an area of 5 cm2 were machined into the titanium blocks (8×8×2 cm). The width and depth of the channels are 1 mm, while the width of the lands is 0.7 mm. NPT threads for the gas connections are directly machined into the titanium blocks. Dielectric fittings (SS-4-DE-6, from Swagelok, Germany) are connected to these NPT threads to prevent ohmic shorting between anode and cathode flow-fields. The MEA (s. (7) in Fig. 1) is placed between the flow-fields (s. (4) in Fig. 1) with the carbon PTL (s. (6) in Fig. 1) on the hydrogen cathode and the titanium PTL (s. (8) in Fig. 1) on the oxygen anode side. Gaskets punched from virgin PTFE foil (from Reichelt, Germany) are used for sealing (s. (5) in Fig. 1).

Figure 1. Schematic drawing of the 5 cm2 high pressure electrolysis cell: (1) aluminum end plate, (2) 2 mm Gylon layer, (3) copper current collector, (4) gold coated titanium flow-fields, (5) PTFE gaskets, (6) carbon PTL, (7) MEA, and (8) titanium PTL.
A thin gold coating was applied to the titanium plates to reduce the contact resistance between PTL and flow-field as well as to improve the corrosion resistance of the flow-field. Prior to Au deposition, the surface of the titanium flow-fields was mechanically polished on a polishing machine (Buehler Beta) with SiC grinding paper. Besides allowing a better adhesion of gold on the titanium plate, the polishing step is essential to achieve a good sealing, especially at high gas pressure. After polishing, the titanium blocks were cleaned by ultrasonication in a mixture of DI water and isopropanol and by boiling them in DI water for several hours. The flow-fields were then dipped into a diluted hydrofluoric acid solution (2.5% HF in DI water) for 30 seconds to remove the oxide layer from the surface; subsequently they were washed in DI water. A gold layer with a nominal thickness of 300 nm was deposited on the surface via thermal evaporation.
The sealing of the cell was studied by measuring the pressure distribution on the sealing area. For this purpose, a pressure sensitive film (Prescale, Fujifilm) was placed in the middle of a sandwich comprised of the set of flow-fields and PTFE gaskets, as used in the actual experiments. When the screws connecting the two endplates were tightened with a torque of 20 Nm, a uniform pressure distribution on the sealing area was obtained, indicating an average compressive force of ≈40 MPa. To verify the gas-tightness of the sealing, a leak test was performed by filling the cell with helium at a pressure of 50 bar, with the other gas connection ports of the cell being closed off. Subsequently, the valve at the gas inlet of the cell was closed and the pressure inside the cell was monitored with a pressure gauge attached to the dead-ended gas-outlet of the cell. The He pressure was monitored and remained stable over 20 hours, indicating a leak rate below 0.005 nccm, which is negligible compared to the lowest examined rate of H2 production (≈0.35 nccm at 0.01 A cm−2). Consequently, at operating pressures up to 30 bara, we did not detect a leak of H2 by the H2 sensors placed close to the cell. This confirms an excellent sealing of the cell also under real operating conditions with H2 at 30 bara and temperatures of 80°C.
The right level of compression of the PTLs is essential to ensure both a low contact resistance between the PTLs and the flow-fields as well as a sufficiently high porosity of the carbon fiber paper based cathode PTL. To determine the compressive force applied to the active-area of the MEA, a pressure sensitive paper was placed between the titanium and the carbon PTLs, and this sandwich was placed between the flow-fields together with the PTFE gaskets. The total thickness of the latter was chosen to result in a compressive strain of ≈25% of the carbon paper (the titanium PTL is essentially incompressible under the applied compression). The pressure distribution over the active-area determined from the pressure sensitive paper is shown in Fig. 2a. The average pressure calculated over the entire "land" area is ≈1.7 MPa (s. dashed line in Fig. 2a). The resulting contact resistance between PTLs and flow-fields was measured with the setup shown in the inset of Fig. 2b: a PTL was placed between the flow-fields, which were compressed between two copper plates by an automatic platen press (Dr. Collin P 200 PM); here, the pressure is referred to the force applied by the press divided by the total land area of the flow-field. Since most of the applied compressive force lies on the land area (s. Fig. 2a), the obtained pressure should represent the actual pressure on the land area with sufficient accuracy. A current of 3 A was applied via the copper plates and the voltage drop between the flow fields was measured. The corresponding resistance is then the sum of contact resistances between PTL and both flow-fields in addition to the bulk resistance of the PTL, which is ≈2 mΩ cm2 for the carbon PTL (manufacturer information) and considered negligible for the titanium PTL. The contact resistance between one flow-field/PTL interface, RC (i.e., half of total resistance–bulk resistance) measured at an average compressive force of 1.5 MPa with the carbon PTL decreased significantly from ≈30 mΩ cm2 for the bare titanium flow-fields (data not shown) to ≈5 mΩ cm2 for the Au coated flow-field (s. circular symbols in Fig. 2b). At the same compressive force, the resistance of the titanium PTL between the Au-coated titantium plates is also ≈5 mΩ cm2 (s. triangular symbols in Fig. 2b). Thus, for an average pressure of 1.7 MPa on the lands, i.e., the pressure obtained for 25% strain of the carbon PTL (s. Fig. 2a), the total electronic resistance (i.e. the sum of the contact resistances for one flow-field/ titanium PTL interface, one flow-field/carbon PTL interface and the carbon PTL bulk resistance) is ≈12 mΩ cm2.
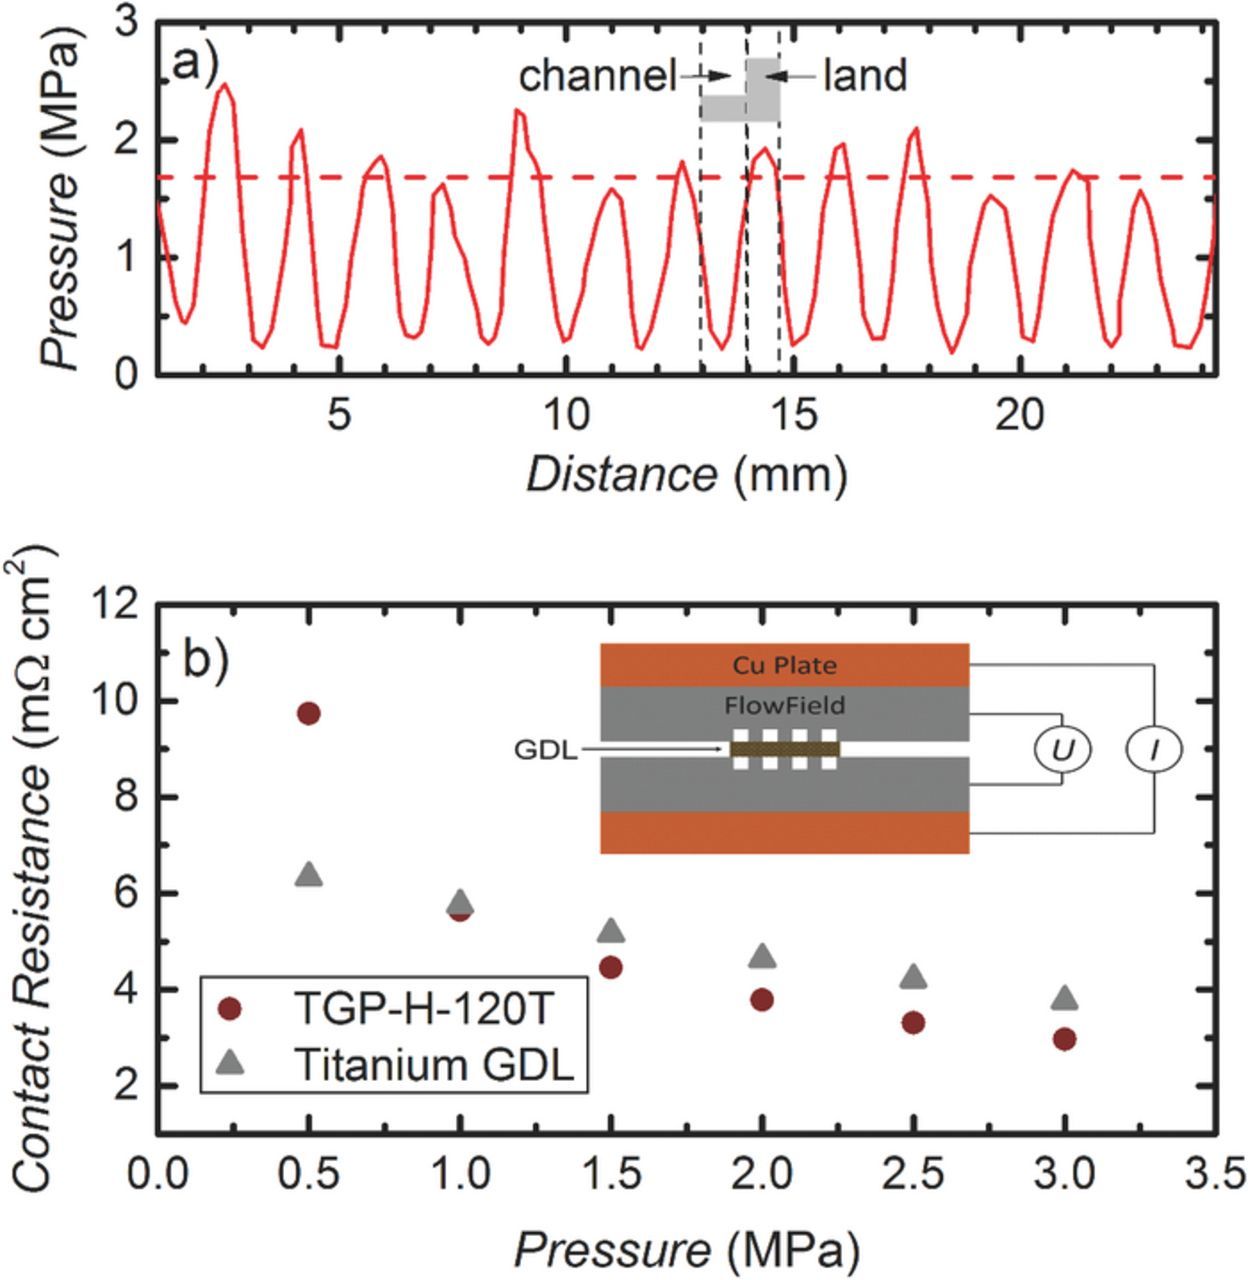
Figure 2. a) Pressure distribution for 5 cm2 flow-field with a titanium and a carbon PTL at a compressive force resulting in a carbon paper strain of 25%. b) Contact resistance of one flow-field/PTL interface for carbon paper and titanium PTL vs. compressive force on the PTL, whereby the compression is obtained by dividing the applied force by the land area of the flow-field plates. The inset shows the setup for the contact resistance measurement.
Results
Electrode thickness and ionomer volume fraction
Fig. 3a shows an exemplary SEM image of an MEA cross-section determined after the electrochemical measurements, employed to quantify electrode thickness. All Pt/C electrodes with a loading of 0.35 ± 0.05 mgPt cm−2 (corresponding to a carbon loading of 0.40 ± 0.06 mgc cm−2) had a thickness of 10 ± 1 μm. This is in agreement with the expected electrode thickness of 28 ± 2 μm for a carbon loading of 1 mgc cm−2.26 The thickness of the IrO2/TiO2 electrodes ranged from 8–12 μm, depending on the exact catalyst loading. From the catalyst loading, Lcat, the anode electrode thickness, tan, and the average catalyst density, ρcat = 9.5 g cm−2, the catalyst volume fraction, Vcat, can be calculated:
![Equation ([1])](https://content.cld.iop.org/journals/1945-7111/163/11/F3179/revision1/d0001.gif)
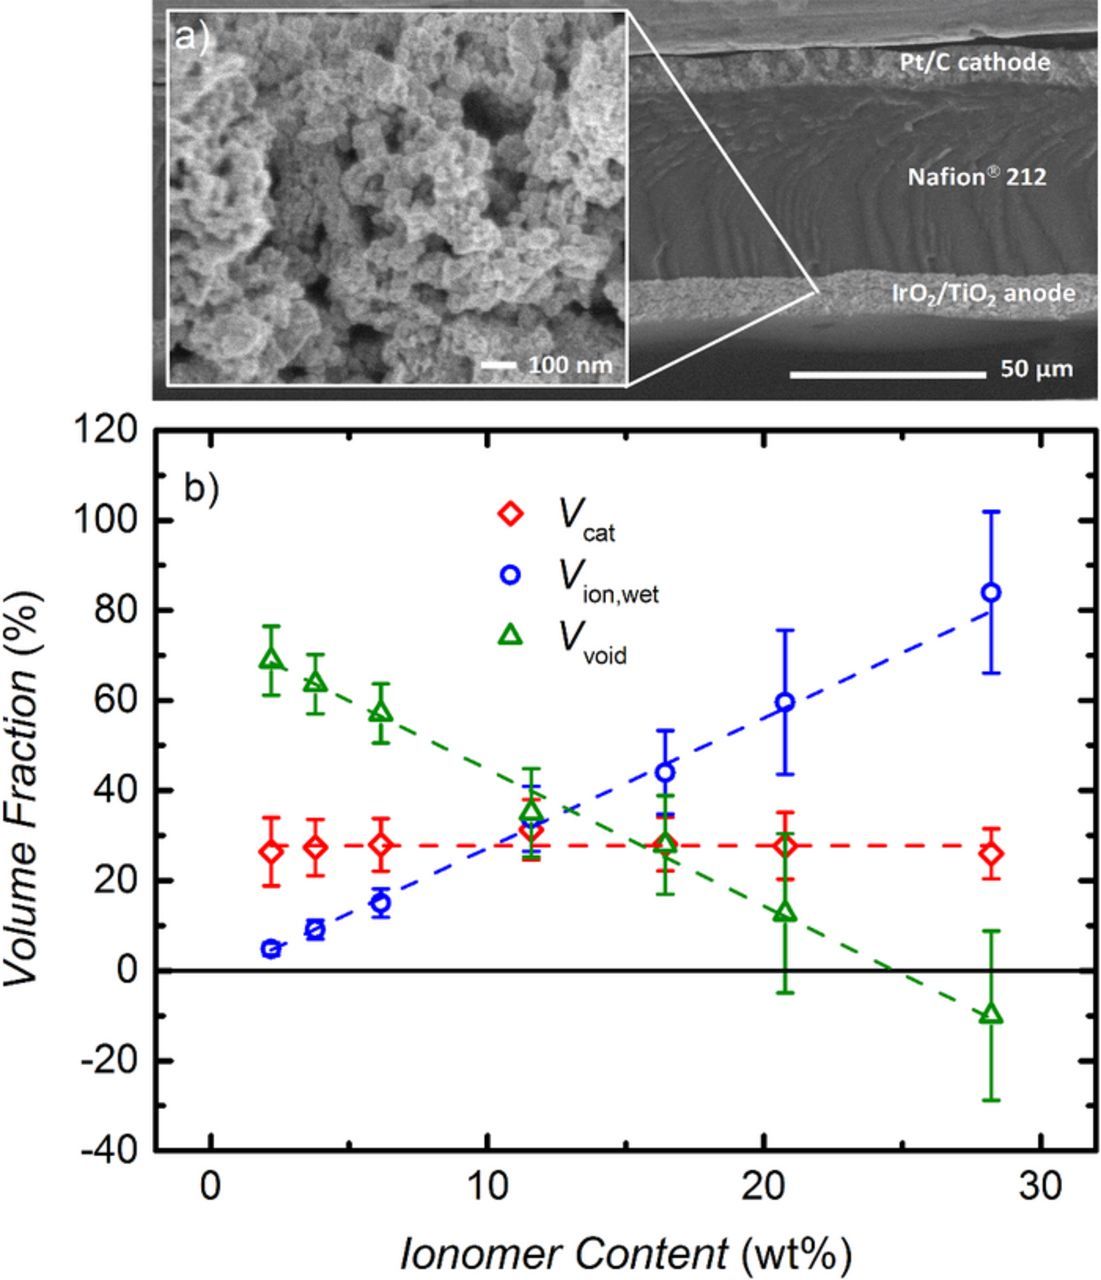
Figure 3. a) SEM image of an MEA cross-section. The inset shows a higher resolution SEM image of the IrO2/TiO2 anode electrode. b) Electrode volume fractions versus ionomer content for the IrO2/TiO2 catalyst, Vcat (red diamonds), the ionomer equilibrated with liquid water at 80°C, Vion,wet (blue circles), and for the remaining electrode void volume, Vvoid (green triangles). These were determined by measuring the thickness and the areal weight of the anode electrodes.
The average catalyst density was calculated based on the assumption that the catalyst consists of iridum(IV)oxide and titanium(IV)oxide. With the weight percentages of the components (86.9 wt% IrO2 and 13.1 wt% TiO2) and the densitiy of the materials (11.7 g cm−3 for IrO2 and 4.23 g cm−3 for TiO2 (rutile)) the average catalyst density can be calculated. As shown in Fig. 3b, Vcat is about 28% for all IrO2/TiO2 based anode electrodes (s. red diamonds in Fig. 3b), yielding an electrode void volume of 72% in the absence of ionomer (i.e., for 0 wt% ionomer). The empty pores are partially filled by the ionomer which is incorporated into the electrode structure; its volume fraction in the electrode can then be calculated by:
![Equation ([2])](https://content.cld.iop.org/journals/1945-7111/163/11/F3179/revision1/d0002.gif)
where Lion is the loading of ionomer in the electrode, ρion = 2.1 g cm−2 is the ionomer density, and Vion, dry corresponds to the volume of the dry ionomer. Swelling of the ionomer under operating conditions (80°C, liquid water) must be considered when calculating the actual ionomer volume fraction, Vion, wet, which is about a factor of 1.8 higher compared to the dry ionomer volume.27 The ionomer volume fraction in equilibrium with liquid water at 80°C, Vion, wet, is shown by the blue circles in Fig. 3b, while the remaining void volume in the electrode, Vvoid, is shown by the green triangles in Fig. 3b. Error bars represent one standard deviation based on the variation of the measured electrode thickness. Note that the same analysis was applied previously to PEM fuel cell MEAs.31
For an ionomer content increasing from 2.2–28.0 wt% relative to the total electrode weight, the wet ionomer volume fraction in the electrode increases from 5–84%. The remaining void volume is obtained by subtraction of Vcat and Vion, wet from the total electrode volume, i.e., from 100%. Hence, for an ionomer content of 20–25 wt%, the electrode void volume will be essentially completely filled with ionomer. Finally, using the BET surface area of the IrO2/TiO2 catalyst of 31 m2 gcat−1, the effective ionomer film thickness on the catalyst surface can be calculated assuming a uniform ionomer film over the total catalyst surface, which then results in nominal ionomer film thicknesses increasing from ≈0.6 to ≈11 nm as the ionomer content increases from 2.2 to 28.0 wt%. The assumption of a homogeneous ionomer film is only valid if the pore size in the electrode is much larger than the nominal film thickness. From the inset in Fig. 3a it can be seen that the pores in the IrO2/TiO2 electrode range from ≈10 to ≈100 nm. Even smaller pores might be present as well, but could not be identified from the SEM image. Consequently, the assumption of a uniform ionomer film thickness might not be applicable, especially for samples with a high ionomer content.
Electrolysis performance: influence of ionomer content
Steady-state polarization curves at 80°C and ambient pressure are shown in Fig. 4a for MEAs with an anode ionomer content of 3.9, 11.6, and 28.0 wt%. The best performance is obtained for the intermediate ionomer content of 11.6 wt%, with Vion,wet ≈ Vvoid ≈ 35% (s. Fig. 3b). Here, a cell voltage of 1.57 V is measured at a current density of 1 A cm−2, and even at 6 A cm−2 the cell voltage stays clearly below 2 V (s. blue circles in Fig. 4a). For the sample with 3.9 wt% ionomer (s. red diamonds in Fig. 4a), the performance decreases only slightly, while for the sample with 28 wt% ionomer (s. green squares in Fig. 4a), the cell voltage is significantly higher, which is partly due to a higher HFR (s. below). In Fig. 4b, the cell voltages corrected by the HFR (iR-free) are plotted for all MEAs. Again, the best performance can be observed for the sample with 11.6 wt% ionomer (s. blue circles in Fig. 4b), while the cell voltage increases when the ionomer content either decreases or increases with respect to this value.

Figure 4. Ambient pressure polarization curves (80°C, 5 mlH2O min−1) for MEAs with different anode ionomer loadings (in weight percent relative to total mass of electrode) using a ≈50 μm thick Nafion 212 membrane: a) measured cell voltage; b) cell voltage corrected by HFR. Anode and cathode catalyst loadings are 0.35 ± 0.05 mgPt cmMEA−2 and 2.00 ± 0.25 mgIr cmMEA−2, respectively.
For high current densities, the amount of heat produced at the MEA can reach up to ≈3 W cm−2 and since the temperature is not measured directly at the membrane but in the flow-fields, a significant difference between the actual MEA temperature and the measured value can be expected, estimated to be ≈6°C at 6 A cm−2. Consequently, all further analysis is carried out only for current densities up to 3 A cm−2, where the maximum heat production is <1 W cm−2, resulting in a reasonably small temperature difference of less than 2°C.
A more detailed analysis of the influence of ionomer content on cell performance is given in Fig. 5, where the iR-free cell voltages at three fixed current densities (0.1 / 1.0 / 3.0 A cm−2) are plotted against ionomer content. A minimum iR–free cell voltage is observed at 11.6 wt% for all current densities (Fig. 5a), increasing for both lower and higher ionomer content as could already be seen in Fig. 4b. However, the maximum difference in iR-free cell voltage is only ≈50 mV at 3 A cm−2. Fig. 5b shows the HFR for the different current densities vs. the ionomer content. It can be seen that the HFR is almost constant for all MEAs with an ionomer content up to ≈16 wt%, with a value of 52.5 ± 1.5 mΩ cm2. Considering that the HFR should be the sum of Rmemb and Rel, this HFR-value can be compared with the independently measured values for Rmemb and Rel. In the applied cell configuration with an average compressive force of 1.7 MPa on the flow-field lands (s. Fig. 2a), Rel is ≈12 mΩ cm2 as described earlier. For the Nafion 212 membrane, a conductivity of 142 mS cm−1 was measured at 80°C in liquid water, which is in agreement with the values reported in literature.32–36 The thickness of the membrane, assembled in the cell, is between ≈58–77 μm. The lower value is obtained if the volume expansion due to exposure to water occurs isotropically, whereas the higher value was calculated according to Liu et al., making the assumption that the volume expansion only occurs in the through-plane direction.25 This leads to a membrane resistance Rmemb of ≈41–54 mΩ cm2. The sum of Rel and Rmemb therefore is predicted to range in between 53–66 mΩ cm2. Comparing these values to the measured HFR (52.5 ± 1.5 mΩ cm2), the agreement between measured and predicted HFR is very good, if one assumes an isotropic volume expansion of the membrane.
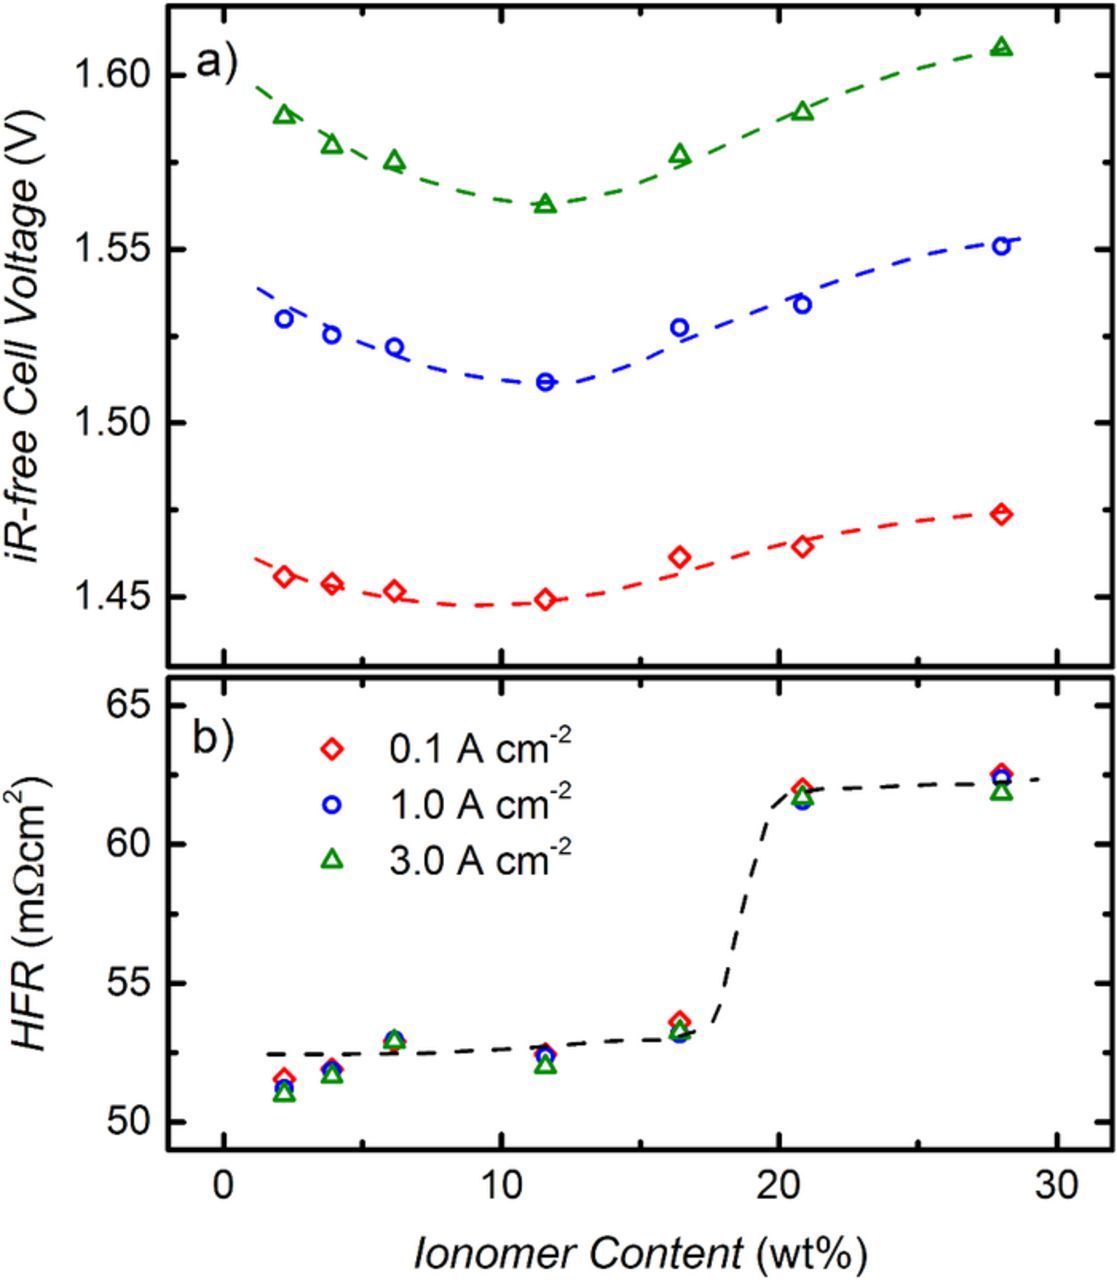
Figure 5. a) Ambient pressure cell voltage corrected by HFR, EiR–free, at current densities of 0.1 A cm−2, 1.0 A cm−2 and 3.0 A cm−2 (80°C, 5 mlH2O min−1) as a function of anode ionomer content (in weight percent relative to total mass of electrode). b) Corresponding HFR.
At an ionomer content of ≈20 wt%, the HFR increases significantly to ≈63 mΩ cm2 and stays at this value for even higher ionomer contents. The sudden increase of the HFR coincides quite well with the predicted complete filling of the electrode void volume for an ionomer content of approximately >20 wt% (s. green triangles in Fig. 3b). This suggests that in the case when the ionomer volume exceeds the void volume between the catalyst particles, an electronically insulating film of residual ionomer forms at the electrode/PTL interface, leading to a higher contact resistance and thus to a higher HFR. The increase in iR-free cell voltage in this case is likely related to an additional electronic insulation of parts of the catalyst particles, leading to higher kinetic overpotentials and thus higher iR-free cell voltages.
To ensure reproducibility of the results, three different MEAs with the optimum ionomer content of 11.6 wt% were tested. The anode catalyst loading was between 2.00–2.20 mgIr cmMEA−2 and the cathode catalyst loading was 0.35 ± 0.05 mgPt cmMEA−2 for the three samples. For current densities up to 3 A cm−2 the electrochemical measurements showed excellent reproducibility, with differences in cell voltage of less than 10 mV, Tafel Slopes between 45–47 mV dec−1 and HFRs of 52–55 mΩ cm2.
High pressure electrolysis
High pressure electrolysis tests were carried out with the MEA with the above found optimal anode ionomer content of 11.6 wt%. Polarization curves were recorded at differential pressure conditions, with a cathode pressure pcath of 3, 10, and 30 bara, while the anode pressure was kept at 1 bara. Before and after the differential pressure tests, a polarization curve was recorded at ambient pressure conditions (pcath = pan= 1 bara) to ensure that no degradation had occurred during the differential pressure tests. The recorded cell voltages before and after the differential pressure tests were identical within a range of ±2 mV. The polarization curves at different hydrogen pressures are shown in Fig. 6. The cell voltage increases with increasing operating pressure, and at the highest shown current density of 3 A cm−2, an increase of the cathode pressure from ambient pressure to 30 bara results in an increase in cell voltage of <50 mV (s. Fig. 6a), which is at least qualitatively consistent with other data in the literature.1 Since the HFR is essentially independent of pressure (data not shown), a similar gain in EiR–free is observed (s. Fig. 6b). The fact that the differences between the curves in Fig. 6 are decreasing with increasing current density is addressed in more detail in the Discussion section.

Figure 6. Polarization curves for MEAs at hydrogen cathode pressures of 1–30 bara (80°C, 5 mlH2O min−1) while keeping the oxygen anode at ambient pressure: a) measured cell voltage; b) cell voltage corrected by HFR. Anode and cathode catalyst loadings are 0.35 ± 0.05 mgPt cmMEA−2 and 2.00 ± 0.25 mgIr cmMEA−2, respectively; ≈50 μm thick Nafion 212 membrane.
In the Discussion section, we will now analyze the various voltage loss terms as a function of the ionomer content in the anode electrode of the MEA, seeking to explain the origin of the increasing cell voltage at ionomer contents above and below the experimentally determined optimum value. In addition, we will provide an explanation for the reported decrease in mass transport resistance with increasing operating pressure.3
Discussion
In the following, the contribution of the different voltage losses to the total overpotential and the influence of the operating pressure will be discussed. The overall electrolysis cell voltage can be defined by adding the voltage loss terms to the reversible cell voltage:
![Equation ([3])](https://content.cld.iop.org/journals/1945-7111/163/11/F3179/revision1/d0003.gif)
where Erev is the reversible cell voltage, which is a function of temperature and pressure, and Rmemb and Rel are the ohmic resistance of the membrane and the electronic resistance, respectively. ηHER and ηOER are the kinetic overpotentials for the HER and the OER, while  and
and  represent the effective proton transport resistance in the respective electrodes. Finally, ηmt describes additional losses which can be related to mass transport. For ambient pressure operation, the effect of H2 and O2 crossover is small compared to the other losses and can be neglected.37 For simplicity, voltages are treated as positive values, even though in a strict thermodynamic view, they would have negative values for an electrolyzer.
At a temperature of 80°C, the saturation pressure of H2O is 0.47 bara, so that for ambient pressure operation of the cell (1 bara), the partial pressures of hydrogen in the cathode and of oxygen in the anode are  = 0.53 bara and
  = 0.53 bara, respectively. Erev, which is a function of temperature and activity of the species involved in the reaction can then be calculated for the cell reaction of H2Oliquid → H2 + 0.5 O2 by:
![Equation ([4])](https://content.cld.iop.org/journals/1945-7111/163/11/F3179/revision1/d0004.gif)
where the temperature dependence of the standard reversible potential, E0rev, can be obtained from Reference38 as:
![Equation ([5])](https://content.cld.iop.org/journals/1945-7111/163/11/F3179/revision1/d0005.gif)
For liquid water, the activity of water, a(H2O), is one, while the activity of the gaseous species is represented by the ratio of their partial pressure to the standard pressure of 1 bara. Thus, at ambient pressure and 80°C,  , which yields a reversible cell voltage of Erev = 1.168 V (first term on the right-hand side of Eq. 3). As discussed in the previous section, the ohmic loss can be corrected for by subtracting the product of current density and HFR from the measured cell voltage (second term on the right-hand side of Eq. 3).
Voltage losses at the H2 cathode
For the calculation of ηHER, the Butler-Volmer equation can be linearized due to the fast reaction kinetics.10 The overpotential can then be defined as:31
![Equation ([6])](https://content.cld.iop.org/journals/1945-7111/163/11/F3179/revision1/d0006.gif)
where
![Equation ([7])](https://content.cld.iop.org/journals/1945-7111/163/11/F3179/revision1/d0007.gif)
With an exchange current density of i0, HER = 250 mA cmmetal−2 at 80°C,12 a cathode catalyst loading of LPt = 0.35 mgPt cm−2, and an electrochemically active surface area of APt, el = 60 m2 gPt−1 31 for the catalyst used in this study, RK, HER equates to 0.29 mΩ cm2, which results in an ηHER value of less than 1 mV even at a current density of 3 A cm−2. Thus, the kinetic overpotential for the HER, ηHER, can be neglected in the further analysis.
On the other hand, the effective proton transport resistance for the hydrogen cathode can be calculated following the approach described by Gu et al.:31
![Equation ([8])](https://content.cld.iop.org/journals/1945-7111/163/11/F3179/revision1/d0008.gif)
where
![Equation ([9])](https://content.cld.iop.org/journals/1945-7111/163/11/F3179/revision1/d0009.gif)
Here, the sheet resistance for proton transport in a Pt/C electrode,  , can be calculated from the reported sheet resistivity of ≈25 Ω cm for a Pt/Vulcan electrode with an I/C-ratio of 0.6/1 at 80°C and a relative humidity of 122% (i.e., in the presence of liquid water)25 and the electrode thickness of ≈10 μm (s. Experimental section), equating to a proton conduction sheet resistance of
  ≈ 25 mΩ cm2. Together with the above determined charge transfer resistance (RK, HER ≈ 0.29 mΩ cm2), this yields a β–value of ≈9 (s. Eq. 9). Thus, the effective proton transport resistance,
  , calculated by Eq. 8 is ≈2.5 mΩ cm2, which would result in very small voltage loss of ≈7 mV at 3 A cm−2.
Voltage losses at the O2 anode
The overpotential for the OER can be determined from a Tafel fit of the data in Fig. 4, as shown in Fig. 7, where the iR-free cell voltage is plotted on a logarithmic current scale. The Tafel slope was determined in the 10–100 mA cm−2 region, where the behavior is approximately linear and the effects of proton and mass transport resistances can be neglected. The Tafel slopes are between 45–50 mV dec−1 (see Table I), which is reasonably consistent with the values of 40–56 mV dec−1 reported by Matsumoto and Sato for sputtered and thermally prepared IrO2,39 and with 40–45 mV dec−1 reported by Reier et al.40 for amorphous iridium oxide on a titanium substrate. In analogy to the quantification of the activity for the oxygen reduction reaction (ORR) in PEM fuel cells, where the activity of different catalysts is benchmarked at an iR–free cell voltage of 0.9 V, due to the negligible transport resistances at the low current densities at this voltage,41 we here propose to quantify the activity of OER catalysts at an iR-free cell voltage of 1.45 V. At this potential, the current density is large enough to neglect the effect of ohmic shorting, but still small enough to largely exclude the influence of mass transport resistances. The respective values for the current density at 1.45 ViR–free and for the mass-specific current densities (in units of A gIr−1) are given in Table I.
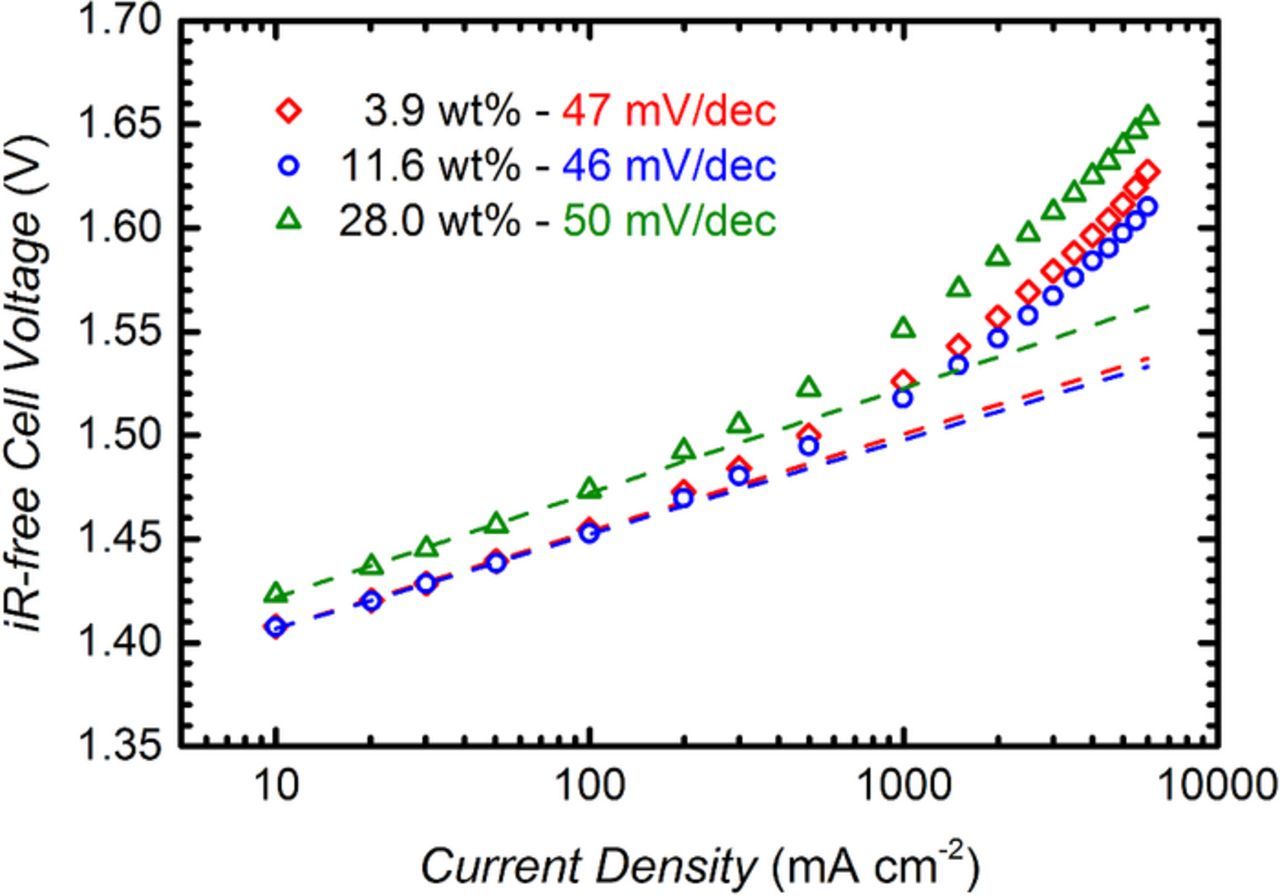
Figure 7. Ambient pressure Tafel plot of the iR-free voltage data from Fig. 4 (80°C, 5 mlH2O min−1) for different anode ionomer loadings (in weight percent relative to total mass of electrode). The Tafel slope is obtained from a linear fit of the values between 10–100 mA cm−2. Anode and cathode catalyst loadings are 0.35 ± 0.05 mgPt cmMEA−2 and 2.00 ± 0.25 mgIr cmMEA−2, respectively; ≈50 μm thick Nafion 212 membrane.
Table I. Estimated values for the proton conduction sheet resistance of different anode electrodes, RH+,an (at 80°C in contact with liquid water), determined by Eq. 11 and assuming τ = 0.7–1.5, σ = 142 mS cm−1, and using Vion,wet from Fig. 3b. Furthermore, kinetic parameters and mass specific capacity for the IrO2/TiO2 OER catalyst in MEAs with different ionomer content: i) geometric current density and mass specific current density (in A gIr−1) at an iR–free potential of 1.45 V; ii) Tafel slope for the OER; and, iii) mass specific capacity (C gIr−1) determined by cyclic voltammetry between 0.05 and 1.0 V.
| Ionomer Content | RH+,an | I at EiR-free = 1.45V | Tafel Slope | CV Charge | |
|---|---|---|---|---|---|
| (wt%) | (mΩ cm2) | (mA cm−2) | (A gIr−1) | (mV dec−1) | (C gIr−1) |
| 2.2 | 80–171 | 67.2 | 46.1 | 47 | - |
| 3.9 | 49–106 | 69.0 | 38.9 | 47 | 294 |
| 6.1 | 33–71 | 78.1 | 39.0 | 45 | 272 |
| 11.6 | 14–30 | 90.1 | 42.9 | 46 | 294 |
| 16.4 | 11–23 | 63.9 | 32.6 | 45 | 232 |
| 20.8 | 9–18 | 54.9 | 26.7 | 49 | 194 |
| 28.0 | 6–13 | 38.7 | 20.1 | 50 | 155 |
Considering that the anode and cathode catalyst loadings are essentially identical for the three MEAs shown in Fig. 7, one would expect a superposition of the Tafel lines in the kinetically controlled region, i.e., at low current densities. One explanation for the clearly higher value of ηOER for the MEA with an anode ionomer content of 28 wt% (s. green triangles in Fig. 7) might be a lower electrochemically active surface area (ECSA) compared to the other samples. For oxide based catalysts, the number of active sites available for the OER is typically related to the voltammetric charge q obtained from integration of a cyclic voltammogram (CV),42–44 assuming that the number of active sites for the OER is proportional to the voltammetric charge. The CVs for the samples with 3.9, 11.6, and 28.0 wt% ionomer recorded at a scan rate of 50 mV s−1 are shown in Fig. 8, whereby the voltammetric current is normalized by the mass of iridium. Quite clearly, the voltammetric charge for the samples with 3.9 and 11.6 wt% ionomer is very similar, while it is significantly lower for an ionomer content of 28.0 wt%. The values of the mass normalized voltammetric charge or mass specific charge, q*, obtained from an integration of the CVs between 0.05–1.00 V are shown for all examined MEAs in the last column of Table I. The substantially lower mass specific capacity, q*, of the MEA with 28 wt% ionomer (155 C gIr−1; s. Table I) compared to the 3.9 and 11.6 wt% ionomer containing MEAs (294 C gIr−1; s. Table I) can only be explained by a lower catalyst utilization in the former electrode. This, we believe, is due to the electronic insulation of parts of the catalyst by the ionomer, which occurs when the electrode void volume approaches zero (s. green triangles in Fig. 3b). This is in agreement with the findings of Xu et al., who also observed a decrease in the mass specific capacity at high ionomer content.29 Assuming that q* is directly proportional to the active sites for the OER, the differences in ηOER in the Tafel region would be related to:
![Equation ([10])](https://content.cld.iop.org/journals/1945-7111/163/11/F3179/revision1/d0010.gif)
With a Tafel slope of b ≈ 47 mV dec−1 and the values for q*1 = 294 C gIr−1 and q*2 = 155 C gIr−1 for the MEAs with 11.6 wt% and 28.0 wt% ionomer, respectively, the predicted value for ΔηOER is ≈13 mV, which is in excellent agreement with the shift of the iR-free cell voltage observed in Fig. 7. Consequently, when normalizing the mass specific activity (evaluated at 1.45 ViR–free; s. Table I) of the IrO2/TiO2 catalysts by their mass specific capacity, the resulting capacity normalized activity averaged over all MEAs is 138 ± 6 mA C−1, i.e., essentially identical for all MEAs tested here. In summary, part of the lower performance at high ionomer content is due to the electronic insulation of some of the catalyst particles by the ionomer. Therefore, the effect of ionomer void volume filling must be considered when conducting kinetic experiments.
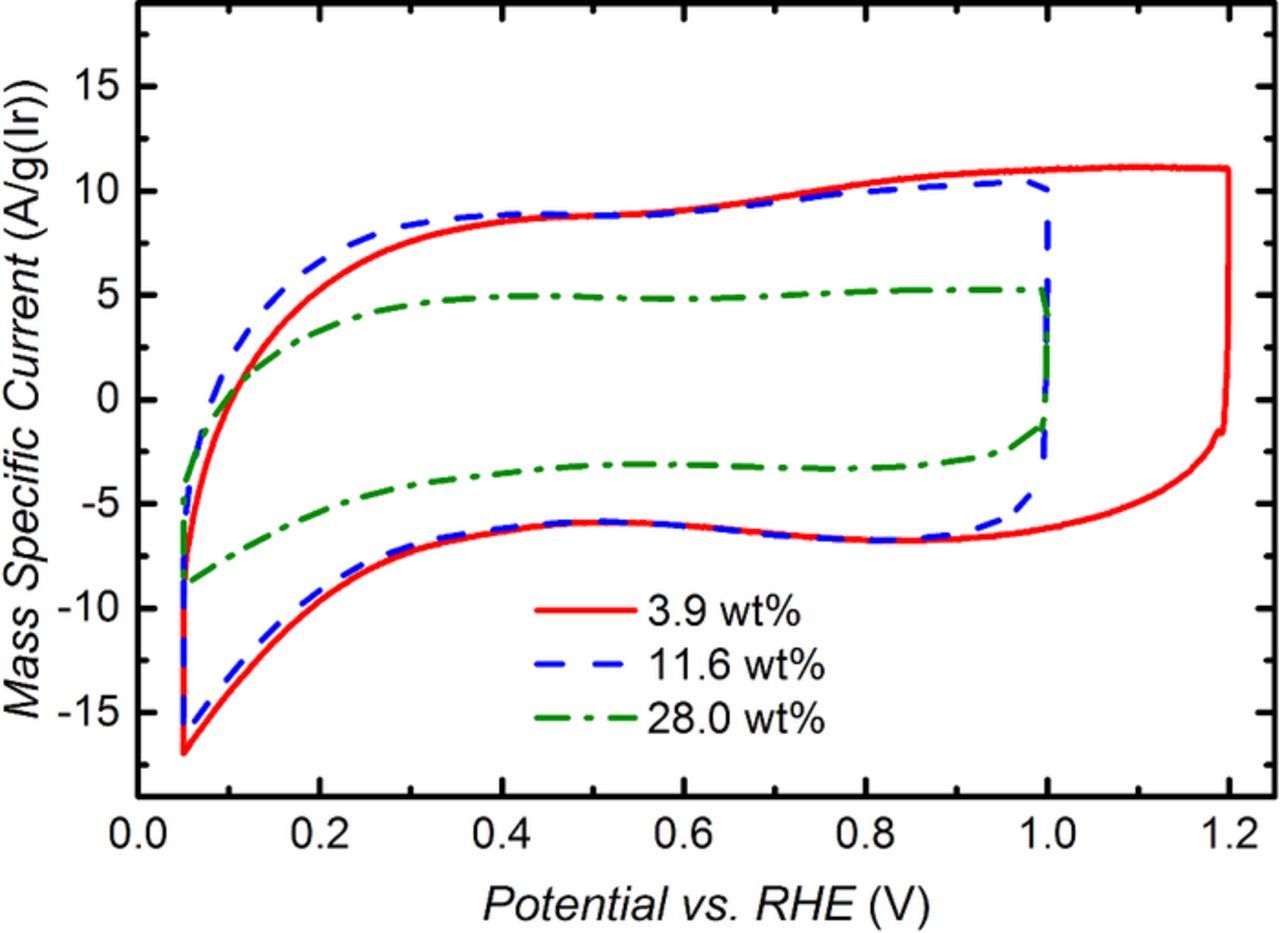
Figure 8. Ambient pressure cyclic voltammograms (CV) of IrO2/TiO2 based anodes with different ionomer contents (in weight percent relative to total mass of electrode). The mass-specific current is plotted vs. the applied potential. CVs were recorded at a scan rate of 50 mV/s at 80°C. H2O was supplied to the anode at 5 mlH2O min−1, and dry H2 was supplied to the cathode at ∼50 ml min−1.
To quantify the overpotential due to proton transport in the anode, first the electrode sheet resistance for proton conduction has to be determined, which in principle can be calculated from:25
![Equation ([11])](https://content.cld.iop.org/journals/1945-7111/163/11/F3179/revision1/d0011.gif)
where tan is the electrode thickness, σ is the conductivity of the ionomer, Vion, wet is the ionomer volume fraction in the liquid water equilibrated electrode, and τ is the apparent tortuosity of the ionomer phase in the electrode. The electrode thickness and ionomer volume fraction were determined from the cross-sectional SEM images as shown before (s. Fig. 3). The conductivity of the ionomer is assumed to be the same as that for the Nafion 212 membrane (142 mS cm−1 at 80°C in contact with liquid water) because of the essentially identical equivalent weight (EW). The apparent tortuosity was determined previously for a Pt/C electrode and turned out to be between 0.7–1.5 for a temperature of 80°C and a relative humidity of 122%.27 In a first approximation, we assume that the ionomer phase tortuosity of the IrO2/TiO2 electrode is in the same range as that obtained for the Pt/C catalyst. The so calculated minimum and maximum values for  are shown in Table I.
From the estimated sheet resistances for proton conduction,  (s. Table I), the effective proton conduction resistance in the anode electrode,
  , can be calculated from:45
![Equation ([12])](https://content.cld.iop.org/journals/1945-7111/163/11/F3179/revision1/d0012.gif)
where ζ is a correction factor which accounts for the effect of a reduced catalyst utilization, and which is a function of the dimensionless ratio of the proton conduction sheet resistance over the kinetic resistance:45
![Equation ([13])](https://content.cld.iop.org/journals/1945-7111/163/11/F3179/revision1/d0013.gif)
where i is the current density,  the proton transport resistance and b the Tafel slope.
From the above analysis, it is now possible to quantify all of the voltage loss terms on the right-hand side of Eq. 3, with the exception of the mass transport term, ηmt (last term on the right-hand side of Eq. 3). The magnitude of the latter can be estimated by subtracting all the known voltage loss terms from the reversible cell voltage, as will be shown in the following section.
Discussion of additional voltage losses
The fraction of the total overpotential which is not due to ohmic (determined by the HFR) and OER kinetic losses (the HER kinetic losses are only on the order of 1 mV; see above) can be determined from the difference between the Tafel line (s. dashed lines in Fig. 7) and the iR-free cell voltage (s. Fig. 4b). This remaining overpotential for the samples with 3.9, 11.6 and 28.0 wt% ionomer is plotted in Fig. 9 (red diamonds), along with the voltage loss contributions from proton conduction resistance in the anode and cathode electrodes. The additional undefined mass transport losses remaining after the subtraction of the proton conduction related voltage losses in the cathode electrode (green areas in Fig. 9) and in the anode electrode (blue areas in Fig. 9) are visualized by the red area in Fig. 9.

Figure 9. Remaining overpotential after subtraction of ohmic and kinetic losses for three MEAs with different ionomer content (red diamonds and red line) for polarization curves obtained at 80°C and ambient pressure (data from Figs. 4 and 7). The overpotential due to proton conduction resistance on the cathode is represented by the green area, corresponding to 2.5 mΩ cm2 (s. text). The overpotential due to proton conduction resistance on the anode is represented by the blue area, whereby the dotted blue lines give the lower and upper limit for  , determined from Eq. 12 and using the RH+,an. values given in Table I.
Let us first examine the analysis for the MEA with the anode electrode with a low ionomer content of 3.9 wt% shown in Fig. 9a. For this MEA, the anode void volume is ≈65% (s. Fig. 3b), so that one would expect little voltage losses due to O2 and H2O transport resistances. This can be examined by summing up the contributions from the proton conduction induced voltage losses in the cathode (green area in Fig. 9a) and in the anode (blue area in Fig. 9a), whereby the uncertainty in the latter is indicated by the blue dashed lines in Fig. 9a. Indeed, as expected, the unassigned voltage losses range between only ≈5 and ≈20 mV at 3 A cm−2, as is indicated by the voltage difference between the blue dashed lines and the red line in Fig. 9a. As we will explain in the next section, these losses are likely due to an overpotential caused by the pressure buildup of gaseous hydrogen in the cathode electrode, which we estimate to be on the order of ≈20 mV at 3 A cm−2.
For the MEA with the optimum ionomer content of 11.6 wt% in the anode, the unassigned voltage losses at 3 A cm−2 range from ≈20 to ≈30 mV (s. difference between the blue dashed lines and the red line in Fig. 9b). For this MEA, the void volume in the electrode (≈35%, s. Fig. 3b) is only roughly one half of that the above discussed MEA with an ionomer content of 3.9 wt%, so that an additional O2 and/or H2O transport resistance induced voltage loss of ≈10–15 mV seems reasonable.
Finally, the unassigned voltage losses for the MEA with 28.0 wt% ionomer in the anode electrode range between ≈40–45 mV at 3 A cm−2 (s. difference between the blue dashed lines and the red line in Fig. 9c). While approximately 20 mV may be caused by the above mentioned additional losses at the cathode, we believe that the remaining losses are largely due to oxygen transport resistances originating from the strong diffusion barrier imposed by a completely ionomer filled anode electrode (s. Fig. 3b). In this case it is conceivable that the local O2 pressure at the electrode increases, which in turn would increase the reversible cell potential according to the Nernst Equation by ΔErev, equating to a mass transport induced overpotential, ηmt:
![Equation ([14])](https://content.cld.iop.org/journals/1945-7111/163/11/F3179/revision1/d0014.gif)
where  and
and  are the partial pressures of O2 in the electrode and in the flow-field channel, respectively. For a perfectly crack-free ionomer filling of the anode electrode, the produced O2 must be removed by permeation through the ionomer phase. The required O2 partial pressure in the catalyst layer,
  , to support O2 permeation at a rate equivalent to the O2 generation rate can then be calculated by:46
![Equation ([15])](https://content.cld.iop.org/journals/1945-7111/163/11/F3179/revision1/d0015.gif)
where teff is the effective permeation path,  represents the oxygen generation rate (i.e.,
  ), and
  is the permeability of O2 in the Nafion ionomer. As a first approximation, teff is assumed to be half of the anode electrode thickness (i.e.
 ). For
  , a value of
  is estimated for our electrode, based on the permeability of Nafion 212 at the given operating conditions (80°C, liquid water).46 With these parameters, a pressure gradient Δp of up to ≈200 bar would be required at 3 A cm−2, resulting in an overpotential ηmt of ≈45 mV (based on Eq. 14, with 0.53 bara O2 in the flow-field channel at ambient pressure and 80°C). On the other hand, the expected loss due to an O2 partial pressure gradient is more on the order of ≈20–25 mV (s. above), which would correspond to a much lower value of Δp ≈ 10 bar. For this reason, we believe that the main path for oxygen removal from the electrode is not permeation but convective transport through cracks or pinholes in the ionomer layer within the electrode, even for electrodes with nominally zero void volume.
Mass transport on the H2 side could play a role for all MEAs in the case of water flooding of the cathode catalyst layer, as illustrated in Fig. 10. At high current densities, the transport of H2O to the cathode by electro-osmotic drag can become quite significant, with drag coefficients under electrolyzer operating conditions in the range of 2.5–3.2.47 The H2O dragged to the cathode will be removed by a combination of pressure-driven back-diffusion through the membrane to the anode and water expulsion into the cathode flow-field by the evolving H2 gas. If the contact angle inside the cathode catalyst layer is <90° (i.e., if the cathode electrode is hydrophilic), the H2 pressure inside the cathode electrode must reach the capillary pressure, pcap, in order to push the water out of the electrode pores. The capillary pressure can be estimated by:
![Equation ([16])](https://content.cld.iop.org/journals/1945-7111/163/11/F3179/revision1/d0016.gif)
with the surface tension of water  , the capillary radius rcap, and the water contact angle in the electrode θ. The surface tension of water,
  , at 80°C is 0.0626 N m−1, and rcap is ≈25 nm for an average pore diameter in the cathode catalyst layer of ≈50 nm.31 With these values, the capillary pressure pcap would range from 0–25 bar for contact angles ranging from 90 to 0° (at contact angles >90°, no H2 pressure buildup would be required for the expulsion of water from the cathode electrode). Unfortunately, the exact value for θ is difficult to measure, as the contact angle of membranes and ionomer bonded electrodes depends on the hydration state and the history of the electrode. Yu et al. investigated the contact angle of membranes and of catalyst layers composed of Pt/C and ionomer by the sessile drop method and by environmental scanning electron microscopy.48 For a Nafion membrane they observed a decrease of the contact angle from initially 93.9° to 87.8° after extended contact with liquid water. For the catalyst layer of new MEAs, they found contact angles of ≈145°, while it decreased to 33–98° for aged catalyst layers, most likely due to the gradual oxidation of the carbon support surface. We believe that the actual contact angle of conditioned and water soaked cathode electrodes is likely equal to the contact angle of the ionomer (i.e., of the Nafion membrane), which would suggest a contact angle of ≈87.8°, equating to a capillary pressure of pcap ≈ 2 bara. Further insights on this can be gained by the following analysis of the electrolyzer performance versus hydrogen pressure under differential pressure conditions (i.e., the anode compartment remaining at ambient pressure).

Figure 10. Scheme illustrating the H2O transport mechanisms in an electrolyzer. H2O is supplied to the anode catalyst layer and partly consumed by the H2O electrolysis reaction. Additionally, H2O is transported through the membrane to the cathode catalyst layer by electro-osmotic drag and expelled into the cathode flow-field by the evolving hydrogen gas and/or returned to the anode by pressure-driven back-diffusion through the membrane back to the anode. The partial pressure of O2 and H2 inside the electrodes is expected to be higher than the gas pressure in the flow-field.
High pressure electrolysis
Since only the H2 side of the cell is pressurized, the activities of H2O and O2 are not affected by the high pressure operation on the H2 side. Consequently, the shift of the reversible cell voltage ΔErev compared to ambient pressure operation ( ) can be calculated by:
![Equation ([17])](https://content.cld.iop.org/journals/1945-7111/163/11/F3179/revision1/d0017.gif)
For the maximum cathode pressure pcath = 30 bara ( ), the cell voltage should be shifted by ΔErev = 60.9 mV at 80°C. In Fig. 11, the iR-free cell voltages are plotted for the measurements at a cathode pressure between 1–30 bara. The curves were corrected by ΔErev to exclude the pressure induced shift of the reversible cell voltage from the analysis. Assuming that ΔErev is the only factor influencing the performance, the curves should lie on top of each other. For current densities of ≈200 mA cm−2 this is in fact the case. At smaller current densities, the pressure fluctuated due to the low gas flow, which can explain some fluctuations of the cell voltages. In general, however, in this current range the cell voltage at high pressure seems to be slightly lower than expected. This can be explained by the H2 crossover through the membrane. For a H2 permeability of 3 · 10−9
  ,49 the H2 crossover current at a cathode pressure of 30 bara is ≈30 mA cm−2. Consequently, for small current densities, the H2 flux to the anode is in the range of the O2 production. Since H2 does not react with O2 at the anode but accumulates,50 its presence effectively lowers the O2 partial pressure at the anode, which leads to a reduction of Erev according to Eq. 4. This, of course, is an undesireable operating condition, as significant concentrations of H2 build up in the O2 compartment.

Figure 11. IR-free cell voltages corrected by ΔErev (s. Eq. 17) for measurements at a total cathode pressure ranging from 1 to 30 bara (80°C, 5 mlH2O min−1). The black dashed line indicates the average Tafel slope for all measurements (≈50 mV dec−1). The inset shows the difference between the data at any given pressure and the data at 30 bara, i.e, ΔE ≡ (EiR-free –ΔErev)x bara – (EiR-free – ΔErev)30 bara. Anode and cathode catalyst loadings are 0.35 ± 0.05 mgPt cmMEA−2 and 2.00 ± 0.25 mgIr cmMEA−2, respectively; the anode ionomer content is 11.6 wt%; ≈50 μm thick Nafion 212 membrane.
While the dilution effect of crossover H2 becomes negligible at current densities of >300 mA cm−2, the cell voltage for high pressure operation gets increasingly lower than expected from ΔErev, i.e., the electrolyzer performance at high pressure actually improves when corrected for ΔErev (s. black squares at 30 bara vs. red diamonds at 1 bara in Fig. 11). This can be seen more clearly in the inset of Fig. 11, which shows the difference between the ΔErev–corrected voltage at any given pressure referenced to that at 30 bara, clearly indicating a maximum improvement of ≈20 mV at 3 A cm−2 when raising the H2 pressure from 1 to 30 bara. Therefore, high pressure operation of the H2 cathode must result in a reduction of one of the voltage loss terms. A similar phenomenon has been observed in other studies and was ascribed to a reduction of the size of produced gas bubbles at high pressure5,6 or to improved OER kinetics, inferred from a lower apparent Tafel slope at high pressure.3 However, in these studies the O2 side of the cell was also pressurized (balanced pressure), in contrast to the experiments in our study which were carried out at differential pressure conditions. Consequently, in our measurements, the OER kinetics and the O2 mass transport should not change, suggesting that high H2 pressure must affect some so far not addressed voltage loss on the H2 side of the electrolysis cell. We believe that its most likely origin is a mass transport overpotential on the cathode caused by an increased partial pressure of H2 in the cathode catalyst layer,  . This is illustrated by assuming a difference in H2 partial pressure between the cathode catalyst layer and the flow-field channel of pH2,cat - pH2,channel ≈ 2 bara, similar to the capillary pressure pcap ≈ 2 bara calculated by Eq. 16 with a contact angle of 87.8° and an average pore radius of 25 nm. The corresponding mass transport overpotential at pressures of either 1 or 30 bara in the H2 flow-field would be:
![Equation ([18])](https://content.cld.iop.org/journals/1945-7111/163/11/F3179/revision1/d0018.gif)
![Equation ([19])](https://content.cld.iop.org/journals/1945-7111/163/11/F3179/revision1/d0019.gif)
From this exemplary calculation it becomes clear that the overpotential due to H2 mass transport would be much larger at ambient pressure than at high pressure if the contact angle in the cathode electrode is <90°. The above estimated decrease of ηmt with increasing pressure would be expected to be most pronounced at high current densities, where a possible bypass of hydrogen through partially flooded pores would become more unlikely, thus leading to a gradual increase of the difference between the 1 and 30 bara voltage shown in the inset of Fig. 11. The overall difference of ≈20 mV at 3 A cm−2 (s. inset of Fig. 11), which is clearly caused by the hydrogen cathode performance corresponds, we believe, to the unassigned mass transport losses in Fig. 9a and to a large extent to those in Fig. 9b.
A summary of the contributions of the various voltage losses to the overall cell voltage is given in Fig. 12. for the MEA with the optimum ionomer content of 11.6 wt% in the anode. The highest overpotentials are due to the OER kinetic losses determined by a Tafel analysis, which account for ≈350 mV at 3 A cm−2 (s. purple area in Fig. 12) and the ohmic losses calculated from the HFR, which account for ≈155 mV at 3 A cm−2 (s. orange area in Fig. 12). The losses due to proton conduction resistance in the cathode and anode electrodes add up to ≈20 mV at 3 A cm−2 (s. green and blue area in Fig. 12). For the calculation of the proton conduction resistance in the anode electrode the lower limit of  is used (s. Fig. 9). The overpotential for H2 mass transport is calculated from the difference between the data at 1 bara and the data at 30 bara as shown in the inset in Fig. 11, which results in ≈20 mV at 3 A cm−2. The remaining losses account for less than 10 mV at 3 A cm−2 and can likely be attributed to O2 mass transport.

Figure 12. Contributions of various voltage losses to overall cell voltage. The reversible cell voltage is given by the dashed black line and the purple area represents the OER kinetic losses (y-axis is intercepted between 1.2 V and 1.4 V for better visualization of other losses). Ohmic losses are given by the orange area, and losses due to proton conduction resistance in the cathode and anode electrodes are shown by the green and blue areas, respectively. The red area represents the losses due to H2 mass transport and the full black line gives the cell voltage measured at ambient pressure (80°C, 5 mlH2O min−1). Anode and cathode catalyst loadings are 0.35 ± 0.05 mgPt cmMEA−2 and 2.00 ± 0.25 mgIr cmMEA−2, respectively; the anode ionomer content is 11.6 wt%; ≈50 μm thick Nafion 212 membrane.
Conclusions
In this study, we present a new small-scale single-cell electrolyzer cell design for differential pressure operation up to 30 bar, showing state-of-the-art performance. The influence of the ionomer content in the oxygen electrode based on a TiO2-supported IrO2 catalyst (≈2.0 mgIr cm−2) was analyzed, and an optimum of the electrolysis performance was found at an ionomer content of 11.6 wt%, corresponding to an electrode void volume fraction of ≈35% and a wet-ionomer volume fraction of also ≈35%.
Below the optimum ionomer content, the performance decreases, which can be related largely to voltage losses due to an increasingly limiting proton conductivity in the anode electrode. On the other hand, above the optimum ionomer content, the void volume filling of the anode by ionomer (equilibrated with liquid water) leads to additional overpotentials from O2 gas transport from the electrode to the flow-field channel, to an increase of the electronic contact resistance due to an ionomer film buildup at the anode electrode / porous transport layer interface, and to the electronic insulation of a fraction of the catalyst by the ionomer.
This was demonstrated by deconvoluting the overall voltage losses into: i) ohmic losses (quantified by the high-frequency resistance); ii) kinetic losses for the oxygen evolution reaction (OER) quantified by a Tafel analysis; and, iii) proton conduction losses in the anode and cathode electrodes. The kinetic losses for the hydrogen evolution reaction (HER) where shown to be negligible on the carbon-supported Pt cathode (≈0.35 mgPt/cm2). The extent of residual mass transport losses was determined by the difference between the reversible cell voltage corrected for the above described voltage losses and the measured electrolyzer voltage. For the optimum anode composition, a smaller fraction of the thus quantified transport losses (<30 mV at 3 A cm−2) is due to O2 transport in the anode electrode, while a larger fraction is due to additional voltage losses at the H2 cathode (i.e., beyond negligible HER kinetic losses and minor losses due to proton conduction resistance in the cathode).
The origin of the latter was revealed by analyzing the electrolyzer performance as a function of hydrogen pressure, while keeping the anode at ambient pressure (i.e., differential pressure operation). While one would expect the increase in electrolyzer potential with increasing hydrogen pressure to follow the Nernstian potential shift, the observed increase in electrolyzer potential was actually lower, i.e., the performance at high hydrogen pressure was better than predicted by the Nernst equation. Our analysis suggests that this is due to a substantial hydrogen pressure gradient between the cathode electrode and the flow-field channel, caused by the capillary pressure of water in a slightly hydrophilic cathode electrode and resulting in a hydrogen mass transport overpotential.
Acknowledgments
This work was funded by the Bavarian Ministry of Economic Affairs and Media, Energy and Technology through the project ZAE-ST (storage technologies). Seed-funding by the Bavarian State Ministry of Education and Culture, Science and Art through TUM's Munich School of Engineering in the framework of the "Energy Valley Bavaria" project is gratefully acknowledged. We thank Courtney Mittelsteadt (Giner Inc., Boston, USA) for the insight into electrolyzer testing, Marcel Schmidt and Marc Schönberger (TUM chemistry department workshop) as well as Svetoslav Koynov (Walther-Schottky-Intstitut, TUM) for their help with the cell design, Maximilian Möckl for the inspiring discussions, and Thomas Mittermeier, Armin Siebel and Yelena Gorlin for reviewing the paper. The electron microscopy was accomplished at the WACKER-Chair of Molecular Chemistry of the TUM with the assistance of Katia Rodewald.