Abstract
Interest toward developing all-solid-state batteries incorporating lithium-stuffed garnet electrolytes (LSGEs) has been on the constant rise. However, LSGEs are known to react with humidity, and subsequently, CO2 during preparation or storage, leading to Li2CO3 formation. In this study, we report the long-term exposure effects of CO2 and humidity on the lithium-ion conductivity of typical garnet-type Li7La2.75Ca0.25Zr1.75Nb0.25O12 with and without Al2O3 deposited by atomic layer deposition (ALD). The ionic conductivity of the samples was investigated by electrochemical impedance spectroscopy as a function of time for up to 1000 h. The impedance spectra of ALD-coated garnet-type Li7La2.75Ca0.25Zr1.75Nb0.25O12 sample was unaffected by long-term exposure to 400 ppm up to pure CO2 while the uncoated garnet-type sample show at least 8% increase in total resistance. Both samples show increased resistance in the presence of humidity, but the resistance recovers upon removal of the humidity.
Export citation and abstract BibTeX RIS

This is an open access article distributed under the terms of the Creative Commons Attribution Non-Commercial No Derivatives 4.0 License (CC BY-NC-ND, http://creativecommons.org/licenses/by-nc-nd/4.0/), which permits non-commercial reuse, distribution, and reproduction in any medium, provided the original work is not changed in any way and is properly cited. For permission for commercial reuse, please email: oa@electrochem.org.
Commercially available batteries used in current electric vehicles (EVs) that are based on organic electrolytes pose high safety concerns due to flammability and limited in practical energy density, which limits vehicle driving range.1,2 To overcome these bottlenecks of organic-based Li-ion batteries, alternative solid state (ceramic) electrolytes have been proposed.2,3 Using ceramic electrolytes, instead of organic-based electrolytes, removes the concern of flammability. Also, many of the solid-state electrolytes being studied offer the possibility of next-generation battery chemistries such as Li-O2 and Li-S.4 These chemistries are of interest due to their high theoretical energy density. Specifically, Li-S can reach an energy density of 2567 Wh kg−1 while aprotic and aqueous Li-O2 batteries exhibit theoretical energy density of 3505 Wh kg−1 and 3582 Wh kg−1, respectively.3,5
Among the solid electrolytes being investigated, ceramic Li-stuffed garnets have proven to be a strong candidate for high energy density all-solid-state Li batteries. Zr and Ta-based Li-stuffed garnets exhibit electrochemical stability up to 9 V vs. Li/Li+,6 possess high ionic conductivity of ≥10−3 S cm−1 and chemical stability at elevated temperatures (≥900°C).7,8 However, Li-stuffed garnets are limited by their wettability with elemental Li and reactivity toward CO2 and humidity at room temperature.9,10 Due to poor solid-solid contact between Li metal and garnet electrolyte, the area specific resistance (ASR) at the interface can be as high as 2000 Ω cm2 for uncoated samples.9 Recently, there have been many studies aimed at reducing this interfacial resistance through surface modification by bulk microstructure tuning, interfacial layer addition, and polishing.11–15 The most successful so far is an ultra-thin (∼10 nm) Al2O3 layer deposited via atomic layer deposition (ALD) which increases the wettability of lithium with the garnet and reduces the interfacial charge transfer resistance from 1710 Ω cm2 to 1 Ω cm2 at room temperature.11
Many groups have also studied the effect of carbonaceous species on the interface impedance between Li-garnet and Li.14,16–18 These studies conclude that Li2CO3 forms on the surface that acts as a Li+ insulating layer and increasing the interfacial Li-ion charge transfer resistance. A two-step reaction was proposed for the Li2CO3 formation, i.e., a spontaneous Li+/H+ reaction occurs due to the presence of humidity in the ambient and subsequent carbonate formation.9
![Equation ([1])](https://content.cld.iop.org/journals/1945-7111/166/10/A1844/revision1/d0001.gif)
![Equation ([2])](https://content.cld.iop.org/journals/1945-7111/166/10/A1844/revision1/d0002.gif)
Although efforts have gone toward understanding how Li2CO3 affects the lithium and garnet interface, little work has focused on the effects of hydroxides or carbonates on ionic conductivity. Here, we decouple the protonation and carbonaceous reactions to study their effect on the lithium-ion conductivity of Li-garnet. We report a comparative electrochemical stability of lithium-rich garnet-type Li7La2.75Ca0.25Zr1.75Nb0.25O12 (LLCZN) with and without a thin ALD-deposited Al2O3 layer in CO2 and humid atmospheres. The chemical and electrochemical stabilities of LLCZN were investigated using powder X-ray diffraction (XRD), scanning electron microscopy (SEM), atomic force microscopy (AFM), and electrochemical impedance spectroscopy (EIS). LLCZN is derived from the most commonly investigated garnet-type Li7La3Zr2O12 (LLZO). The simultaneous substitution of the La3+ site with Ca2+ and the Zr4+ site with Nb5+ in LLZO causes reduced sintering temperature while stabilizing the cubic garnet phase and increasing the Li-ion conductivity.11,19 We have reported the use of this composition in some of our previous studies.11,20,21
Experimental
LLCZN synthesis and ALD coating
The lithium garnet Li7La2.75Ca0.25Zr1.75Nb0.25O12 (LLCZN) samples were prepared via two separate methods – solid-state method for samples without ALD treatment and combination sol-gel and solid-state method for the samples with ALD coating. The sample without the Al2O3 coating was synthesized at the University of Calgary via the solid-state method.22,23 Stoichiometric amounts of LiNO3 (99%, Alfa Aesar) (10 wt% excess), La2O3 (99.99%, Alfa Aesar) (dried at 900°C for 12 h), Ca(NO3)2·4H2O (>99% Alfa Aesar), ZrO2 (99% Alfa Aesar), and Nb2O5 (99.99%, Alfa Aesar) were thoroughly mixed by planetary ball mill (Pulverisette, Fritsch, Germany) at 200 rpm with zirconia balls for 6 h in isopropanol. The resulting powders were dried and fired at 700°C for 6 h to decompose the nitrates and were then ball-milled a second time similar to the first milling step. The powders were isostatically pressed in rubber molds in oil with a pressure of 150 MPa. Compressed powder rods were placed on a powder bed from the same batch inside a clean alumina crucible and covered with additional mother powder to reduce the lithium loss during high-temperature treatment. The rods were sintered via a two-step heating process. The samples were heated to 900°C for 24 h then directly to 1100°C for an additional 6 h for densification.
The sample with Al2O3 (ALD-LLCZN) coating was synthesized at the University of Maryland (UMD) via the sol-gel method, as previously reported.11 Stoichiometric amounts of La(NO3)3 (99.9%, Alfa Aesar), ZrO(NO3)2 (99.9%, Alfa Aesar), LiNO3 (99%, Alfa Aesar), NbCl5 (99.99%, Alfa Aesar) and Ca(NO3)2 (99.9%, Sigma Aldrich) were dissolved in de-ionized water and 10% excess LiNO3 was added to compensate for lithium volatilization during high-temperature synthesis. Citric acid and ethylene glycol in the molar ratio of 1:1 were consequently added to the solution. The solution was slowly evaporated on a hotplate to produce the precursor gel with stirring, which was then heated to 400°C for 10 h to burn out the organics. The obtained powder was ball-milled and pressed into pellets for calcination at 800°C for 10 h. The synthesized powders were then uniaxially pressed into pellets, which were sintered at 1050°C for 12 h in alumina boats covered with the same powder. ALD coating was also performed at UMD. Sintered pellets were coated with an ultra-thin Al2O3 layer using atomic layer deposition (Beneq TFS 500). The thickness of the Al2O3 layer was measured using a spectrophotometer (MET03 – N&K spectrophotometer) and was to found be 10 nm. The crystal phase of the sintered materials was analyzed by powder X-ray diffraction at room temperature using a Bruker D8 Advance (Cu Kα, 40 kV, 40 mA) over the 2θ range 10–70° with a rate of 3 sec/step and step size of 0.02°. Further characterization of the Al2O3 layer was reported in our previous work.11
Physical and electrochemical characterization
In situ electrochemical impedance spectroscopy (EIS) measurements were performed using Li-ion blocking gold electrodes in air using a Solartron 1260 impedance analyzer (0.1 Hz-1 MHz; 100 mV) to characterize the conductivity of the samples at different temperatures. The electrochemical stability of the samples upon exposure to CO2 and humidity was investigated using a Parstat 4000 (Princeton Applied Research 0.1 Hz-1 MHz; 100 mV) coupled to an in-house environment chamber under flowing CO2 and 3% H2O in Ar, N2 or CO2. A schematic of the in situ EIS setup is shown in Fig. 1. The ALD-coated and uncoated samples were placed within a millimeter of each other inside the same tubular furnace during the measurements to minimize any temperature gradient effect, and to ensure that any change in impedance due to temperature fluctuation in the background is the same in both samples. Before the electrical conductivity measurements, pellets that are 1 to 1.5 mm thick and 10 mm in diameter (without Al2O3 coating) were polished using SiC polishing papers and isopropanol media, starting with #320 grit followed by #600 and finally #1000. The pellets were sonicated in isopropanol to remove any SiC particulate and dried in ambient at 80°C for 5 mins. The samples with Al2O3 coating were used as received. Both coated and uncoated pellets were then sputtered (Bal-Tec SCD 500) with gold on each side with a thickness of ∼30 nm/side to act as the current collector. Humid atmospheres were mimicked by passing Ar through a bubbler containing deionized water at room temperature to create a 3% humidity with Ar as the carrier gas. CO2 conditions were regulated by diluting CO2 with N2; all gases were controlled with mass flow meters (Alicat Scientific).
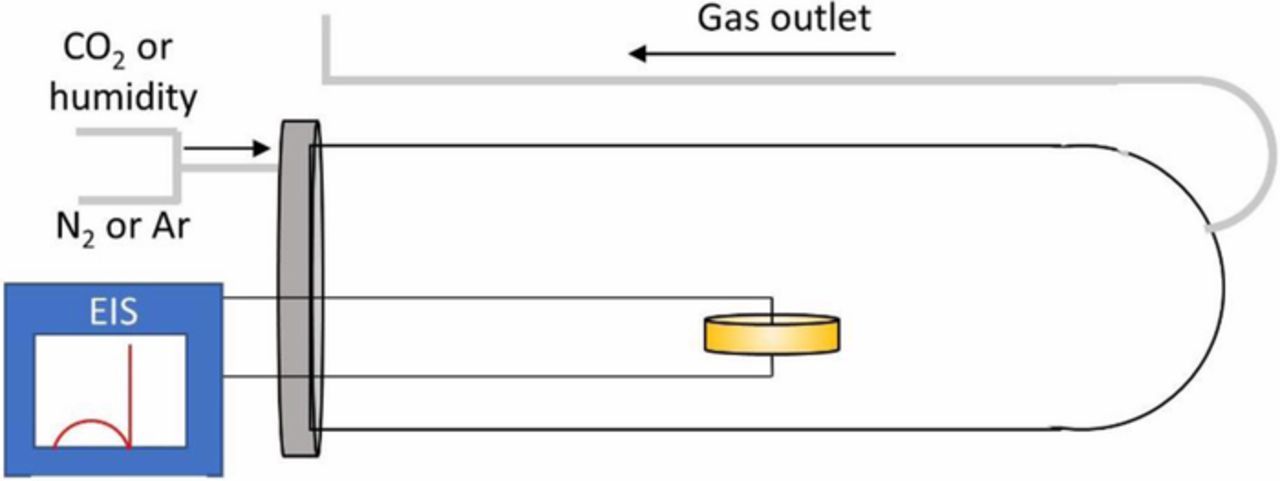
Figure 1. Schematic diagram of the in situ impedance set-up.
The electrochemical stability window was determined by cyclic voltammetry using a Solartron 1287 electrochemical interface with gold as the working electrode and lithium as the reference and counter electrode. The gold working electrode was sputtered on one side of the pellet. The samples were transferred to an Ar-filled glove box where lithium granules were rolled and punched into discs (∼0.2 cm2) and then melted onto the bare garnet surface (200°C, 1 h). The samples were sandwiched between stainless steel coin cell spacers to ensure uniform pressure. Cross-sectional microstructure imaging of each sample was done before and after CO2 and humidity exposure using a Zeiss Sigma VP scanning electron microscope (SEM). The post-tested samples were fractured right before placing inside the SEM chamber to rule out any surface impurity formation caused by exposure to ambient air.
Topography analysis under ambient and humidity
The changes on the surface of the ALD-coated and uncoated samples with time upon exposure to ambient air or humidity were monitored using atomic force microscopy (AFM) (Agilent 5500) with an environmental chamber in contact mode using diamond-like carbon-coated Si tips. Humid conditions were achieved by bubbling pure N2 through water at room temperature, establishing a 3% H2O/N2. The uncoated samples were polished like those for electrical conductivity measurements, but with additional steps of polishing in cloth with 7 and 0.3 μm alumina powder to ensure that the roughness will not impede continuous scanning of the AFM tip. AFM was performed immediately after polishing. The ALD-coated samples which were stored in an Ar-filled glove box were characterized immediately after mounting to the AFM holder.
Results and Discussion
Physical and electrochemical characterization
The X-ray diffraction patterns collected from the crushed powder of both samples prepared via solid-state and sol-gel methods align well with the isostructural parent phase, Li5La3Nb2O12 (powder diffraction file (PDF) No.: 45-0109), confirming the formation of garnet-type crystal structure (Fig. 2). The XRD data also indicates that the cubic phase was formed as opposed to the lower Li-ion conducting tetragonal garnet phase.24,25 Although the bulk samples were coated with a thin (∼10 nm) Al2O3 layer, the Al2O3 signal was not detected, which is most likely explained by the low amount of the material that is below the resolution of XRD. The very weak impurity peak at ∼22° is attributed to LiAlO2 phase (PDF No.: 18-0714). We have seen similar Al contamination in the earlier work.21 The effect of such impurity phases on the response of the garnet to CO2 and humidity is not known at the moment, but since both the uncoated and ALD-coated samples contain such impurity phase, it is reasonable to compare the samples based on their overall behavior under exposure to CO2 and humidity. A small peak at 21° from an unknown impurity is also found in the uncoated sample. The small amount of impurities did not significantly affect the conductivity of the samples as seen in the following discussion.
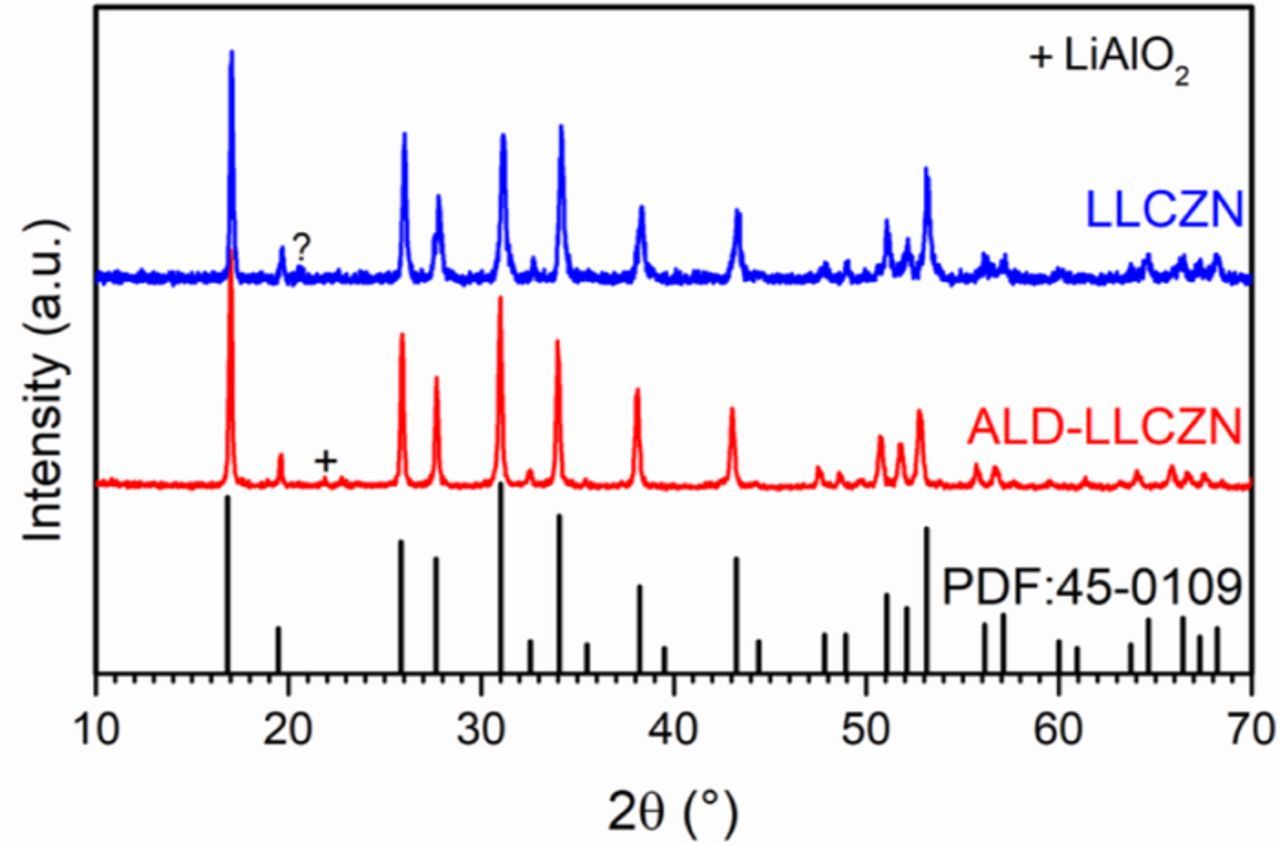
Figure 2. Powder X-ray diffraction patterns of as-prepared LLCZN samples via solid-state ("LLCZN") and sol-gel ("ALD-LLCZN"). Li5La3Nb2O12 (PDF No.: 45-0109) is shown for comparison.
We have confirmed that the LLCZN samples prepared by both methods result in pellets with comparable ionic conductivities and relative density (Fig. 3). The relative density of both the pellets was found to be about 80% based on their geometry and weight. The conductivity of both pellets are ∼ 10−4 S cm−1 at room temperature, and both have activation energies of ∼ 0.37 eV. The conductivities were estimated from the low-frequency tail intercept in the Nyquist plots (Fig. 3a). The samples have similar microstructures with grain size of approximately 2–10 μm in diameter (Figs. 3b and 3c).
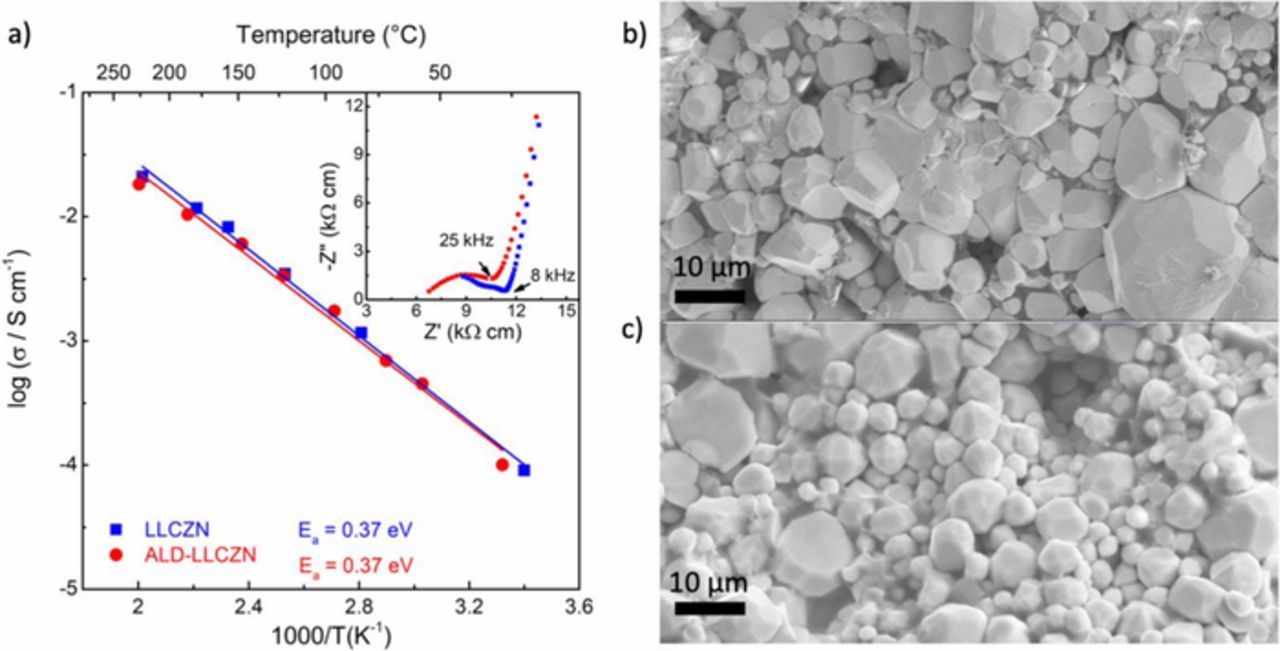
Figure 3. (a) Arrhenius plot of LLCZN without coating (blue squares) synthesized via solid-state method at the University of Calgary. LLCZN with ALD coating (red circle) synthesized via sol-gel method at University of Maryland. Both samples have an activation energy of ∼0.37 eV and conductivities of about 1 × 10⁻⁴ S cm−1 at room temperature. Inset shows a Nyquist plot of ALD-LLCZN (red circle at 28°C) and LLCZN (blue 21°C). (b) and (c) Scanning electron microscopy images of the fracture cross-sections of LLCZN pellet synthesized via solid-state and sol-gel methods, respectively.
Electrochemical stability of LLCZN in contact with lithium metal
Garnets exhibit wide electrochemical stability window (up to 9 V vs. Li/Li+).6 It has been reported that Nb-doped Li-garnets do not show the same stability due to the reduction of Nb5+ to Nb4+.26,27 To investigate the electrochemical stability of our LLCZN samples, cyclic voltammetry was performed in both Al2O3-coated and uncoated samples. The potential was scanned between −0.5 to 6 V vs. Li/Li+ with a sweep rate of 1 mV/s. The cyclic voltammogram of both uncoated and ALD-coated (Figs. 4a and 4b, respectively) samples only show peaks centered around 0 V vs. Li/Li+ which are attributed to the Li deposition and dissolution, as seen in other studies.6,28 The wide electrochemical stability window suggests that these materials can be used for high voltage battery.
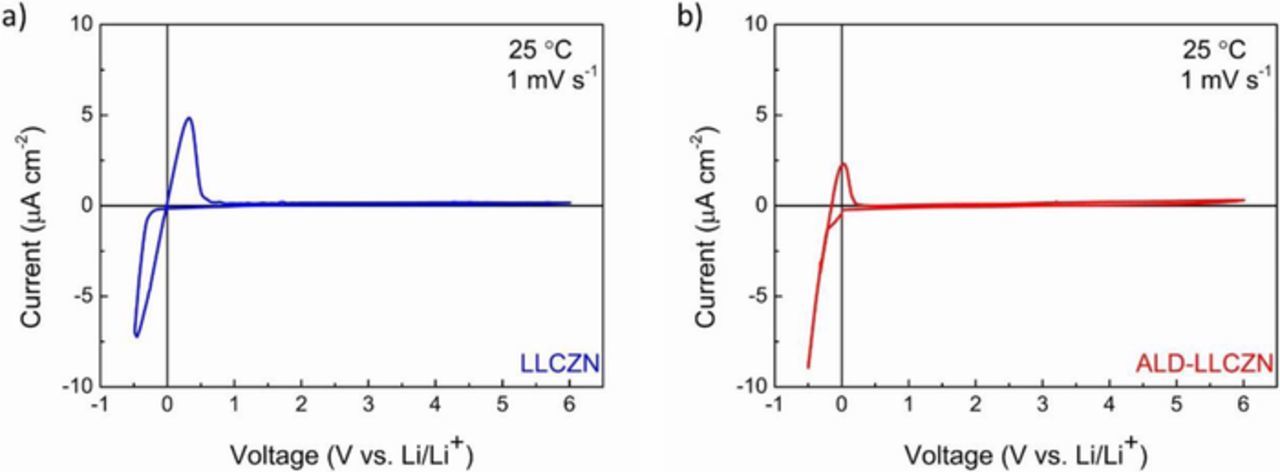
Figure 4. Cyclic voltammogram of LLCZN in the range of −0.5 to 6 V vs. Li/Li+ at a sweep rate of 1 mV/s (a) without Al2O3 and (b) with Al2O3 coating.
Stability of LLCZN in CO2-rich atmospheres
Many groups have suggested that CO2 is the main culprit to the high interfacial resistance between Li electrode and lithium garnet electrolyte.14,16,18 CO2 is believed to react with the garnet through a two-step reaction (protonation then carbonation as in Equations 1 and 2). Direct carbonation is another possibility:17
![Equation ([3])](https://content.cld.iop.org/journals/1945-7111/166/10/A1844/revision1/d0003.gif)
Li2CO3 is formed on the surface of the sample that impedes the interfacial reactions. However, it is not known if the presence of CO2 affects the bulk properties of garnets, most importantly their Li-ion conductivity. Here, we investigated the electrochemical stability of lithium garnets in CO2 rich environments. In situ impedance measurements of LLCZN pellets were carried out under varying CO2 concentrations (400 ppm CO2/N2 to pure CO2) at 25°C. The lowest CO2 concentration studied was 400 ppm as this is the approximate concentration in ambient air.29 The samples were monitored for a minimum of 100 hours at 25°C under varying CO2 concentrations to confirm stability. Before exposure to CO2, the conductivity of the samples was monitored under dry N2 for 100 h, and no significant change in impedance was observed in both coated and uncoated samples.
Figs. 5a and 5b show the Nyquist plots under dry N2, 400 ppm CO2/N2 (100 h) and 3000 ppm CO2/N2 (100 h) at 25°C for the uncoated and ALD-coated samples, respectively. A low-frequency spike in the impedance spectra was observed in all cases due to the blocking nature of Au to Li+. The impedance spectra of the uncoated LLCZN sample do not show a clear grain boundary response (Fig. 3a) even though both samples were fabricated by the same procedure. We have tested several samples to check for similar features of grain boundary response and values of total conductivity. The impedance shown in Figs. 5a and 5b were typical behavior. The reason for the difference is not clear, but it is known that impedance may vary from sample to sample even with similar chemical composition.11,19–21,30 It was not possible to separate the bulk and grain boundary contribution. Only a total electrolyte resistance RT [Ω], which accounts for the bulk (Rb) and grain boundary (Rgb) contributions, can be obtained from the real part of the impedance before the low-frequency spike (Fig. 5a). The data in Fig. 5a (also Fig. 5b) is expressed as resistivity, ρ [Ω cm], i.e., multiplied impedance by {a}/{l} where a and l are the area and thickness of the sample in cm2 and cm, respectively.
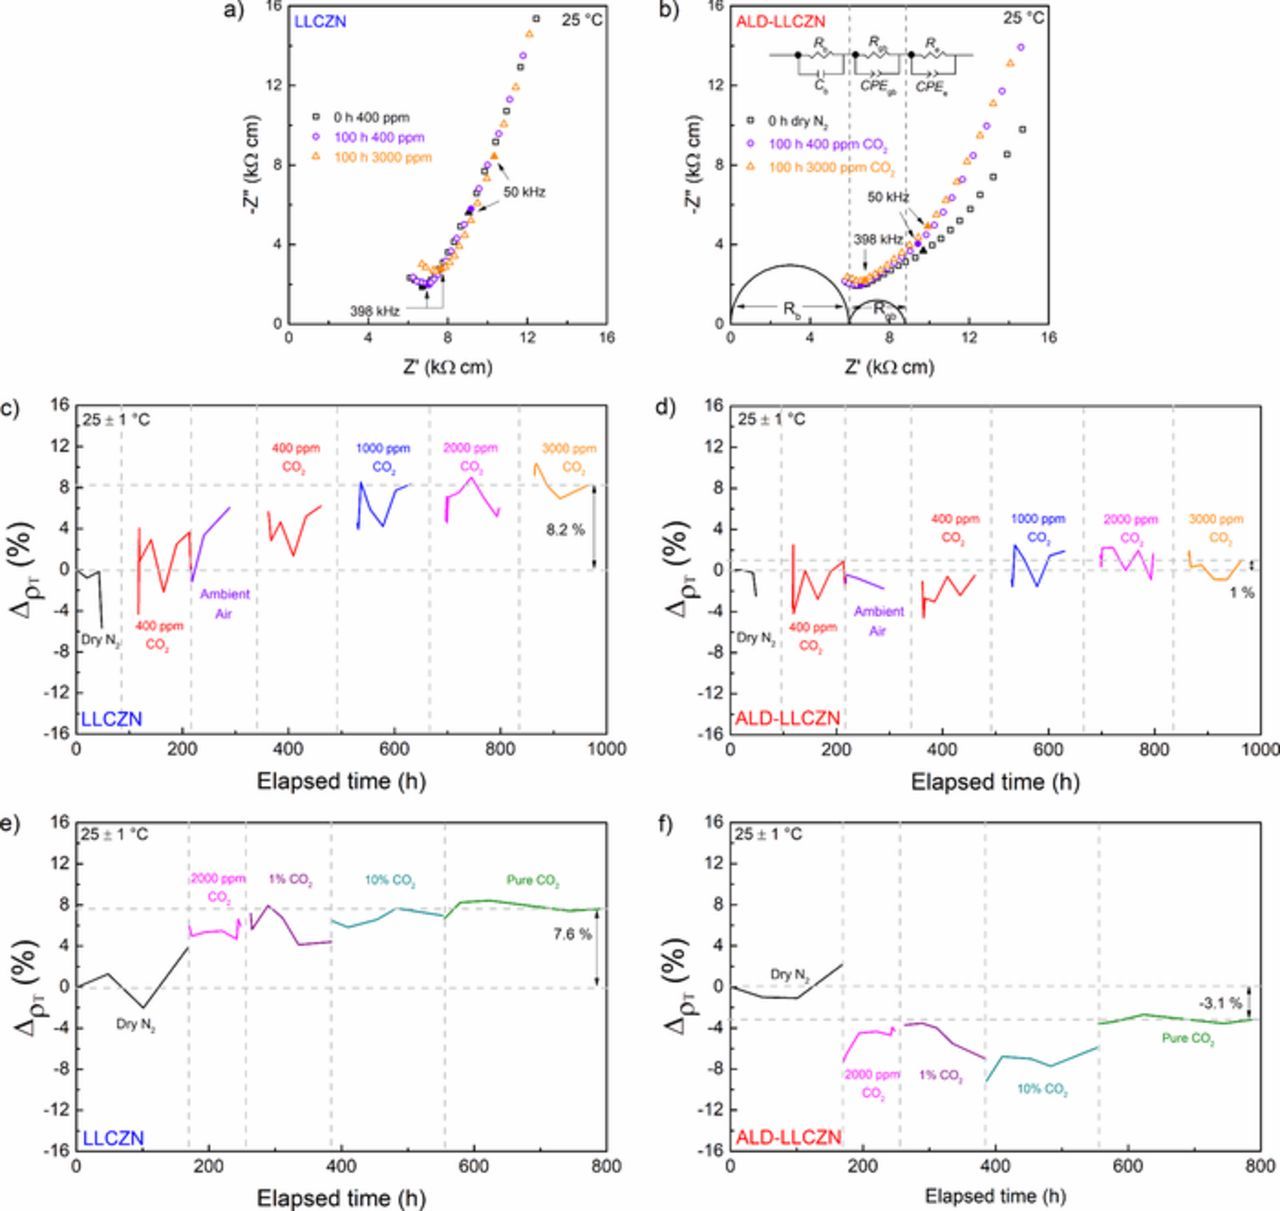
Figure 5. Selected area impedance spectra (1 MHz – 5 kHz) of LLCZN under dry N2, 400 ppm CO2/N2 for 100 h, and 3000 ppm CO2/N2 100 h for (a) uncoated and (b) ALD-coated. (c) and (d) resistivity change of LLCZN in various CO2 concentrations up to 3000 ppm CO2/N2 for uncoated and ALD-coated, respectively. (e) and (f) resistivity change of LLCZN under high concentrations of CO2 up to pure CO2 for uncoated and ALD-coated, respectively.
The ALD-coated sample's impedance spectra show a bend just before the low-frequency spike which could be due to a grain boundary response. The simplest equivalent circuit that could fit the data is (RbCb)(RgbCPEgb)(ReCPEe), where Rb, Rgb, and Re are the resistance of the bulk, the grain boundary and the electrode due to possibly gas-related reaction, respectively. Cb, CPEgb, and CPEe are the capacitance effects from the bulk, grain boundary, and electrode, respectively (CPE refers to a constant phase element). Ideally, CPEe is expected for a blocking electrode. The electrode impedance was found to be in the order of 106 Ω, and was only added to provide a better fit to the data. The quasi-equivalent capacitance (QEC) associated with the fitted capacitance can be calculated using:31
![Equation ([4])](https://content.cld.iop.org/journals/1945-7111/166/10/A1844/revision1/d0004.gif)
where R is the resistance and n is the exponent. Based on this calculation, the (RgbCPEgb) semicircle has a QEC in the order of 10−10 F, which is in the range of grain boundary contribution.32 The equivalent circuit and the simulation of the arcs from the fitting are shown in Fig. 5b.
The total electrolyte resistance for the uncoated LLCZN sample was the real impedance value before the low-frequency spike, while the total electrolyte resistance value of the ALD-coated LLCZN sample is Rb + Rgb from the equivalent circuit fitting. A slight increase in resistivity was observed in the uncoated sample (6.9 to 7.6 kΩ cm) while no significant change in impedance was observed in the ALD-coated sample after exposure to 3000 ppm CO2. The CO2 was then removed and the samples were exposed to ambient air for the next 100 h to examine the effect of ambient humidity (Equations 1 and 2) on the impedance of the samples. CO2 concentrations were then increased progressively up to 3000 ppm. The total experiment time was approximately 1000 h.
The total electrolyte resistivity change upon gas exposure (3% H2O, Ar, N2, or CO2) in % was calculated relative to the initial total electrolyte resistivity before exposure (0 h in N2 or Ar):
![Equation ([5])](https://content.cld.iop.org/journals/1945-7111/166/10/A1844/revision1/d0005.gif)
where ρ0 is the resistivity at 0 h in N2 or Ar and ρxgas is the resistivity upon exposure to a certain x concentration of gas. Figs. 5c and 5d summarize the effect of CO2 content changes on the total electrolyte resistivity. Further increase in resistance was observed in the uncoated sample after exposure to 100 h in ambient air while the ALD-coated sample appears to show no change in impedance. The resistance of the uncoated sample had clearly increased by about 8% from its initial resistance before exposure to CO2 while the ALD-coated sample showed no appreciable increase in resistance. Another sample of each of the ALD-coated and uncoated Li-garnets were exposed to accelerated CO2 increase test as shown in Figs. 5e and 5f to confirm the reproducibility of the results. Note that at 2000 ppm CO2, the increase in resistance for the uncoated sample is already 5.9% while the ALD-coated sample show improved conductivity after exposure to the same CO2 content. After exposure to pure CO2, the increase in resistance compared to dry N2 for the uncoated sample was 7.6%, almost the same as the other uncoated sample exposed to 3000 ppm CO2, while the ALD-coated sample appears to have decreased resistance. The results in Fig. 5 highlights an apparent protecting property of the ALD coating to the garnet from CO2 exposure.
Wang and Lai33 have also studied the stability of lithium garnet, Li7La3Zr2O12, under pure CO2. However, at 350°C Wang and Lai noticed an initial decrease in impedance for the first 24 hours, followed by a small increase after 48 hours. The decrease in impedance was attributed to a phase transition from tetragonal to cubic structure.33 The carbonation of the garnet sample leads to increased Li vacancies and ultimately a stabilized cubic garnet structure. The investigated samples have been stabilized in the cubic phase by Ca- and Nb-doping in Li7La3Zr2O12; hence, this decrease in impedance due to phase change is not expected.
Stability of LLCZN under humidity
We took a similar approach as the CO2 stability tests for the humidity stability of LLCZN. The samples were transferred from an Ar-filled glove box to the impedance set-up with the environmental chamber. The chamber was purged with dry Ar for a minimum of 100 h before starting the humidity tests. Purging was performed to ensure no humidity or CO2 was present before the measurements, and to confirm that the sample impedance does not change under an inert atmosphere. Upon introduction of 3% H2O/Ar at 25°C, clear responses in the Nyquist plots were observed in both the uncoated and ALD-coated samples (Figs. 6a and 6b). Specifically, in the ALD-coated, the bend found in the impedance spectra before exposure to humidity has evolved into a clear semicircle upon exposure for about 100 h (Fig. 6b). Note that the semicircle becomes apparent even after 1 h of exposure to humidity.
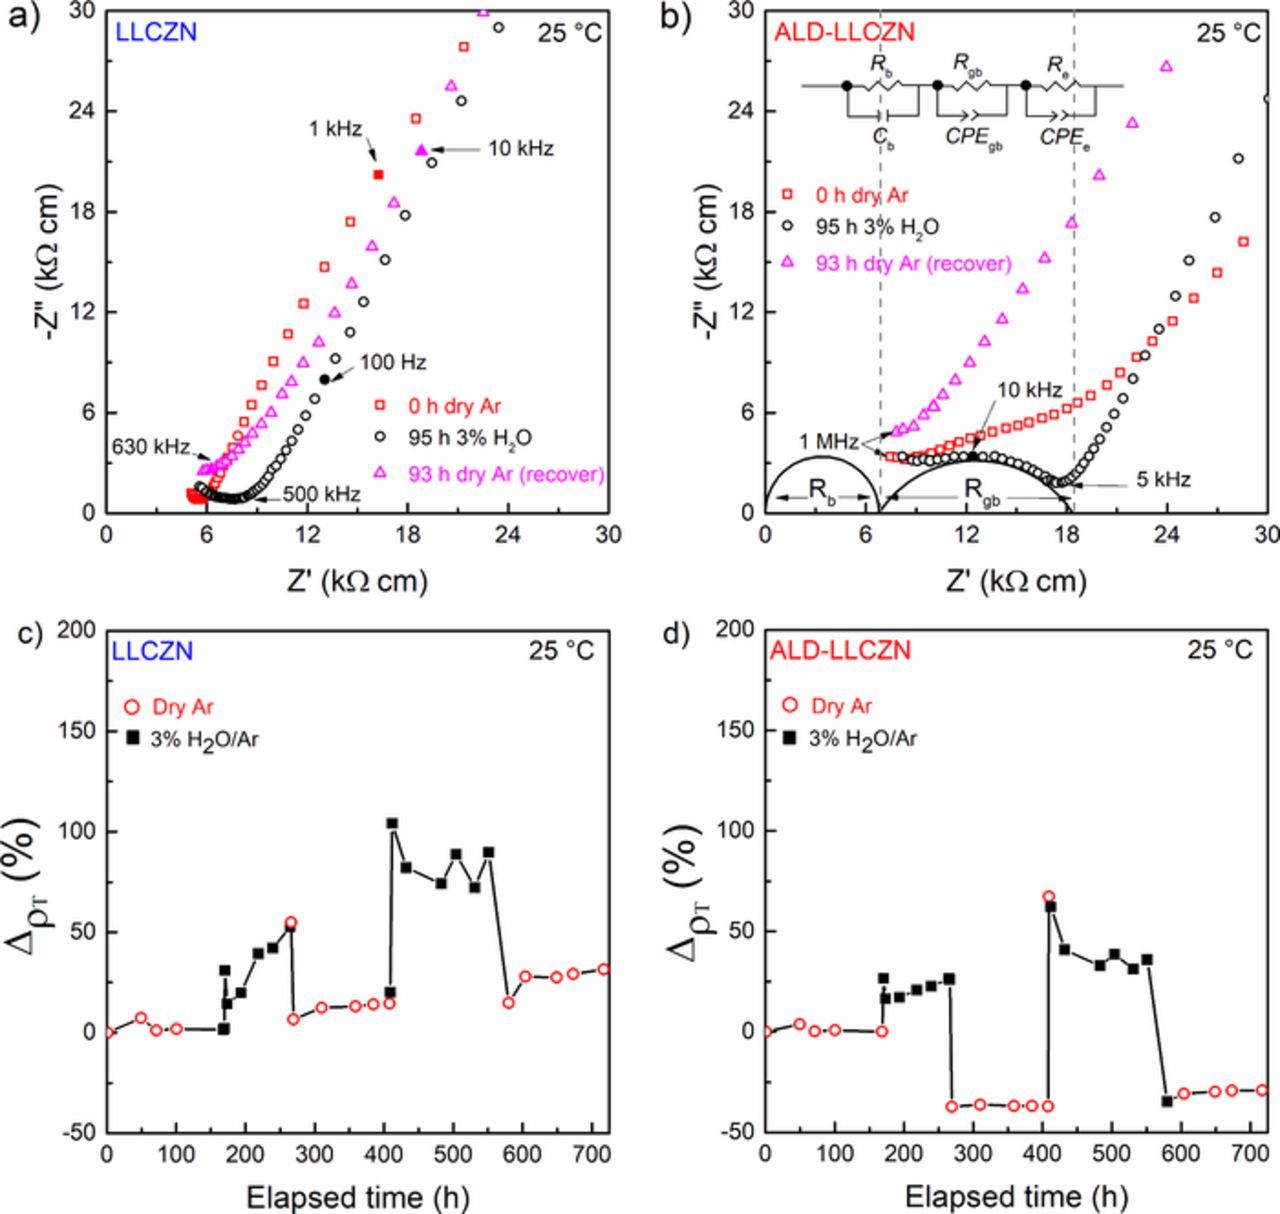
Figure 6. Nyquist plots of (a) uncoated and (b) ALD-coated LLCZN before and after exposure to humidity. (c) and (d) show the change in resistivity when alternating between dry Ar and 3% H2O/Ar for the uncoated and ALD-coated LLCZN, respectively.
The semicircle in the impedance spectra before and after 95 h exposure to humidity in the ALD-coated sample was successfully fit with (Rb)(CPEgbRgb)(ReCPEe) equivalent circuit. The QEC of the additional semicircle is in the order of 10−10 F, lying in the range of grain boundary capacitance.32 A reasonable fit to an equivalent circuit accounting for the semicircle in the uncoated sample could not be established. However, we believe the response will also be from a grain boundary-like resistance increase. Similar grain boundary increases were observed by Shimonishi et al.34 after treating bulk garnet samples with H2O, 1 M LiOH or 0.1 M HCl for 1 week at 50°C.
Within 1 hour of removing the humidified Ar, the impedance began recovery, and the grain boundary contribution began to retreat. After prolonged exposure (93 h) to dry Ar, the impedance spectra would lose the grain boundary-like response and the total resistance is almost the same as the pristine sample for the uncoated sample, while the ALD-coated sample seems to have lowered total resistance. Figures 6c and 6d summarize the change in resistivity of the uncoated and ALD-coated samples, respectively, as defined by Equation 5, when cycling between 3% humidified Ar and dry Ar. Each cycle shows the appearance of grain boundary (under humidity) and recovery (under dry Ar) on both the uncoated and ALD-coated samples. Cycling was performed with numerous samples of both ALD-coated and uncoated LLCZN, confirming the excellent reproducibility of the stability tests.
The mechanism for the appearance of grain boundary-like response in the impedance spectra and the recovery upon removal of humidity is not clear. One possible explanation is that in humid environments, water may adsorb onto the grain boundaries of the polycrystalline material, impeding the Li-ion transport. When the humidity is removed, and dry gas flow is reintroduced, the adsorbed water likely removed and the impedance to return to that of initial values. It is also uncertain why Al2O3 did not protect the garnet pellet from the humid environment unlike in CO2 environments.
Stability of LLCZN with humidity and CO2
After humidity exposure, the garnet sample become protonated followed by a LiOH coating that will further react with CO2 forming a Li2CO3 passivation layer. The sample was exposed to 3% H2O/Ar for 4 h to induce the increased impedance and then humidity was removed. Subsequently, 400 ppm CO2 was introduced. As seen with dry Ar, the impedance was found to recover to pristine sample value under 400 ppm CO2. The experiment was repeated with pure CO2 and similar recovery was observed, as seen in Figs. 7a and 7b for both uncoated and ALD-coated, respectively. Recovery was not only limited to the continuous flow of dry gas. Leaving the sample in ambient air after removing the humidity causes the impedance to recover its original shape.
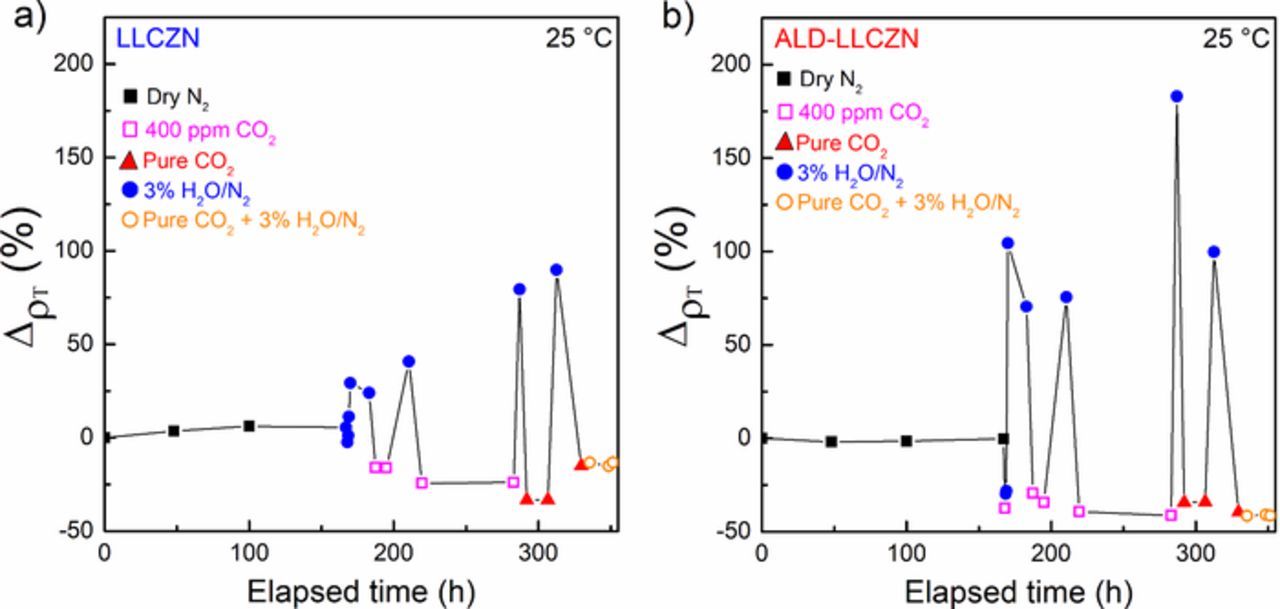
Figure 7. Overview of the change in resistivity of (a) uncoated and (b) ALD-coated LLCZN samples when altered between humidified and CO2-rich environments.
Post-test microstructure analysis
The fracture cross-section SEM of CO2 and humidity-treated samples are shown in Fig. 8. Figs. 8a and 8b compare the microstructure of the uncoated and ALD-coated samples, respectively, after 1000 h of testing and exposure to a maximum of 3000 ppm CO2 (Figs. 5c and 5d), while Figs. 8c and 8d compare that of the uncoated and ALD-coated samples, respectively, after 700 h of alternating between dry Ar and 3% H2O/Ar (Fig. 6). Except for the uncoated sample exposed in CO2, all the samples did not show any evidence of significant change from the observed microstructure before the long-term tests (Figs. 3b and 3c). The uncoated sample exposed in CO2 (Fig. 8a) exhibits grains that are covered or partially covered with a porous, fine-grained layer, which is most likely Li2CO3. The layer covers almost the entire cross-section of the pellet, which might be the reason for the increase in the total electrolyte resistance of the uncoated sample in Fig. 5c. The unchanged microstructure exhibited by the ALD-coated sample was consistent with the impedance characterization showing a negligible increase in total electrolyte resistance.
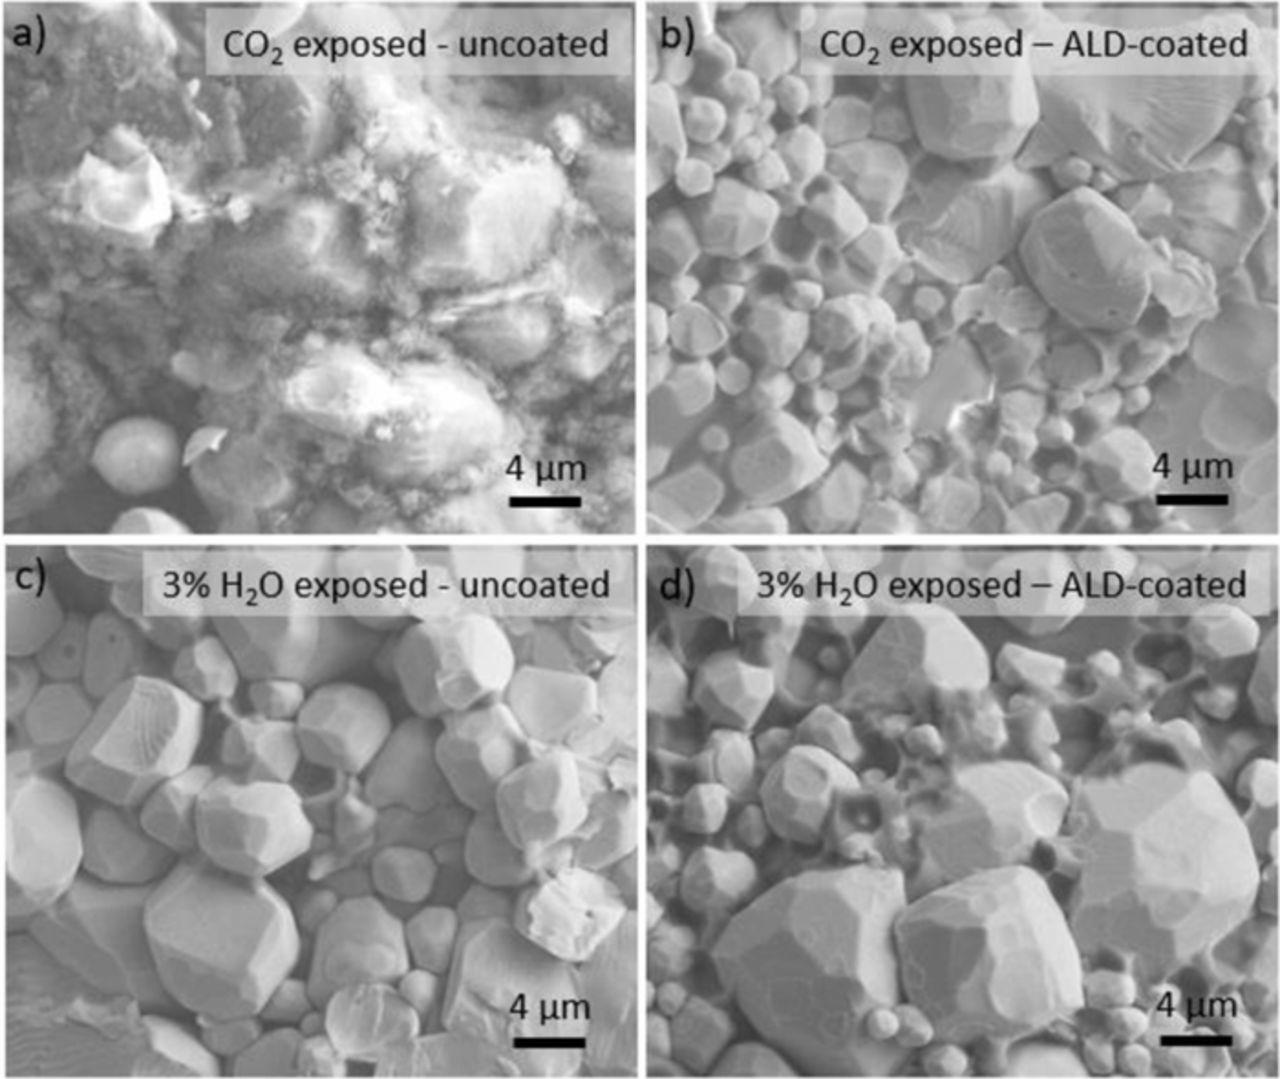
Figure 8. Typical SEM images of the fracture cross section of the uncoated and ALD-coated LLCZN after long term impedance testing. (a) and (b) uncoated and ALD-coated LLCZN, respectively, after 1000 h of testing and exposure to a maximum of 3000 ppm CO2 and (c) and (d) uncoated and ALD-coated LLCZN, respectively, after 700 h of alternating between dry Ar and 3% H2O/Ar.
Surface analysis of LLCZN in ambient air and humidity
In situ AFM was employed to study the surface features in both samples upon exposure to ambient and humidity. Fig. 9 shows the AFM images of coated and uncoated samples after continuous scanning of the surface that is exposed to ambient air. Even after leaving the samples overnight, no drastic change was observed in both the uncoated and ALD-coated samples. The findings are consistent with the negligible change in the impedance during in situ characterization of both samples upon exposure to 400 ppm CO2 and ambient air for many hours as shown Figs. 5c and 5d.
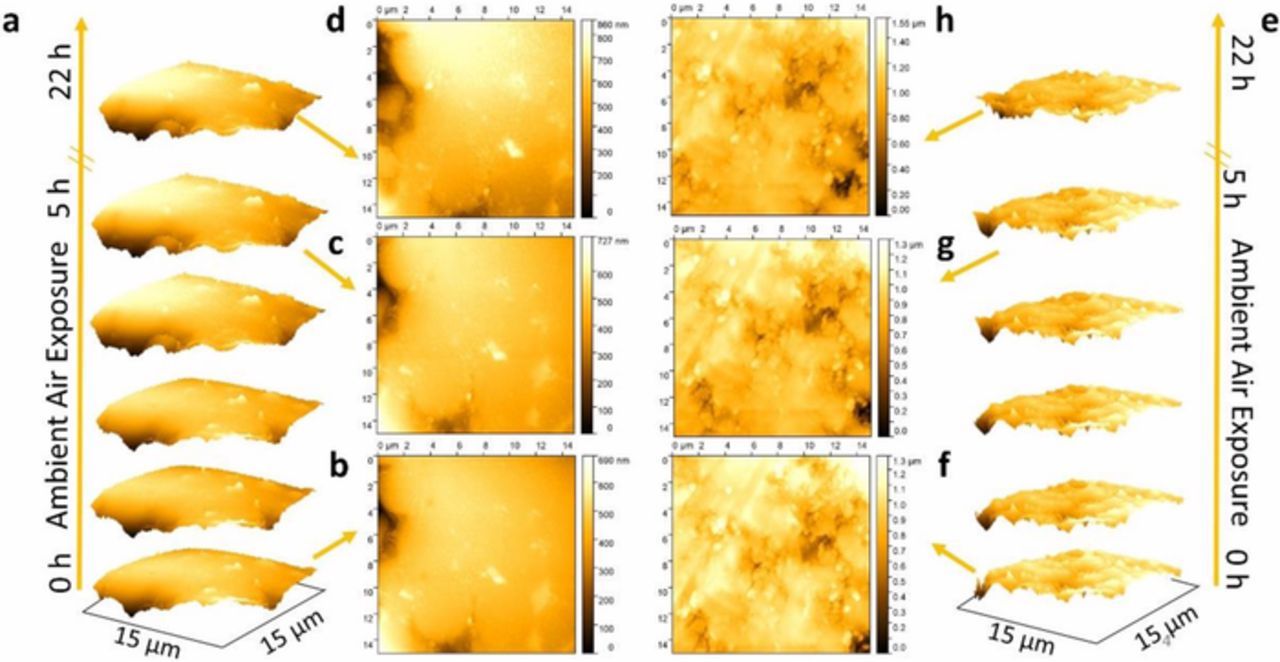
Figure 9. Typical AFM image of (a-d) uncoated and (e-h) ALD-coated sample. (a) and (e) shows the observed images after every hour of exposure in ambient air of uncoated and ALD-coated samples, respectively. The samples were left overnight and imaged the following day (after 22 h).
Figure 10 shows the surface of the samples after scanning every hour that the samples were exposed to humidity. A distinct droplet-like formation is observed in the uncoated sample while no noticeable change is observed in the ALD-coated sample. The AFM imaging also included a final step wherein the humidity was removed and a continuous flow of N2 was held in the ALD-coated sample for 2.5 h to mimic the effect of recovery as seen in the impedance measurements. No noticeable change in the surface features was observed (the distinct droplet-like formation did not disappear). The droplet-like formation may not be directly related to the observed changes in impedance, as there was no noticeable change in the surface features upon removal of humidity and exposure to a continuous flow of N2 for 2.5 h. Future in situ technique work is required to resolve grain boundary features during electrochemical tests upon exposure to humidity.
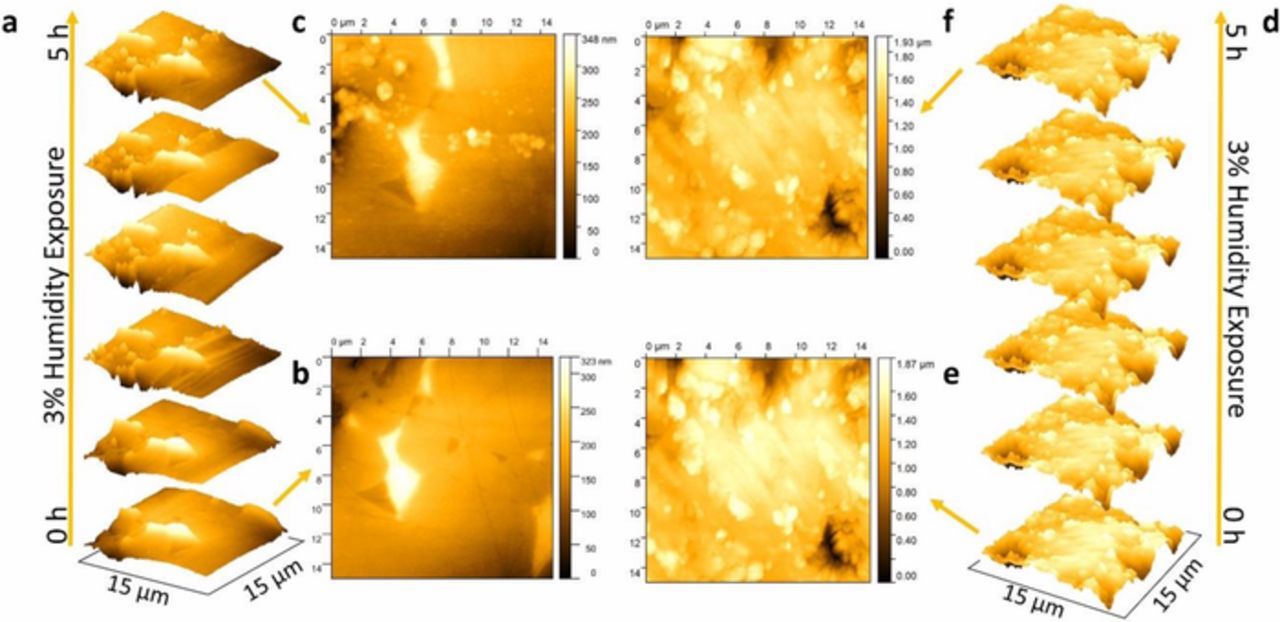
Figure 10. Typical AFM image of (a-c) uncoated and (d-f) ALD-coated sample. (a) and (d) show the observed images of uncoated and ALD-coated samples after every hour of exposure in 3% H2O/N2, respectively.
Conclusions
The electrochemical stability of uncoated and ALD-coated Li7La2.75Ca0.25Zr1.75Nb0.25O12 (LLCZN) samples were studied by in situ electrochemical impedance spectroscopy in humid and CO2. CO2 stability data shows a noticeable increase in total resistance ( ∼ 8%) for the uncoated sample compared to the ALD-coated sample, which shows no noticeable increase in resistance. Lithium carbonate species are known to form on the surface of Li garnets and impede lithium-ion transport at garnet | lithium interfaces, and the most likely cause of resistance increase in the uncoated sample. The ALD-coated sample's resistance did not change in the presence of a range of CO2 concentrations which can be attributed to the blocking effect of the thin layer of ALD-deposited Al2O3. All samples exposed to 3% H2O show a substantial increase in total resistance. However, the impedance can be "re-established" when the humidity is removed, and the samples are left in ambient air and dry Ar, N2 or even CO2 flow. We attribute these changes to adsorbed water in the grain boundaries of garnet pellets. Preliminary physical characterization using SEM, XRD, and AFM was performed. The changes observed in the study requires further investigation by in situ techniques.
Acknowledgments
This work was supported by the US Department of Energy ARPA-E (Contract No. DE-AR0000384). We acknowledge Drs. Amanda Musgrove and Max Anikovskiy at the University of Calgary for their valuable help with AFM study.
ORCID
Eric D. Wachsman 0000-0002-0667-1927
Venkataraman Thangadurai 0000-0001-6256-6307