
Abstract
In this work, we report on the performance of Diels Alder poly(phenylene) membranes in vanadium redox flow batteries. The membranes were functionalized with quaternary ammonium groups to form an anion exchange membrane (QDAPP) and with sulfonic acid groups to form a cation exchange membrane (SDAPP). Both membrane classes showed similar conductivities in the battery environment, suggesting that the ion conduction mechanism in the material is not strongly affected by the moieties along the polymer backbone. The resistance to vanadium permeation in QDAPP was not improved relative to SDAPP, further suggesting that the polarity of the functional groups do not play a significant role in the membrane materials tested. Both QDAPP and SDAPP outperformed Nafion membranes in cycling tests, with both achieving voltage efficiencies above 85% while maintaining 95% coulombic efficiency while at a current density of 200 mA/cm2.
Export citation and abstract BibTeX RIS

This is an open access article distributed under the terms of the Creative Commons Attribution 4.0 License (CC BY, http://creativecommons.org/licenses/by/4.0/), which permits unrestricted reuse of the work in any medium, provided the original work is properly cited.
The need for grid-scale energy storage is well-established as demand for intermittent renewable energy sources increases. Among grid-scale energy storage technologies, vanadium redox flow batteries (VRFBs) present an attractive option, as has been extensively discussed elsewhere.1–4 One of the key components in VRFBs is the membrane. As the separator between the positive and negative sides, the membrane is responsible for limiting undesired crossover of vanadium species and water while enabling ion conduction. The membrane's ability to restrict crossover is the key factor in cell coulombic efficiency and is important in slowing capacity fade. The conductivity determines the ohmic drop in the membrane, which is the major source of ohmic resistance in the battery and therefore plays a key role in determining voltage loss.5 Thus, it is desirable to engineer membranes that have a high selectivity, i.e., low vanadium permeability with high conductivity for charge carrying ions, predominantly protons or bisulfate. Commonly used membrane materials in the laboratory consist of perfluorinated polymers that provide chemical-mechanical stability, with polar side chains to provide ion conduction pathways; however, materials such as Nafion are relatively expensive and exhibit poor selectivity. Modified Nafion membranes can provide improved selectivity,6,7 but are still based on the expensive Nafion material.
Several studies have investigated alternative hydrocarbon backbone polymers as a means to decrease cost and improve selectivity.8 Proton exchange membranes in the form of sulfonated aromatic polymers have received the most attention1,9–13 due to the relative ease of preparation and promising VRFB performance. However, issues of low membrane cyclic lifetimes have been reported and suggest membrane oxidation through the VO2+ ion.14 Therefore, anion exchange membranes (AEM) have been presented as an attractive option because vanadium permeation is expected to be limited by the Donnan potential generated by the positively charged functional groups, which would not only reduce vanadium crossover, but also hinder VO2+ from entering the membrane pores and thus should improve membrane lifetime.15
From studies of direct methanol fuel cells (DMFC), which also suffer liquid phase crossover issues, it is known that increasing the ion exchange capacity (IEC) can improve membrane conductivity, with the tradeoff of increased rates of crossover.16 IEC is a measure of the fixed charge functional groups within the polymer membrane; a higher IEC corresponds to a greater amount of fixed charged moieties. An increase in IEC typically results in increased water uptake due to the attraction between water molecules and the polar groups in the charged functional groups within the membrane. Increased water uptake increases membrane conductivity as more pathways are present for proton conduction that occurs within the bulk water within the membrane. It is noted that the conduction mechanism is predominantly due to protons through bulk water (the Grotthus mechanism) when the membrane exists in a highly hydrated state, as it does when surrounded by liquid phase water/acid solution in the VRFB. We note that a secondary conduction mechanism whereby ions move by a hopping mechanism along the charged functionalities may also be present; an increase in IEC can improve this secondary conduction mechanism. Understanding how IEC affects performance, as well as membrane transport properties on a more fundamental level, is important in continued development and optimization of high performance membranes. In addition to IEC's effects on conductivity and crossover, membrane durability and IEC are inversely related.17 Therefore, it is desirable to minimize IEC while still achieving acceptable system performance.
In this work, we report the results of cell testing with quaternary ammonium functionalized and sulfonated Diels Alder poly(phenylene) membranes (QDAPP and SDAPP, respectively) with systematically varied IEC. QDAPP is an AEM with its positively charged quaternary ammonium functional groups tethered on aryl side chains; SDAPP is a cation exchange membrane (CEM) with its negatively charged sulfonic acid functionalized aryl side chains, as shown in Fig. 1. Data on some of the properties of these membranes was previously reported17,18 in two papers from our team. In that work, the membrane properties were compared to those of Nafion under similar conditions. Estimates of the extent of hydration, the conductivity and the permeability of membranes were presented in varying degrees of detail. Also, the morphology of SDAPP and Nafion were compared.
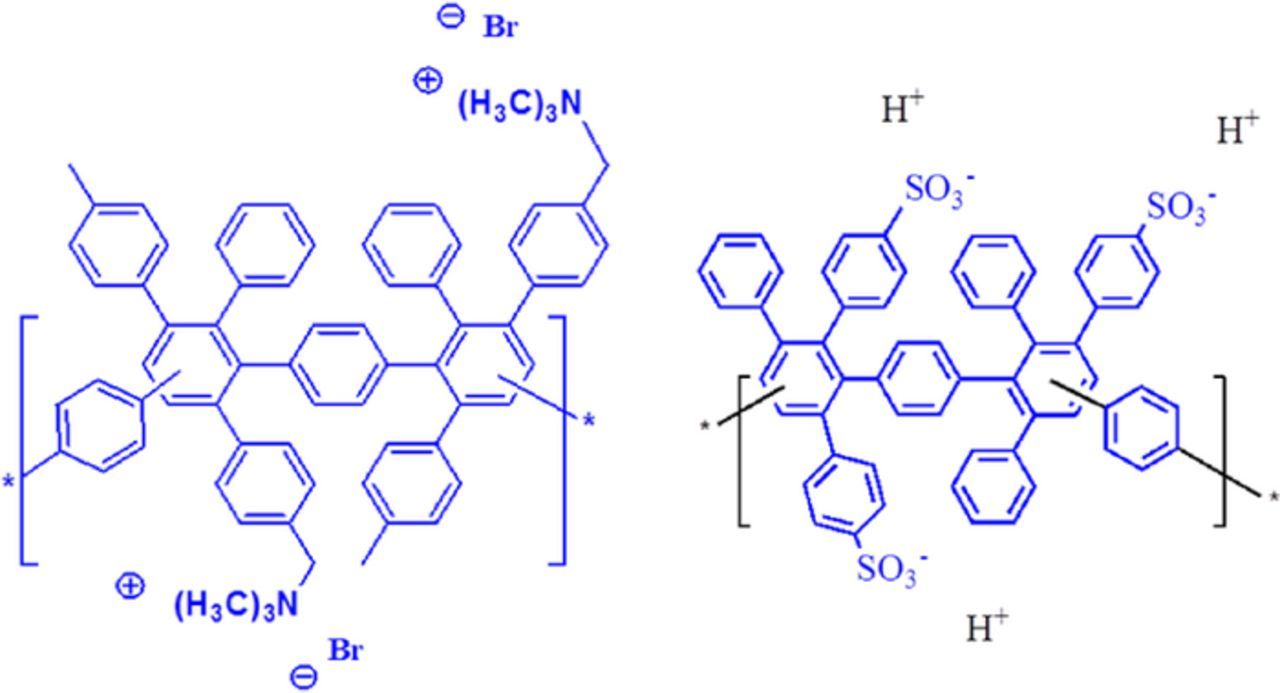
Figure 1. Membrane structures synthesized in this work: (a) QDAPP and (b) SDAPP.
This work affords a unique opportunity for comparison of closely related cation- and anion-exchange membranes. The focus is on the behavior of these materials in cells. Polarization curves were obtained to demonstrate the cell voltage as a function of current density, as VRFBs used for grid-scale energy storage are not typically subjected to constant-current charging and discharging as in the laboratory; charge and discharge currents are dependent on dynamic grid conditions, and therefore must be able to operate over a range of currents. Polarization curves are also a commonly used tool for resolving activation, ohmic, and concentration polarizations in electrochemical devices in order to understand the origin of losses and identify performance-limiting factors;19,20 such information is not readily available from the cycling experiments typical of VRFB studies. Open-circuit voltage (OCV) decay measurements were used to compare the relative vanadium permeability of the different membranes. Cycling at a current density of 200 mA/cm2 was also carried out to evaluate energy efficiency, coulombic efficiency, and voltage efficiency.
Experimental
Membranes were characterized by ex-situ measurements as well as full cell testing including polarization curves, open-circuit voltage decay, and cycling. The SDAPP and QDAPP membranes used in this work were synthesized and fabricated at Sandia National Laboratory, following the method in our previous work.21,22 The IEC of each membrane was determined by the back-titration method.21,22 The IECs of SDAPP membranes were measured as 1.4, 1.8 and 2.2; the measured IECs for QDAPP membranes were 0.4, 0.8 and 1.2. The membranes are named after their IEC to ease further discussion. The synthesized membranes were kept in DI water (18 MΩ cm) at ambient temperature until use. Nafion 117 and 211 membranes (Ion Power) were used as received.
Membrane conductivity was previously reported by our group in References 17 and 18; the conductivity data in Table I is a reproduction of these data sets. Conductivity was measured after equilibration in 5 M H2SO4 solution for over 24 hours to mimic behavior in battery electrolyte. The membrane conductivity was measured with a four probe conductivity cell in a protocol described elsewhere.23 Thicknesses of membrane samples were taken by a Mitutoyo 369–350 digital micrometer after soaking in DI water.
Table I. The properties of SDAPP and QDAPP membranes with different sulfonation or quaternization stoichiometry. Thicknesses were measured after soaking in DI water; conductivities were measured in 5 M sulfuric acid solution.
| Polymer | Membrane | IEC (meq/g) | Thickness (μm) | Conductivity (mS/cm) | ASR (Ω cm2) |
|---|---|---|---|---|---|
| SDAPP | 1 | 1.4 | 47.0 ± 6.0 | 19.8 ± 3.3 | 0.237 |
| 2 | 1.8 | 40.7 ± 7.3 | 61.1 ± 4.7 | 0.067 | |
| 3 | 2.2 | 49.7 ± 2.7 | 107.3 ± 31.8 | 0.046 | |
| QDAPP | 1 | 0.4 | 59.7 ± 6.3 | 30.0 ± 9.3 | 0.199 |
| 2 | 0.8 | 53.7 ± 3.7 | 96.8 ± 10.7 | 0.055 | |
| 3 | 1.2 | 54.0 ± 8.0 | 87.8 ± 6.2 | 0.062 | |
| Nafion | 117 | 0.91 | 198.7 ± 6.3 | 73.1 ± 0.7 | 0.272 |
| 211 | 0.91 | 28.7 ± 6.3 | 125.0 ± 3.1 | 0.023 |
Electrolyte solution preparation
Vanadium electrolyte solutions of 1.7 M vanadium with 5 M total sulfate were prepared from vanadyl sulfate (99.9%, Alfa Aesar) and sulfuric acid (96%, Alfa Aesar) dissolved in DI water. A flow cell with a 25 cm2 geometric active area and one layer of SGL 10AA carbon paper on each side of the battery separated by two layers of Nafion 117 was used to carry out bulk charging and discharging of solution. Two layers of membrane were used to minimize crossover of vanadium species. Initial charging of the solution was carried out at a constant cell voltage of 1.8 V with a 2:1 ratio of catholyte to anolyte volumes. Charging was terminated when the current density in the charging cell decreased to 10 mA/cm2, where a state of charge (SoC) of 100% was assumed. Upon completion of charging, one half of the catholyte solution was discarded to obtain a 1:1 catholyte:anolyte ratio.
Cell architecture
Battery testing was carried out in a zero-gap architecture 5 cm2 cell with single channel serpentine flow fields.24 CP-ESA carbon paper (supplied by SGL carbon) was used as the electrode material on both sides of the battery. The carbon paper, originally 370 μm thick, was compressed to ca. 65% of its original thickness. Membranes were removed from DI water and blotted dry before assembly. All experiments were carried out in a temperature chamber controlled at 30°C. An ultra-high purity nitrogen purge in the electrolyte storage tanks was used to prevent oxidation of the vanadium species. During polarization curves and cycling experiments, a flow rate of 90 mL/min was provided by a dual-channel peristaltic pump (Cole Parmer). Electrochemical measurement and control was performed with a Bio-Logic VSP potentiostat with a 20 A booster.
Polarization curves
A single-pass flow configuration was used, in which solutions were pumped from one tank, through the cell and into a separate tank, i.e. there was no recirculation. In this manner, constant SoC conditions were maintained in the electrolyte solution at the cell inlet. Curves were obtained with 440 mL of solution at 100% SoC and 50% SoC. The 50% SoC solution was obtained by discharging 100% SoC solution in a separate cell held at 0.9 V until one half of the coulombs were discharged.
Potential steps in increments of −0.1 V with a superimposed AC signal with a 10 mV amplitude were carried out to obtain the polarization curves. The cell resistance was taken as the high-frequency intercept of the impedance spectra with the real axis and was used to iR-correct the curves. The area specific resistance (ASR) was calculated by multiplying the high-frequency resistance (HFR) by the cell cross-sectional area.
OCV decay
The open-circuit voltage decay was monitored to obtain a qualitative comparison of vanadium ion permeation across each membrane. OCV decay was measured after 100% SoC solution was pumped into the cell and then statically held in the cell.
Cycling
Cycling was carried out at a constant current density of 200 mA/cm2, with cutoff voltages at 1.2 and 1.65 V. HFR measurements during cycling were carried out with a superimposed 10 mV AC signal on a DC potential of 1.2 and 1.65 V at the end of discharge and charge, respectively. 50 mL of solution was used on both the positive and negative sides of the battery. Efficiencies were calculated by the following equations:


Results and Discussion
Membrane properties
In Table I, synthesized SDAPP and QDAPP membrane properties are presented. The IEC ranges of SDAPP (1.4 – 2.2 meq/g) and QDAPP (0.4 – 1.2 meq/g) were chosen to provide similar water uptake and conductivity values, as VRFB performance is directly related to these transport parameters. The thickness of DI water-soaked SDAPP and QDAPP membranes used in cell testing varied from 41 to 50 μm for SDAPP and 54 to 60 μm for QDAPP. Because these thicknesses are relatively close to each other within each membrane family, any difference in membrane properties is attributed to the varying IEC and not thickness. The ASR included in the table is calculated by dividing the membrane thickness by the conductivity. SDAPP 1.8 and 2.2 and QDAPP 0.8 and 1.2 obtained conductivities between 61 and 107 mS/cm, comparing favorably with the 73 mS/cm of Nafion in the 5 M H2SO4 electrolyte environment. The conductivity of SDAPP follows the expected trend, with conductivity increasing from 19.8 mS/cm at 1.4 meq/g to 61.1 mS/cm at 1.8 meq/g and 107.3 mS/cm at 2.2 meq/g. However, the QDAPP samples displayed differing behavior, with conductivity increasing from 30 to 96.8 mS/cm with an increase in IEC from 0.4 to 0.8 meq/g followed by a slight drop in conductivity from 96.8 to 87.8 mS/cm with an additional increase in IEC from 0.8 to 1.2 meq/g. Superficially, this anomaly could be attributed to a dilution effect, described in detail by Kim and Pivovar:25 as the IEC increases, water uptake increases. Beyond a certain point (the percolation threshold), additional water uptake can decrease the concentration of the charged functional groups, which can result in reduced conductivity. However, attributing the observed phenomenon to the dilution effect is speculative at this point. The behavior of the membrane immersed in sulfuric acid is significantly more complex than that of membranes in deionized water since additional charge carriers (sulfuric acid components) beyond those contributed by the fixed sites are present in the former case. This would seem likely to mitigate any dilution effects.
In QDAPP, the observed conductivities in sulfuric acid solution were similar to those obtained with SDAPP and Nafion, in spite of the fact that anion mobility in AEMs is typically lower than proton mobility in CEMs.26,27 While AEMs can be effective at blocking cation permeation at low concentration, uptake of acid (water) can occur in the high acid concentration environment.28,29 Our results point to a major role for imbibed acid in the membranes exposed to concentrated sulfuric acid. In the presence of excess acid, it is possible that the protons carry substantial charge in the AEM, while anions do not exhibit similar behavior in the PEM. Keep in mind that at high hydration levels typical of the conditions used here, transport occurs through the bulk of solution in any pores, with little direct involvement from the side chains. The data in this and other studies clearly suggest a more complex transport process. Of course, this conclusion is primarily associated with membranes equilibrated with pure water and therefore must be regarded as tentative. Another consequence of this assertion that both species are mobile is that transport of acid or salts takes place under conditions in which electroneutrality is maintained locally within the membrane.
Polarization curves
The cell voltage, iR-free cell voltage, and ASR obtained during polarization curves at 50% SoC and 100% SoC for QDAPP and SDAPP are shown in Figs. 2 and 3, respectively, with Nafion included for reference. iR-free polarization curves represent a combination of activation and concentration polarizations, which are primarily attributed to the electrode kinetics and mass transport through the electrode induced by the flow field, respectively. As seen in Figs. 2a, 2b and 3a, 3b, at current densities below 1000 mA/cm2, the iR-free cell voltage is essentially the same between membranes and membrane types, indicating consistent electrode behavior between different cells. At current densities above 1000 mA/cm2 in Fig. 2, the iR-free cell voltage curves for SDAPP and QDAPP diverge from Nafion. This suggests an additional concentration polarization due to the membrane. This divergence at 100% SoC is seen primarily in QDAPP and not SDAPP, shown in Fig. 3a.
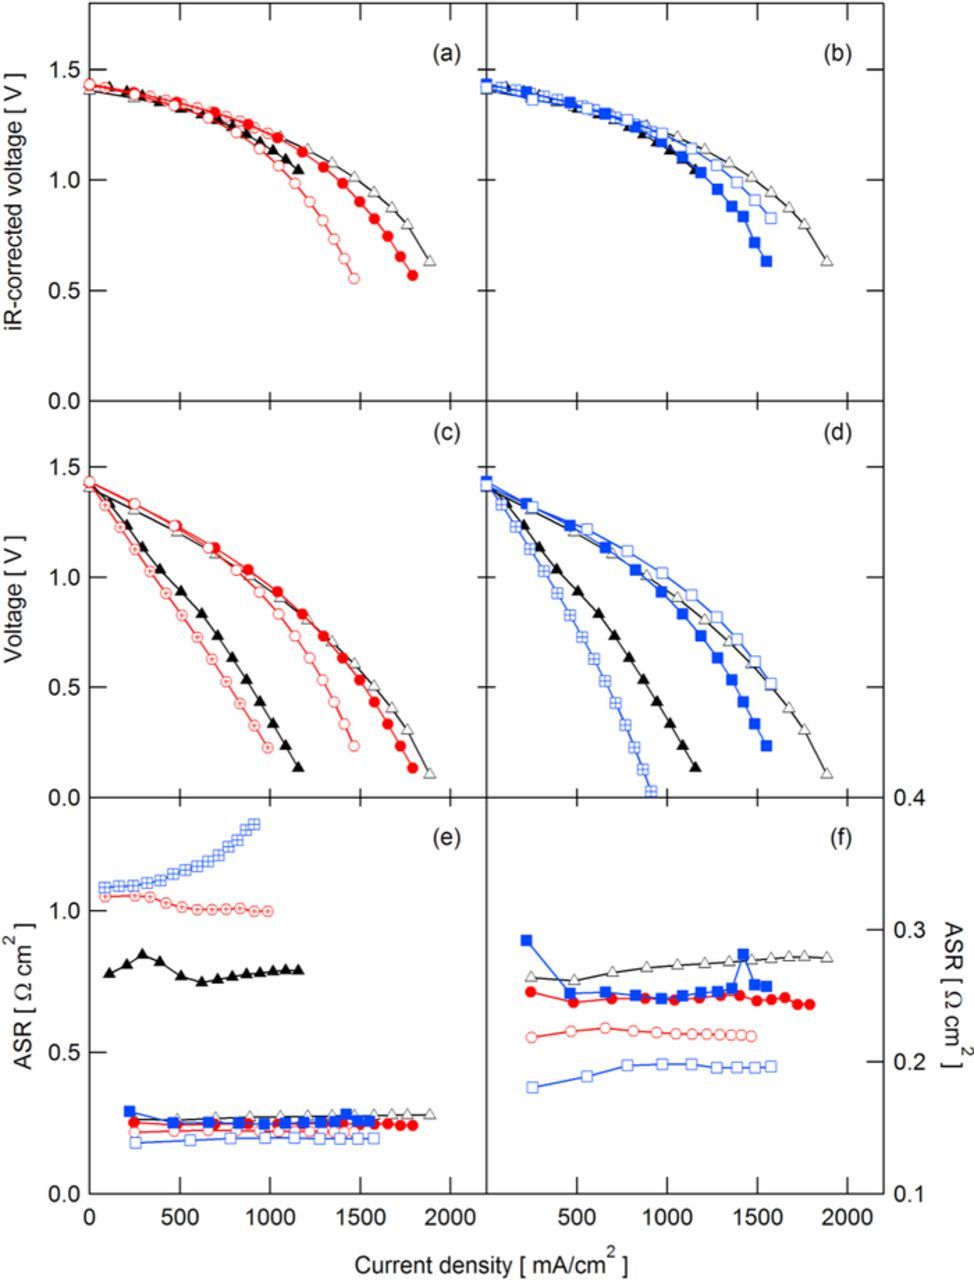
Figure 2. Polarization curves obtained at 50% SoC for QDAPP (a,c) and SDAPP (b,d) membranes, with Nafion for comparison: (a,b) iR-corrected and (c,d) actual cell voltages. ASR obtained during polarization curves for all membranes (e) and zoomed in on low-resistance membranes (f).  N117;
N117;  NR211;
  SDAPP 1.4;
  SDAPP 1.8;
  SDAPP 2.2;
  QDAPP 0.4;
  QDAPP 0.8;
  QDAPP 1.2.
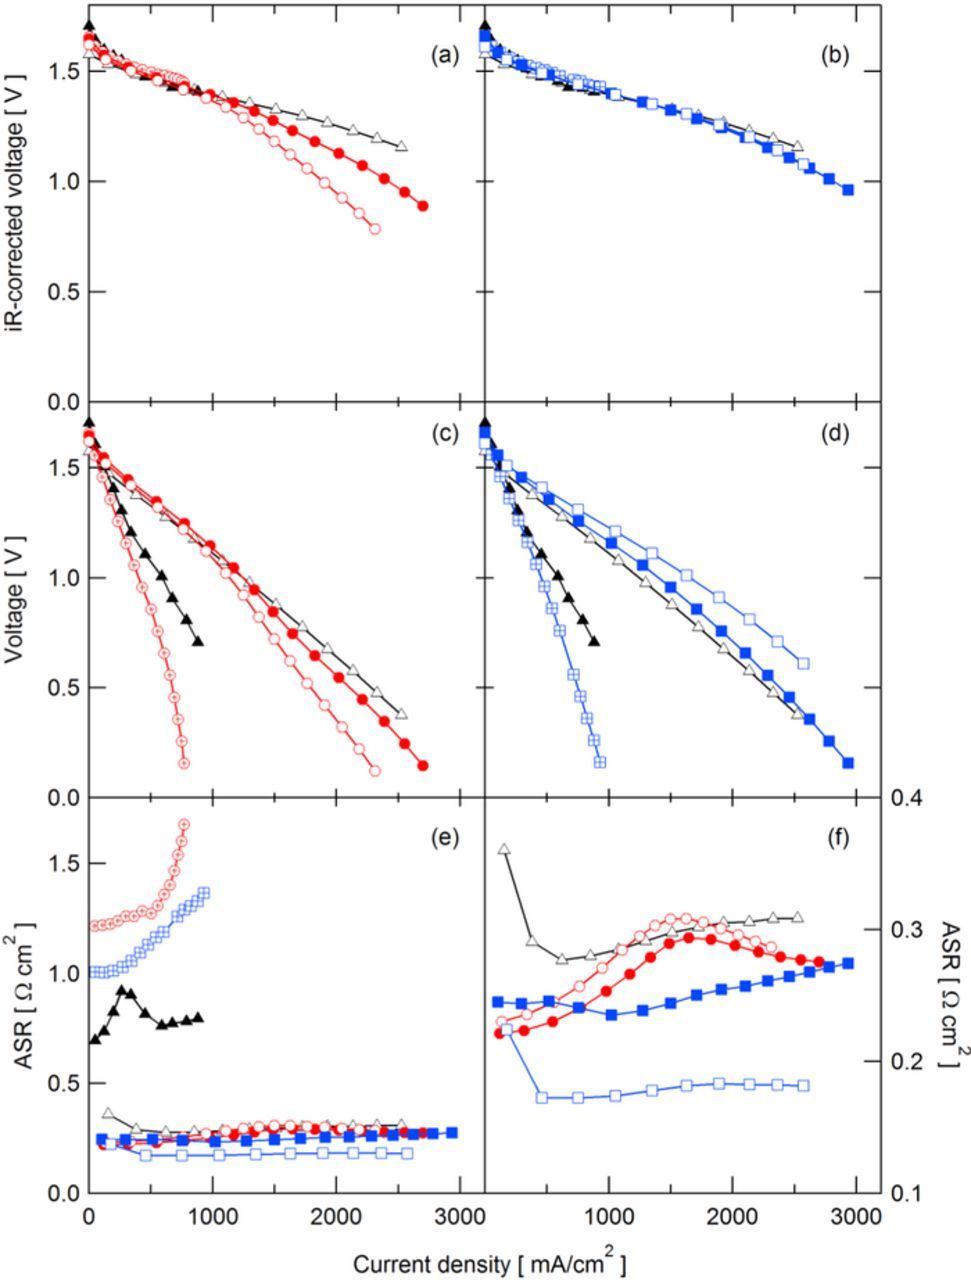
Figure 3. Polarization curves obtained at 100% SoC for QDAPP (a,c) and SDAPP (b,d) membranes, with Nafion for comparison: (a,b) iR-corrected and (c,d) actual cell voltages. ASR obtained during polarization curves for all membranes (e) and zoomed in on low-resistance membranes (f). N117; NR211; SDAPP 1.4; SDAPP 1.8; SDAPP 2.2; QDAPP 0.4; QDAPP 0.8; QDAPP 1.2.
As noted above, the uptake of acid into these membranes entails a shift in transport mechanism. The 'natural' tendency for transport in AEMs is to conduct anions, whereas in the CEM the tendency is for proton transport. Thus, it is likely that transport in the AEM includes a relatively high transference number for the bisulfate anion in comparison to the transference number for bisulfate in CEMs. Especially in the AEM, the membrane is no longer a single ion conductor. To allow the battery to perform, significant proton transport must also occur within the AEM in the aqueous pore solution within the polymer. In order to explain the apparent concentration polarizations at current densities above 1000 mA/cm2, we consider the electroneutrality requirement and the transference numbers of protons and bisulfate. Electroneutrality requires that ions (predominantly protons and/or bisulfate) cross the membrane to balance the electron transport occurring during charge or discharge. In the polarization curves in this work, only discharge is considered; ionic current through the membrane consists of a combination of protons traveling from the negative electrode to the positive and bisulfate traveling in the opposite direction. In SDAPP, it is expected that protons carry the bulk of the current; in QDAPP, bisulfate is expected to play a significant role. As current is passed, a buildup of bisulfate occurs on the negative side of the cell near the membrane, as bisulfate travels from the positive to negative electrode during discharge. We postulate that this buildup of bisulfate ions is at least partially responsible for the concentration polarization observed in QDAPP 0.8 and 1.2 at 50% SoC (QDAPP 0.4 did not reach high enough current to display the polarization due to prohibitively high ASR). Comparing QDAPP 1.2 to NR211 at a current density of ∼2.3 A/cm2, QDAPP 1.2 exhibited an additional 400 mV of concentration polarization, presumably due to the imbalance in bisulfate across the membrane. Of course, in the operating cell, transport of vanadium species is also important. The differences between the 50% and 100% SoC curves, and where the additional concentration polarization appears, are likely related to transport of the differing vanadium species when at 50% SoC and 100% SoC.
The uncorrected cell voltages reflect the performance of the cell with the inclusion of ohmic losses. Shown in Figs. 2c, 2d and 3c, 3d, the performance of cell using QDAPP 0.8 and 1.2 and SDAPP 1.8 and 2.2 compare well with NR211, predicting operating voltages within ∼100 mV of NR211 under 1.5 A/cm2. These mid and high IEC QDAPP and SDAPP membranes show promise as membranes for enabling lower voltage losses at high current densities as a result of their low resistances. Even beyond 500 mA/cm2, the cell voltage was above 1.0 V. QDAPP 0.4 and SDAPP 1.4 had significantly lower voltages because of their high ohmic loss, precluding high efficiency operation at high current density.
The OCV taken during polarization curves is shown in Table II; for the 100% SoC curves, the OCV was highest for N117 (1.706 V) and lowest for NR211 (1.577 V), with the QDAPP and SDAPP membranes falling in the range between them. The difference in OCV can be attributed to crossover of VO2+ and V2+ species, similar to the influence of fuel crossover on OCV in DMFCs.30 Crossover is pronounced in high ion conduction films and thinner membranes (< 30 micron), which leads to larger OCV drops. At 100% SoC, even small rates of crossover can have a large impact on OCV because the Nernst equation is very sensitive to small changes in concentration at high SoC, illustrated by the simple calculation below. The OCV of a VRFB is given by the following equation, neglecting the effect of protons:

Table II. The measured OCV during 50 and 100% SoC polarization curves.
| OCV at 50% SoC | OCV at 100% SoC | |
|---|---|---|
| QDAPP 0.4 | 1.428 | 1.657 |
| QDAPP 0.8 | 1.435 | 1.646 |
| QDAPP 1.2 | 1.434 | 1.621 |
| SDAPP 1.4 | 1.428 | 1.661 |
| SDAPP 1.8 | 1.434 | 1.657 |
| SDAPP 2.2 | 1.418 | 1.611 |
| N117 | 1.435 | 1.706 |
| NR211 | 1.406 | 1.577 |
If it is assumed that a highly permeable membrane allows a 2% change in SoC in the electrolyte contained within the cell, the difference in OCV is much larger at 99% SoC than at 50% SoC. At 298 K, the thermodynamic difference in OCV is 57 mV as follows:  , whereas the difference in OCV between an SOC of 50% and 48% evaluates to 4 mV in a similar expression.
The ASR in VRFBs is a combination of the ionic and electronic resistances in the cell. Ionic resistance results from the resistance of the membrane as well as the liquid electrolyte; ionic conductivity (including vanadium, protons, and sulfate) and thickness in the cell are the main determinants of the membrane resistance. Electronic resistance is due to the bulk resistance of the carbon paper and graphite flow fields as well as the contact resistance between these components in the cell assembly. In VRFBs, the majority of the ASR is attributed to the membrane,5,31 and in this study the flow field/electrode configuration were consistent between builds; therefore, observed changes in the cell ASR are attributed to the membrane. At 50% SoC, the ASR is inversely related to IEC: the average ASRs between 0 and 500 mA/cm2 for QDAPP 0.4, 0.8, and 1.2, were 1.05, 0.25, and 0.22 Ω cm2, respectively; SDAPP 1.4, 1.8, and 2.2 were measured at 1.09, 0.25, and 0.19 Ω cm2, respectively. However, at 100% SoC, QDAPP 0.8 has a slightly lower ASR than QDAPP 1.2, consistent with the trend in measured conductivities in sulfuric acid. Such behavior indicates that the conductivity of QDAPP is sensitive to the electrolyte environment. As previously discussed, the ion conduction mechanism in QDAPP may be strongly related to the acid/water uptake behavior. Thus, it follows that when SoC changes, which can affect acid uptake,23 the membrane conductivity may also change. In contrast, the SDAPP membranes do not appear to have the same sensitivity to 100% SoC solutions. It is notable that the ASR is highly nonlinear as a function of IEC for both SDAPP and QDAPP: an increase of 0.4 meq/g from SDAPP 1.4 to 1.8 or QDAPP 0.4 to 0.8 decreases ASR from 1 Ω cm2 to less than 0.3 Ω cm2; an additional 0.4 meq/g increase in IEC has little additional impact. As discussed above, the membranes exhibit complicated acid uptake behavior. That ASR responds non-linearly to IEC is further evidence that the acid uptake behavior is not straightforward. Furthermore, the nonlinearity may also suggest that the conductivity optimization cannot be achieved by solely increasing IEC.
At 100% SoC, the QDAPP 0.4 and SDAPP 1.4 membranes exhibit an ASR that sharply increases as a function of current density (30% increase in ASR at the maximum current density compared to OCV). Similar trends have been seen in fuel cells due to dry-out of the anode.32 Though the membrane is in constant contact with liquid-phase sulfuric acid solution in the flow battery, it is still possible for the membrane to experience local decreases in water content if the water diffusivity within the membrane cannot keep pace with electroosmotic drag. Furthermore, these low IEC membranes are of particularly low water content in the first place. Previous fuel cell membrane work showed that water diffusivity and water content are positively correlated;33 thus, with membranes in which the water content is low, water diffusivity is low. This is the case for the low IEC membranes, as low IEC results in reduced water uptake. For QDAPP 0.8 and 1.2 at 100% SoC, the ASR also shows some dependence on current density, with a maximum appearing at ∼1.5 A/cm2. At 50% SoC, the ASR shows little variation with current density. Elucidating the differences in ASR as functions of SoC and current density are outside the scope of this publication. From the results shown here, it appears that the anion exchange membrane, QDAPP, appears to be more sensitive to the solution conditions. As discussed above, concentration or transference effects also are likely to exhibit a strong influence on behavior.
It is noted that the ASR as measured in the cells is notably higher than that predicted by conductivity measurements in sulfuric acid (Table I). For example, SDAPP 1.8 in sulfuric acid had an ASR of 0.067 Ω cm2; in the cell with vanadium solution, it was between 0.250 and 0.300 Ω cm2. The presence of vanadium has been shown to decrease membrane conductivity by a factor of at 2 when the membrane is equilibrated in 1.7 M vanadyl sulfate / 5 M total sulfate solution, as discussed in detail elsewhere.23 In that study, it was suggested that the presence of vanadium cations within the bulk water solution can interfere with the hydrogen bonding network, disrupting proton conduction via the Grotthus mechanism. We expect that the increase in ASR from the conductivity measurement to the measured in-cell ASR with vanadium is due to the presence of vanadium species within the membrane.
The overall contribution of membrane resistance to the overall cell polarization is significant, as shown in Fig. 4 with data obtained from the 50% SoC polarization curves. With the low IEC QDAPP and SDAPP, the cell resistance accounts for at least 80% of the cell's overall polarization over the entire current density range, with N117 accounting for only slightly less. With the low resistance QDAPP and SDAPP and NR211, the membrane accounts for ca. 50% of the overall polarization at a current density of 250 mA/cm2. As most VRFBs operate at or below this current density with comparable or higher ASR, it is clear that the membrane's ohmic resistance is a major contributor to voltage loss in most VRFB systems to date.
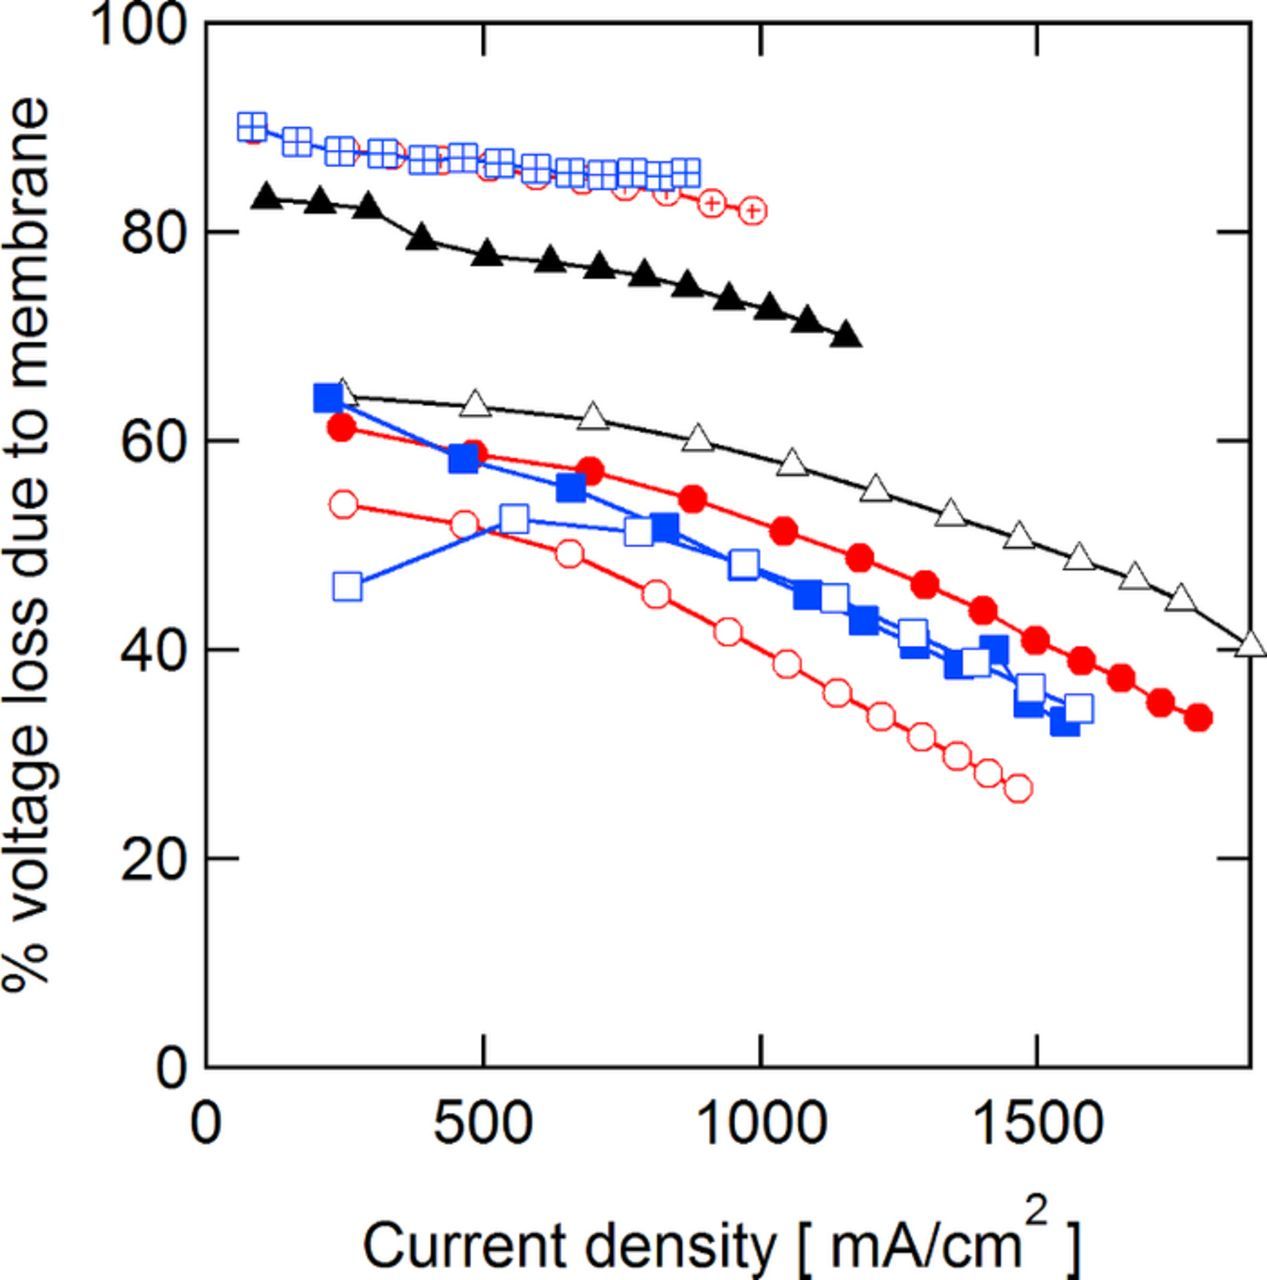
Figure 4. Fraction of total voltage loss due to the membrane resistance in the cell obtained during 50% SoC polarization curves. N117; NR211; SDAPP 1.4; SDAPP 1.8; SDAPP 2.2; QDAPP 0.4; QDAPP 0.8; QDAPP 1.2.
OCV decay
Differences in the OCV were observed during polarization curves; such differences are indicative of differing rates of vanadium permeation through the membrane. OCV decay experiments were carried out to qualitatively compare vanadium crossover between membranes in a straightforward manner, although detailed information about the permeation rates of the individual oxidation states of vanadium cannot be obtained from this experiment without additional instruments to measure the vanadium concentrations independently, e.g. UV-vis spectroscopy34 and potentiometric titration.35 As the measured thickness of the QDAPP and SDAPP membranes were similar (40–60 μm), differences in the OCV decay are attributed to the vanadium ion permeability of each membrane. Shown in Fig. 5 is the OCV decay for each membrane over time including a comparison to Nafion; the profile is not expected to be linear and is described further by Sun and coworkers.35 N117 closely overlaps the very similar SDAPP 1.4 and 1.8 results, while NR211 overlaps the SDAPP 2.2 data. QDAPP membranes can exhibit markedly slower OCV decay, as QDAPP 0.4 exhibited nearly 200 mV less OCV decay than N117 and SDAPP 1.4 and 1.8. Interestingly, QDAPP 0.8 and 1.2 did not prevent OCV decay more readily than N117 or SDAPP 1.4 and 1.8. In references 17 and 18 we reported estimates of the permeability of the VO2+ ion (KV) through the membranes. Table III shows the permeabilities of the QDAPP and SDAPP membranes relative to N117. The measured permeability in QDAPP membranes is similar to that in the SDAPP membranes: KV(QDAPP 1.2)/ KV(SDAPP 2.2) ∼ 1.14, KV(QDAPP 0.8)/ KV(SDAPP 1.8) ∼ 1.00, and KV(QDAPP 0.4)/ KV(SDAPP 1.4) ∼0.44.17,18 Also, dramatic decreases in vanadium permeability with decreasing IEC were observed for both membrane types, such that KV(QDAPP 1.2)/ KV(QDAPP 0.4) ∼14 and KV(SDAPP 2.3)/ KV(SDAPP 1.4) ∼36.17,18 Based on the VO2+ permeability alone, the OCV decay should be rather similar for each IEC pair. However, both the low and high IEC QDAPP had slower OCV decay than their low and high IEC SDAPP analogs. The middle IEC QDAPP, however, exhibited a faster decline, with a sharp drop occurring after ∼1 h while the middle IEC SDAPP did not show the sharp drop even after 2 h.
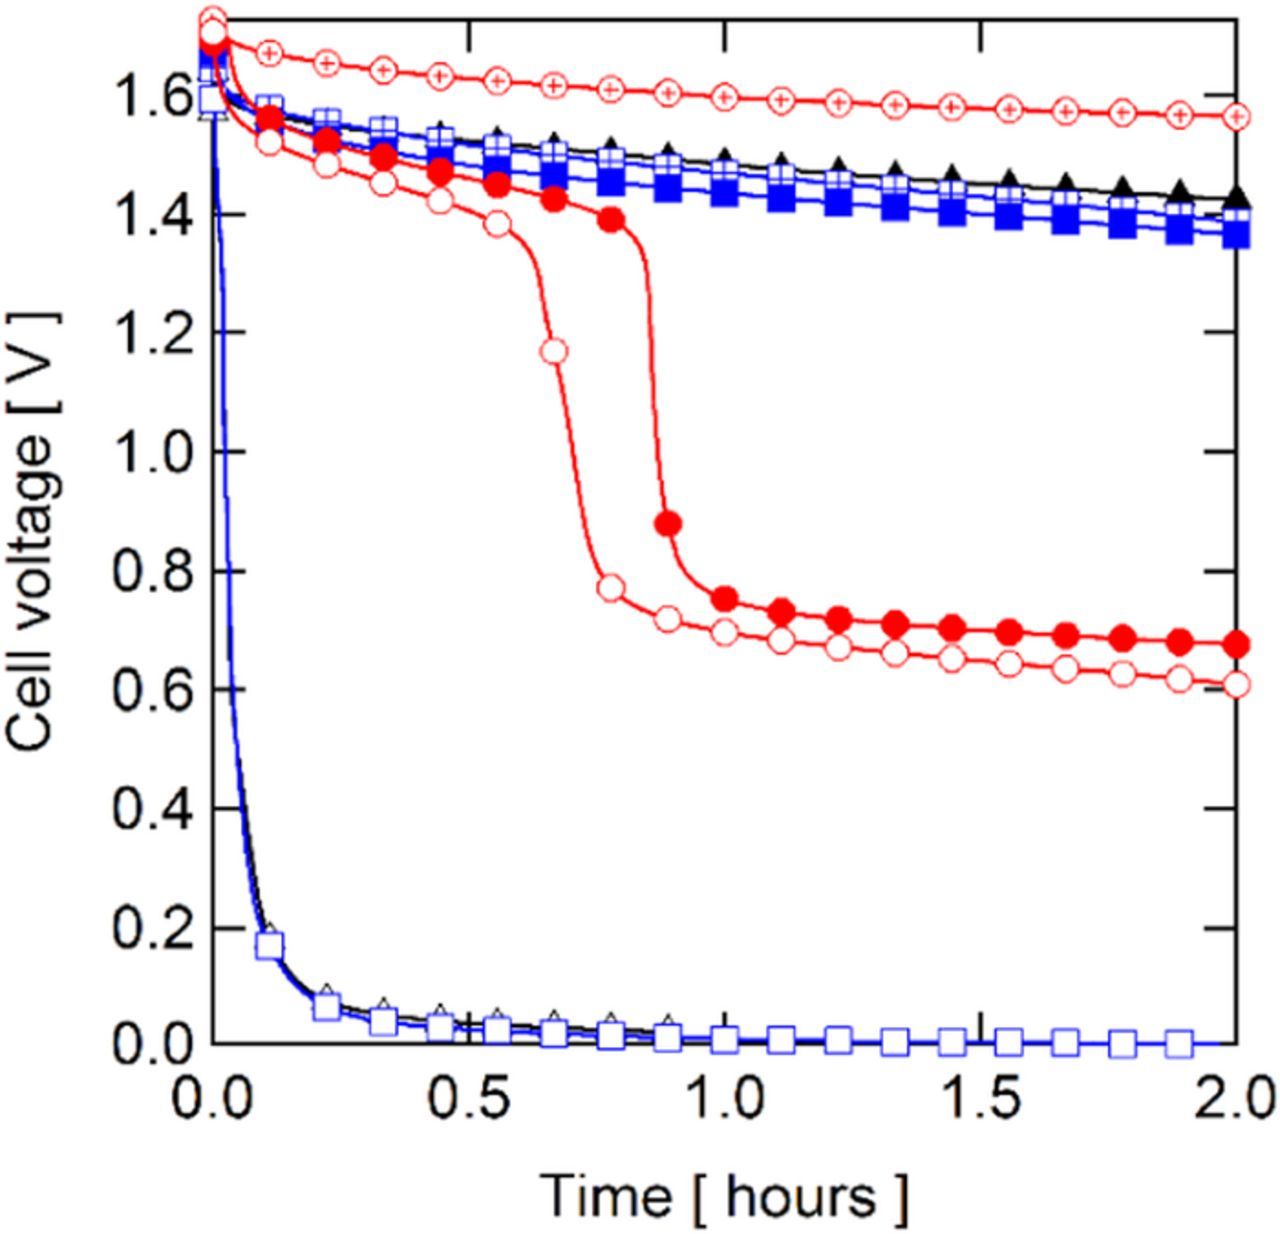
Figure 5. Open-circuit voltage decay from 100% SoC in a static environment. N117; NR211; SDAPP 1.4; SDAPP 1.8; SDAPP 2.2; QDAPP 0.4; QDAPP 0.8; QDAPP 1.2.
Table III. VO2+ permeabilities of QDAPP and SDAPP relative to permeability in N117. Low IEC refers to SDAPP 1.4 & QDAPP 0.4, mid refers to SDAPP 1.8 & QDAPP 0.8, and high refers to SDAPP 2.2 & QDAPP 1.2.
| IEC | SDAPP | QDAPP |
|---|---|---|
| Low | 0.037 | 0.042 |
| Mid | 0.331 | 0.330 |
| High | 1.337 | 0.589 |
Based on simple electrostatics, it is expected that QDAPP would exhibit a slower OCV decay in comparison with SDAPP, as the positively charged functional groups in QDAPP should impede vanadium transport relative to the negatively charged functional groups in SDAPP as a result of Donnan exclusion. Note, however, that we are working in a domain in which Donnan exclusion is overcome and the primary effects are subtler than might be expected from electrostatics alone. The consequences of Donnan breakthrough means that water/acid uptake are much more important, as vanadium ions will diffuse through the bulk liquid within the membrane. Thus, increased IEC leading to more water/acid uptake should also lead to higher vanadium permeability in both QDAPP and SDAPP. The permeability measurements as well as the OCV decay confirm this hypothesis. Importantly, increasing the IEC of QDAPP membranes does not result in lower permeability. Thus, the idea that AEMs prevent crossover or vanadium permeation is not necessarily true in the concentrated electrolyte environment typical of VRFBs.
Cycling
The cycling performance of each membrane was compared by evaluating coulombic, voltage, and energy efficiencies for 20 cycles, with the first cycle for each cell tested shown in Fig. 6. The QDAPP 0.4 and SDAPP 1.4 membranes are not presented here since their high ASR precluded cycling at 200 mA/cm2. The cycling behavior of the membranes was relatively stable: as shown in Fig. 7, the voltage efficiency (VE) was virtually unchanged from cycle 1 to cycle 20 for all cells. The coulombic efficiency (CE) was stable in all cases with the exceptions of NR211 and SDAPP 2.2 Differences in coulombic efficiency are primarily affected by the membrane, as it is the only variable changed between tests. It is expected that the tests adopting membranes with high vanadium permeability result in lower CE, as self-discharge occurs when vanadium species cross the membrane and react with the charged V2+ and VO2+ species. The CEs observed generally agree with the OCV decay experiments. The SDAPP 2.2 and NR211 membranes, with rather rapid OCV decay, had CEs below 50%. SDAPP 1.8 had the highest CE, followed by QDAPP 0.8, QDAPP 1.2, and then N117; all of these membranes were between 94 and 96% CE. Other than N117, these results follow the same trend as the OCV decay, with SDAPP 1.8 showing the slowest OCV decay (corresponding to the highest CE), followed by QDAPP 0.8 and then QDAPP 1.2. It is noted that while QDAPP 0.8 and 1.2 appear to be significantly worse than N117 and SDAPP 1.8 in terms of OCV decay, the CEs were in fact very similar. These results show that while the OCV decay experiment is a useful as a qualitative tool for comparing vanadium permeability, CE cannot be predicted solely by the OCV decay experiment. The discrepancy may be due to the fact that the OCV decay experiment only measures diffusional crossover statically and neglects the electroosmotic and pressure-driven fluxes that are present in an operating battery.36 The timeframe sampled in the two experiment types is different and the condition of the electrolyte varies substantially during cycling. Differences in the voltage efficiency (VE) are attributed to differing ohmic drops, as the iR-free voltages for all cells were very similar at 200 mA/cm2 as measured in the polarization curves. Other than N117, which had a relatively low VE of 77% due to high ASR, the other five membranes cycled had very similar VEs (87–88%), illustrating that though the resistance is often considered to be a dominating factor in battery performance, the VE difference at the relatively high current density of 200 mA/cm2 is not greatly affected by differing ASRs. The energy efficiency (EE) metric combines the VE and CE; the EE is relevant when comparing the tradeoffs between low conductivity membranes (low VE, high CE) and high conductivity membranes (high VE, low CE). Though NR211 and SDAPP 2.2 had some of the lowest observed ASRs, the poor CE dominates, with EEs of ∼46 and 40%, respectively. In contrast, N117, with its high CE, pays a penalty in the VE for its relative thickness, resulting in an EE of 73%. SDAPP 1.8, QDAPP 0.8, and QDAPP 1.2 have the best overall performance in terms of EE, all ∼85%, as they have high VE and CE. In comparing to N117, the SDAPP and QDAPP membranes show an increase in EE of over 10% at the relatively high current density of 200 mA/cm2. To further illustrate the tradeoff (or lack thereof) between achieving low permeability and high conductivity, the CE, VE, and EE are plotted against the ASR measured during cycling in Fig. 8. Interestingly, high ASR does not necessarily result in drastically lower VE and low ASR does not necessarily result in low CE.
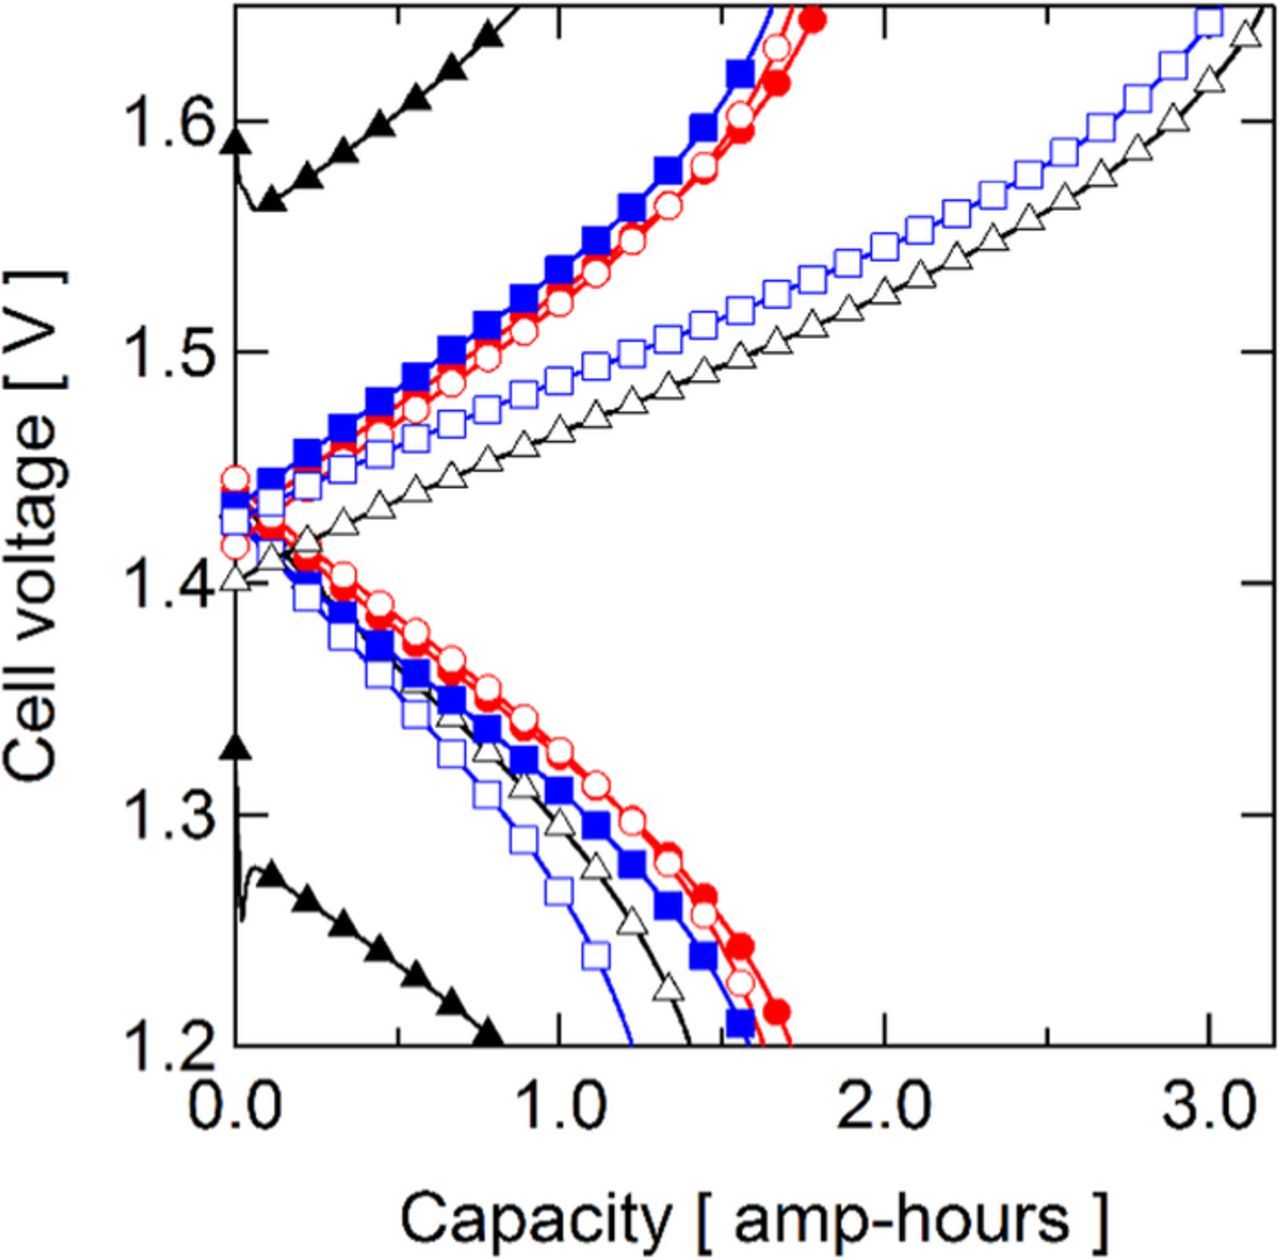
Figure 6. First charge/discharge cycle. N117; NR211; SDAPP 1.8; SDAPP 2.2; QDAPP 0.8; QDAPP 1.2.
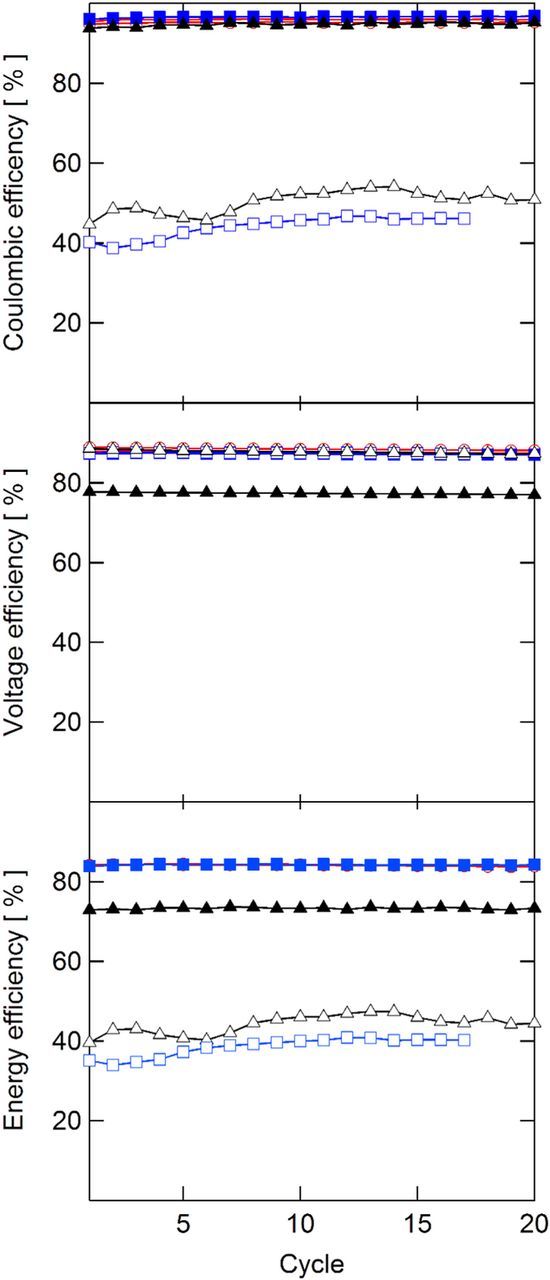
Figure 7. Coulombic, voltage, and energy efficiencies obtained during cycling. N117; NR211; SDAPP 1.8; SDAPP 2.2; QDAPP 0.8; QDAPP 1.2.
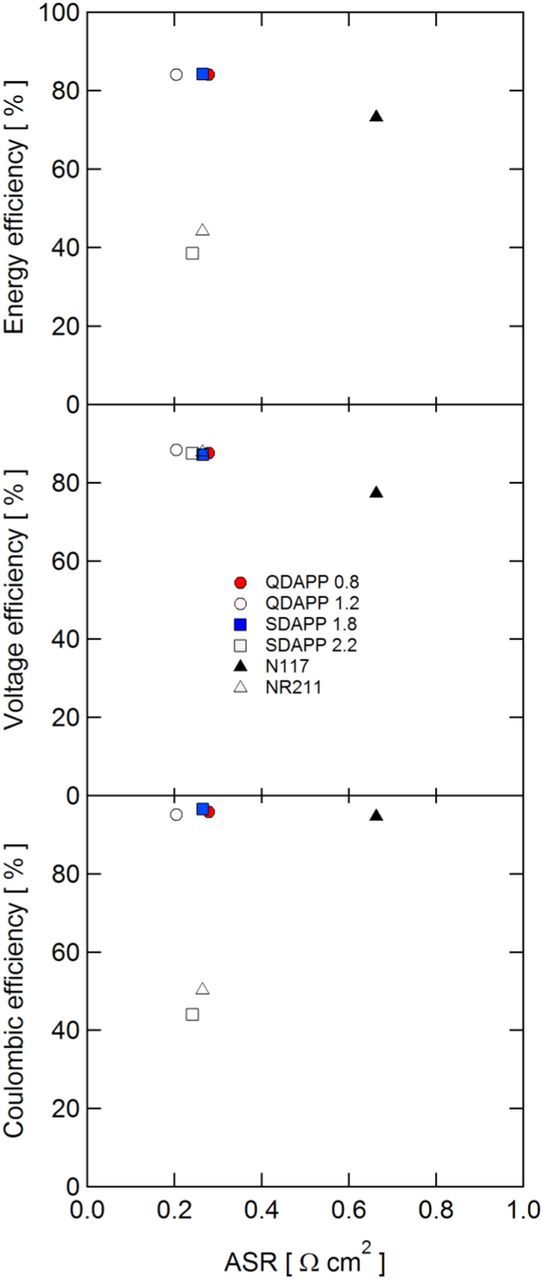
Figure 8. Coulombic, voltage, and energy efficiencies plotted against the average ASR measured during cycling.
While coulombic, voltage, and energy efficiency are important factors in evaluating membranes, it is also important to monitor the capacity fade. This phenomenon is in part due to imbalances in the vanadium concentrations in each half-cell that build up as a result of crossover. As one side of the battery is depleted in vanadium, the total charge that can be stored in the electrolyte decreases, resulting in capacity fade. While VRFBs are touted for the ability to rebalance the electrolyte periodically, minimizing capacity fade is desirable to lower the maintenance cost associated with rebalancing operations. Fig. 9 shows capacity fade, both in absolute terms and normalized with respect to the first cycle for each membrane. It is typically believed that membranes with low vanadium permeability are expected to exhibit decreased rates of capacity fade; however, this is only true if diffusion-based crossover dominates other transport phenomena. SDAPP 1.8 showed the lowest rate of capacity fade, losing only 6% of its capacity after 20 cycles; both QDAPP and Nafion lost over 15% of their capacity after 20 cycles. The erratic behavior of the SDAPP 2.2 capacity is attributed to membrane instability – as the ASR decreased for the first few cycles, the effective voltage window grew, increasing capacity. It is interesting that both Nafion and QDAPP showed similar rates of normalized capacity fade, as the CE for NR211 was significantly lower than that of N117 and both QDAPP membranes. This finding suggests that capacity fade and CE are not strongly linked. Migration, diffusion, and convective forces can all cause crossover of vanadium ions, reducing CE; however, some of these modes of crossover may occur preferentially in one direction. For example, the negative side of the battery is always at a lower potential than the positive side, and thus migration may always act to drive the positively charged vanadium ions toward the negative side. The diffusion coefficient of vanadium ions through the membrane is dependent on the oxidation state of the vanadium, i.e., VO2+ diffuses more rapidly through the membrane than V2+;37 this mismatch in diffusion coefficient can result in a net imbalance in vanadium concentration. Side reactions can also contribute to capacity fade.38
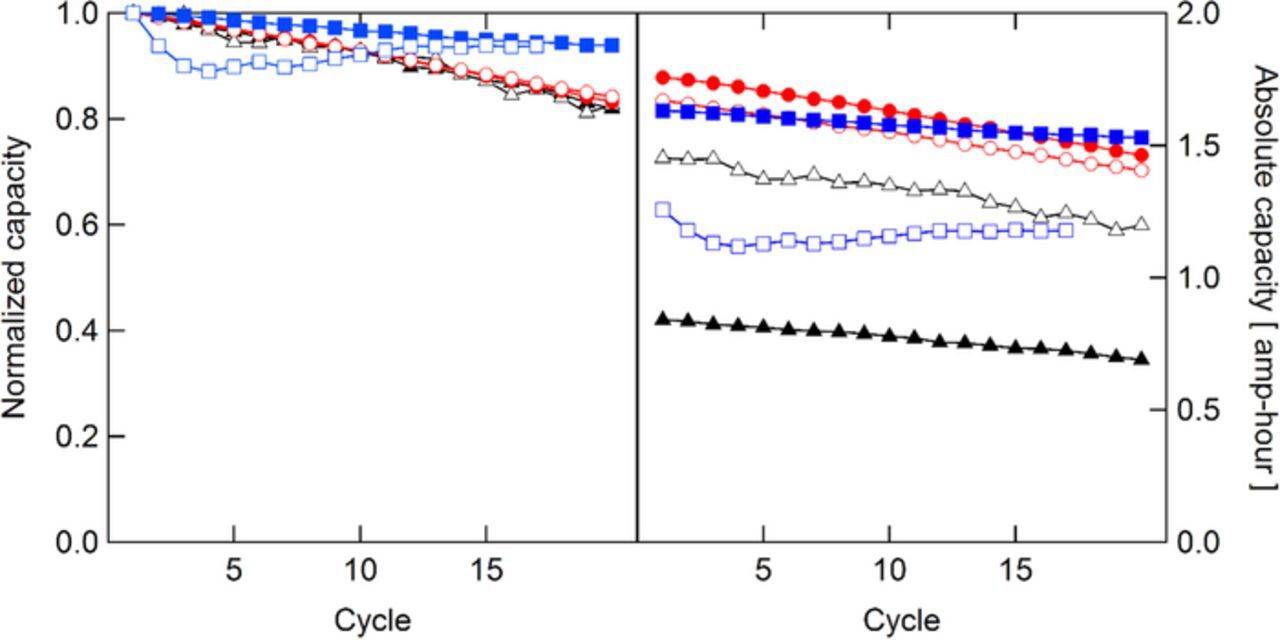
Figure 9. Discharge capacities obtained during cycling. Left: normalized to cycle 1 capacity. Right: absolute capacity. N117; NR211; SDAPP 1.8; SDAPP 2.2; QDAPP 0.8; QDAPP 1.2.
Though QDAPP is an AEM, and SDAPP and Nafion are CEMs, the capacity fade does not appear to depend strongly on functional groups in the membrane. Again, this appears to correlate with the OCV decay results – the nature of the side chains in the membrane – cationic or anionic – does not seem to have a significant impact on vanadium permeation for membranes with comparable physical properties. This reinforces the notion that the overall rate of net crossover is not strongly dependent on diffusion along the charged functional groups, and more likely related to transport through the bulk acid/water solution in the membrane.
The absolute capacity is also an important metric to compare. Because a large portion of VRFB cost is due to the vanadium,39 increasing the vanadium utilization is critical to achieving competitive cost. For equal volumes of electrolyte, then, the absolute capacity that can be discharged is of great importance. QDAPP 1.2 and 0.8, along with SDAPP 1.8, are the best performers in terms of absolute discharge capacity, with cycle 1 capacities between 1.6 and 1.8 Ah, 80–90% of the 2 Ah theoretical total capacity. The low capacity of N117 (0.8 Ah) is attributed to the high ohmic drop; the cutoff potentials during cycling are reached prematurely. The poor absolute discharge capacity in NR211 (1.4 Ah) and SDAPP 2.2 (1.2 Ah) are attributed to high rates of vanadium crossover.
The ASR measured at the end of each discharge step is shown in Fig. 10. Other than SDAPP 2.2 and N117, the membranes showed rather stable ASRs over time, indicating membrane stability in an operating cell over relatively short time periods. The slight decrease in the ASR of SDAPP 2.2 could be indicative of a short-term and non-catastrophic membrane degradation and explains the capacity increase for the SDAPP 2.2 membrane after a few cycles.
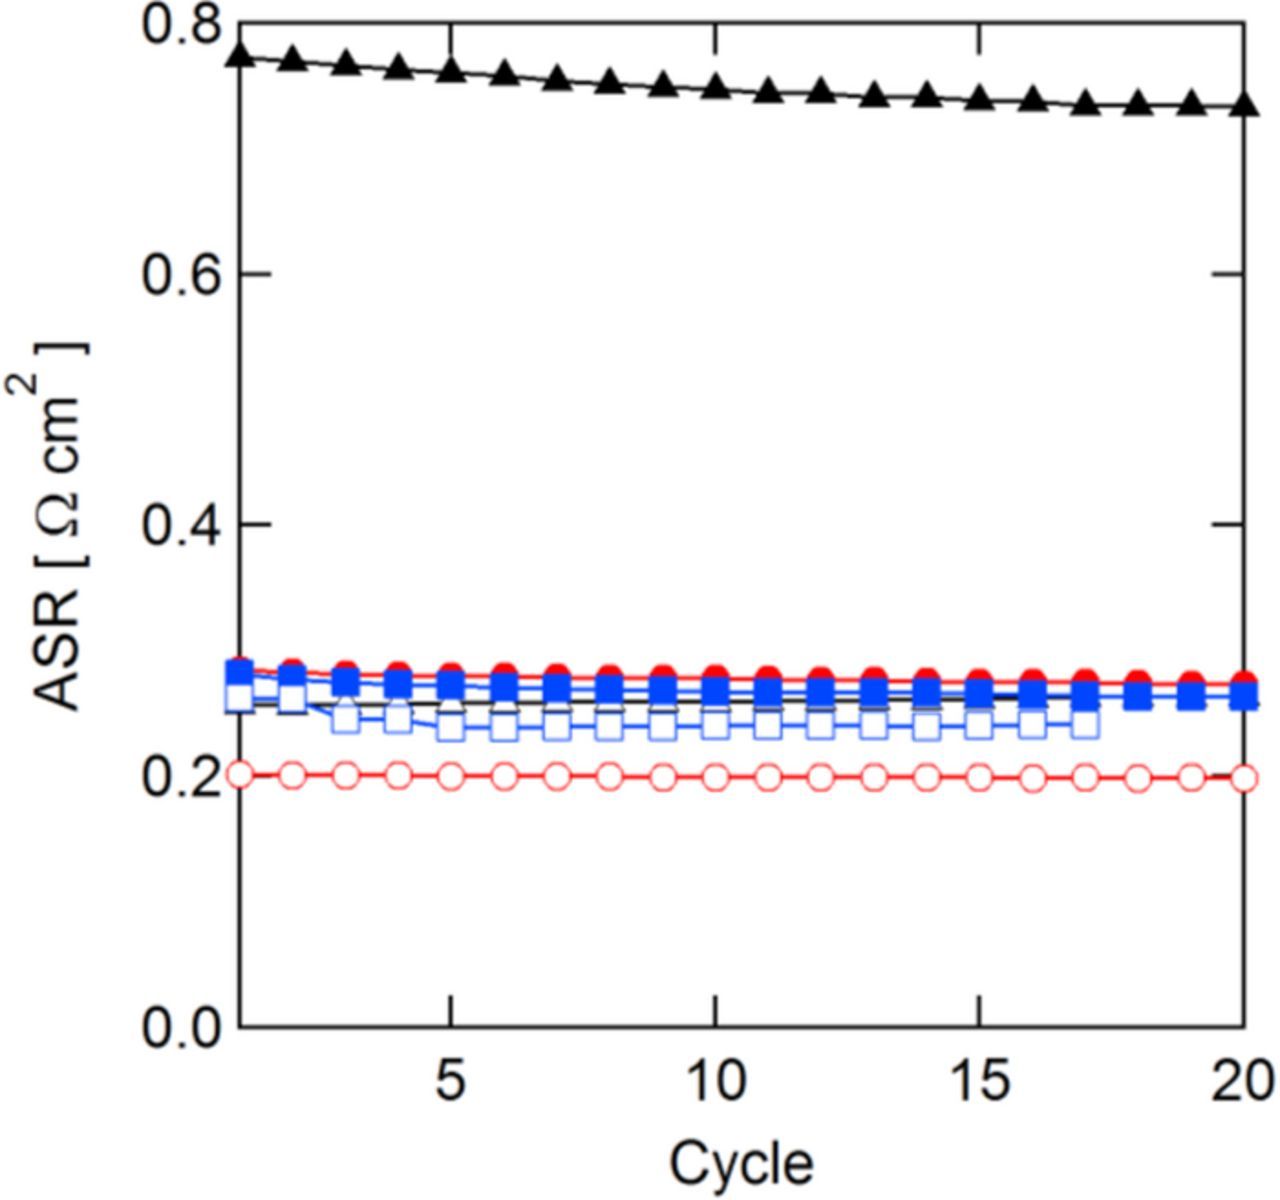
Figure 10. ASR measured at end of discharging steps during cycling. N117; NR211; SDAPP 1.8; SDAPP 2.2; QDAPP 0.8; QDAPP 1.2.
Conclusions
In this work, a comprehensive comparison of anionic and cationic Diels Alder poly(phenylene)s (QDAPP and SDAPP, respectively) and Nafion membranes in cells was carried out. Flow batteries assembled with QDAPP and SDAPP were shown to have ASRs as low as those assembled with Nafion 211; based on polarization curve analysis, the measured ASR was below 0.3 Ω cm2. Cycling with overall energy efficiencies of 85% for SDAPP 1.8 and QDAPP 0.8 and 1.2 at a current density of 200 mA/cm2 were achieved. These membranes had coulombic efficiencies above 95%, slightly better than the thick Nafion 117, while their voltage efficiencies of 88% matched that of the thin Nafion 211.
The QDAPP membranes were most sensitive to operating conditions, with changes in ASR as a function of current density and a complicated relationship between IEC and ASR at 100% SoC. Additionally, apparent concentration polarizations were observed with QDAPP membranes at very high current densities. OCV decay was positively correlated with IEC; QDAPP was shown to have a rate of self-discharge in comparison with SDAPP and Nafion in spite of the fact that QDAPP is an AEM and the others were CEMs. Thus, under high acid concentrations typical in VRFBs, AEMs may not inhibit vanadium crossover as effectively as is typically assumed. The observed trends with vanadium permeation as well as membrane conductivity suggest that the ion conduction mechanism likely occurs in a bulk liquid phase.
Acknowledgments
We gratefully acknowledge the U.S. Department of Energy, Office of Electricity Delivery and Energy Reliability (Dr. Imre Gyuk). Cell testing was performed at Oak Ridge National Laboratory (AMP, ZT, CNS) and membrane synthesis was performed at Sandia National Laboratories (CF). Sandia National Laboratories is a multi-program laboratory operated by Sandia Corporation, a wholly owned subsidiary of Lockheed Martin Company, for the U.S. Department of Energy's National Nuclear Security Administration under contract DE-AC04-94AL8500.