Abstract
Various operational parameters such as charge/discharge rates, relaxation periods, and depth of charge and discharge play an important role in enhancing the cycling life of Li-ion batteries. Providing batteries with a relaxation period after discharging and charging might be essential for removing concentration gradients generated due to passage of current. In the present work, the effect of providing open-circuit time durations after completion of each charge and discharge over the performance of Li-ion cells has been analyzed and quantified. It is shown that relaxing the cell after discharge has significant influence over cell performance, whereas relaxation after charge has a marginal effect. In the former case, a relatively thicker film forms at the solid-electrolyte interface in the negative electrode. Moreover, providing a sufficiently long relaxation to the cell at the end of discharge results in (a) a higher concentration of lithium in the solid matrix of the negative electrode and (b) a lower concentration of lithium in the positive electrode, both leading to a higher cell potential during the discharge phase of the subsequent cycle. Charging the cell following a relaxation period of more than one hour at the end of discharge results in a better utilization of cyclable lithium.
Export citation and abstract BibTeX RIS

This is an open access article distributed under the terms of the Creative Commons Attribution Non-Commercial No Derivatives 4.0 License (CC BY-NC-ND, http://creativecommons.org/licenses/by-nc-nd/4.0/), which permits non-commercial reuse, distribution, and reproduction in any medium, provided the original work is not changed in any way and is properly cited. For permission for commercial reuse, please email: oa@electrochem.org.
Diminishing fossil fuel reserves have made it imperative to develop alternative energy sources to power automotive vehicles. Many researchers have focused their attention toward sources such as biomass, solar, wind, fuel cells and batteries1–3 to accomplish this requirement. By virtue of their lower fuel consumption, silent operation and zero emissions, battery powered vehicles (such as hybrid and electric) offer a substitute to gasoline-fuelled vehicles.4 In the last decade, Li-ion batteries (LIBs) have been used extensively as power sources for many small and portable electronic devices such as mobiles, camcorders, PDAs, laptops, digital cameras and other communication devices. However, these portable electronic devices require a very low current. For high power applications, such as electric, hybrid-electric and plug-in hybrid-electric vehicles, a higher current is required. This puts limitations on the use of LIBs as power sources in these scenarios since their capacity decreases rapidly at high discharge rates.5
Several studies have focused their attention toward enhancement of battery performance in terms of energy and power density. In this regard, various combinations of electrode/electrolyte materials have been used with different operational and design parameters to minimize the capacity fading of Li-ion cells.5–9 Mesocarbon Microbead (MCMB) has been used commercially as an anode material due to its high reversible capacity, while it has limitation of film formation at solid electrolyte interface (SEI).10,11 Whereas in common cathode materials, manganese oxide is used as it is abundant, cheaper and environmentally friendly in nature. Moreover, use of manganese oxide as cathode material minimizes safety issues and thermal runways.12 However, batteries based on lithium manganese oxide as positive electrode have been shown to suffer from capacity degradation due to various associated parasitic reactions.13
To better understand and identify scenarios for improvement of battery performance, the effect of cycling over battery capacity has been investigated both experimentally14–17 as well as numerically.12,13,18–25 The effect of electrode preparation technique over capacity degradation of LiMn2O4 based cell has also been investigated.14 By studying the effect of cutoff voltages on Li-ion cell performance, it has been shown that operating the cell at higher potential causes severe capacity loss due to active material dissolution.15 Through an extended cycling investigation of Sony 18650 cells, it has been shown that the cathode has a relatively higher contribution in capacity fading of the cell as compared to anode.16 For vehicles powered by LIBs, a comparative study of cell performance for two cathode materials LiMn2O4 (LMO) and LiFePO4 (LFP) has been pursued.17 It was suggested that LMO could be used as cathode due to its better discharge performance whereas LFP for faster charging capability.
The capacity of the Li-ion cell decreases with cycling due to various unwanted reactions during charge and discharge. In this regard, the decomposition of electrolyte over anode has been reported to be an important reason for cell degradation.26 The loss of active material, deposition of solid precipitates at SEI and increase in cell impedance have been found to be responsible for capacity fading with cycling.5,27,28 The mathematical formulation of these capacity fade mechanisms presented in Ref. 13, has been separately employed to determine the kinetic parameters of solvent decomposition reaction at positive electrode and their effect on the intercalation current and potential of the porous electrode.18 Various modifications to the existing pseudo-2D model20,21 to investigate capacity fade mechanisms of LIBs due to formation and growth of the SEI film have also been presented.22–24 The basic principle in these studies involves the reaction of Li-ions at the anode with the electrolyte, forming insoluble products such as Li2CO3 that block the pores of the electrode leading to an increase in cell resistance that may be minimized by controlling parameters such as charge or discharge rates, depth of discharge, and end of charge voltage.8,26
In this connection, the effect of cell relaxation (i.e. zero current condition) on capacity retention and life span of 18650 commercial Li-ion cells was experimentally investigated.29 It was concluded that an improved performance in terms of capacity and life span can be achieved with the application of zero current segment (or relaxation duration) during cycling. However, the effect of incorporating relaxation phases between discharge and charge over lithium concentrations and solid phase potential in electrodes with cycling was not reported. In another study, a relaxation phase analysis over the lithium diffusion sites for cathode materials such as LixMn2O4 and LixCoO2 for different values of x has been performed.30,31 The relaxation span provided to the cell minimized the gradients of concentration and electric potential in electrolyte and solid which generally buildup due to the passage of current.
Despite these studies, incorporating zero current segment during cycling of cells over electrode concentration and potential and its effect on the resulting battery discharge capacity has not been studied. The impact of choosing longer or shorter relaxation durations and their position in a complete cycle (i.e., whether to relax before or after discharge) over cell performance is also unclear. By conducting a parametric study on relaxation ('resting') effect for O(103) cycles for Li-ion cells, we intend to fulfill the following objectives in this work:
- (a)analyze the effect of relaxation over behavior of solid phase and electrolyte concentration and potential across the cell, and
- (b)establish the relative importance of providing relaxation between discharge & charge, and charge & discharge over cell cyclability and performance.
Hence, with simulation results as evidence, we aim to prescribe an operating procedure for cyclic discharging and charging of Li-ion cells to achieve higher cell capacity and potential.
Methodology
Mathematical model
In this work, the pseudo 2-D model20,21 with electrolyte decomposition reaction22,23 has been employed. In this model, various dependent variables such as electrolyte concentration (ce), solid phase concentration (cs), electrolyte potential (Φe), solid phase potential (Φs), and current density (J) are solved in a one-dimensional domain (as shown in Fig. 1) with relevant boundary conditions imposed at the ends of the cell. In the electrolyte, the species transport is given by
![Equation ([1])](https://content.cld.iop.org/journals/1945-7111/162/2/A3145/revision1/jes_162_2_A3145eqn1.jpg)
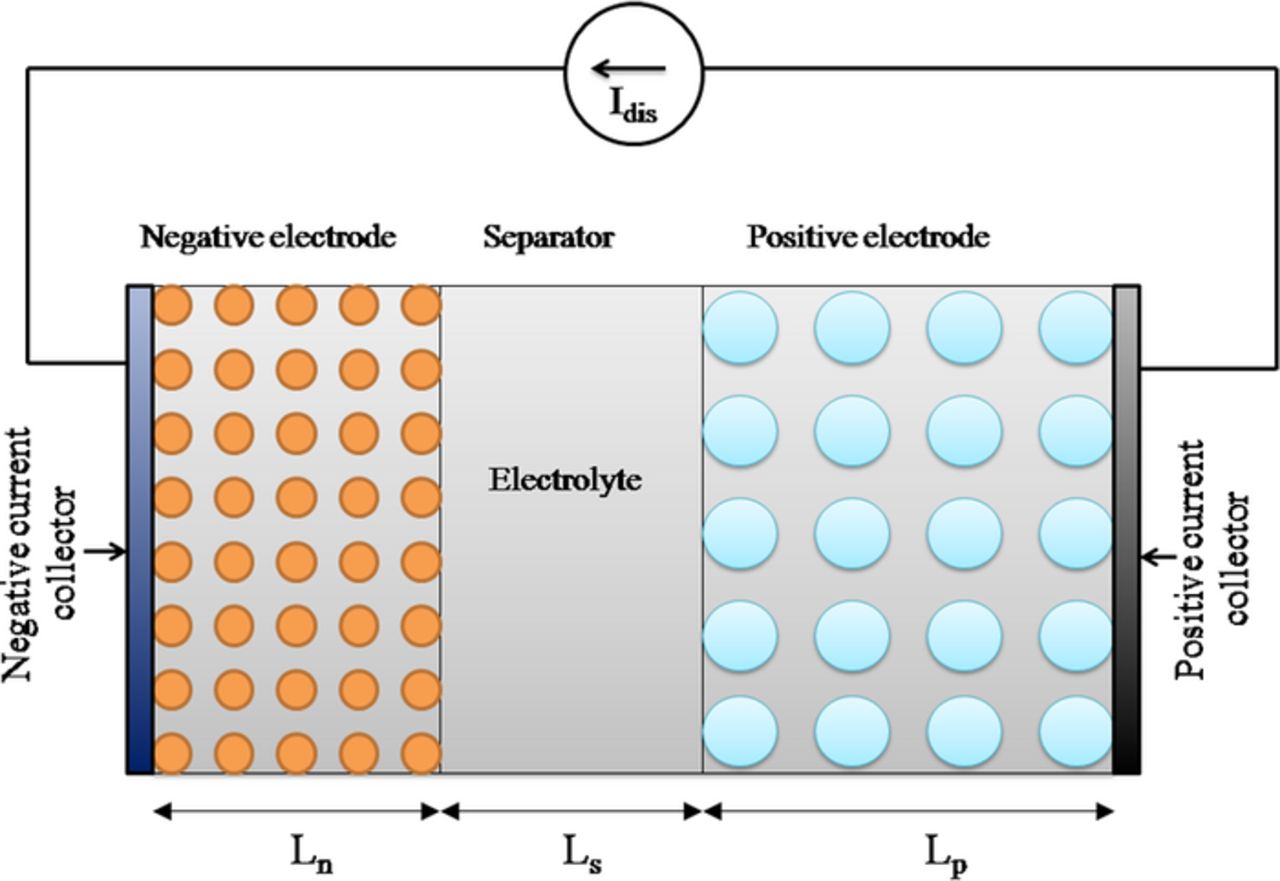
Figure. 1. Schematic representation of the pseudo 2-D model of a Li-ion cell.
The electric charge transport in electrolyte phase is given by
![Equation ([2])](https://content.cld.iop.org/journals/1945-7111/162/2/A3145/revision1/jes_162_2_A3145eqn2.jpg)
Charge transport in the solid phase is given by Ohm's law, as
![Equation ([3])](https://content.cld.iop.org/journals/1945-7111/162/2/A3145/revision1/jes_162_2_A3145eqn3.jpg)
where subscript i stands for negative (n) or positive (p) electrodes. For these electrodes,
![Equation ([4])](https://content.cld.iop.org/journals/1945-7111/162/2/A3145/revision1/jes_162_2_A3145eqn4.jpg)
![Equation ([5])](https://content.cld.iop.org/journals/1945-7111/162/2/A3145/revision1/jes_162_2_A3145eqn5.jpg)
The Li-ion intercalation current density  is given by the Butler-Volmer kinetics
![Equation ([6])](https://content.cld.iop.org/journals/1945-7111/162/2/A3145/revision1/jes_162_2_A3145eqn6.jpg)
Here, ηi represents the overpotential for intercalation reaction and is given by
![Equation ([7])](https://content.cld.iop.org/journals/1945-7111/162/2/A3145/revision1/jes_162_2_A3145eqn7.jpg)
where the SEI film resistance (Rf) is considered to exist only in the negative electrode. The specific interfacial area ai of the solid phase is given by
![Equation ([8])](https://content.cld.iop.org/journals/1945-7111/162/2/A3145/revision1/jes_162_2_A3145eqn8.jpg)
The diffusion of lithium into the spherical particles of each electrode is governed by Fick's second law of diffusion, and is given by
![Equation ([9])](https://content.cld.iop.org/journals/1945-7111/162/2/A3145/revision1/jes_162_2_A3145eqn9.jpg)
Finally, the effective transport properties in the electrochemical model can be correlated to intrinsic properties using the Bruggeman's relation, as
![Equation ([10])](https://content.cld.iop.org/journals/1945-7111/162/2/A3145/revision1/jes_162_2_A3145eqn10.jpg)
![Equation ([11])](https://content.cld.iop.org/journals/1945-7111/162/2/A3145/revision1/jes_162_2_A3145eqn11.jpg)
![Equation ([12])](https://content.cld.iop.org/journals/1945-7111/162/2/A3145/revision1/jes_162_2_A3145eqn12.jpg)
SEI growth model
The governing equations for modeling of the electrolyte decomposition based parasitic reaction have been taken from Ref. 22. Parasitic reaction current density of the of the electrolyte decomposition reaction can be considered to follow Tafel kinetics, i.e.,
![Equation ([13])](https://content.cld.iop.org/journals/1945-7111/162/2/A3145/revision1/jes_162_2_A3145eqn13.jpg)
Here, ηpara is the over-potential for parasitic reaction and is given by
![Equation ([14])](https://content.cld.iop.org/journals/1945-7111/162/2/A3145/revision1/jes_162_2_A3145eqn14.jpg)
The film resistance for the (N + 1)th cycle due to the deposition of the insoluble product produced from the parasitic reaction in 'N' previous cycles can be given by
![Equation ([15])](https://content.cld.iop.org/journals/1945-7111/162/2/A3145/revision1/jes_162_2_A3145eqn15.jpg)
where film resistance during the Nth cycle is
![Equation ([16])](https://content.cld.iop.org/journals/1945-7111/162/2/A3145/revision1/jes_162_2_A3145eqn16.jpg)
The rate of growth of film thickness during the Nth cycle can be calculated using
![Equation ([17])](https://content.cld.iop.org/journals/1945-7111/162/2/A3145/revision1/jes_162_2_A3145eqn17.jpg)
The loss in capacity of the Li-ion cell due to irreversible nature of parasitic reaction can be estimated by summing the parasitic reaction current density over the duration of charging time, and is written as
![Equation ([18])](https://content.cld.iop.org/journals/1945-7111/162/2/A3145/revision1/jes_162_2_A3145eqn18.jpg)
The capacity lost due to the parasitic reaction during charging of the Li-ion cell results in a reduction in the amount of cyclable lithium available. Hence, at the beginning of discharge the initial concentration of the lithium in the solid phase is updated by
![Equation ([19])](https://content.cld.iop.org/journals/1945-7111/162/2/A3145/revision1/jes_162_2_A3145eqn19.jpg)
These set of governing equations can be solved simultaneously for the dependent variables namely ce, cs, ϕe, ϕs and J. The other parameters used in the current simulations are listed in Table I.
Table I. Parameters used in the current simulation of Li-ion cell.
| Symbol (unit) | Anode | Cathode | Separator |
|---|---|---|---|
| L | 100 × 10− 6a | 183 × 10− 6a | 52 × 10− 6a |
| Ds | 3.9 × 10− 14a | 1 × 10− 13a | |
| De | 7.5 × 10− 11a | 7.5 × 10− 11a | 7.5 × 10− 11a |
| r | 12.5 × 10− 6a | 8 × 10− 6a | |
| ɛe | 0.357a | 0.444a | |
| ɛfl | 0.172a | 0.259a | |
| σ | 100a | 3.8a | |
| c0e | 2000a | 2000a | 2000a |
| csmax | 26390a | 22860a | |
| c0s | 14870a | 3900a | |
| k | 1 × 10− 6b | 1 × 10⁻⁶b | |
| αa/αc | 0.5b | 0.5b | |
| Upara | 0.4b | ||
| κf | 3.79 × 10− 7b | ||
| M | 0.1b | ||
| ρ | 2.3 × 10³b | ||
| j0para | 4 × 10− 7c | ||
| Symbol (Unit) | Value | ||
| t+ | 0.363a | ||
| T (K) | 298a | ||
| 1C (A/m2) | 17.5a | ||
| Idch | 1C | ||
| tdch(s) | 1800c | ||
| Ich | –1C | ||
| tch(s) | 1800c | ||
Applied current and relaxation periods
In this study, the effect of cell 'relaxation' over possible improvement in achievable cell capacity has been investigated by incorporating relaxation time durations between adjacent discharge and charge operations. The complete profile of applied current for one cycle is shown in Fig. 2. The applied current cycle consisted of discharge current at 1C rate for a fixed time tdch, followed by a rest duration of trest,1 to relax the gradients of concentration and potential across the cell. Afterwards, a charging current of 1C rate was applied for a fixed time tch to charge the cell, followed by a second rest duration of trest,2. The chosen current profile ensured that the cell capacity remained fixed irrespective of the cycle number, a method different from the experimental conditions followed in Ref. 29 where the discharge duration decreased with increasing cycle number. Similar to trest,1, the second relaxation period also allowed to relax the gradients of concentration and potential generated due to the passage of current in the charging phase.
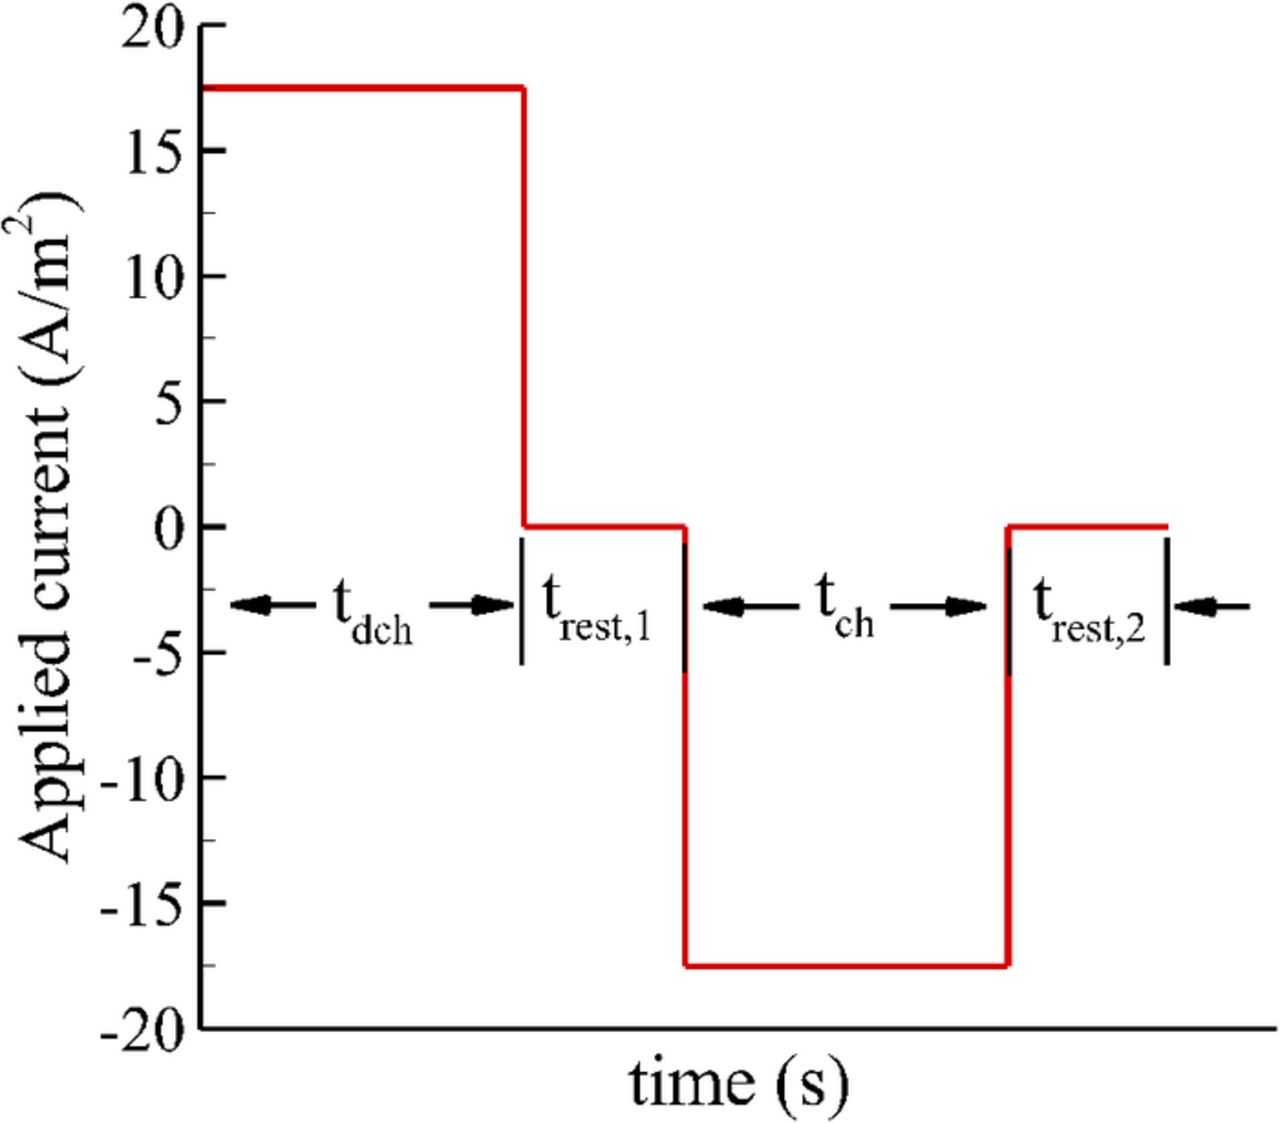
Figure 2. Profile of applied current for 1 cycle.
Results and Discussion
The pseudo-2D model with SEI formation has been used in this work to study the cycling behavior of a LiMn2O4/MCMB cell under constant ampere-hours condition by fixing the current and duration of discharge. Instead of analyzing the effect of cell aging, the focus is on studying the effect of relaxation of gradients generated due to the application of current together with SEI film formation on the negative electrode only. The electrolyte used is 1:2 EC:DMC with an initial LiPF6 concentration of 2M. The discretized governing equations were solved on a one-dimensional domain using COMSOL Multiphysics Toolkit. To check for grid independence of results, the ideal cell pseudo-2D model (i.e. with no SEI formation) was simulated with progressively decreasing element size. Two-noded, one-dimensional elements were used, with a total of 18, 43, 79, and 121 elements spread across the cell domain. Fig. 3 shows the variation in salt concentration across the width of the cell for various grid spacings at a time instant of 1200 sec from the beginning of discharge. The variation in concentration indicates that the prediction using 43, 79 and 121 elements is quantitatively similar. Hence, in the present study 79 elements have been used for discretization of the cell domain to maintain the efficiency and accuracy of simulations performed.
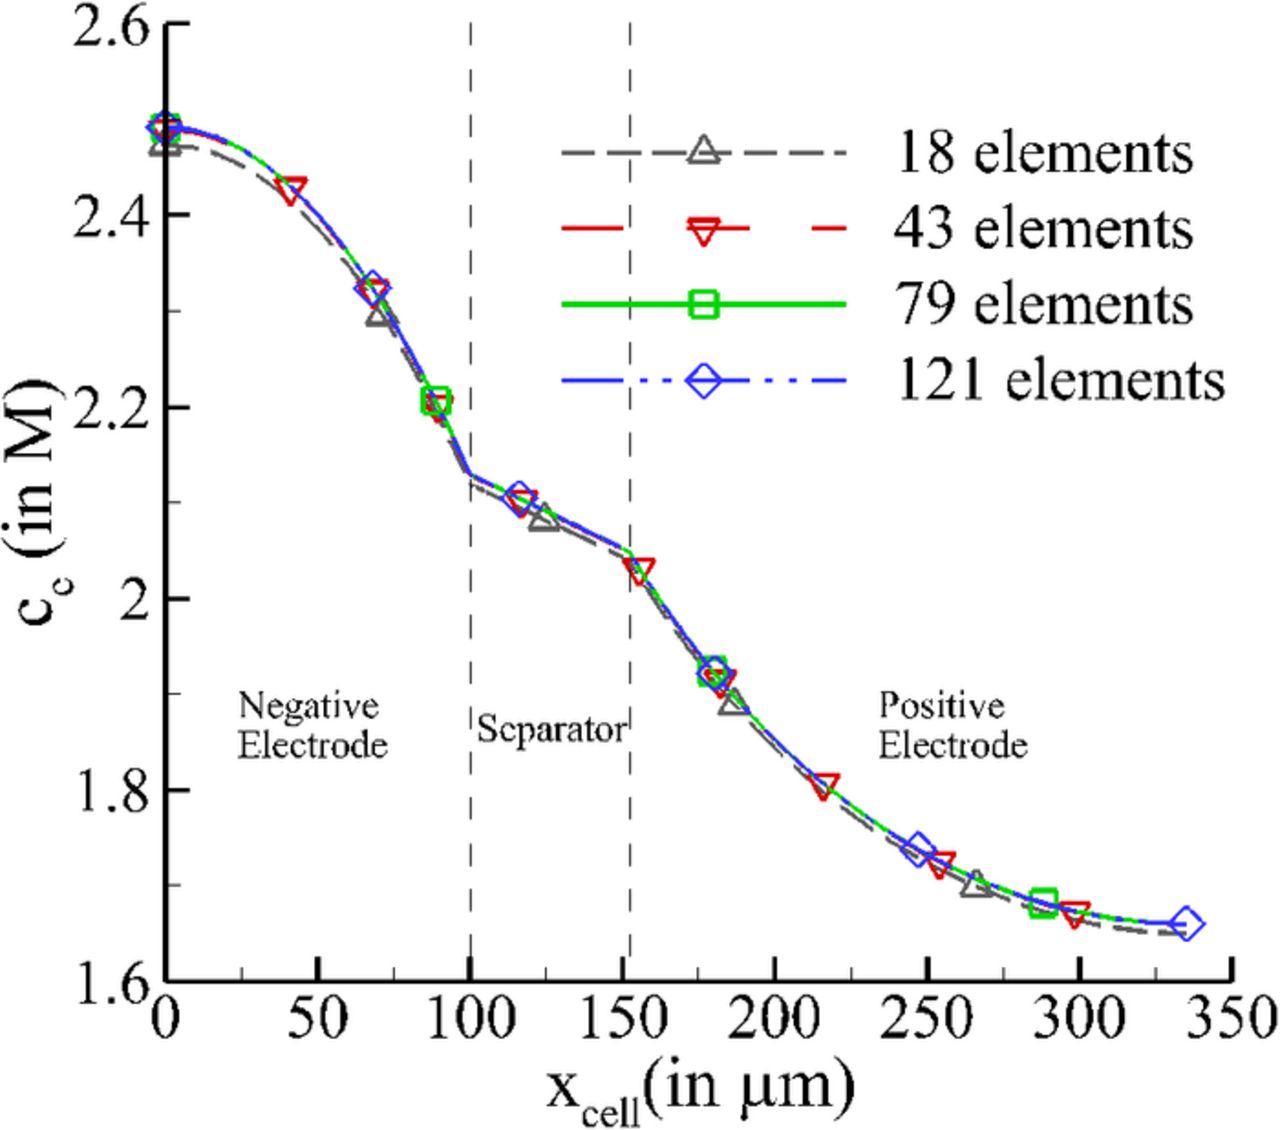
Figure 3. Variation of electrolyte salt concentration across the cell domain for various grid spacing.
Simulation results were also compared against those predicted by the single-particle model32 for the purpose of validating the SEI growth model. An in-house MATLAB code was developed to solve the governing equations that constitute the single particle model. Since the single particle model is best suited for low current simulations, the applied current profile for the model validation consisted of C/2 discharge, relaxation, C/2 charge and relaxation for a duration of 1 hr, 5 mins, 1 hr and 5 mins, respectively. Fig. 4 shows a comparison of predicted cell voltage for the 100th cycle using the two models. The results show good qualitative and quantitative agreement between the two models, thereby validating the SEI growth model. However, the single particle model is a 'zero-dimension' model, i.e., the spatial variation of concentration and potential cannot be captured and the effect of relaxation cannot be studied using it.
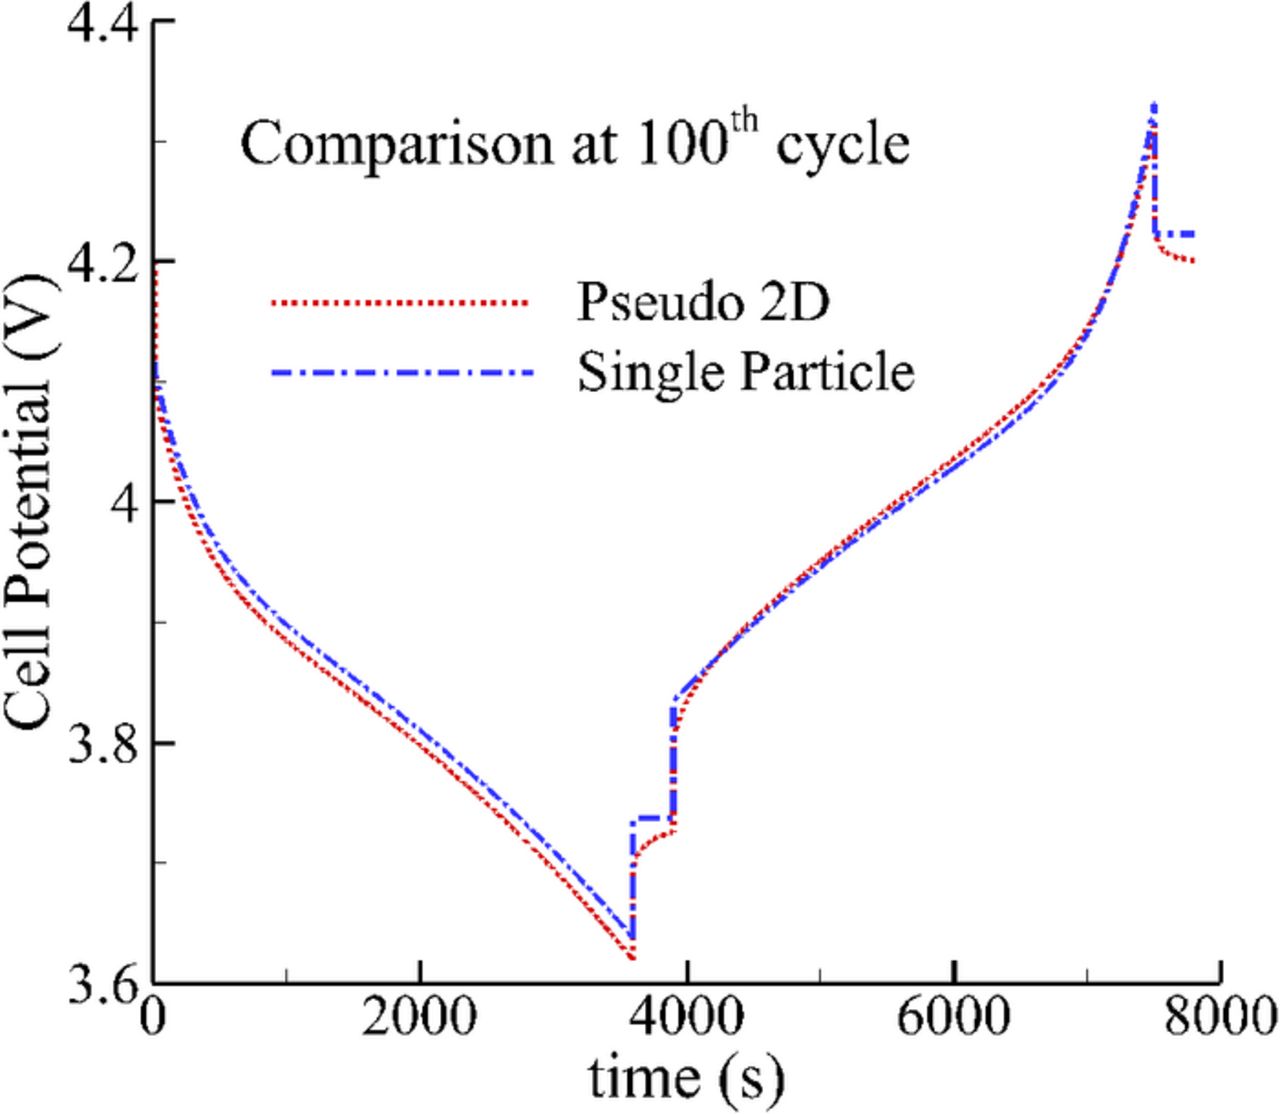
Figure 4. Comparison of the pseudo 2-D model with single particle model for the 100th cycle.
A parametric study on the effect of rest durations over cell voltage and capacity is now presented. It has been earlier suggested that the relaxation period to completely remove gradients of concentration may vary up to 2 hours.29,33 In this study, the two rest durations trest,1 and trest,2 were varied between 5 minutes and 2 hours to quantify the change in cell voltage with increasing number of cycles as a result of film formation over the negative electrode. Simulations have been carried out for trest,1 and trest,2 with values of 5, 15, 30, 60 and 120 minutes. For visual clarity, the results shown here are only for those limited combinations of rest durations that show significant variation in cell performance.
Fig. 5a shows the variation of cell potential during discharge for 100th, 500th and 1000th cycle respectively for different values of trest, 1, keeping trest, 2 = 5min . For the first 100 cycles, the cell voltage has negligible influence from trest, 1. However, as the cell approaches 500th cycle, the voltage achieved at the end of discharge is higher for a higher trest, 1. The difference is even greater at the 1000th cycle. The higher cell potential obtained for a higher trest,1 could be explained by examination of lithium concentration in the solid phase at the end of discharge in the negative electrode. As can be observed from Fig. 5b, the lithium concentration decreases throughout the width of the negative electrode as trest, 1 decreases, indicating a substantial decrease in the amount of cyclable lithium. In other words, a longer relaxation at the end of discharge leads to a higher concentration of lithium in the solid phase resulting in better utilization of the cyclable lithium.
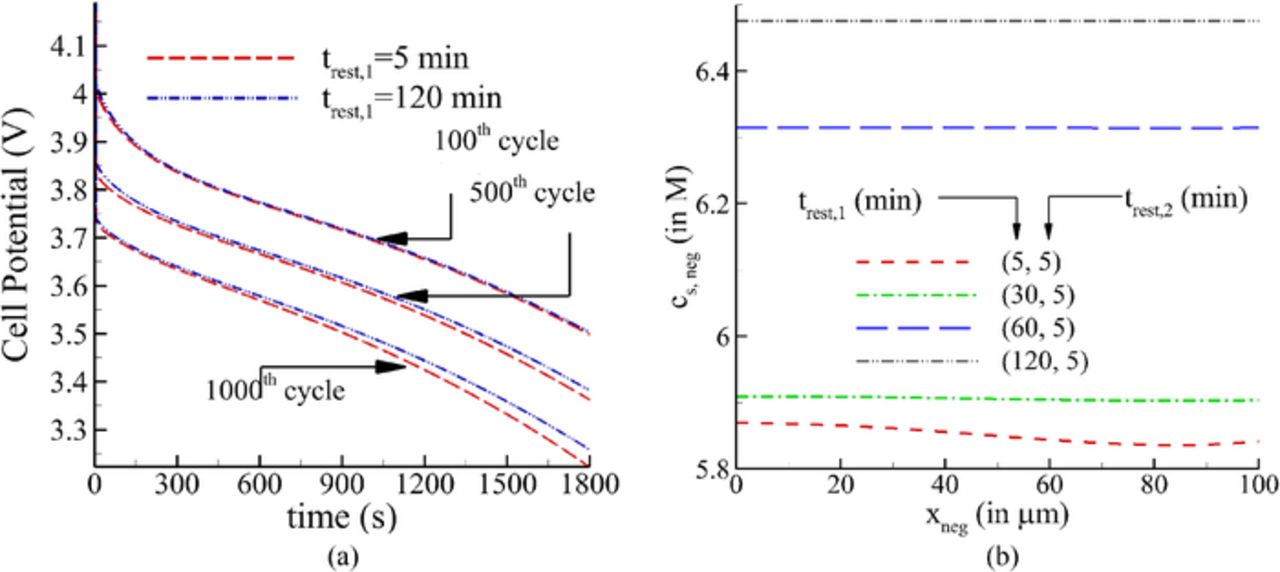
Figure 5. (a) Variation of cell potential with time during discharge for different trest,1 with constant trest,2 (b) Variation of lithium concentration across the negative electrode at the end of relaxation period after discharge.
Fig. 6a shows the cell potential during discharge for 100th, 500th, and 1000th cycle respectively for different values of trest, 2, keeping trest, 1 = 5min . Contrary to the effect of trest, 1, any change in trest, 2 does not seem to affect the cell discharge potential even after cycling the cell for 1000 cycles. As shown in Fig. 6b, an increase in the value of trest, 2 relaxes the marginal concentration gradient produced due to repeated cycling of the cell, but does not affect the lithium concentration in the solid significantly (unlike that shown in Fig. 5b). Hence, the cell potential shows weak sensitivity to trest, 2 even after increased number of cycles.
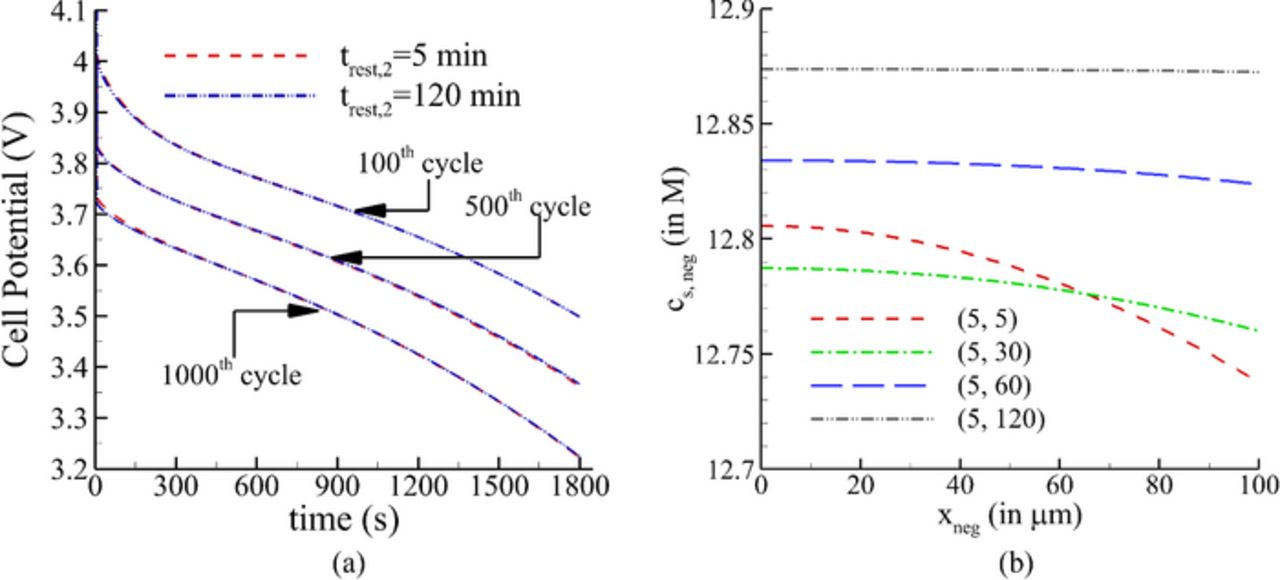
Figure 6. (a) Variation of cell potential with time during discharge for different trest,2 with constant trest,1 (b) Variation of lithium concentration across the negative electrode at the end of relaxation period after charge.
The influence of constant current (CC) versus constant current-constant voltage (CC-CV) charging in terms of normalized capacity for 1st and 1000th cycle have been shown in Fig. 7. The discharge capacity is fixed for both the cases. In this modified cycle with CC-CV charging, the current profile consists of 30 min CC discharge, 2 hours relaxation, CC charge till cell potential reaches the 4.2 V followed by CV charge until the current decays to C/20. As shown in Fig. 7, charging the cell in the CC-CV mode leads to a lower cell potential as compared to CC charging, which is a result of formation of a thicker SEI film in the former case.
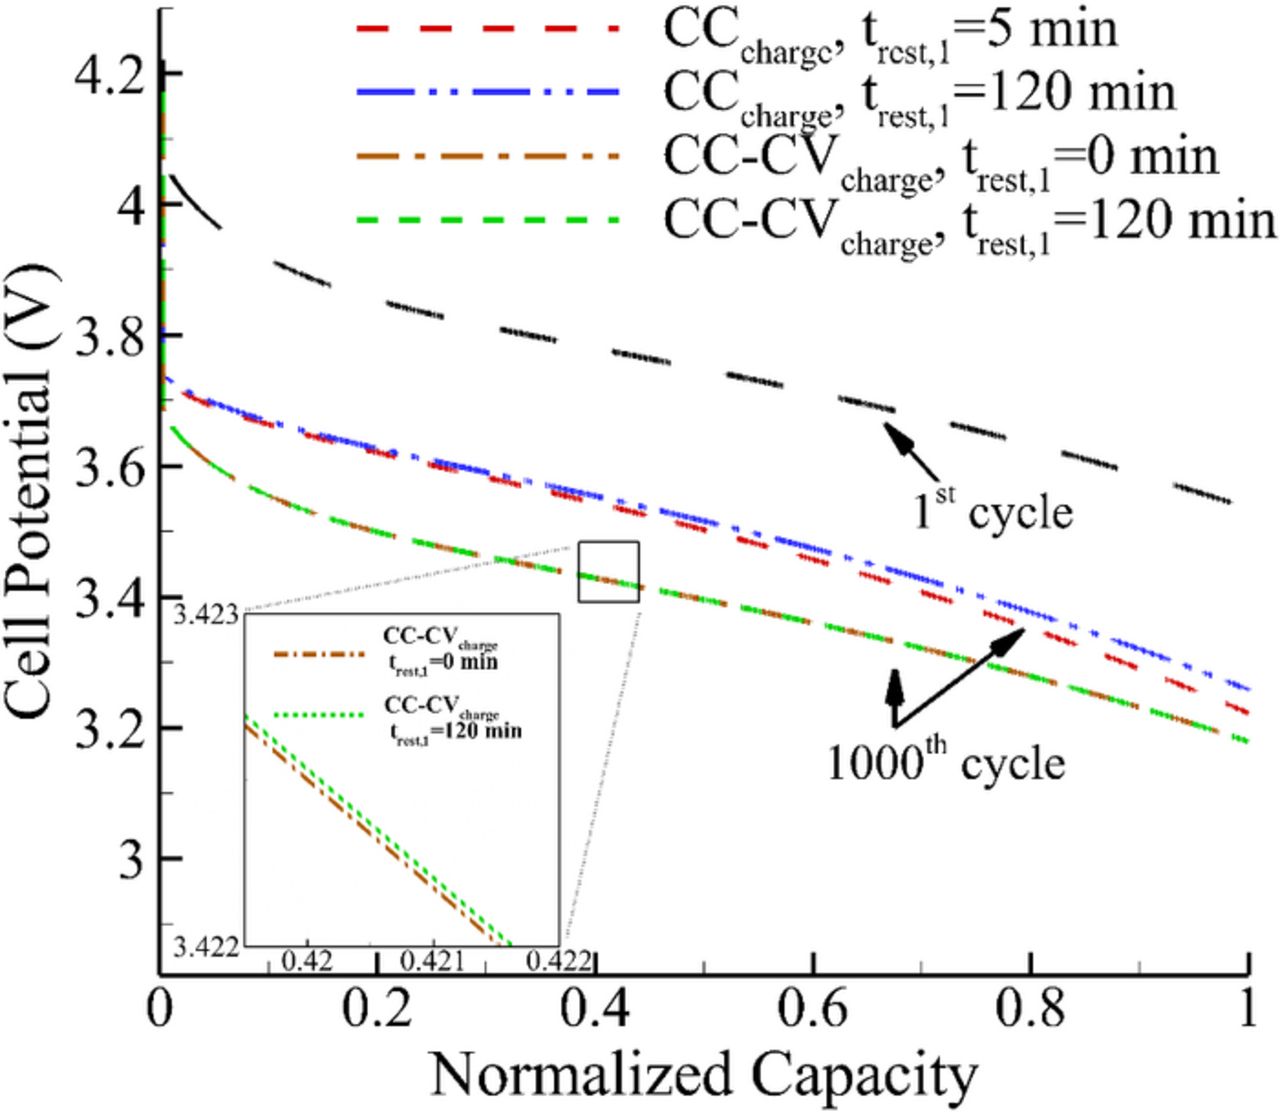
Figure 7. Comparison of effect of relaxation on cell potential with CC and CC-CV charging at 1C rate.
The effect of providing relaxation at the end of discharge (EOD) followed by CC-CV charging was also studied. Two different cycling profiles with 0 and 2 hours as relaxation times at EOD followed by CC charge and CV charge were simulated. As shown in Fig. 7, cycling the cell with CC-CV charging with and without relaxation at EOD does not have any significant influence over the discharge voltage. The rest duration given in case of former only normalizes the gradients generated due to applied current. Because of this mode of charging being used, the cell gets time to sufficiently charge in CC-CV, while it is not the case in the CC charging mode.
The effect of relaxation over different depths of discharge (DOD) at 1C rate for 1000th cycle has been shown in Fig. 8. In this figure, the rated capacities for the three DODs are 5.83, 8.75 and 11.67 Ah/m2 and the comparison is shown in terms of potential versus normalized capacity for the sake of visual clarity. With an increase in DOD, a longer relaxation period leads to a higher voltage with the difference being maximum at EOD as is shown in Fig. 8. The comparison of relaxation effect for 1C and 2C discharge current has been shown in Fig. 9. For 2C rate, the duration of discharge was taken to be half of the 1C rate, thereby ensuring the same discharge capacity of 8.75 Ah/m2 for both cases. With a higher discharge rate, the cell potential drops rapidly on repeated cycling as is shown in Fig 9. Moreover, the effect of relaxation is significant at 2C rate. The potential curve dips to 2.8 V at 800th cycle for 2C rate while in 1C it drops only to 3.3 V even after 1000 cycles.
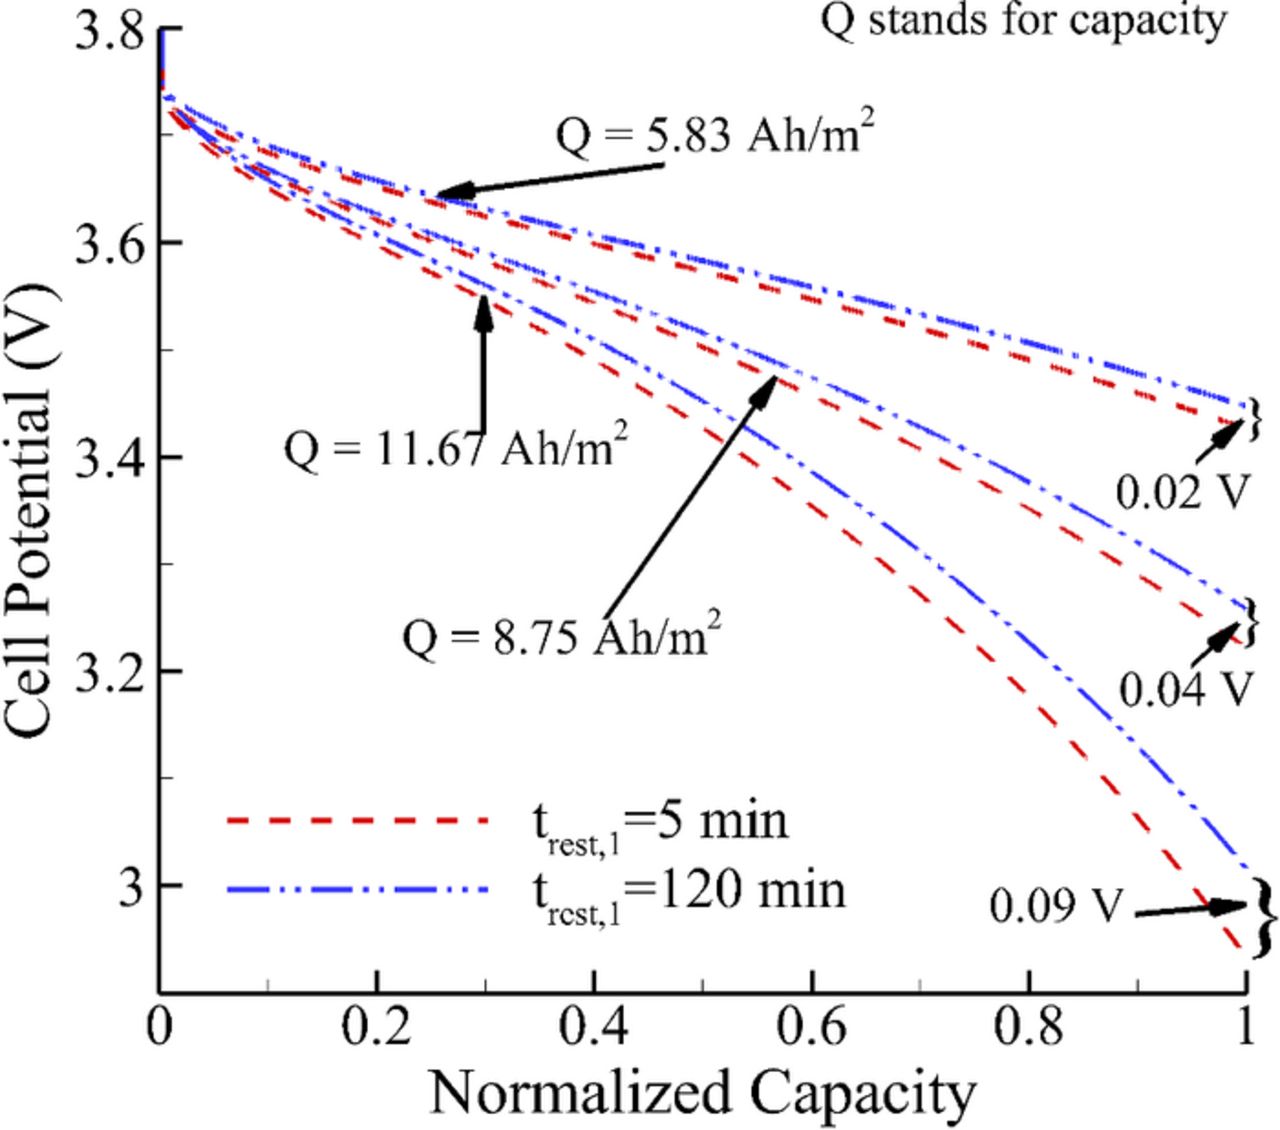
Figure 8. Comparison of the effect of relaxation at EOD on cell potential for different depth of discharge at 1000th cycle with trest,2 = 5 min.

Figure 9. Comparison of effect of relaxation over cell potential for different C rates with trest,2 = 5 min (the potential drop for 2C rate is high due to higher overpotential).
The effect of relaxation on concentration gradients in the positive electrode has also been investigated. The variation of lithium concentration in the positive electrode for various trest, 1 is shown in Fig. 10a, whereas for different trest, 2 is shown in Fig. 10b for the 1000th cycle. At the end of relaxation after discharge (EORD), the concentration of lithium is expected to be higher in the positive electrode and lower in the negative electrode. As shown in Fig. 10a, a large variation in concentration manifests at the end of trest, 1 = 5 min. Parametrically, as trest, 1 increases, the concentration variation reduces significantly and eventually becomes uniform only when relaxation for 2 hours is provided. On the other hand and as shown in Fig. 10b, the concentration at the end of relaxation after charge (EORC) becomes nearly uniform after trest, 2 = 60 min. Any longer relaxation duration at EORC only leads to marginal change in concentration across the positive electrode.
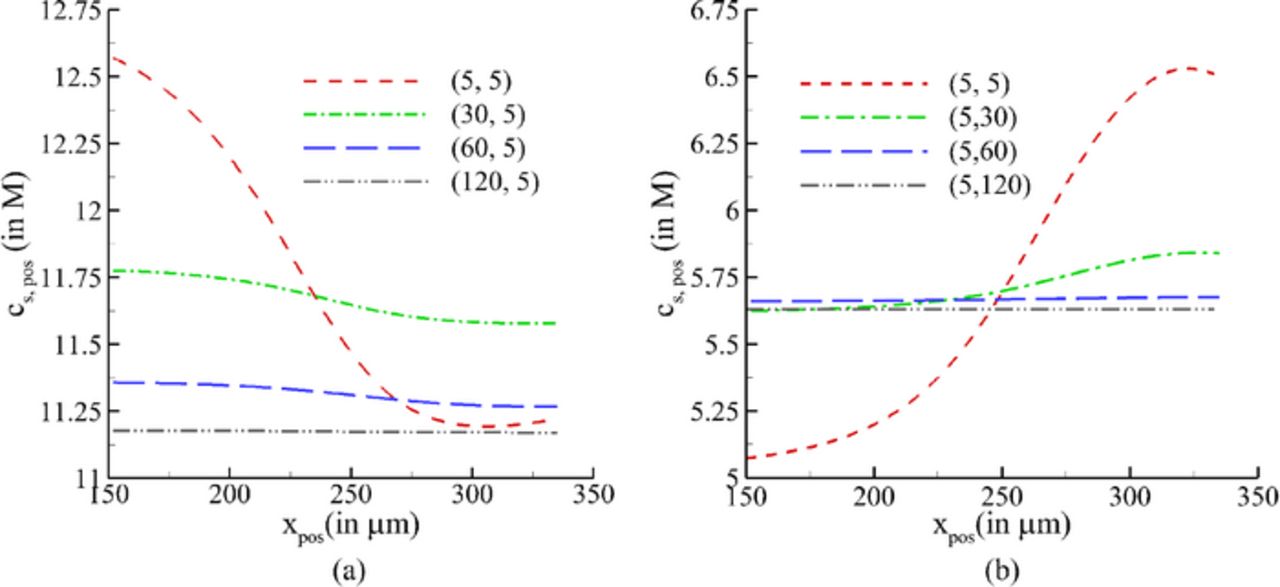
Figure 10. Variation of lithium concentration across the positive electrode (a) at the end of relaxation period after discharge (b) at the end of relaxation period after charge.
To understand the limitations associated with the electrolyte, the effect of relaxations trest, 1 and trest, 2 on the salt concentration was also examined. Figure 11 shows the variation in electrolyte salt concentration across the cell for 1000th cycle for various relaxation durations at EORD (Fig. 11a) and EORC (Fig. 11b), respectively. In these figures, the abscissa is indicative of the negative electrode for 0 ⩽ xcell ⩽ 100 μm, separator for 100 μm ⩽ xcell ⩽ 152 μm and positive electrode for 152 μm ⩽ xcell ⩽ 335 μm. As shown, the relaxation provided to the cell allows the diffusion of Li-ions from higher concentration to lower concentration in the electrolyte. This movement of ions continues until the gradient is normalized significantly; however, unlike the solid electrodes, this does take any more than 30 min. as is apparent from Fig. 11. Providing a longer relaxation alleviates all the gradients resulting in a higher cell discharge potential, due to better mobility of Li-ion in the electrolyte after reversing the applied current, and minimizes the rate of SEI side reaction as well. These side reactions consume the cyclable lithium and produce insoluble products that deposit over the pores of the negative electrode and decrease the cell potential. A longer relaxation will also reduce heat that will be generated due to continuous cycling and may cause high thermal stresses and break-down of cell electrodes, and will be a part of a future study.
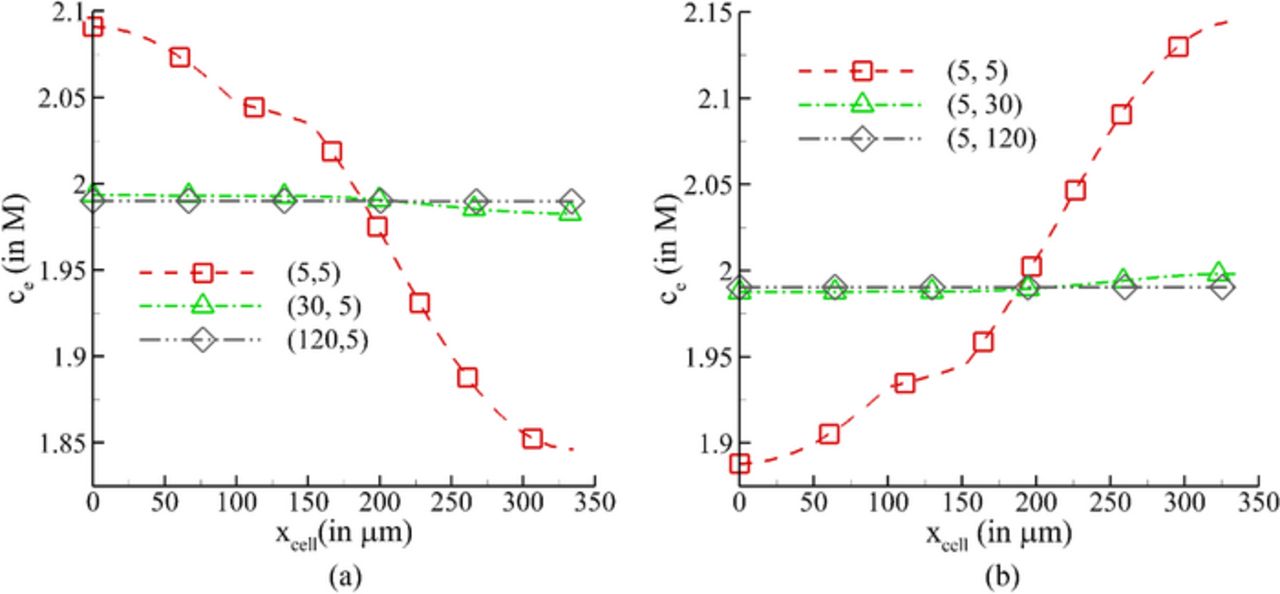
Figure 11. Variation of electrolyte salt concentration across the cell domain (a) at the end of relaxation period after discharge (b) at the end of relaxation period after charge.
The diffusion time scale in the solid electrodes (which can be written as  ) suggests that a substantial amount of time is required to overcome the diffusional limitations in the solid phase. To illustrate, lithium concentration as a function of radius in negative electrode particles at two different locations corresponding to current collector-electrode and electrode-separator interfaces is shown in Figs. 12a and 12b, respectively. Also shown in Fig. 12c is the variation in concentration at the surface and center of particles across the width of the negative electrode. Similar plots for concentration variation in the positive electrode are shown in Fig. 13.
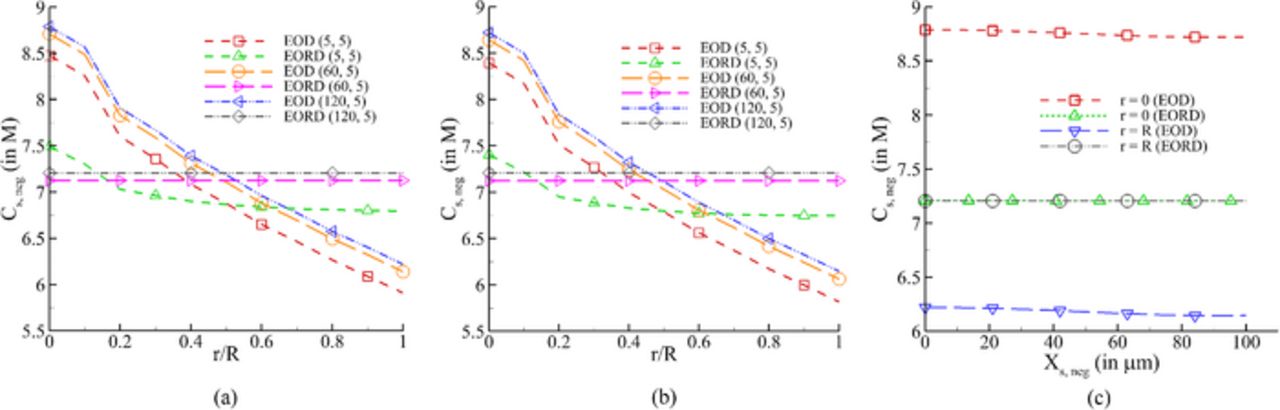
Figure 12. Lithium concentration in anode at EOD (end of discharge) and EORD (end of relaxation after discharge of 500th cycle (a) across the particle radius at current collector/anode interface (b) at anode/separator interface (c) across the negative electrode for trest, 1 = 120min and trest, 2 = 5 min.
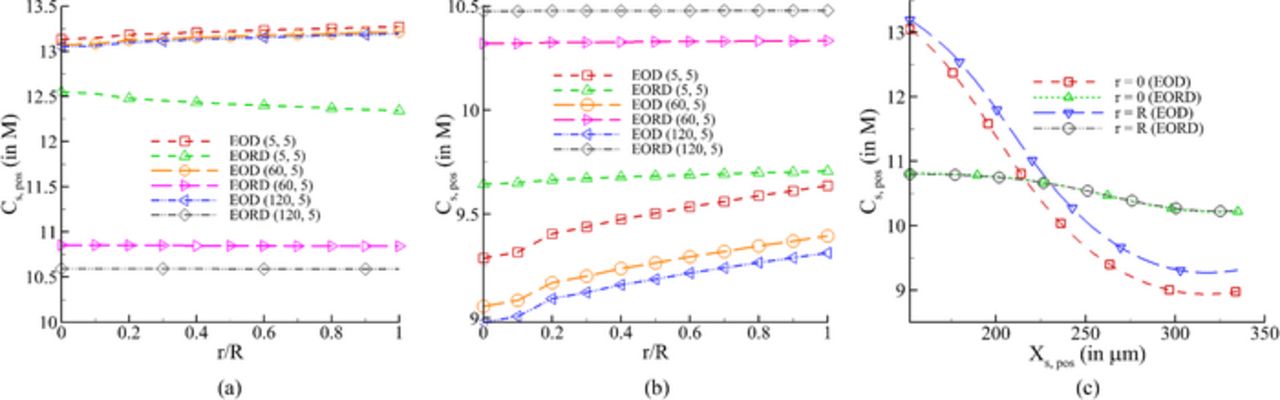
Figure 13. Lithium concentration in cathode EOD (end of discharge) and EORD (end of relaxation after discharge for 500th cycle (a) across the particle radius at separator/cathode interface (b) at cathode/current collector interface (c) across the positive electrode for trest, 1 = 120 min and trest, 2 = 5 min.
Comparing the profiles at EOD in the particles of the two electrodes, it can be observed that for a higher trest,1 the concentration is consistently higher for the negative electrode at both locations (Figs. 12a and 12b) and lower for the positive electrode at electrode-current collector interface (Fig. 13b). At the separator-positive electrode interface (Fig. 13a), the concentration in the particles at EOD is weakly dependent on trest,1. As is expected, the concentration of lithium is higher at the center of the particle than the surface for the negative electrode, and vice-versa for the positive electrode at EOD. With relaxation, lithium diffuses from higher to lower concentration regions in particles to minimize these gradients as shown in Figs. 12 and 13. Similarly, the gradients of concentration are also relaxed by diffusion across the width of each electrode, as shown in Figs. 12c and 13c. The advantage of providing a relaxation phase subsequent to discharging and prior to charging the cell can be looked at from the point of view of impending deintercalation from the positive electrode. The application of charging current will first start deintercalation reaction at the current collector-positive electrode interface. As shown in Fig. 13c, the concentration at EOD near this interface is lower than that at the separator-positive electrode interface due to which the electrode is expected to run out of lithium at the former location sooner (see Fig. 13c). Thus, a uniform concentration of lithium is desired for longer operation, which can be achieved by the application of a relaxation period between discharging and charging operations. Contrary to this, providing a rest period between charge and discharge is not as critical due to almost uniform concentration across the negative electrode (see Fig. 12c).
Further, a large gradient in concentration is exhibited across the width of the positive electrode at EOD. Presence of a large variation in concentration across the electrode may lead to generation of a spatially varying diffusion-induced stress in solid particles. This suggests that resting the cell after discharge will play a major role in reducing fracture and loss of electrical contact of particles in the positive electrode.
Lastly, the variation of SEI film thickness across the negative electrode for different relaxations at EORD of 1000th cycle is shown in Fig. 14. The SEI film is formed due a side reaction over the anode and is the outcome of extremely reactive lithium combining with the electrolyte to produce insoluble products such as Li2CO3. This product deposits over the anode and results in the blockage of the pores of the negative electrode, reducing the active surface area for further intercalation/deintercalation reaction of Li-ions. Initially, the SEI film has zero thickness which increases due to accumulation of the insoluble products as the cycle number increases As stated that the applied current is fixed for charge and discharge, the average lithium concentration in the negative electrode at EORD and EORC was recorded to be 6.48 and 13.40 M for relaxation of 2 hours while 5.85 and 12.78 M for 5 minutes, respectively, after discharging for 1000 cycles. Similarly, at EORD and EORC it was 11.17 and 5.16 M while 11.71 and 5.71 M for relaxation of 2 hours and 5 minutes, respectively, in the positive electrode. From these values and also from Figs. 5, 6 and 10, it can be inferred that the concentration in the negative electrode increases with an increase in the relaxation period at the end of both charge and discharge operations. However, this increased lithium concentration in the negative electrode will provide higher opportunity of side reactions and hence a thicker SEI film is observed to be formed.

Figure 14. Variation of film thickness across the negative electrode for various relaxation periods after 1000 cycles.
Conclusions
In this work, the effect of relaxation between successive charge and discharge operations has been investigated. Using a mathematical model of SEI formation in the carbon electrode and a parametric study by varying zero-current durations, it was shown that rest durations provided to a Li-ion cell after every discharge and charge normalize the gradients of concentration and potential in the electrolyte and electrodes. A sufficiently long relaxation to the cell at the end of discharge was shown to result in (a) a higher concentration of lithium in the solid matrix of the negative electrode and (b) a lower concentration of lithium in the positive electrode, both leading to a higher cell potential during the discharge phase of the subsequent cycle. Charging the cell following a relaxation period greater than one hour at the end of discharge resulted in a better utilization of cyclable lithium. Lastly, a longer relaxation at the end of discharge was shown to result in the formation of a thicker solid-electrolyte interface film due to the presence of higher lithium concentration in the negative electrode. This leads to higher resistance to lithium diffusion and a larger potential drop across the film.
Although not considered in this analysis, a large gradient in concentration across the width of the positive electrode at end of discharge suggested the possibility of spatially varying diffusion-induced stress in solid particles. Qualitatively, these stresses can be alleviated by resting the cell after discharge thereby reducing the incidences of fracture and loss of electrical contact of particles in the positive electrode. This phenomenon together with heat generation and their effect on cell capacity and potential due to continuous cycling will be part of a forthcoming research.
Acknowledgment
The authors acknowledge the financial support received from the Department of Science and Technology (DST), Government of India under SERC/ET-0129/2012. Assistance of Raja Ram in conducting the single particle simulations is also acknowledged.
![Equation ([A1])](https://content.cld.iop.org/journals/1945-7111/162/2/A3145/revision1/jes_162_2_A3145eqn20.jpg)
![Equation ([A2])](https://content.cld.iop.org/journals/1945-7111/162/2/A3145/revision1/jes_162_2_A3145eqn21.jpg)
![Equation ([A3])](https://content.cld.iop.org/journals/1945-7111/162/2/A3145/revision1/jes_162_2_A3145eqn22.jpg)