Abstract
Lead lithium titanate (PbLi2Ti6O14) was synthesized by combustion route restricting the annealing at 900°C to just 1 minute. Rietveld analysis confirmed orthorhombic (Cmca) product phase with an average particle size ∼200 nm and surface area of 2 m2/g forming secondary porous particles. From bond valence site energy (BVSE) calculations, 1 D ionic conduction was found along c axis with low activation energy (0.23 eV). AC conductivity analysis revealed a bulk conductivity of 2 × 10⁻⁷ S.cm−1 at room temperature and 1 × 10⁻⁴ S.cm−1 at 200°C with a switch from extrinsic 1D to intrinsic 2D mechanism at 150°C. Li+ diffusion coefficient was calculated to be in the order of 10−12 cm2.s−1. More than 4 lithium (per f.u.) could be reversibly (de)inserted delivering capacity over 160 mAh/g with good cycling retention over 1000 cycles. With a feasible rapid synthesis, good diffusional and electrochemical behavior especially high rate capability, PbLi2Ti6O14 can act as a safe 1.35 V anode for rechargeable Li-ion batteries.
Export citation and abstract BibTeX RIS

This is an open access article distributed under the terms of the Creative Commons Attribution 4.0 License (CC BY, http://creativecommons.org/licenses/by/4.0/), which permits unrestricted reuse of the work in any medium, provided the original work is properly cited.
A 4-fold surge in oil prices in 1973 marked the first energy crisis releasing a wave of urgency for alternate energy generation and its storage in chemical form.1,2 Carbon as amorphous coal may be a polluting energy source, but in form of layered graphite, it is the cheapest and most widely used material for alternate energy storage (or power source) in rechargeable lithium-ion batteries (LIBs). Made by SONY back in the 1990s, these batteries, the most promising energy storage system used today to power portable electronic devices, utilize a simple lithium intercalation reaction3 between graphite anode4 and LiCoO2 cathode.5 Graphite offers a large theoretical capacity (ca. 372 mAh/g) consistently over many cycles with small polarization at extremely low voltage (ca. 0.2 V). However, graphite suffers from issues like large irreversible capacity loss in the first cycle due to solid electrolyte interphase (SEI) formation (below 0.8V),6,7 lithium plating from dendrites during overcharge8 (or at high currents)9 and very low operating voltage. These factors limit the safe usage of batteries having graphite anodes for mobile applications requiring fast charging such as power tool, start-stop application and regenerative braking.
To this end, a large number of safe Ti-based materials10–12 have been investigated leading to successful commercialization of spinel Li4Ti5O12 (LTO) anode13 with high operating voltage and low volume change. Pursuing Ti-based materials, a new family of titanate anodes MLi2Ti6O14 (M = 2Na, Sr, Ba, Pb)14–16 has recently emerged having an orthorhombic (Cmca) structure built from layers of edge and corner sharing TiO6 octahedra stacked along (100) axis hosting empty sites for lithium (de)insertion. MLi2Ti6O14 display an edge over LTO with a higher packing density17 (volumetric energy density),18 lower flat working potential (1.3–1.45 V) and area specific impedance.15 MLi2Ti6O14 has a theoretical capacity as high as 220–282 mAh/g for six electron (lithium) transfer. Practically, Na2Li2Ti6O14 allow (de)insertion of 2 lithium (95 mAh/g) in vacant sites (4a, 4b and 8c) delivering practical capacities in the range 80–90 mAh/g.15,19 For M = Ba, Pb and Sr, at lower potentials, in addition to the two lithiums, one or more Li+ can occupy a big 11 coordinated vacant site (8f which is occupied in case of M = 2Na), resulting in the best reversible transfer of around 4 Li+ (150 mAh/g) at slow C/40 rate in case of M = Ba, Sr14 while favorably at much higher C/2 rate for M = Pb.16
The crystal structure report on MLi2Ti6O14 series by Koseva (2005) had PbLi2Ti6O14 as one of the isostructural titanates.20 Following this and initial detection of battery performance by Belharouak and Amine in MLi2Ti6O14 (M = 2Na, Sr and Ba) system,15 Shu group (2016) first reported the electrochemical activity of PbLi2Ti6O14 as a high rate long-life LIB anode showing capacity above 150 mAh/g at safe operating voltage of 1.35V (vs Li).16 They have explored the effects of temperature dependant process optimization, solid solution with BaLi2Ti6O14 and doping on electrochemical performance.21–24 Feng et al studied the electrochemical performance of PbLi2Ti6O14 synthesized using a rheological phase reaction method.25 All these protocols involve expensive precursors and use of stable TiO2 that needs prolonged calcination (10–16 h), which calls for alternate energy conserving synthesis methods.
Here, we report fast solution combustion synthesis of PbLi2Ti6O14 at 900°C with the shortest calcination time of just 1 min excluding the furnace ramp and cool times at usual rates. Trials with different fuels have been discussed. For the first time, bulk conductivity and Li+ migration pathways in PbLi2Ti6O14 titanate have been investigated synergising experimental ionic conductivity measurement with computational bond valence site energy calculations. The as-synthesized lead lithium titanate offers feasible Li+ migration pathways suitable for battery anode displaying reversible capacity over 160 mAh/g (vs Li). Additionally, we have observed mild Na+ (de)intercalation in PbLi2Ti6O14 for the first time. With its open structure, one-dimensional diffusion pathways with moderate energy barrier and intermediate voltage safe operation at high C rates, combustion made PbLi2Ti6O14 presents a viable candidate for rechargeable LIB anode.
Materials and Methods
Synthesis
Low-cost metal nitrates as oxidizers (O) and glycine as fuel (F) were used to prepare PbLi2Ti6O14 via solution combustion method. The key oxidizer, titanyl nitrate TiO(NO3)2, is commercially unavailable as it is unstable and quickly transforms to stable TiO2 on exposure to ambient atmosphere. Hence, TiO(NO3)2 was freshly prepared26 by adding 3 ml (6 moles) of titanium isopropoxide (C12H28O4Ti, Sigma, 97%) to 9 ml isopropyl alcohol (Merck, analytical grade 99.7%) under the ice-cold condition and constant stirring. A clear titanyl nitrate solution was obtained after adding 3 ml of 1:1 v/v diluted HNO3 (Merck, 69%). Stoichiometric amounts of other oxidizers Pb(NO3)2 (Sigma, >99%), LiNO3 (Sigma, 99%) and fuel glycine (NH2CH2COOH, Merck, 99.7%) were added based on 1:1 O/F ratio after dissolving them in the least amount of distilled water. The resulting clear solution was heated at 140°C to drive out excess solvent and was transferred to a hot plate maintained at 500°C where it gradually thickened. As a centrally ignited flame spread to the periphery of the bowl, the thick golden precursor solution rapidly transformed to a fluffy white intermediate complex. This powder was mildly ground and annealed at temperature of 700–900°C for 1 min to 8 h in a muffle furnace to yield the target titanate product. This process was repeated with alternate fuels such as urea (NH2CONH2, SDFCL, >99%), ascorbic acid (C6H8O6, SDFCL, 99.8%), citric acid (C6H8O7, SDFCL, 99%) and sucrose (C12H22O11, SDFCL, >99%). To study the effect of mechanical milling, the as-synthesized lead lithium titanate was optionally wet milled in ethanol media for an hour using stainless steel milling media and container.
Characterization
Phase identification of pristine and electrochemically cycled samples was performed using powder X-ray diffraction patterns (2θ range = 10 – 50°, step size = 0.026°s−1) acquired with a PANalytical Empyrean X-ray diffractometer having a Cu-Kα source (λ1 = 1.54 Å, V/I = 40 kV/30 mA). GSAS program having an EXPGUI graphical user interface was used for Rietveld refinement.27–29 VESTA software was used for structural illustration.30 Pristine white poorly conducting titanate powder was gold coated (Quorum Q150R ES) and was imaged with a Carl Zeiss ULTRA55 FESEM equipped with EDS system (Oxford Instruments) for elemental X-ray analysis. The structure and morphology (selected area diffraction SAED, high-resolution HRTEM) was further analyzed with an FEI Tecnai F30 STwin transmission electron microscope (TEM) operating at 200 kV. For TEM, the powder sample was dispersed in ethanol and was deposited on a carbon-copper grid (EMS) with intermediate drying under IR lamp. Brunauer-Emmett-Teller (BET) surface area analysis was performed using surface adsorption of N2 (at 77 K) with a Belsorp Max unit.
Computational study
Bond valence site energy method31,32 was used to study lithium-ion occupancy and their migration barrier in vacant sites of PbLi2Ti6O14. The regions of low bond valence site energy that connect to form migration pathways for mobile lithium ions were identified by EBVSE(Li). As demonstrated by Adam et al., by rewriting bond valence into a Morse-type interaction potential between the reference cation Li+ and anion X, the mismatch |ΔV| of bond valence sLi − X = exp [(R0, Li − X − RLi − X)/bLi − X] can be scaled down to absolute energies.
![Equation ([1])](https://content.cld.iop.org/journals/1945-7111/166/3/A5122/revision1/d0001.gif)
The required parameters were gathered from the softBV database.33 Structure with refined atomic coordinates from the experiment was used for calculations. Grids having resolution of (0.1) Å3 was used to surround the structure model while calculating EBVSE(Li).
AC conductivity
Temperature-dependent ionic conductivity was tested using AC impedance spectroscopy. 3 g of combustion synthesized pristine PbLi2Ti6O14, hand mixed with few drops of 1% polyvinyl alcohol binder, was pressed to multiple (4) pellets (Φ = 12 mm, w = 1.5 mm) by applying 20 kN load mounting to 1.8 Ton/cm2 uniaxial pressure. These pellets were densified by sintering at 800°C for 20 h (in air). The relative density (ρexp/ρtrue) was determined by Archimedes principle in Xylene (Sigma, R.D. 0.865 g/cc) medium. Silver paste (Siltech Corporation) diluted with n-butyl acetate was brush coated on both sides serving as an electronic conductor while blocking the ionic exchange. AC impedance analysis was performed with an Agilent 4194 A HP impedance analyzer in the frequency range of 40 Hz to 100 MHz in the temperature range of RT ∼ 210°C. AC conductivity and complex impedance values were calculated from the recorded capacitance and loss values. ZView impedance data analyzer software was used to analyze the impedance spectra in the range of lowest frequency where the noise was manageable to 10 MHz.
Electrochemical study
Electrochemical battery performance was checked with working electrodes prepared from a slurry of vacuum dried PbLi2Ti6O14 active material, polyvinylidene fluoride (PVDF) binder and Super P carbon black mixed in 100 mg batches with two formulations (80:10:10, 70:20:10 w/w). A minimal amount of N-methyl-2-pyrrolidone (Sigma, >99%) was used as a solvent. This slurry was uniformly drop cast on the copper current collector (Φ = 12 mm or 17 mm) and were dried in vacuum to remove the NMP solvent. The copper foils were polished with 400 grit SiC emery sheet, etched with dilute nitric acid and cleaned with acetone before coating the working electrode. Typical active material loading was ∼3 mg cm−2. For battery testing, CR2032-type coin cells were assembled inside an Ar-filled glove box (MBraun LabStar GmbH, O2 and H2O less than 0.5 ppm) to avoid any moisture contamination. Coated disks and Li metal foils (Sigma Aldrich) were used as the working and counter electrode respectively, separated by a sheet of Whatman GF/C glass fiber separator (Φ = 16mm). 100 μl of 1M LiPF6 dissolved in 1:1:3 v/v % of ethylene carbonate/propylene carbonate/dimethyl carbonate (EC/PC/DMC) was used as electrolyte (Chameleon Reagent). Sodium half cells were assembled by using Na metal foil as a counter electrode and 1M NaPF6 dissolved in 1:1 v/v% of ethylene carbonate/diethyl carbonate (EC: DEC) acting as electrolyte. These coin cells were subjected to galvanostatic cycling at different rates (C/10 ∼ 3C) in the potential window of 0.5–2 V and 1–2 V (at 25°C) with multi-channel BCS-805/810 (Bio-Logic SAS, France) battery cycler. The capacity (C) and current (C-rate) values were calculated from the theoretical capacity of PbLi2Ti6O14 (220 mAh/g) based on six electron/lithium transfer.
Ex-situ X-ray diffraction was used to study the change in the structure of PbLi2Ti6O14 in the 1st cycle at different states of charge (1.35 V discharge and charge, 1 V discharge and 2 V charge). Complete formation of intermediate phases was ensured by setting current limit to half the cycling currents and time limit to 2 hours, whichever struck earlier. Swagelok type cells were assembled. Post cycling, they were opened inside the glove box. Electrodes were washed in propylene carbonate and dried for 12 h before taking the diffraction patterns.
Results and Discussion
Synthesis, Structure, and morphology
PbLi2Ti6O14 has been synthesized in past using solid state16,21 and rheological phase reaction top-down methods25 involving excess Li and stable TiO2 precursor that require prolonged ball milling and annealing for 10–15 h. In contrast, solution combustion was successfully employed as a swift energy-savvy route. Using stoichiometric Li precursor and pre-calcination temperature of 500°C, PbLi2Ti6O14 was synthesized via combustion route by sequential high throughput screening of fuel (ascorbic acid, citric acid, glycine, sucrose, urea), calcination temperature (700–900°C) and annealing duration (1 min to 8 h). Independent of fuels used, the as-prepared 500°C pre-calcined sample and those calcined at 700°C for 8 h did not form the product. At 800°C, the product formed with impurities, which were higher for ascorbic acid and citric acid even at longest (8 h) annealing duration. Phase pure product could be obtained at 900°C for all fuels and annealing duration. The product formed using glycine fuel and rapid 1 minute annealing was used for further studies emphasizing the short annealing time. Glycine was chosen as it gave a clear combustion flame and most voluminous flaky product indicative of high porosity and superior crystallinity.
The minute-made combustion synthesized PbLi2Ti6O14 was found to be phase pure without impurity or unreacted precursor from Rietveld refinement (χ2 = 6.05%, R factor = 7.59%) (Fig. 1). The crystal structure was orthorhombic (symmetry: Cmca) with lattice parameters a = 16.645(4) Å, b = 11.125(7) Å and c = 11.495(8) Å similar to the earlier reports. Calculated theoretical density (4.57 g/cm3) is the highest among the MLi2Ti6O14 family (with Sr = 3.85 g/cm3, Ba = 4.06 g/cm3) all of which are higher than Li4Ti5O12 (1 g/cm3). It ensures high tap density leading favorably to high volumetric energy density. The three-dimensional PbLi2Ti6O14 skeleton is made from sheets of Ti2O7 double layers in bc plane glued along a axis with 11 oxygen coordinated Pb atoms. Sets of edge-sharing TiO6 blocks cross-stitch c directed edge-shared TiO6 rutile chains building these double layers. Within the double layers, partly lithium filled zig-zag tunnels exist along c axis running parallel to the rutile chains. The stability of the refined structure was gauged from its GII (global instability index), which was found sensitive to the atomic position and lattice parameter variation, while being hostile to changes in the isotropic displacement parameters of atoms and unit cell volume (that scales lattice parameters uniformly). Lithium atom and the occupancy of atoms were not refined. Only O7 and O8 positions were refined as a change in position of other O atoms (esp. O1, O2 and O3) triggered a high GII. The bond valence sums of refined atoms gave a GII value of 0.085(1) in line with the value of 0.099(1) for single crystal literature data. It validates a stable chemical environment of the refined structural model required later for migration pathway analysis. Table I sums up the atomic coordinates, crystallographic lattice parameters, and bond valence sum values obtained from Rietveld refinement. A low bond valence value for Pb (1.79) similar to value (1.72) reported from single crystal study,20 indicates no residual strain at this site unlike compressive strain at Ba site in case of BaLi2Ti6O14.
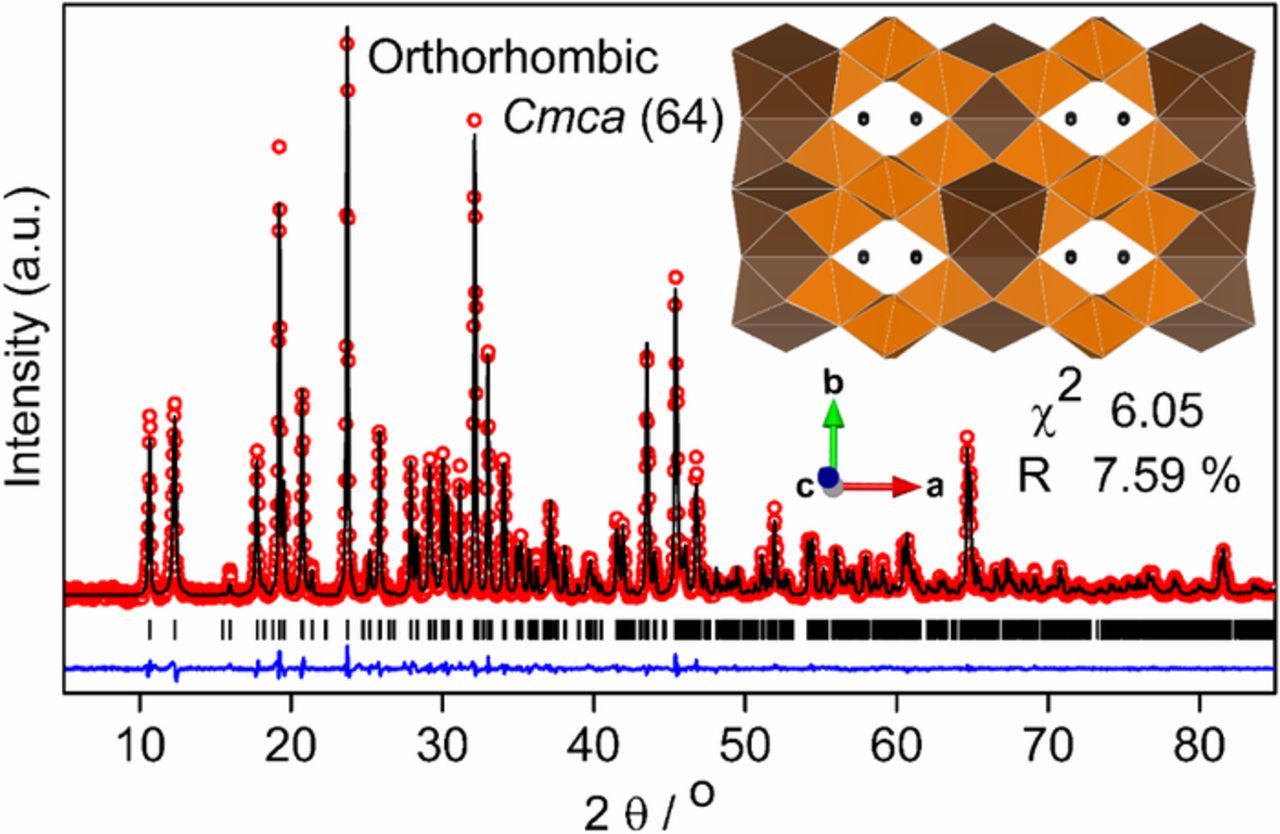
Figure 1. Rietveld refinement of XRD (Cu Kα) pattern of PbLi2Ti6O14 formed by solution combustion synthesis. The experimental data points (red hollow dots), calculated pattern (black line), their difference (blue line) and Bragg reflections of the orthorhombic Cmca phase (black bars) are shown. The inset shows crystal structure along the c axis of the refined cell having partly filled Li tunnels surrounded by parallelly running rutile tunnels transversely reinforced by TiO6 octahedra (11 Oxygen coordinated Pb polyhedra = Chocolate, TiO6 Octahedra = Orange, Li = Black bead).
Table I. Crystallographic parameters determined by the Rietveld refinement of high-resolution XRD data (λ = 1.5418 Å) of PbLi2Ti6O14 at 25°C. (Uiso = equivalent isotropic displacement parameters) (BVS = Bond valence sum).
| Formula [molecular weight] | PbLi2Ti6O14 [732.47] | ||||||
|---|---|---|---|---|---|---|---|
| Crystal system | Orthorhombic | ||||||
| Space group | Cmca (#64) | ||||||
| Unit cell parameter (Å) | a = 16.645, b = 11.126, c = 11.496, Z = 8 | ||||||
| Unit cell volume (Å3) | 2129.16 | ||||||
| Theoretical density (g cm−3) | 4.57 | ||||||
| Refinement values | Rp = 4.3%, RF = 7.6%, χ2 = 6.048 | ||||||
| Global Instability Index (GII) | 0.085 | ||||||
| Atom | Site | x | y | z | Occupancy | Uiso | BVS |
| Li | 16g | 0.1865 | 0.2442 | 0.1236 | 1 | 0.0150 | 0.92 |
| Pb | 8f | 0.0000 | 0.3387 | 0.1213 | 1 | 2.4713 | 1.79 |
| Ti (1) | 8e | 0.2500 | 0.4933 | 0.2500 | 1 | 0.6467 | 4.10 |
| Ti (2) | 8d | 0.2439 | 0.5000 | 0.0000 | 1 | 0.3711 | 4.09 |
| Ti (3) | 16g | 0.1081 | 0.1230 | 0.3674 | 1 | 0.0071 | 3.97 |
| Ti (4) | 16g | 0.1075 | 0.3799 | 0.3809 | 1 | 0.0063 | 4.06 |
| O (1) | 16g | 0.2362 | 0.3824 | 0.3771 | 1 | 0.0055 | −2.08 |
| O (2) | 16g | 0.1322 | 0.4963 | 0.2505 | 1 | 0.0071 | −1.96 |
| O (3) | 16g | 0.2341 | 0.1141 | 0.3726 | 1 | 0.0055 | −2.08 |
| O (4) | 8d | 0.1304 | 0.0000 | 0.5000 | 1 | 0.0079 | −1.98 |
| O (5) | 8d | 0.1337 | 0.0000 | 0.0000 | 1 | 0.0079 | −1.92 |
| O (6) | 16g | 0.1085 | 0.2511 | 0.2625 | 1 | 0.0063 | −1.89 |
| O (7) | 8f | 0.0000 | 0.0960 | 0.3949 | 1 | 0.0103 | −2.00 |
| O (8) | 16g | 0.1067 | 0.2511 | 0.4764 | 1 | 0.0071 | −2.05 |
| O (9) | 8f | 0.0000 | 0.4109 | 0.3694 | 1 | 0.0103 | −1.85 |
Small and well crystallized primary PbLi2Ti6O14 particles (Figs. 2a, 2i, 2j) agglomerate uniformly giving a secondary porous foil morphology (Figs. 2e, 2f) stemming from short annealing time and gas evolution. With the formation of uniform nanoparticles, ball milling did not further reduce the particle size appreciably. It instead broke existing uniformity in particle distribution leading to morphology degradation, agglomeration and loss in porosity, which was found to be detrimental to the electrochemical properties. Elemental mapping shows homogenous Pb, Ti and O distribution (Li being a light element does not feature) in both the primary single particle (Fig. 2o) and secondary porous agglomerates (Figs. 2b, 2c, 2d). Brunner-Emmett-Teller (BET) specific surface area was found to be ∼2 m2/g with a reversible non-saturating N2 (de)adsorption behavior indicating an unrestricted multilayer type V isotherm. TEM images (Figs. 2k, 2l) confirms nanometre-sized particles of around 200 nm, while HRTEM image (Fig. 2m) show defect free (311) plane with an interplanar spacing of 4.39 Å. Clear indexed SAED spots (Fig. 2n) indicates sample tilt in the single crystal region to a single zone axis [−112].
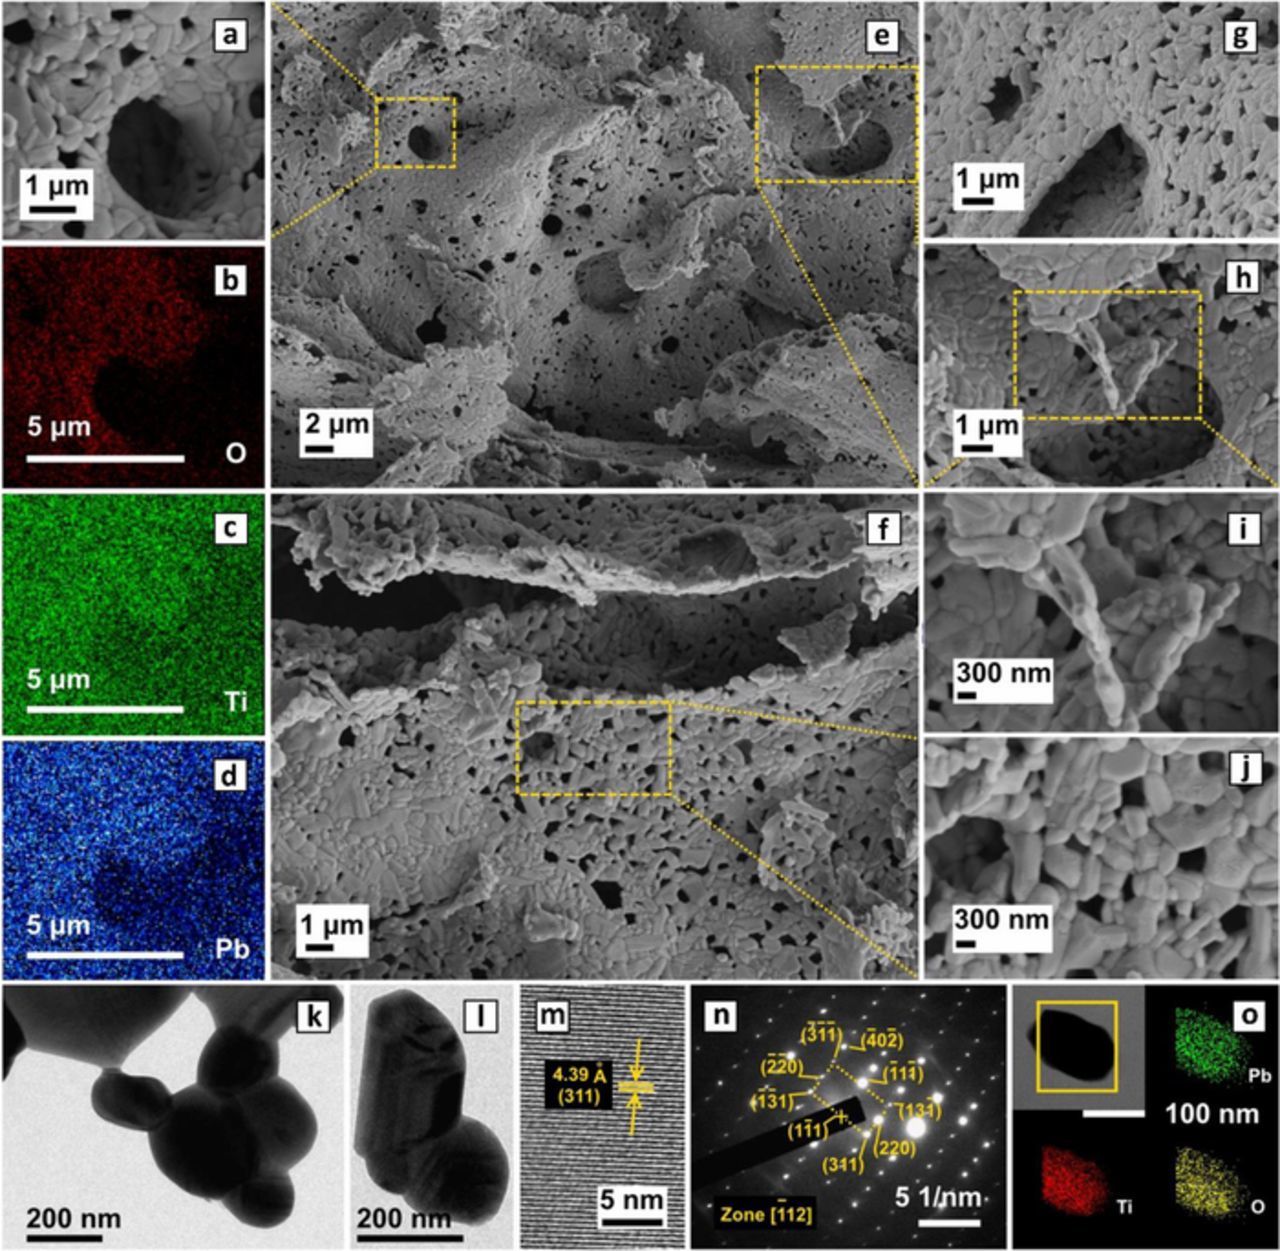
Figure 2. (a) SEM micrograph of porous PbLi2Ti6O14 and (b-d) O, Ti and Pb element mapping from its EDX analysis showing their uniform distribution, (e, f) micrograph showing porous foils with uniform distribution of PbLi2Ti6O14 particles at (g, h) micron and (i, j) nanometre length scales, (k, l) TEM image of secondary nanometric particle size, (m) HRTEM image showing defect free fringes representative of (311) lattice planes, (n) SADP showing clear diffraction spots indexed to Zone [−112] and (o) Bright field STEM image and its element mapping showing homogeneous interparticle distribution.
Bond valence site energy analysis
PbLi2Ti6O14 anode intercalates Li+ while a same number of e− ensuring charge neutrality while reducing the existing Ti4+ to Ti3+. This creates a lithium concentration dependant change in local structure, free volume, and structural non-mobile ion charge, hence also the potential surrounding Li+ that decide the viability, distribution and movement of incoming Li+. It can be captured reasonably well in reliable experimental or simulated static structure models that mirror this actual local structure and the distribution of free volume at that point of lithiation.34 An incoming (or existing) lithium may occupy (or hop to) sites that have the lowest bond valence site energy of lithium (EBVSE Li+). Using the force field of atoms (softBV database)33 in the structural model, bond valence site energy method finds these positions knitting them along with the intersite hop barriers into (one or) multidimensional fibers of Li+ migration pathways. Scaling compensates relaxation of immobile structure in the transport step while adding energetics of the surrounding framework for cases when they are strongly coupled with the mobile cation makes these pathway predictions more exact.34 Nevertheless, the calculation does not account for Li-Li repulsions. In this work, static PbLi2Ti6O14 structure model comprising refined atomic position from diffraction data was used for BVSE analysis illustrating the Li+ dynamics for the immediate next or few more lithiation step (as long as the chemical environment is intact). Li site occupancy and pathways at higher lithiation steps should not be concluded from this refined model as they need the corresponding exact iterative lithiated PbLi2+xTi6O14 models obtainable from refinements of ex-situ lithiated samples or relaxation of lithiated models.
Vacant sites in PbLi2Ti6O14 that host incoming lithium have in the past been arbitrarily pointed at empty 11 oxygen coordinated 8f sites, 4a/4b and 8c in order of Li+ filling with progressive lithiation.16,35 8c and 8e sites along with existing 16g lithium form partly Li filled tunnels along c axis within the Ti2O7 double layers. Vacant 8f sites alternately filled with giant Pb atoms and linear c-axis directed chain of vacant 4a/4b sites populate the mirror plane joining two double layers. Results on PbLi2Ti6O14 shows the lowest bond EBVSE Li+ energy at 6 vacant sites (i2-i7) named in increasing order of their energy (Fig. 3d inset, energy sorted xth site nomenclature: ix if unfilled and Lix if Li-filled), which surprisingly does not feature any of inter-double layer vacant 4a or 4b sites. Furthermore, contrary to the popular belief in the MLi2Ti6O14 system, non-lithium occupancy in these vacant 4a/4b sites is also confirmed from its absence in SrLi8Ti6O14 and intermediate delithiated SrLi2+xTi6O14 relaxed models in our previous work.36 There may be a slight possibility of the BVSE calculations preferring multiple 8f sites (i4, i5, i6) over any of empty 16g, 4a, 4b sites because of the larger free volume of 8f and the fact that they do not factor in Li repulsions that forfeit multiple-occupancy at 8f sites. This, however, does not skew the results significantly as earlier in case of SrLi2+xTi6O14, for x = 1, the additional lithium occupying i4 owing to proximity of vacant i4 (16g) to pre-existing Li1 (16g) relocated this Li1 to vacant 8c (i2) and 8e (i3) positions while also avoiding simultaneous occupancy of i1 and i2/i3 sites in the same channel for the reason of Li-Li repulsions. It is well-known fact that similar Li-Li repulsion operate in making Li4Ti5O12 zero strain even upon addition of 3 extra Li+ that relocate pre-existing tetrahedral 8a Li+ in Li4Ti5O12 to larger empty octahedral 16c sites compensating for any associated volume change. The non-participation of incoming/pre-existing Li+ in 4a/4b vacancies remains an open question for future investigation.
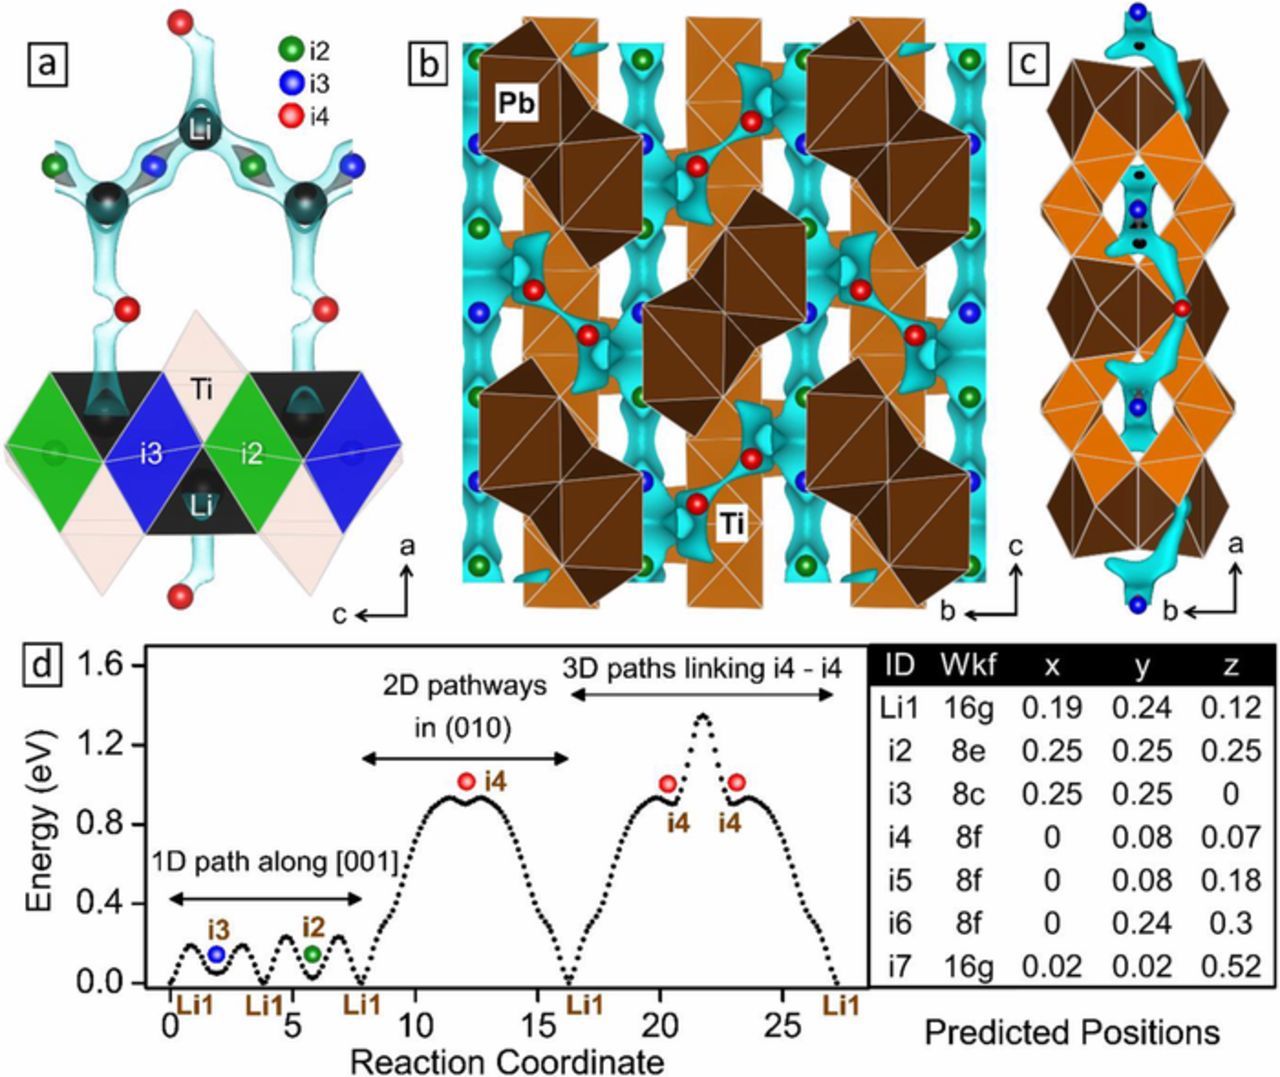
Figure 3. Bond valence site energy (BVSE) model showing (a-c) lithium ion migration pathways, their (d) barriers and (inset table) corresponding interstitial positions in PbLi2Ti6O14. Isosurface having a particular energy value is shown as Cyan tubes. (a) [010] axis projection of half of the unit cell showing horizontal 1D interconnecting structural tetrahedral Li1 (black) 16g sites with high energy green i2 and low energy blue i3 sites running zig-zag along the c axis. For intermediate energy gray isosurface, i3 is connected while i2 is not. (b) [100] axis projection showing parallel c directed alternating rutile TiO6 and partly filled lithium tunnels (also the 1D pathway) adjacently linked by 2D red 8f i4-i4 links. Mid TiO6 between the 1D tunnels and 11 Oxygen coordinated Pb polyhedra has been removed for clarity (c) [001] axis projection showing the 1D tunnels caged inside the Ti2O7 double layers. All illustrations are prepared using VESTA.30
A picture of Li+ migration pathways with respect to the structure in a, b and c direction along with barrier activation energy is presented in Fig. 3. Fig. 3a shows zig-zag 1D pathway Li1(16g)-i2(8e)-Li1(16g)-i3(8c) in tunnels along c axis interconnected by Li1-i4(8f)-Li1 2D paths. i3 has a smaller barrier height than i2, hence the same energy iso-surface connects i3 to Li1 leaving i2 free. Li1 in 16g tetrahedral sites along with another opposite vacant 16g site alternately shares a face with empty octahedral i2 and i3 sites. Fig. 3b shows the location of Li1-i3-i3-Li1 3D pathways fencing the 11-oxygen coordinated Pb atoms in a axis stacked along inter-double layer mirror plane. The cyan tubes are the partly filled Li 1d tunnels alternating parallelly along c axis with orange rutile edge-shared chain (of Ti1-Ti2 octahedra) joined together by alternate transverse blocks (of Ti3-Ti4 octahedra). Fig. 3c shows view along c axis depicting interconnected 1D tunnels. Fig. 3d reveals that similar to BaLi2Ti6O14,37 PbLi2Ti6O14 is a one-dimensional Li+ ion conductor with low 1D migration barriers of 0.23 eV and high 2D (and 3D) migration barriers of 0.93 eV (and 1.35 eV), following which the next lithium inserts at i3, i2, and i4 with decreasing likelihood. Overall, PbLi2Ti6O14 acts as a one-dimensional Li+ conductor. The Li+ diffusion characteristics of PbLi2Ti6O14 was further investigated by AC conductivity experiments.
AC bulk conductivity
Low electronic conductivity in insulating titanates (resulting from no free electrons in d0 states of Ti4+) is routinely improved by optimizing carbon coating or adopting alternate mixing strategies. With both electronic and ionic conduction necessary for energy storage, the latter in almost all cases becomes the limiting factor deciding the highest (dis)charge rates during cycling. AC conductivity experiments were performed to evaluate the ionic conductivity of PbLi2Ti6O14 and compare it with BVSE analysis. The white colored PbLi2Ti6O14 has low electronic conductivity, hence the observed bulk conductivity can be approximated as purely ionic. Pellets having 96% (4.38 g/cm3) of the theoretical density (4.57 g/cm3) were employed. Figs. 4a and 4b show the high-temperature complex impedance data from 100 to 210°C in the form of Nyquist plots at intervals of 10°C and 5°C. The inset in Fig. 4b shows the room temperature behavior. Long-depressed semicircles up to 180°C were observed that reduced in diameter as well as with noise at higher temperatures indicating an increase in conductivity. Two semicircles resolve with a smaller semicircle in the high frequency range was clearly visible after 180°C. An extremely small tail at the low-frequency end from blocking of a mobile ion at sample electrode interface becomes apparent at higher temperatures. At 200 and 210°C, the behavior of higher frequency mechanism is not fully captured in the lower 40 Hz.
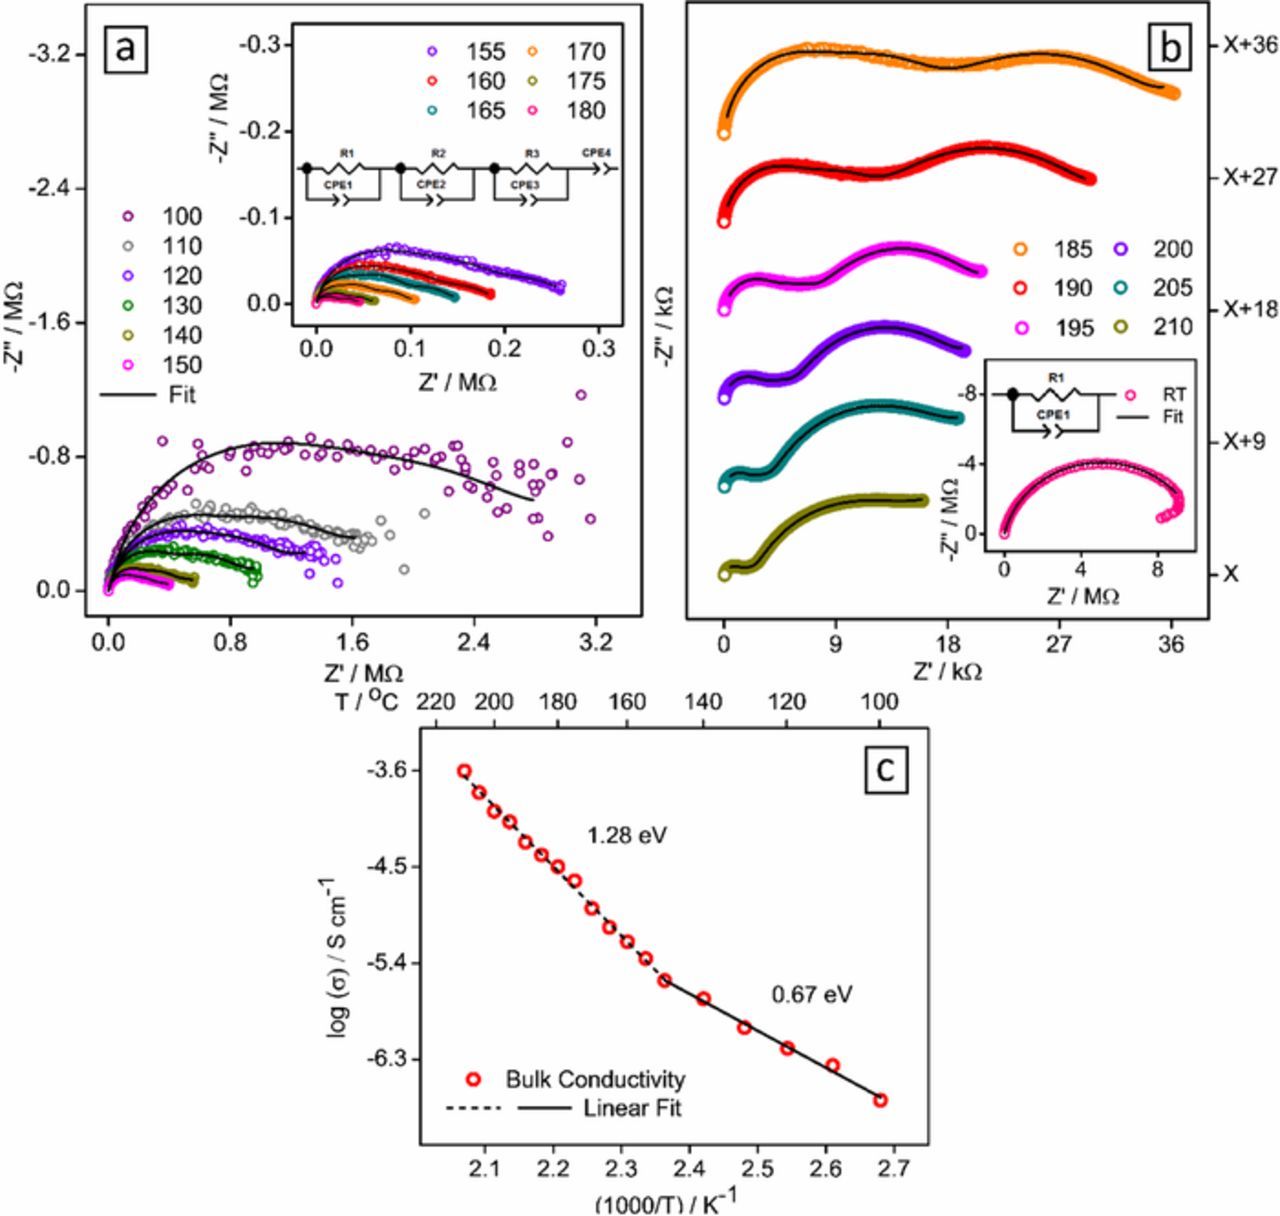
Figure 4. AC conductivity analysis. (a, b) Complex impedance plots for PbLi2Ti6O14 recorded in the frequency range of 40 Hz to 110 MHz at room temperature and high temperatures (100–210°C) and the corresponding fit, using ZView program, as per the equivalent circuit in the inset, Linear fit of Bulk conductivity obtained from (a, b) are used to calculate activation energy in log conductivity vs 1000/T plot (c).
Using ZView program, the high temperature (100 to 210°C) data was fitted using an equivalent circuit consisting of a pair of parallel Debye like resistor-constant phase element (representing impedance contribution from grain interior, grain boundary, grain-electrode interface) and a constant phase element connected in series (Fig. 4a inset). Room temperature data shows a clear semicircle and was fitted to a single element (Fig. 4b inset). Apparently, the data indicates a single depressed semicircle that splits to two semicircles above 180°C. Nevertheless, it could be best fitted using three overlapping semicircles from grain, grain boundary and interface contribution at higher, mid and lower frequency. Above 180°C, the interface resistance indicated by a large low-frequency semicircle dominates with similar grain and grain boundary resistance obtained from fitting, which contributes to the single overlapping semicircle at a higher frequency. This difficulty in resolution indicates overlapping time constants for all mechanisms below 180°C, and both grain/grain boundary relaxation above 180°C. The bulk resistance R, based on the standard brick-layer model, was calculated from a parallel combination of resistance segments of grain interior (Rgi), grain boundary (Rgb) and sample electrode interface (Re) obtained after fitting. Bulk conductivity (σ) in S cm−1 was calculated using σ = 1/ρ = l/(R × A) where l is the thickness of the pellet, and A is the disc area of the pellet in cm. The bulk conductivity at RT and 200°C were 2.08 × 10⁻⁷ S cm−1 and 1.05 × 10⁻⁴ S cm−1 respectively. Arrhenius relation of temperature dependence of dc conductivity was used to calculate the activation energy for ion movement:
![Equation ([2])](https://content.cld.iop.org/journals/1945-7111/166/3/A5122/revision1/d0002.gif)
where Ao is the pre-exponential factor, Ea is the activation energy in eV, k is the Boltzman's constant in eV/K and T is the temperature in K.
Fig. 4c shows the variation of above-calculated bulk conductivity values (in S cm−1) obtained from impedance with 1000/T (K−1). A switch in the conduction mechanism was observed above 150°C. Different slopes obtained from the linear fit of these two regions can be linked to an increase in activation energy from 0.69 eV to 1.28 eV at 150°C. Correlating with the activation energies from BVSE calculation, the extrinsic regime at low temperatures (upto 150°C) is dominated by the low migration barrier (0.69 eV) for fast conducting 1D Li1-i3-Li1-i2 channels (0.23 eV). At higher temperature, intrinsic regime with higher activation energy (1.28 eV) dominates by conduction along Li1-i4-i4-Li1 2D paths (0.93 eV).
Electrochemical performance
The redox nature of titanium (Ti) and Li+ diffusion in PbLi2Ti6O14 was studied using cyclic voltammetry (CV). CV at different scan rates (0.1-1 mV/s) revealed three distinct reversible redox peaks (Fig. 5a). They are named R1, R2, R3, O1, O2, and O3 sequentially as per Ti4+ reduction (discharge) followed by Ti3+ oxidation (charge) during battery cycling. The zero-intercept linear fit (Fig. 5b) of current variation at all redox peaks with the square root of scan rate were used to evaluate the Li+ diffusion coefficient at each peak as per Randles-Sevchik equation38
![Equation ([3])](https://content.cld.iop.org/journals/1945-7111/166/3/A5122/revision1/d0003.gif)
where ip, ν, nx, A, D and Cx represent the current (A), scan rate (V/s), number of electrons, electrode area (2.324 cm2), diffusion coefficient (cm2/s) and the concentration of the diffusing ion (mol/cm3) respectively.
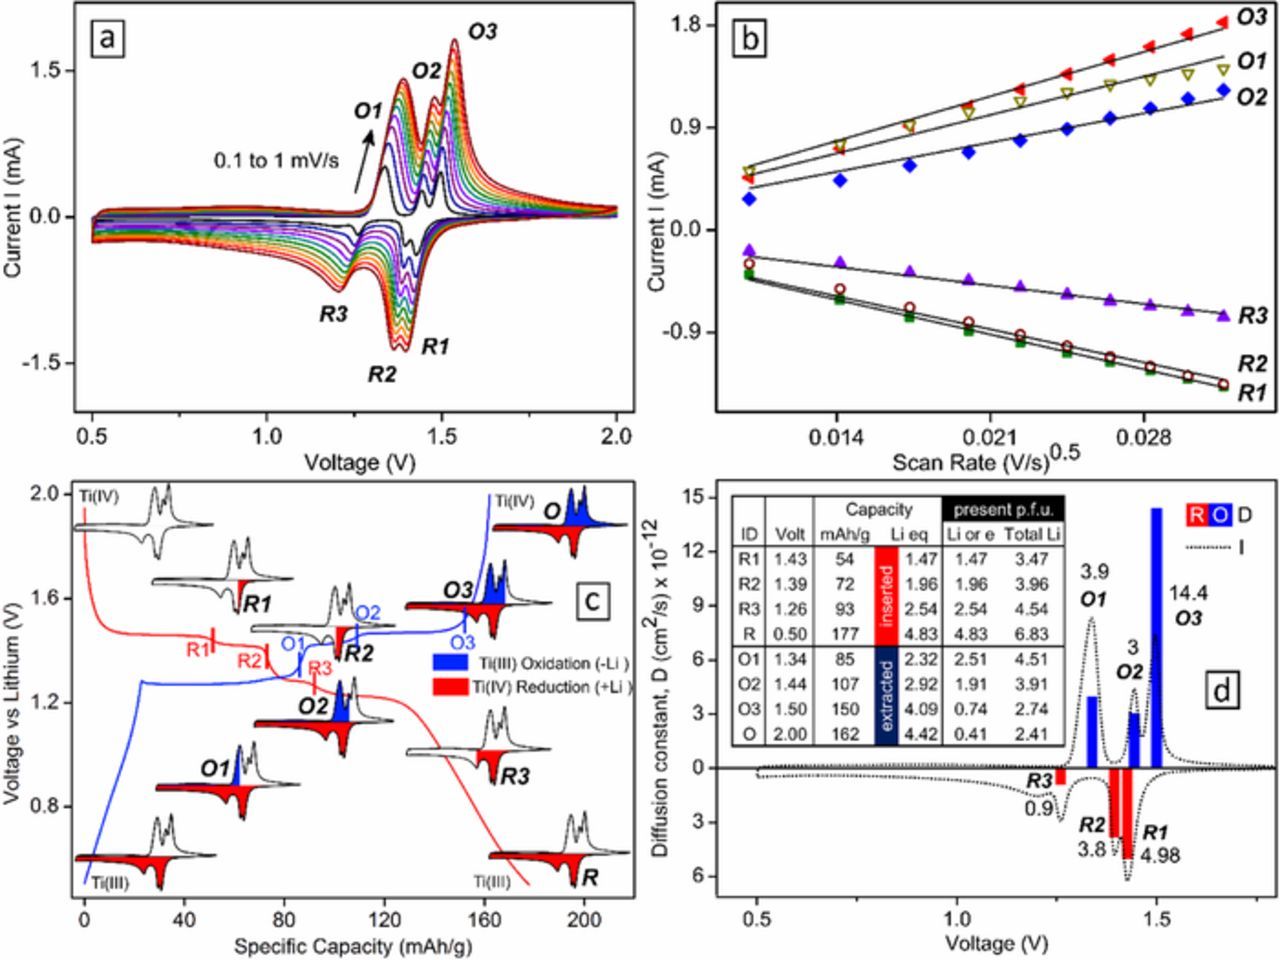
Figure 5. (a) Cyclic voltammograms (CV) of PbLi2Ti6O14 vs lithium half-cell cycled at current rates from 0.1 to 1 mV/s with three redox pairs, (b) Linear fit of the six peak currents to square root of scan rate, (c) Schematic of lithium and electron economy (inset table) at each redox peak, (d) calculated diffusion coefficient.
Here Cx is the concentration of Li+ inside an unit cell of PbLi2Ti6O14. For 1 Li+ ion per formula unit (p.f.u.) of PbLi2Ti6O14 (8 f.u. per unit cell for multiplicity factor, Z = 8), Cx is the ratio of moles of Li in a unit cell to its unit cell volume (2128.95 Å3) and is calculated as:
![Equation ([4])](https://content.cld.iop.org/journals/1945-7111/166/3/A5122/revision1/d0004.gif)
Both the number of electrons, nx, and the number of Li+ present p.f.u. at the xth redox peak was calculated based on capacity recorded from 2nd cycle (dis)charge voltage profile of a C/10 galvanostatic cycle done on an independent Li half-cell (Fig. 5c). The characteristic cutoff voltage for the peak was chosen based on pt1 mV/s CV (multiple inset CV schematics along voltage profiles in Fig. 5c). These cutoff voltages along with corresponding redox electron (nx)/total lithium economy at each xth peak for calculation of D are summed up in an inset table in Fig. 5d. The redox lithium equivalent of capacity (1 Li+ eq = 36.67 mAh/g, theoretical capacity based on 6 Li+/e− = 220 mAh/g) recorded at cutoff corresponding to each reduction peak R1, R2 and R3 were first found. After maximum Ti4+ is reduced (at R) by insertion of 4.83 Li+, during subsequent charge process, the lithium equivalent capacity was deducted from 4.83 Li+ to give the redox Li+ present p.f.u at O1, O2 and O3. At each redox peak, pre-existing two structural Li+ added to the above calculated redox Li+ was used to calculate Cx. The reason behind considering the structural lithium as mobile is because both were found to be part of fast conducting 1D channels from BVSE with low activation energy (0.232 eV). Following above discussion, D for each of six redox peaks was found within a range of 0.9 to 14.4 × 10⁻¹² cm2/s with the highest D at O3 due to the least number of Li+ present (2.74). These values are slightly better than the previously reported D values of PbLi2Ti6O14 in pristine form (100.53 × 10⁻¹⁴ cm2/s),21 forming solid solution with BaLi2Ti6O14 (2.252 × 10⁻¹⁴ cm2/s),22 N doped carbon coated PbLi2Ti6O14 (1.03 × 10⁻¹³ cm2/s)23 and metal (Na, Mg, Al) doped PbLi2Ti6O14 (1.978 × 10⁻¹² cm2/s).24 This could arise from the evenly distributed small particles due to the quick one-minute combustion synthesis.
Lithium (de)insertion reversibility was tested in PbLi2Ti6O14 prepared by combustion route involving annealing at 1 min and 1 h with optional ball milling. The working electrodes were prepared with active material (AM): carbon black (CB) and binder (PVDF) in the ratio of 80:10:10. Results (Fig. 6) show minor difference between ball milled and pristine 1-minute annealed sample with 1st and 15th charge capacity around 135 mAh/g and 74 mAh/g. As combustion synthesis formed nanometric (100–300 nm) particles, ball milling had little or no effect on particle morphology and electrochemical activity. The 1-hour sample gave a slightly lower 1st charge capacity of 119 mAh/g retaining similar 74 mAh/g after 15 cycles. Hence the 1-minute sample was finalized for subsequent studies on electrochemical performance. To block capacity fade, carbon was increased at expense of active material and a AM: CB: PVDF formulation of 70:20:10 was coated with extreme care inside glove box minimizing moisture contamination. An excellent first charge capacity of 167 mAh/g was observed retaining 137 mAh/g after 15 cycles. The inset voltage profile (after 15th cycles) confirms superior reversibility. The observed first charge capacity of 167 mAh/g (4.6 Li+) at C/10 rate was at par or higher than reported capacity values for pristine PbLi2Ti6O14 (146–155 mAh/g),16,21,25 Sr1-xPbxLi2Ti6O14 (163 mAh/g),39 Ba1-xPbxLi2Ti6O14 (153 mAh/g),22 N-doped carbon-coated PbLi2Ti6O14 (143.2 mAh/g)23 and Al-doped PbLi2Ti6O14 (152.8 mAh/g).24
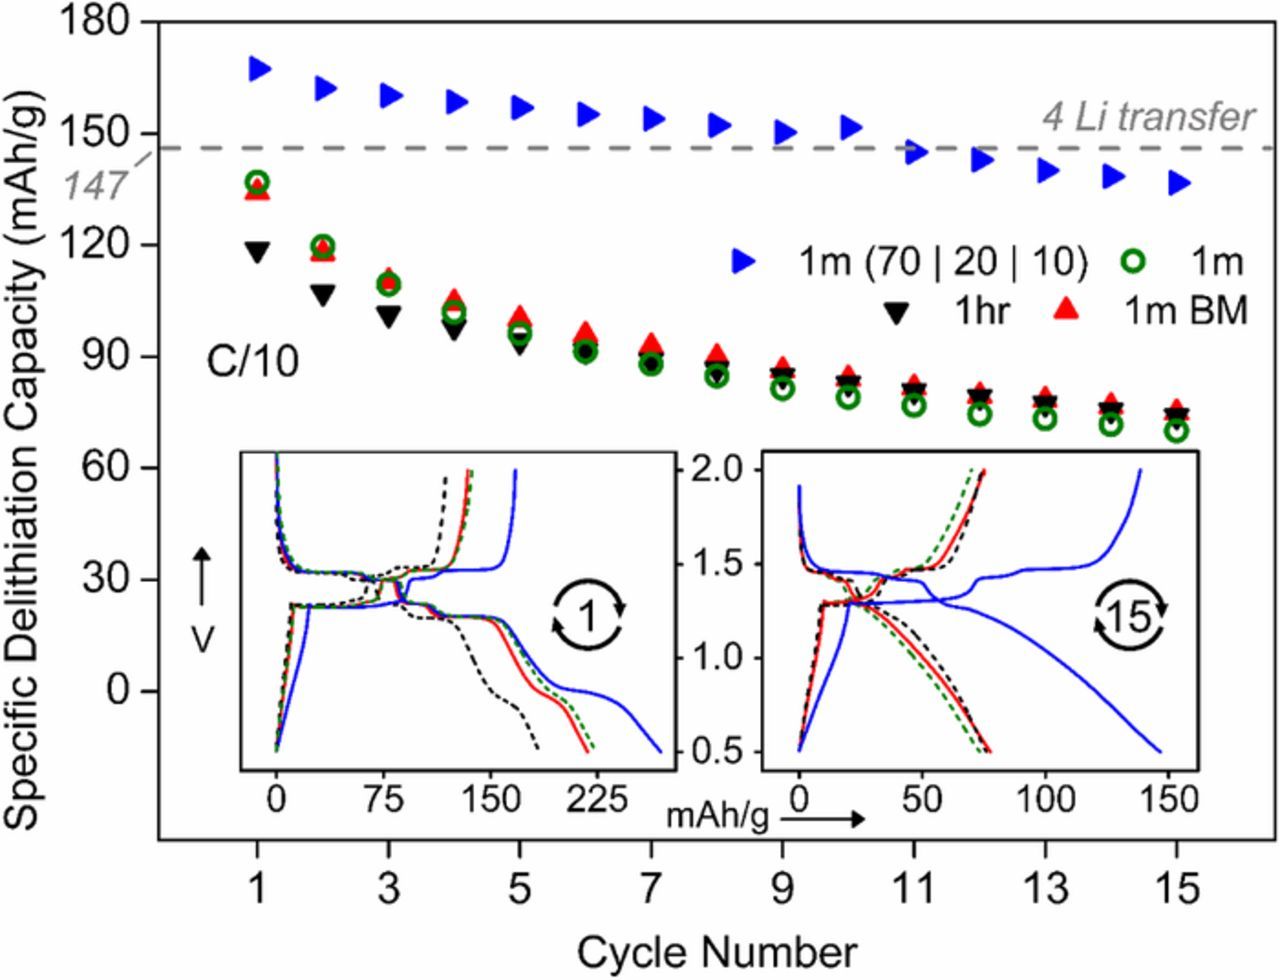
Figure 6. Cycle (15 nos.) life plots of lithium (de)insertion in PbLi2Ti6O14 prepared at 1 minute pristine (green circle) /ball milled (red triangle) and 1 hour (black triangle) annealing for 80% active material. Blue triangles depict 1-minute annealed sample having with 70% active material with 20% carbon black. Voltage profiles of 1st and 15th cycles are shown in the inset.
The long term cycling stability of 1-minute synthesized PbLi2Ti6O14 was tested at slow (C/5) rate in a wide voltage range (0.5–2V, Fig. 7a) and at a fast (2C) rate in a narrow voltage range (1–2 V, Fig. 7b). In both cases, the first discharge capacity at C/10 rate was 233 mAh/g (6.4 Li+) and 198 mAh/g (5.4 Li+) respectively. In the wide window test, a significantly high capacity 161 mAh/g could be extracted in the first charge with the remaining (72 mAh/g, 2 Li+) capacity lost irreversibly to SEI formation evident from loss of 0.8V first discharge plateau in subsequent cycles. Over 80% of initial capacity at 130 mAh/g could be recovered after 60 cycles at C/5 rate indicating excellent reversibility. The inset differential capacity plot shows the distribution of charge storage favorably in voltage plateaus in 3 distinct reversible redox peaks. In the narrow voltage window, an initial capacity of 108 mAh/g was observed at 1C and 98 mAh/g at 2C. 86% (84 mAh/g, 2.3 Li+) and 64% (63 mAh/g, 1.7 Li+) of this third cycle capacity were retained at 2C rates after 500 cycles and 1000 cycles respectively with reasonably flat voltage profiles (Fig. 7b inset).
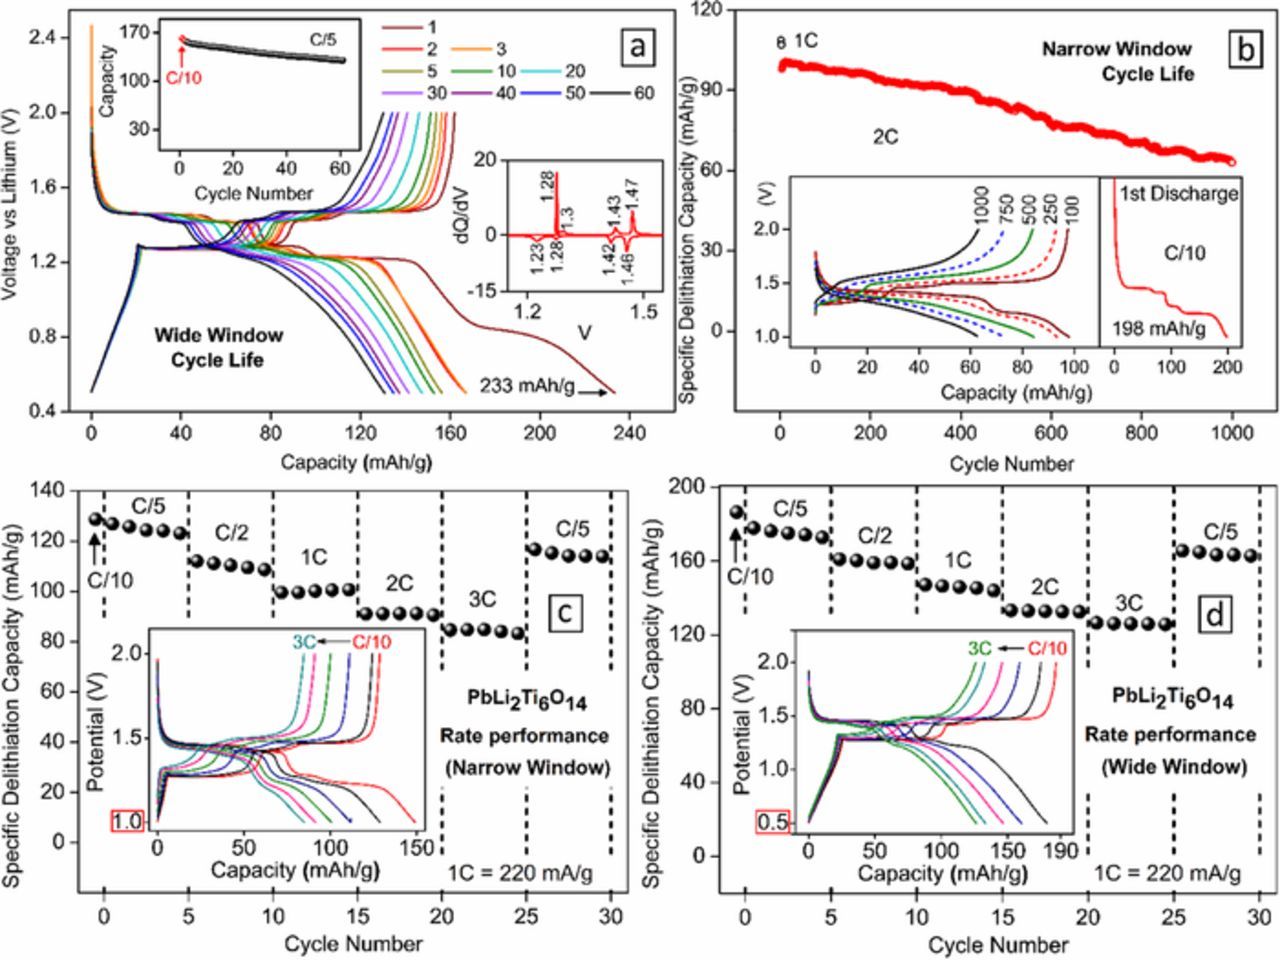
Figure 7. (a, b) Cycle life performance of PbLi2Ti6O14 versus lithium at (a) a slow C/5 rate for a wide voltage window of 0.5V – 2V, and (b) a fast 2C for a narrow voltage window of 1V −2V. A C/10 slow formation cycle precedes both tests. Insets in (a) show capacity retention, dQ/dV vs V, and in (b) shows voltage profiles and first cycle losses. (c, d) Rate performance of PbLi2Ti6O14 versus lithium at higher current rates up to 3C (660 mA/g) for both narrow and wide voltage windows. The inset shows the voltage profile and their polarization at different C rates.
Fig. 7c shows rate performance in similar narrow and wide voltage widow from C/10 to C/5 rates. Good rate capability can be concluded from Table II that shows capacities observed at each C rates for both cases. This can be justified from the fact that the voltage dependant stepwise lithium (de)insertion at different vacant sites (8f, 8c, 8e, and 16g) proceeds by a solid-solution (single phase) intercalation mechanism without significant structural change.21 Following, to test the possibility of Na+ insertion into PbLi2Ti6O14, a sodium half-cell was constructed. Similar to BaLi2Ti6O14,37 PbLi2Ti6O14 was found to partially (de)intercalate Na+ delivering the first discharge capacity ∼ 80 mAh/g (2.2 Na+ insertions) (results not shown). In the subsequent cycles, a reversible capacity of 22 mAh/g (0.6 Na+) was observed involving a Ti4+/Ti3+ redox activity centered around 0.7 V.
Table II. De-lithiation (Charge capacity) in mAh/g (and equivalent Li+) of PbLi2Ti6O14 cycled in narrow (1–2 V) and wide (0.5–2 V) range.
| De-lithiation Capacity | |||||
|---|---|---|---|---|---|
| Current | 1–2V | 0.5–2V | |||
| mA/g | xC | mAh/g | Li eq. | mAh/g | Li eq. |
| 22 | C/10 | 129 | 3.5 | 187 | 5.1 |
| 44 | C/5 | 124 | 3.4 | 175 | 4.8 |
| 110 | C/2 | 110 | 3.0 | 159 | 4.3 |
| 220 | 1C | 100 | 2.7 | 146 | 4.0 |
| 440 | 2C | 91 | 2.5 | 133 | 3.6 |
| 660 | 3C | 85 | 2.3 | 126 | 3.4 |
Conclusions
High throughput screening of different fuels, annealing temperature and duration were employed to prepare lead-lithium titanate (PbLi2Ti6O14) by solution combustion synthesis benchmarking the lowest reported annealing duration of 1 min (at 900°C). Rietveld and microscopy analyses confirmed phase purity with orthorhombic (Cmca) structure. Li+ diffusivity was measured synergising bond valence site energy computation, AC conductivity analysis and cyclic voltammetry. Bond valence site energy analysis revealed a lower activation energy barrier for 1D (0.232 eV) migration along c axis and higher activation energy barrier for 2D (0.934 eV) and 3D (1.347 eV) pathways. AC conductivity analysis calculated an ambient bulk conductivity value of 2.08 × 10⁻⁷ S cm−1 with an activation energy barrier of 1.28 eV. Cyclic voltammetry analyses led to the diffusion coefficient in the range of 10−12 cm2/s. With this feasible Li+ migration, reversible Li+ (de)intercalation was noticed in the combustion synthesized PbLi2Ti6O14 titanate involving a 1.35 V Ti4+/Ti3+ redox activity (lowest in its family) along with good rate kinetics and cycling stability. The minute made PbLi2Ti6O14 forms a potential anode for high-rate Li-ion batteries. On another note, combustion synthesis forms a swift energy-miser method for rapid synthesis and screening of Ti-based anode materials.
Acknowledgments
The authors sincerely acknowledge Indian National Science Academy (INSA) for financial support (INSA/CMR/PBB/0021). The authors are grateful to V. Khopkar and Prof. Stefan Adams for conductivity and BVSE analyses. AC thanks the Ministry of Human Resource Development (MHRD) for financial assistance. PB is grateful to the Department of Atomic Energy (DAE, Govt. of India) for a DAE-BRNS Young Scientists Research Award (YSRA).
ORCID
Prabeer Barpanda 0000-0003-0902-3690