Abstract
Cerium is a radical scavenger which improves polymer electrolyte membrane (PEM) fuel cell durability. During operation, however, cerium rapidly migrates in the PEM and into the catalyst layers (CLs). In this work, membrane electrode assemblies (MEAs) were subjected to accelerated stress tests (ASTs) under different humidity conditions. Cerium migration was characterized in the MEAs after ASTs using X-ray fluorescence. During fully humidified operation, water flux from cell inlet to outlet generated in-plane cerium gradients. Conversely, cerium profiles were flat during low humidity operation, where in-plane water flux was negligible, however, migration from the PEM into the CLs was enhanced. Humidity cycling resulted in both in-plane cerium gradients due to water flux during the hydration component of the cycle, and significant migration into the CLs. Fluoride and cerium emissions into effluent cell waters were measured during ASTs and correlated, which signifies that ionomer degradation products serve as possible counter-ions for cerium emissions. Fluoride emission rates were also correlated to final PEM cerium contents, which indicates that PEM degradation and cerium migration are coupled. It is proposed that cerium migrates from the PEM due to humidification conditions and degradation, and is subsequently stabilized in the CLs by carbon catalyst supports.
Export citation and abstract BibTeX RIS

This is an open access article distributed under the terms of the Creative Commons Attribution Non-Commercial No Derivatives 4.0 License (CC BY-NC-ND, http://creativecommons.org/licenses/by-nc-nd/4.0/), which permits non-commercial reuse, distribution, and reproduction in any medium, provided the original work is not changed in any way and is properly cited. For permission for commercial reuse, please email: oa@electrochem.org.
Widespread adoption of polymer electrolyte membrane (PEM) fuel cell technology is currently hindered by insufficient component durability and high cost.1 During operation, reactive radical species generated by electrochemical fuel cell processes attack vulnerable functional groups in the ion-conducting, or ionomer, molecules which constitute the PEM and are present in the catalyst layers (CLs).2 These attacks reduce PEM thickness and generate local pinholes, which release hydrofluoric acid (HF), sulfuric acid (H2SO4), and fluorinated polymer fragments into effluent cell waters; increase crossover of reactant gases through the PEM; and lead to cell failure.1,2 Since the PEM is constrained by cell hardware, hygrothermal cycling generates mechanical stresses which cause physical damage to the PEM in the form of cracks, tears, and pinholes.1,2 Furthermore, during typical operation, cells experience both chemical and mechanical stresses simultaneously, which results in synergy between the degradation modes. Localized mechanical stresses increase PEM susceptibility to radical attack by reducing the activation energy necessary for such attacks to proceed3,4 and chemical degradation of the ionomer diminishes the bulk mechanical properties of the PEM, such as ultimate tensile strength, strain-to-failure, and fracture toughness, which further increases its susceptibility to physical failure.5–11
Owing to its rapid and regenerative redox with radical species and stability in acidic media,7 cerium dramatically improves PEM durability by neutralizing radicals before they attack the ionomer. Cerium ions may be directly exchanged with protons in the ionomer12,13 or incorporated into the PEM or the catalyst layers (CLs) in the form of pure or doped ceria (CeO2) nanoparticles.14–25 Radical scavenging is initiated when cerium(III) ions are oxidized by hydroxyl radicals (HO•) to form tetravalent cerium(IV) ions and water; the former are subsequently regenerated back to cerium(III) through rapid reduction by hydroperoxyl radicals (HOO•) or hydrogen peroxide (H2O2), both of which are also generated in the membrane electrode assembly (MEA).13
The effectiveness of cerium as a radical scavenger has been demonstrated in situ using electron spin resonance26,27 and fluorescence spectroscopy,28 where it is shown to significantly reduce HO• concentrations in operating fuel cells. Accelerated stress tests (ASTs) have also been applied to validate the performance of cerium-containing MEAs. ASTs for PEM durability typically consist of open circuit voltage (OCV) operation and/or relative humidity (RH) cycling at high temperatures in order to induce chemical and/or mechanical stresses, respectively, which are representative of those experienced during field operation.1,2,29,30 Cerium stabilization of MEAs results in lower fluoride emission rates (FERs) compared to unstabilized MEAs, which indicates reduced PEM thinning and pinhole development.12–25 As a result, cerium-stabilized MEAs maintain more stable gas crossover rates and extended AST lifetimes, which confirm its ability to enhance chemical and mechanical durability in situ.
Although they are effective radical scavengers, cerium ions are mobile during cell operation.13,24,31–33 Such mobility can reduce scavenging efficacy and cell performance. Cerium ions initially exchanged with the protons in the PEM were observed to migrate into the CLs after hot pressing and conditioning.31,32 After 700 hours of OCV testing at 80°C and 30% RH, a more significant portion of cerium in the PEM partitioned into the CLs.31 Conversely, cerium ions exchanged with CL ionomer were found to diffuse into a cerium-free PEM after hot pressing.13 They remained concentrated in the PEM after 200 hours of OCV testing at 95°C and 50% RH, however, 50% leached out laterally across the edge of the active area into the gasketed, inactive PEM border region.13
When ceria is added to the CLs, it ionizes and diffuses into the PEM during hot pressing and conditioning.24,31,33 However, after 450 hours of OCV operation at 80°C and 30% RH, it partitioned into the CLs in equal quantities.31 After 1,250 hours of OCV testing with intermittent wet/dry cycling, approximately 45% of the cerium initially deposited in the anode CL migrated into the PEM. At the end-of-test (EOT), anode and cathode CLs contained 23 and 7% of the initial cerium inventory, respectively, while the remaining 24% leached out of the active area.24
During potential cycling from 0.6 to 1.3 V at 100% RH, ceria initially deposited in the anode CL dissolved and migrated to the cathode CL.33 Cell polarization performance was significantly lower than a cerium-free baseline at the EOT. These performance losses were attributed to decreased proton conductivity and increased mean proton transport length in the CL ionomer, which result from cerium poisoning of the cathode CL.34 These performance losses were exacerbated with the number of voltage cycles and were correlated to the crystallite size and porosity of the ceria nanoparticles.35 It is believed that such factors influence the rate of cerium dissolution and subsequent migration to the cathode CL. Interestingly, reducing anode reactant gas humidity from 100 to 50% RH mitigated EOT performance losses after voltage cycling in identical cerium-containing MEAs,33 indicating that water strongly affects ceria dissolution and migration.
Cerium migration within the active area and leaching from the active area into the gasketed, inactive PEM border region of the MEA have both been observed,13,24,36 however, the magnitude of cerium washout from the MEA, itself, is unclear. Irreversible cerium washout from the MEA would compromise durability, due to the reduced availability of radical scavengers. During constant-humidity OCV operation, the magnitude of cerium washout appears to be negligible.13,32 However, contrary studies indicate that cerium loading in the MEA could be reduced by >50% after 40,000 hours of bus operation and completely exhausted during an AST of identical duration.37
While cerium migration and washout have previously been quantified, the underlying mechanisms and their associated magnitudes under various operating conditions are not fully understood. Based on previous studies, cerium migration appears to depend strongly on ion concentration gradients, as well as water/proton flux. Increased cerium concentrations in PEM and CLs reduce proton conductivity, which generates performance losses. Additionally, because the diffusion length of the most reactive HO• radical is approximately 40 nm,38 even micrometer-scale cerium migration could have implications for its ability to extend membrane life by radical scavenging. Therefore, an improved understanding of these migration mechanisms is necessary in order stabilize cerium in the MEA and localize it to areas of radical generation. Successful cerium stabilization and localization will enhance PEM fuel cell durability and minimize performance losses. In this work, we present results from a systematic approach to elucidate the mechanisms of cerium migration and washout from the MEA under specified AST protocols.
Experimental
MEA preparation and cell assembly
MEAs were synthesized using 100 cm2 Nafion XL PEMs (DuPont, 27.5 μm thick, ∼6.0 μg/cm2 ion-exchanged cerium). For fully humidified operation, a commercial Ion Power MEA was used, which had platinum loadings of 0.12 and 0.27 mg/cm2 on the anode and cathode, respectively, and an ionomer to carbon (I/C) mass ratio of 1.23. For low humidity and humidity cycling ASTs, MEAs were synthesized in-house using a decal transfer method.39 Electrode decals were formed by painting platinum catalyst ink (TKK, 48% Pt/C) with an I/C mass ratio of 0.75 onto 50 cm2 polytetrafluoroethylene (PTFE)/fiberglass backing sheets (Saint-Gobain Performance Plastics). Platinum loading on each decal was verified at 0.2 ± 0.02 mg/cm2 in air using a Thermo Scientific QUANT'X X-ray fluorescence (XRF) spectrometer with a 3.5 mm aperture, a palladium filter, an accelerating voltage of 25 kV, a tube current of 1.6 mA, and a scan duration of 20 seconds. After the desired platinum loadings were achieved, decals were hot pressed onto the PEMs for 5 minutes at 130°C and 4.8 MPa.
MEAs were assembled into 50 cm2 single-cell hardware (Fuel Cell Technologies) using graphite bipolar plates, 25BC gas diffusion layers (GDLs, SGL Group), 317.5 μm polyurethane (PU) gaskets, and 25.4 μm PTFE sub-gaskets. For fully humidified operation, the active area was reduced from 50 to 25 cm2 using a PU gasket. Test hardware was compressed to obtain an approximate GDL pressure of 1.5 MPa.
Accelerated stress testing with intermittent characterization
After assembly, cells were installed in a fuel cell test stand (Fuel Cell Technologies) in co-flow orientation with inlets high and conditioned for 16 hours at 0.6 V at 90°C and 100% RH in H2/air with stoichiometries of 1.2/2 and outlet pressures of 101/101 kPaabs. After conditioning, the cells were subjected to ASTs which were adopted from standard protocols.40 Cells were operated at OCV and temperatures of 90°C with H2/air flow rates of 0.7/1 standard liters per minute (SLPM) for 50 cm2 cells and 0.35/0.83 SLPM for the 25 cm2 cell, with outlet pressures of 101/101 kPaabs. ASTs were performed at three humidity conditions: 100% RH, 30% RH, and wet/dry cycling, where the cell was exposed to fully humidified reactant gasses for 30 seconds, followed by 45 seconds of exposure to dry reactant gases, which bypassed the water reservoirs of the humidity bottles.41 During ASTs, OCV was continuously monitored using a data acquisition system on the test stand control computer.
Pressure drops (ΔPs) were measured on the anode and cathode sides of each cell under identical AST conditions using mechanical pressure gauges (U.S. Gauge) installed at gas inlets and outlets. The effective anode and cathode ΔPs during wet/dry cycling (ΔPwet/dry cycle) were calculated as:
![Equation ([1])](https://content.cld.iop.org/journals/1945-7111/163/9/F1023/revision1/d0001.gif)
where twet and tdry are the fractions of the total test duration in the wet and dry phases of the cycle, respectively, and ΔP100% RH and ΔP0% RH are the corresponding anode or cathode pressure drops measured at 100 and 0% RH, respectively.
At OCV, it is assumed that the molar flows of reactant gasses are conserved from inlet to outlet because no reactant gasses are consumed and water vapor does not condense to liquid water. In addition, it is assumed that the cell is isothermal and the equilibrium vapor pressure of water at 90°C remains constant. Therefore, the corresponding change in outlet RH due to ΔP was calculated as:
![Equation ([2])](https://content.cld.iop.org/journals/1945-7111/163/9/F1023/revision1/d0002.gif)
where Poutlet was 101 kPaabs for all ASTs.
Every 24 to 72 hours, the cells were conditioned for 30 minutes in H2/N2 at 100% RH and 90°C with gas flow rates of 0.5/0.5 SLPM for 50 cm2 cells and 0.25/0.25 SLPM for the 25 cm2 cell and outlet pressures of 101/101 kPaabs. Electrochemical gas crossover was then measured using linear sweep voltammetry from 0.1 to 0.5 V at a scan rate of 2 mV/s using a PAR 273 potentiostat.42 The crossover current density measured at 270 mV was reported.
Effluent water samples were collected from the anode and cathode gas outlets every 24 to 72 hours using a jacketed condenser system. A Dionex ICS 2100 ion chromatography (IC) system was used to analyze waters for trace concentrations of fluoride using standard test protocols.43 For this technique, detection limits are around 0.025 mg/mL and the accuracy of measurements of 1 mg/mL is ±5%.44 Fluoride standards (Fluka) were prepared at ionic concentrations of 0.5, 1, 5, 10, and 20 mg/mL in deionized (DI) water. A quadratic calibration curve was obtained with an R2 of 0.999.
At each water collection interval, n, the fluoride emission (FE) from each side of the cell, measured in mg/cm2, was calculated as:
![Equation ([3])](https://content.cld.iop.org/journals/1945-7111/163/9/F1023/revision1/d0003.gif)
where CF, n is the concentration of fluoride ions, in mg/mL, Vwater, n is the volume of water collected during that interval, in mL, and Acell is the active area of the cell, in cm2. The cumulative fluoride emission (∑ FE) at each collection interval was calculated by summing the fluoride emitted in all of the preceding collection intervals, i = 1...n:
![Equation ([4])](https://content.cld.iop.org/journals/1945-7111/163/9/F1023/revision1/d0004.gif)
Finally, the fluoride emission rate (FER) at each collection interval was calculated as:
![Equation ([5])](https://content.cld.iop.org/journals/1945-7111/163/9/F1023/revision1/d0005.gif)
where tn is the duration of the corresponding collection interval, in hours.
A Thermo Scientific iCAP Q inductively coupled plasma mass spectrometer (ICP-MS) was used to analyze water samples for trace concentrations of cerium. Water samples collected from the 30% RH and wet/dry cycling ASTs were analyzed directly, and samples from the 100% RH AST were concentrated by a factor of ∼6 before analysis. Cerium standards (SCP Science) were prepared at 0.005, 0.02, 0.05, 0.1, 0.5, 1, and 2 μg/mL concentrations, spiked with 1 μg/mL of indium internal standard (High Purity Standards), and diluted up to 50 mL using a solution of 2% nitric acid (Fisher Optima, 70%) in DI water. A linear calibration curve was obtained with an R2 of 0.999. Collected water samples were spiked with indium at 1 μg/mL and nitric acid to matrix match to the standards. Cerium emission (CE), cumulative CE (∑ CE), and cerium emission rate (CER) were calculated for each AST using Equations 3, 4, and 5, respectively, where CF,n was replaced with the cerium concentration (CCe,n), in ng/mL, measured at each collection interval.
ASTs were performed until electrochemical gas crossover exceeded 20 mA/cm2 or the test duration surpassed 2,000 hours. After ASTs, cells were dried for 1 hour at 90°C in 0% RH N2/N2 with flow rates of 0.5/0.5 SLPM for 50 cm2 cells and 0.25/0.25 SLPM for the 25 cm2 cell and outlet pressures of 101/101 kPaabs. Drying in an inert N2 environment under these conditions was previously demonstrated to have no significant impact on final cerium location after ASTs.32
Post-mortem analysis
In order to conduct scanning electron microscope (SEM) evaluation of MEAs after ASTs, 2 × 1 cm specimens were cut near the outlets of the dried MEAs as shown by the green box in Figure 1. To prepare MEA cross sections for imaging, specimens were immersed in liquid nitrogen and freeze-fractured using fresh, carbon steel razor blades (SPI Supplies). The fractured surfaces were analyzed using a FEI Quanta 45 SEM with an accelerating voltage of 5 kV. Either a secondary or backscatter electron detector was used, when necessary, to obtain optimal contrast between the PEM and CLs.
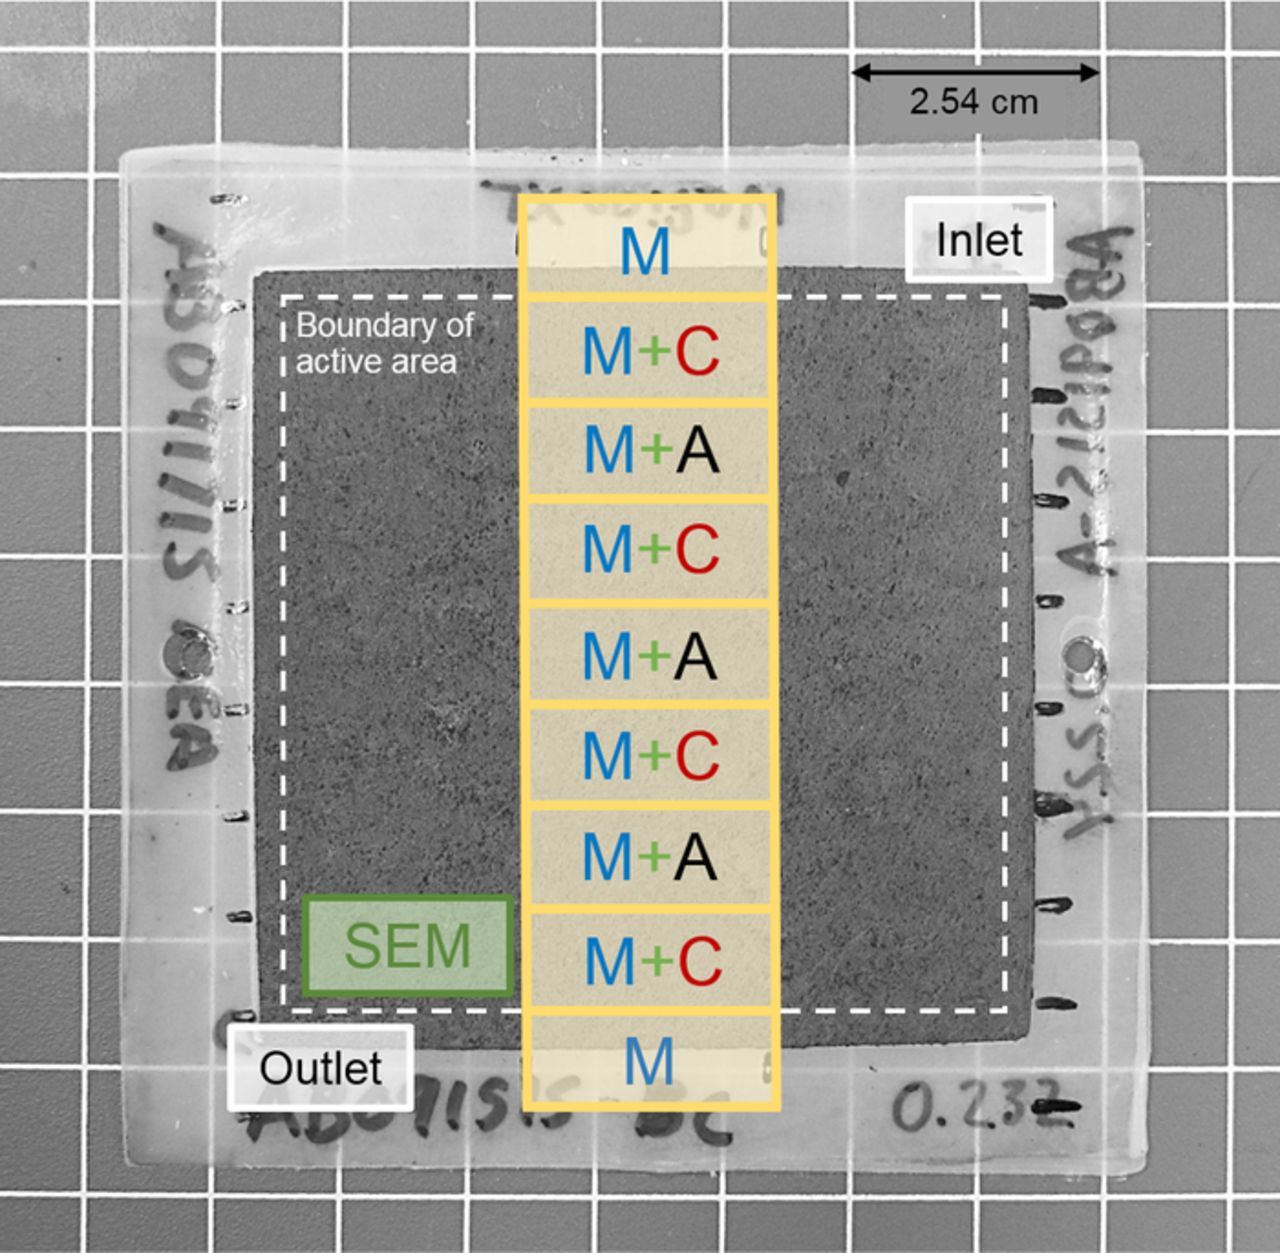
Figure 1. A photograph of a typical MEA after AST; the SEM specimen location is indicated by the green box near the outlet, marked "SEM" and XRF specimen locations are indicated by the yellow boxes. Anode CL, cathode CL, and PEM XRF analysis locations are marked by "A", "C", and "M", respectively.
Cerium contents in the MEAs were measured using nine 2 × 1 cm specimens cut along the center of the MEAs from inlet to outlet as indicated by the yellow boxes in Figure 1. Cerium contents in the PEM and CLs were characterized in air using a Thermo Scientific QUANT'X XRF Spectrometer with a 3.5 mm aperture, an aluminum filter, an accelerating voltage of 12 kV, a tube current of 1.98 mA, and a scan duration of 1 minute. In order to prepare specimens for XRF, the GDL was manually removed from one side of the MEA specimen (Figure 2a) and the specimen was mounted on a PTFE/fiberglass backing sheet (Figure 2b). Then, the corresponding CL was wiped away using isopropyl alcohol (IPA). In order to obtain the cerium concentration in the PEM and opposite CL (CCe, PEM+CL), XRF was performed on the center of the specimen in the area marked by the red ellipse shown in Figure 2c. Next, the specimen was separated from the GDL, flipped, and remounted on the backing sheet (Figure 2d). The opposite CL was removed using IPA to expose the bare PEM (Figure 2e). The cerium content in the PEM (CCe,PEM) was then determined using identical XRF parameters (Figure 2f). Finally, the cerium content of the opposite CL was calculated as:
![Equation ([6])](https://content.cld.iop.org/journals/1945-7111/163/9/F1023/revision1/d0006.gif)

Figure 2. Photographs depicting MEA sample preparation for XRF analysis. In this technique, (a) a GDL is manually removed from one side of the specimen, and (b) the specimen is mounted on a PTFE/fiberglass backing sheet. Then, (c) the corresponding CL is polished away using IPA and XRF is performed on the center of the specimen, as indicated by the red ellipse, in order to obtain the cerium content in the PEM and opposite CL (CCe,PEM+CL). Next, (d) the specimen is separated from the opposite GDL and remounted on the backing sheet. Finally, (e) the opposite CL is removed using IPA and (f) XRF is performed to obtain the cerium content in the PEM (CCe,PEM). The scale of the grid is 1.27 × 1.27 cm.
CCe,PEM was analyzed in every specimen, but due to the nature of the XRF analysis technique, only one CL was analyzed in each specimen. To capture any trends in the spatial variation of CL cerium concentrations down the length of the MEA, anode and cathode CLs were analyzed in alternating order as shown in Figure 1.
Cerium and carbon catalyst support interaction
Wet chemistry was used to investigate interactions between cerium ions in the MEA and carbon catalyst supports in the CLs. In chemically-stabilized MEAs, the cerium to carbon (Ce/C) mass ratio is approximately 0.059. To replicate this ratio ex situ, cerium(III) acetate (Alfa Aesar, 99.9% purity) and carbon black (Cabot VULCAN XC72) were stirred at a mass ratio of 0.1 in excess DI water at 80°C for 16 hours. After mixing, the slurry was sonicated for 20 minutes at 80°C and washed with DI water through a PTFE filter (Millipore, 25 nm pore size) under vacuum. The cerium content in the resulting filtrate was quantified using XRF with identical scan parameters as described in the Post-mortem analysis section. The mass of cerium in the filtrate (MCe,filtrate) was calculated as:
![Equation ([7])](https://content.cld.iop.org/journals/1945-7111/163/9/F1023/revision1/d0007.gif)
where CCe,filtrate is the areal concentration of cerium in the filtrate disk, in mg/cm2, measured using XRF, and Afiltrate is the area of the resulting filtrate disk, in cm2. Then, the Ce/C mass ratio in the filtrate was calculated as:
![Equation ([8])](https://content.cld.iop.org/journals/1945-7111/163/9/F1023/revision1/d0008.gif)
where Mfiltrate is the total mass of the filtrate, in mg.
Carbon black/DI water and cerium acetate/DI water solutions were also prepared and filtered using identical procedures to verify the absence of cerium impurities in the carbon black or cellulose filter, respectively, after the filtering process.
Results and Discussion
MEA degradation during ASTs
The OCV decay rates and electrochemical gas crossover values for the three different ASTs are shown in Figure 3. 100% RH operation resulted in the most stable OCV, which decayed at a rate of 16.5 μV/hr. Over the 2,000 hour duration of the test, gas crossover did not exceed 3 mA/cm2, however, only the first 1,000 hours are shown in Figure 3. 30% RH operation resulted in a substantially higher OCV decay rate of 0.19 mV/hr. At 360 hours, gas crossover surpassed 10 mA/cm2, and at 456 hours, gas crossover exceeded 20 mA/cm2 and the test was terminated. Wet/dry cycling resulted in the most severe OCV decay rate of 0.33 mV/hr, however, gas crossover was stable until 823 hours, when it surpassed 20 mA/cm2 and the test was terminated.
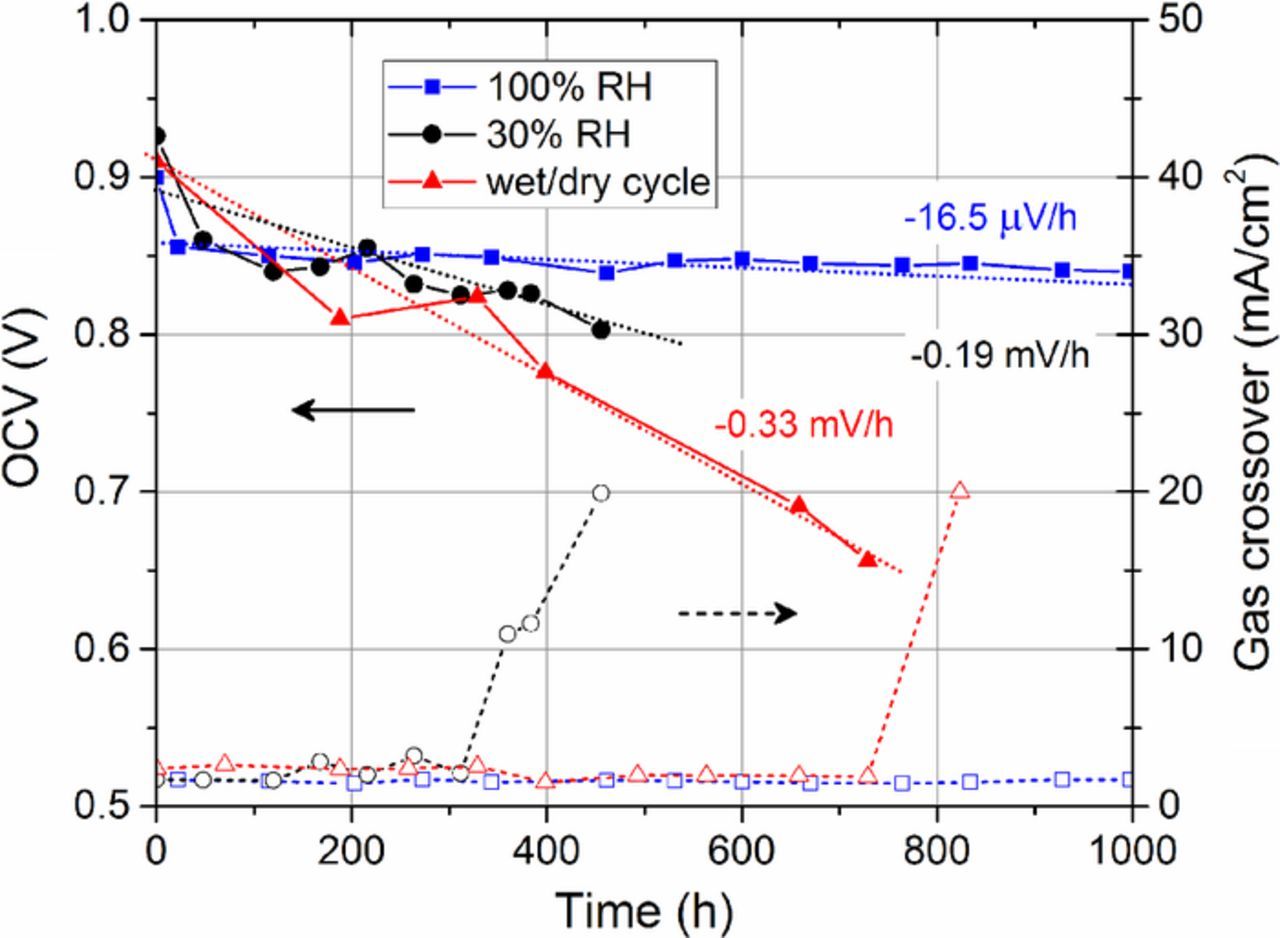
Figure 3. OCV decay and electrochemical gas crossover measured during ASTs.
Significant PEM thinning was also observed during ASTs, as evidenced by cross sectional SEM micrographs (Figure 4). After MEA fabrication, PEM thickness was approximately 25.3 μm (Figure 4a). After 100% RH operation, PEM thickness was reduced to 24.5 μm, which corresponds to a thinning rate of 0.4 nm/hr over the 2,000 hour AST duration (Figure 4b). 30% RH operation resulted in a final PEM thickness of 20.2 μm, which corresponds to a thinning rate of 11.1 nm/hr for 456 hours (Figure 4c). Wet/dry cycling resulted in the most severe thinning. The final PEM thickness was measured at 11.8 μm after crossover failure, which corresponds to a thinning rate of 16.4 nm/hr for 823 hours (Figure 4d).
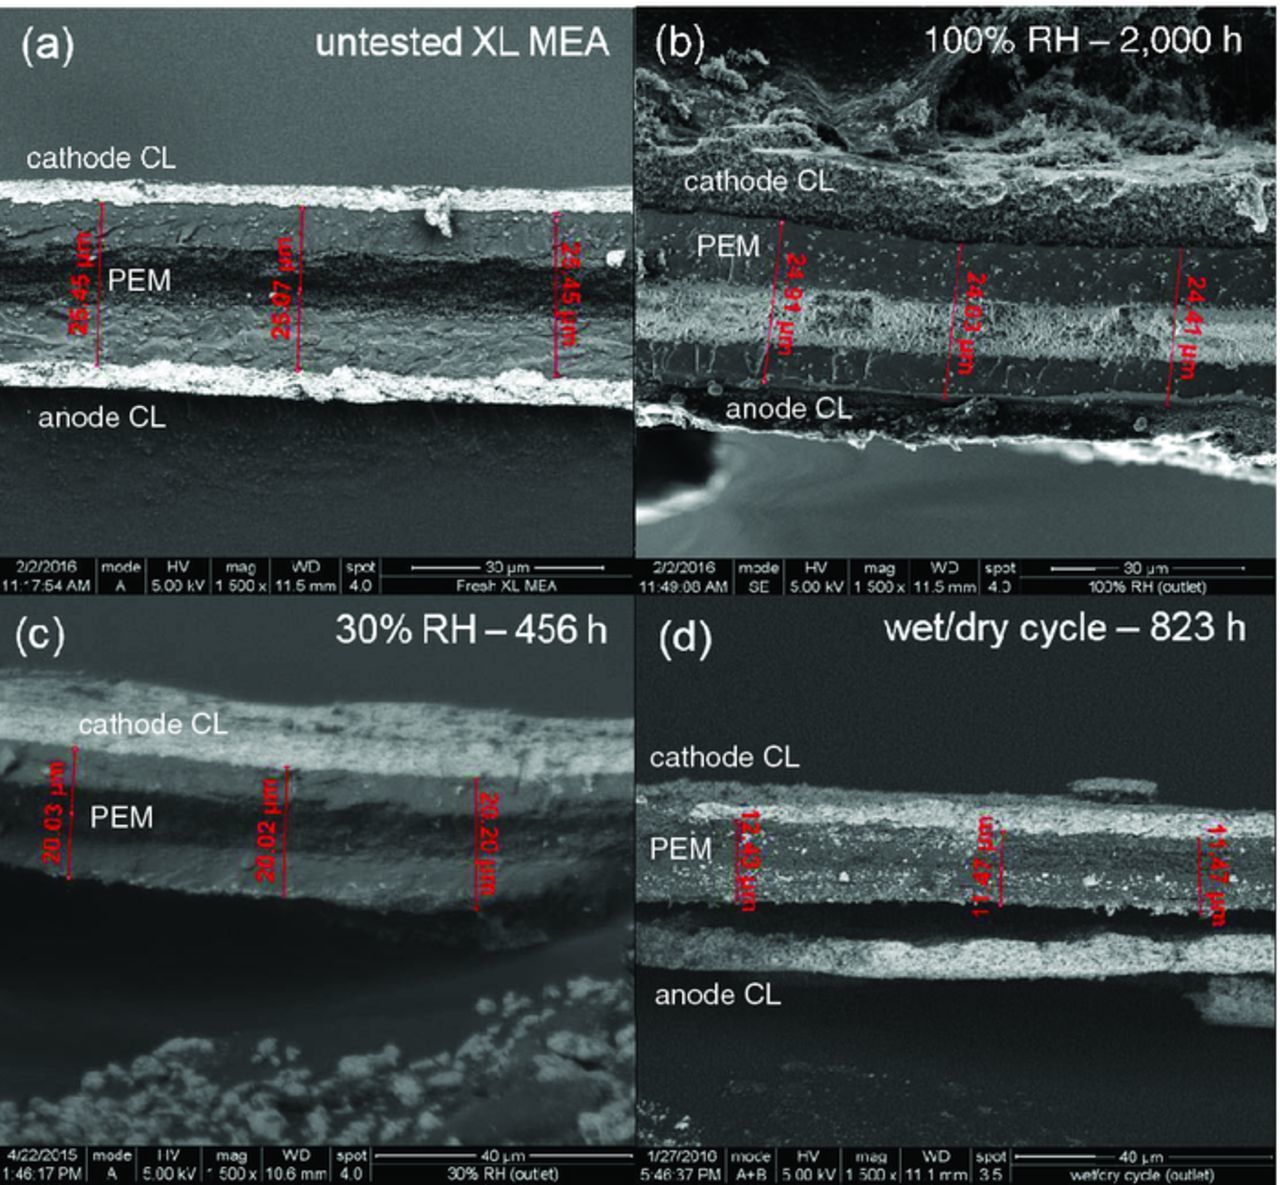
Figure 4. SEM micrographs showing MEA cross sections near the outlet of (a) an untested MEA, and after AST testing with (b) 100% RH, (c) 30% RH, and (d) wet/dry cycling. The cathode CL is near the top of each micrograph.
The average FERs measured in anode and cathode effluent waters during each AST are shown in Figure 5. The total FER was calculated by summing anode and cathode FERs for each AST. 100% RH operation resulted in the lowest FERs, which implies that minimal PEM degradation occurred. In this test, the initial fluoride inventory of 3.8 mg/cm22 was only reduced by 7% after 2,000 hours, which is consistent with the small amount of thinning observed in SEM micrographs (Figure 4b). It is generally accepted that during fully humidified operation, ionomer sulfonic acid end groups are fully ionized, and exist in the inert salt form (–SO3−), which are not susceptible to hydrogen abstraction by HO•.45 Ionomer backbone unzipping is mitigated by pre-treating PEMs with elemental fluorine to remove vulnerable terminal carboxyl groups.46 Therefore, improved stability is expected at 100% RH. The observed FERs, however, may result from other proposed side chain scission mechanisms, which cause cleavage and unzipping of the backbone and are not affected by sulfonic acid solvation.47
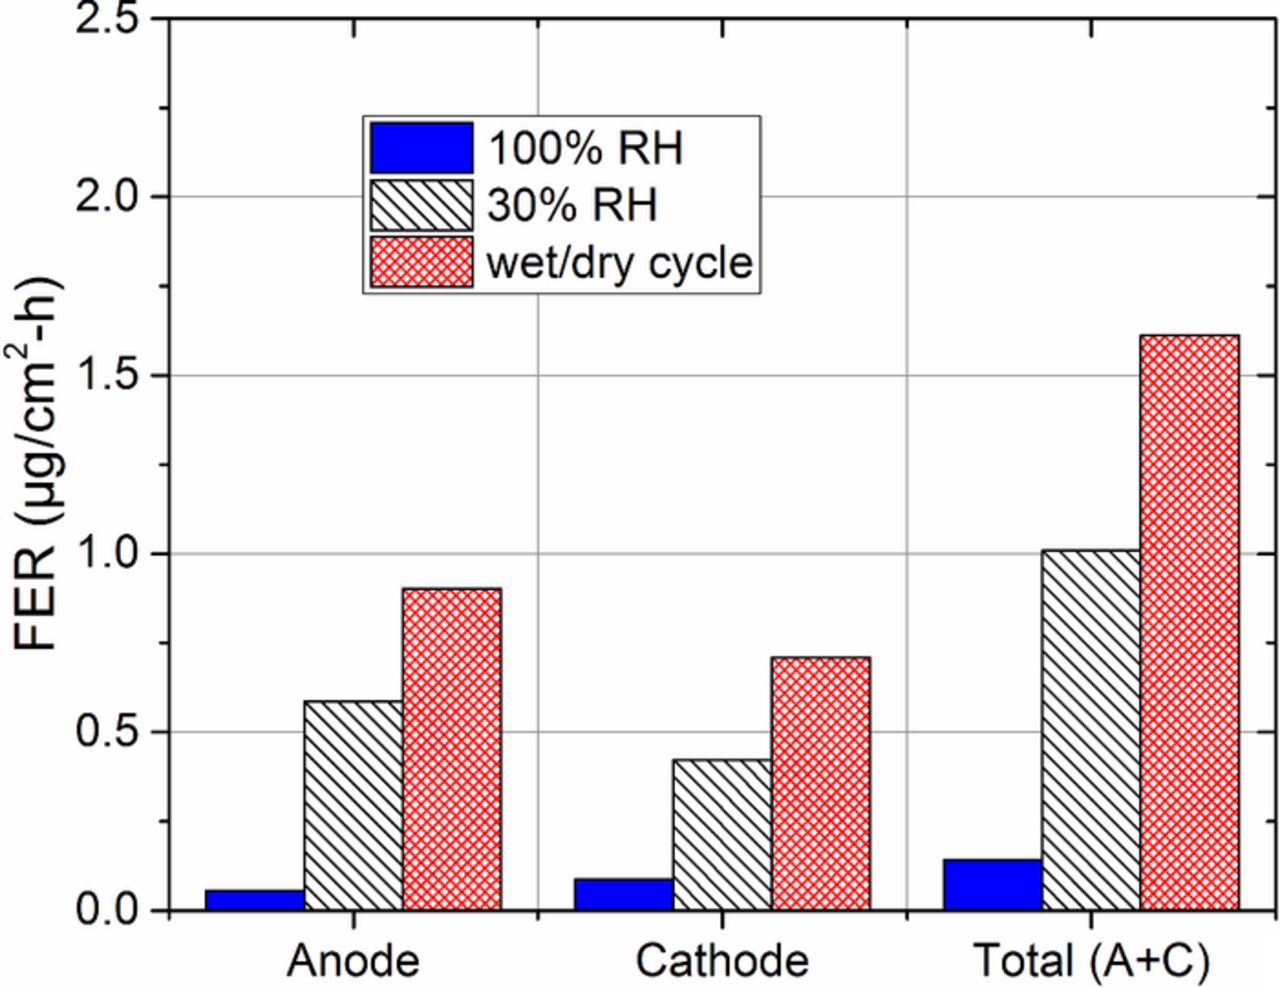
Figure 5. Average fluoride emission rates (FERs) in the anode and cathode effluent waters collected during ASTs, measured using IC. Total (anode + cathode) FERs are also shown. The typical accuracy of this technique is ±5%.44
30% RH operation resulted in significantly increased FERs relative to fully humidified operation, indicating enhanced PEM degradation occurred. During low RH operation, sulfonic acid ionization is reduced in the ionomer, causing acidic protons to reside on the sulfonic acid groups (–SO3H).45 These groups are susceptible to hydrogen abstraction by HO•, which initiates ionomer chain scission and accelerates degradation.45 After the 456 hour test duration, fluoride inventory was reduced by 12%, which is consistent with the moderate thinning observed in SEM micrographs (Figure 4c), however, such fluoride inventory loss and thinning are unlikely to induce crossover-related failure alone.2 Therefore, we infer that the premature failure observed at 456 hours is due to the formation of a local pinhole near the edge of the active area.
Humidity (wet/dry) cycling under OCV conditions resulted in the largest FERs and a 38% reduction of fluoride inventory. These results are consistent with the severe thinning observed in SEM micrographs (Figure 4d). Under these conditions, chemical degradation progresses due to the dry component of the cycle, while the PEM simultaneously experiences enhanced mechanical stresses due to hydrothermal cycling. Due to the synergy of the chemical and mechanical degradation modes, humidity cycling results in larger FERs and PEM thinning than constant RH tests, alone.4,7 In all ASTs, anode and cathode FERs were observed to be uniform.
These results demonstrate that OCV decay rate, PEM thinning rate, and fluoride loss are well correlated. Therefore, we confirm that the aggressiveness of PEM degradation is directly controlled by the prescribed humidification conditions. It is concluded that AST aggressiveness is wet/dry cycling >30% RH ≫ 100% RH.
In-plane cerium migration profiles during ASTs
Figure 6 shows the in-plane cerium area density profiles for each MEA component. During 100% RH operation, anode CL (Figure 6a) and cathode CL (Figure 6b) cerium contents remained nearly zero over the length of the scan, except at the outlet of the cathode. Figure 6c shows that cerium remained in the active area, however, a concentration gradient was observed from inlet to outlet. Additionally, points in the active area of the PEM, which are under the gasket, as indicated by the blue shaded area in Figure 6c, showed cerium area densities of ∼0.0 μg/cm2. Here, migration into the neighboring, ungasketed active area is attributed to in-plane hydration variations due to compression, which will be discussed in the Average through-thickness cerium migration during ASTs section. After 30% RH operation, cerium is reduced uniformly from ∼6.0 to 3.7 μg/cm2 in the active area. The in-plane profiles in both the CLs and PEM are flat (Figures 6a–6c), which indicates that cerium migration from the PEM to CLs occurs only in the through-plane direction. After humidity (wet/dry) cycling, cerium gradients are also observed from inlet to outlet in the anode and cathode CLs, as well as in the PEM (Figures 6a–6c).

Figure 6. XRF measurement of in-plane cerium area density profiles in the (a) anode CLs, (b) cathode CLs, and (c) PEMs, after ASTs; scan direction is from inlet to outlet and is depicted in Figure 1.
In both ASTs where the cell was exposed to 100% RH reactant gasses (100% RH and wet/dry cycling), cerium gradients were generated from PEM inlet to outlet (Figure 6c). These gradients may be explained by water flux which results from in-plane RH gradients within the MEA due to ΔP. Such gradients result in higher RH near the inlet and lower RH near the outlet.
For each AST condition, ΔPs measured on the anode and cathode sides of the cells, along with their corresponding effects on outlet RHs are reported in Table I. ΔPs are ∼10 and ∼25% of anode and cathode outlet pressures, respectively, for each AST. These values correspond to outlet RH levels which are ∼90 and ∼75% of the anode and cathode inlet RHs, respectively. Using these RH values, λ's at cell inlets and outlets were also calculated from ionomer hydration isotherms at 90°C.45
Table I. Pressure drops (ΔP) measured from inlet to outlet at the anode and cathode under AST conditions. The effective pressure drops for wet/dry cycling and outlet RH values were calculated using Equations 1 and 2, respectively. The water content (λ) at the inlet and outlet were estimated from ionomer hydration isotherms at 90°C.45 The change in water content from cell inlet to outlet (Δλ) was calculated as the difference between λinlet and λoutlet.
| ΔP (kPa) | RHoutlet (%) | λinlet (nH2O/SO3H) | λoutlet (nH2O/SO3H) | Δλ (nH2O/SO3H) | |||||
|---|---|---|---|---|---|---|---|---|---|
| AST | Anode | Cathode | Anode | Cathode | Anode/Cathode | Anode | Cathode | Anode | Cathode |
| 100% RH | 6.9 | 27.6 | 93.6 | 78.6 | 12.6 | 10.7 | 7.4 | 1.9 | 5.2 |
| 30% RH | 13.8 | 27.6 | 26.4 | 23.6 | 2.8 | 2.6 | 2.3 | 0.2 | 0.5 |
| Wet/dry cycle | 11.0 | 25.5 | 36.1 | 31.9 | 3.4 | 3.2 | 2.9 | 0.2 | 0.5 |
As shown in Table I, water content (defined as λ = nH2O/n-SO3H) decreases significantly from inlet to outlet during 100% RH operation. Δλ is 1.9 and 5.2 on the anode and cathode side of the cell, respectively. Because of this gradient, water will equilibrate in the PEM from inlet to outlet. We believe that this water flux serves as the driving force for cerium migration toward the outlet, as experimentally observed in Figure 6c. For the 30% RH case, variations in hydration between the inlet and outlet are reduced by an order of magnitude relative to the 100% RH case. Δλ is 0.2 and 0.5 on the anode and cathode, respectively. The flat cerium profiles in the PEM at 30% RH (Figure 6c) suggest that water flux due to this hydration gradient is either small or nonexistent, and, thus, does not influence in-plane cerium migration. Similarly for the wet/dry cycling AST, the average RH over the cycle yields Δλs which are similar to the 30% RH case, yet cerium gradients are still observed from inlet to outlet (Figure 6c). Therefore, we propose that the cerium gradient forms due to exposure to fully humidified reactant gasses during the hydration component of the cycle. Previous results32 suggest that migration driven by concentration gradients or water/proton flux occurs more slowly than water evaporation, itself, which indicates that drying component of the cycle does not significantly affect the location of the cerium.
Average through-thickness cerium migration during ASTs
The average cerium area densities in the anode CL, cathode CL, and PEM were calculated from the in-plane profiles and are shown in Figure 7a. After 2,000 hours of OCV operation at 100% RH, the average cerium content in the active area of the PEM increased from ∼6.0 to 9.8 μg/cm2, while the anode and cathode CL cerium contents increased from 0.0 to 0.95 and 4.6 μg/cm2, respectively (Figure 7a). During this test, total cerium contents in the active area also increased from ∼6.0 to 15.3 μg/cm2.
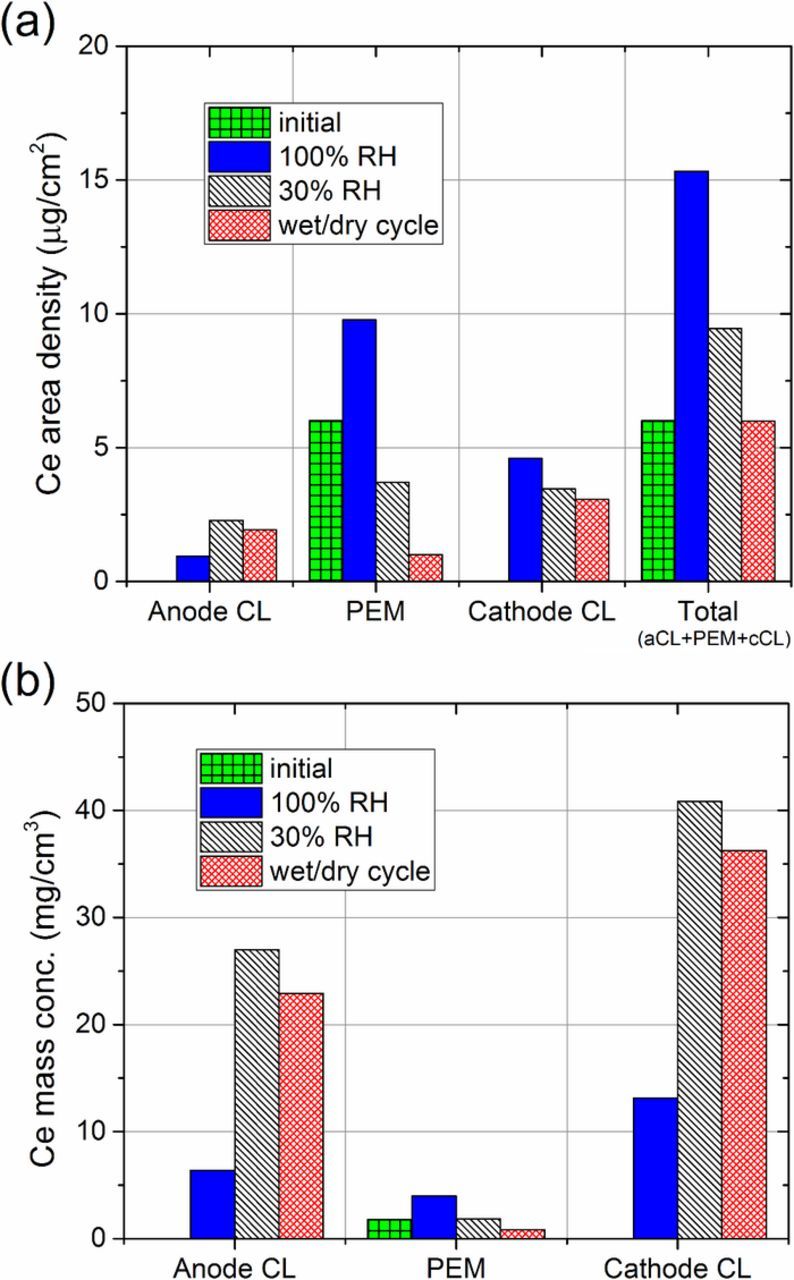
Figure 7. XRF measurement of average (a) area densities and (b) mass concentrations of cerium in the active areas of the anode CLs, PEMs, and cathode CLs after ASTs. Total (anode CL + PEM + cathode CL) area densities are also shown.
After 456 hours of OCV operation at 30% RH, the average PEM cerium area density was reduced from ∼6.0 to 3.7 μg/cm2, while anode and cathode CL cerium area density increased from 0.0 to 2.3 and 3.5 μg/cm2, respectively (Figure 7a). During this test, total cerium in the active area also increased from ∼6.0 to 9.4 μg/cm2. These results are consistent with previous through-plane cerium migration measurements performed using XRF, where a significant portion of PEM cerium migrated into the CLs during low RH operation at OCV.31
Wet/dry cycling for 823 hours resulted in the most significant migration of cerium out of the PEM into the CLs; only 0.99 of the initial ∼6.0 μg/cm2 remained in the PEM, while the anode and cathode CLs each contained 1.9 and 3.1 μg/cm2, respectively (Figure 7a). During this AST, however, total cerium content in the active area remained unchanged.
Total cerium concentration in the active area exceeded the initial concentration of ∼6.0 μg/cm2 after constant-humidity operation at 100 and 30% RH (Figure 7a). PEM hydration is assumed to be 100% RH > 30% RH > wet/dry cycling during ASTs. From Figure 7a, we observe that total cerium content in the active area is correlated to hydration. The increased cerium concentrations result from significant migration from the gasketed, inactive PEM border regions into the active area.
During cell humidification, water equilibrates from the active area into the gasketed region, however, water content there always remains lower than in the active area.48–50 This variation in water content increases the relative cerium concentration in the adjacent border, which subsequently drives its equilibration into the uncompressed, humidified active area via ionic diffusion. Water removal from the edge of the PEM exposed to ambient conditions is minimal. Therefore, we infer that water flux and subsequent cerium migration into the gasketed region are negligible after initial equilibration. Therefore, we conclude that active area hydration, which is dictated by the AST humidification condition, induces in-plane cerium migration, primarily through ionic diffusion.
In all cases, cerium migration into the cathode CL was greater than that into the anode CL (Figure 7). This phenomenon could be an artifact from conditioning the MEAs at 0.6 V before ASTs, where proton and/or water flux may have dragged cerium cations toward the cathode.32,51 In addition, the greater cerium concentrations in the cathode CLs may be explained by net anode to cathode water flux generated by lower cathode hydration (Table I), as discussed in In-plane cerium migration profiles during ASTs section.
Figure 7b shows the cerium mass concentrations in the ionomer region of each MEA component. The mass concentrations of cerium in the PEMs were obtained by normalizing PEM cerium area densities by the final thicknesses of the PEMs after ASTs shown in Figure 4. Mass concentrations of cerium in the CLs were obtained by normalizing cerium area densities to CL ionomer volumes, which were calculated using catalyst loading and I/C mass ratio quantities listed in MEA preparation and cell assembly section. These results demonstrate that cerium concentrations in the CL ionomer significantly exceed those expected by ionic diffusion, alone, especially in the most aggressive AST conditions.
Cerium emissions
Cumulative cerium emissions during ASTs are shown in Figure 8. Cerium washout from the cell was lowest during fully humidified operation, and substantially higher for both dry operation and wet/dry cycling. At the EOT, 100% RH operation results in cumulative total (anode + cathode) cerium emissions of 6.6 ng/cm2, which represents a 0.11% loss of total MEA cerium inventory after 2,000 hours. 30% RH operation results in a cumulative cerium emission of 9.5 ng/cm2, or 0.16% inventory loss at 456 hours. Even without premature pinhole failure, only 0.25% of the cerium inventory would be depleted after 1,000 hours of projected operation at 30% RH. In the most aggressive wet/dry cycling AST, 17.2 ng/cm2 or 0.29% of the total cerium inventory is lost at the EOT at 823 hours. Under OCV conditions, we conclude that cerium loss via washout of the effluent water is insignificant compared to the magnitude of migration within the MEA. However, cell operation under load, which results in significant water generation at the cathode, may result in greater cerium washout due to increased water flux between the CL and flow channels.
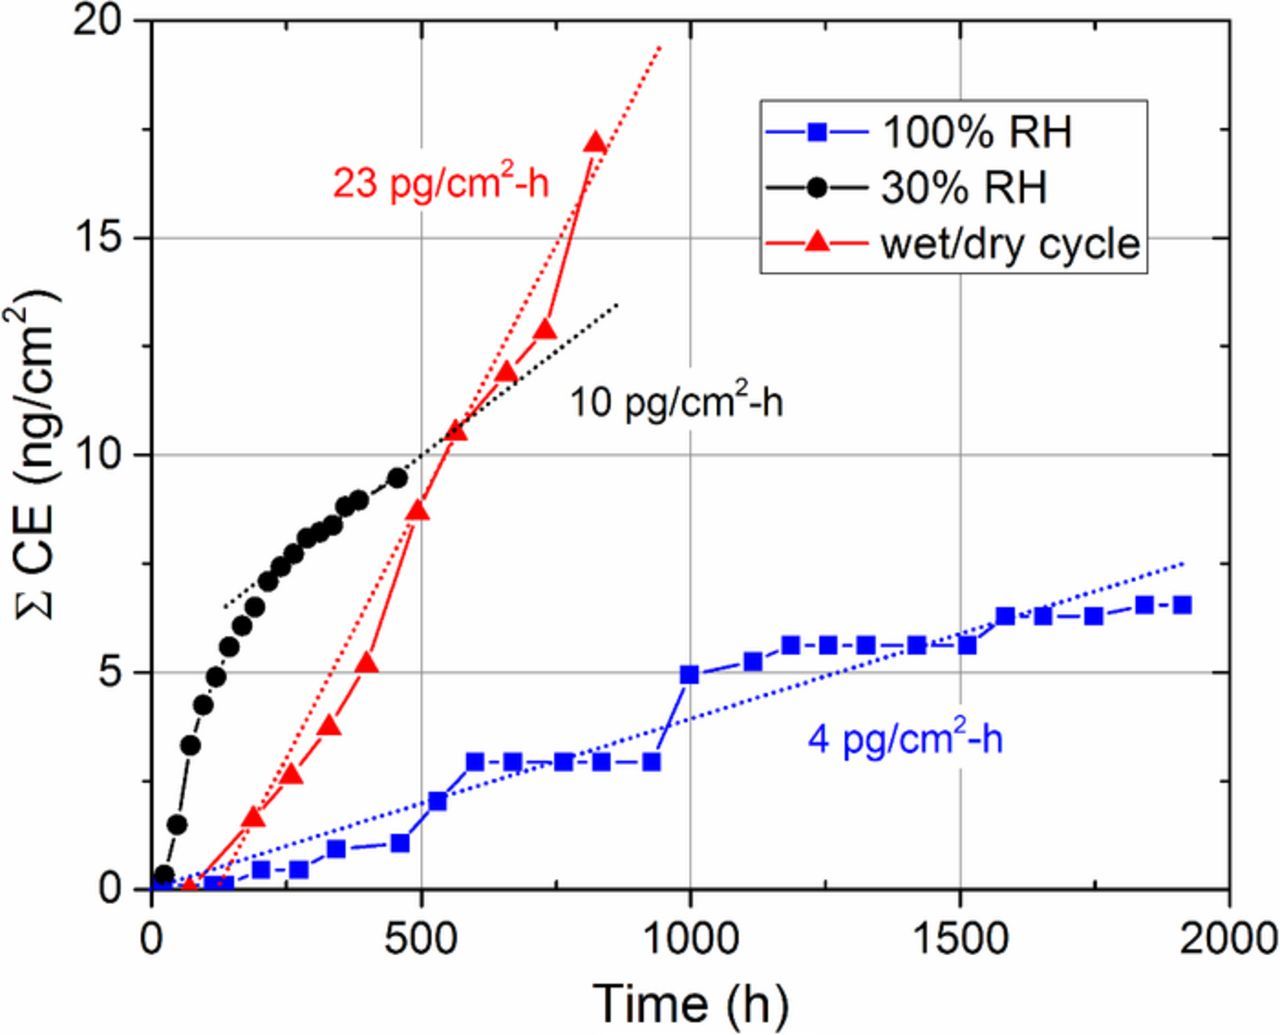
Figure 8. Cumulative total (anode + cathode) cerium emissions (∑ CE) during ASTs and their corresponding cerium emission rates.
Discussion
Cerium migration due to side chain degradation
Figure 9 reveals that the total EOT fluoride and cerium emissions are correlated. Therefore, it is proposed that the cerium measured in the effluent fuel cell water streams exists in the form of cerium cations exchanged with ionomer degradation products. While cerium-exchanged sulfonic acid groups, themselves, are not susceptible to radical attack,52 any side chain scission will result in complete decomposition of the main chain and side chains associated with that ionomer molecule.2 As a result, neighboring, cerium-exchanged sulfonic acid groups will be expelled into effluent water streams along with HF and fluorinated polymer fragments. While total cerium washout from the MEA is negligible at OCV, this correlation provides insight into an additional mechanism for cerium migration: during ASTs, cerium is mobilized within the MEA as a result of ionomer decomposition.
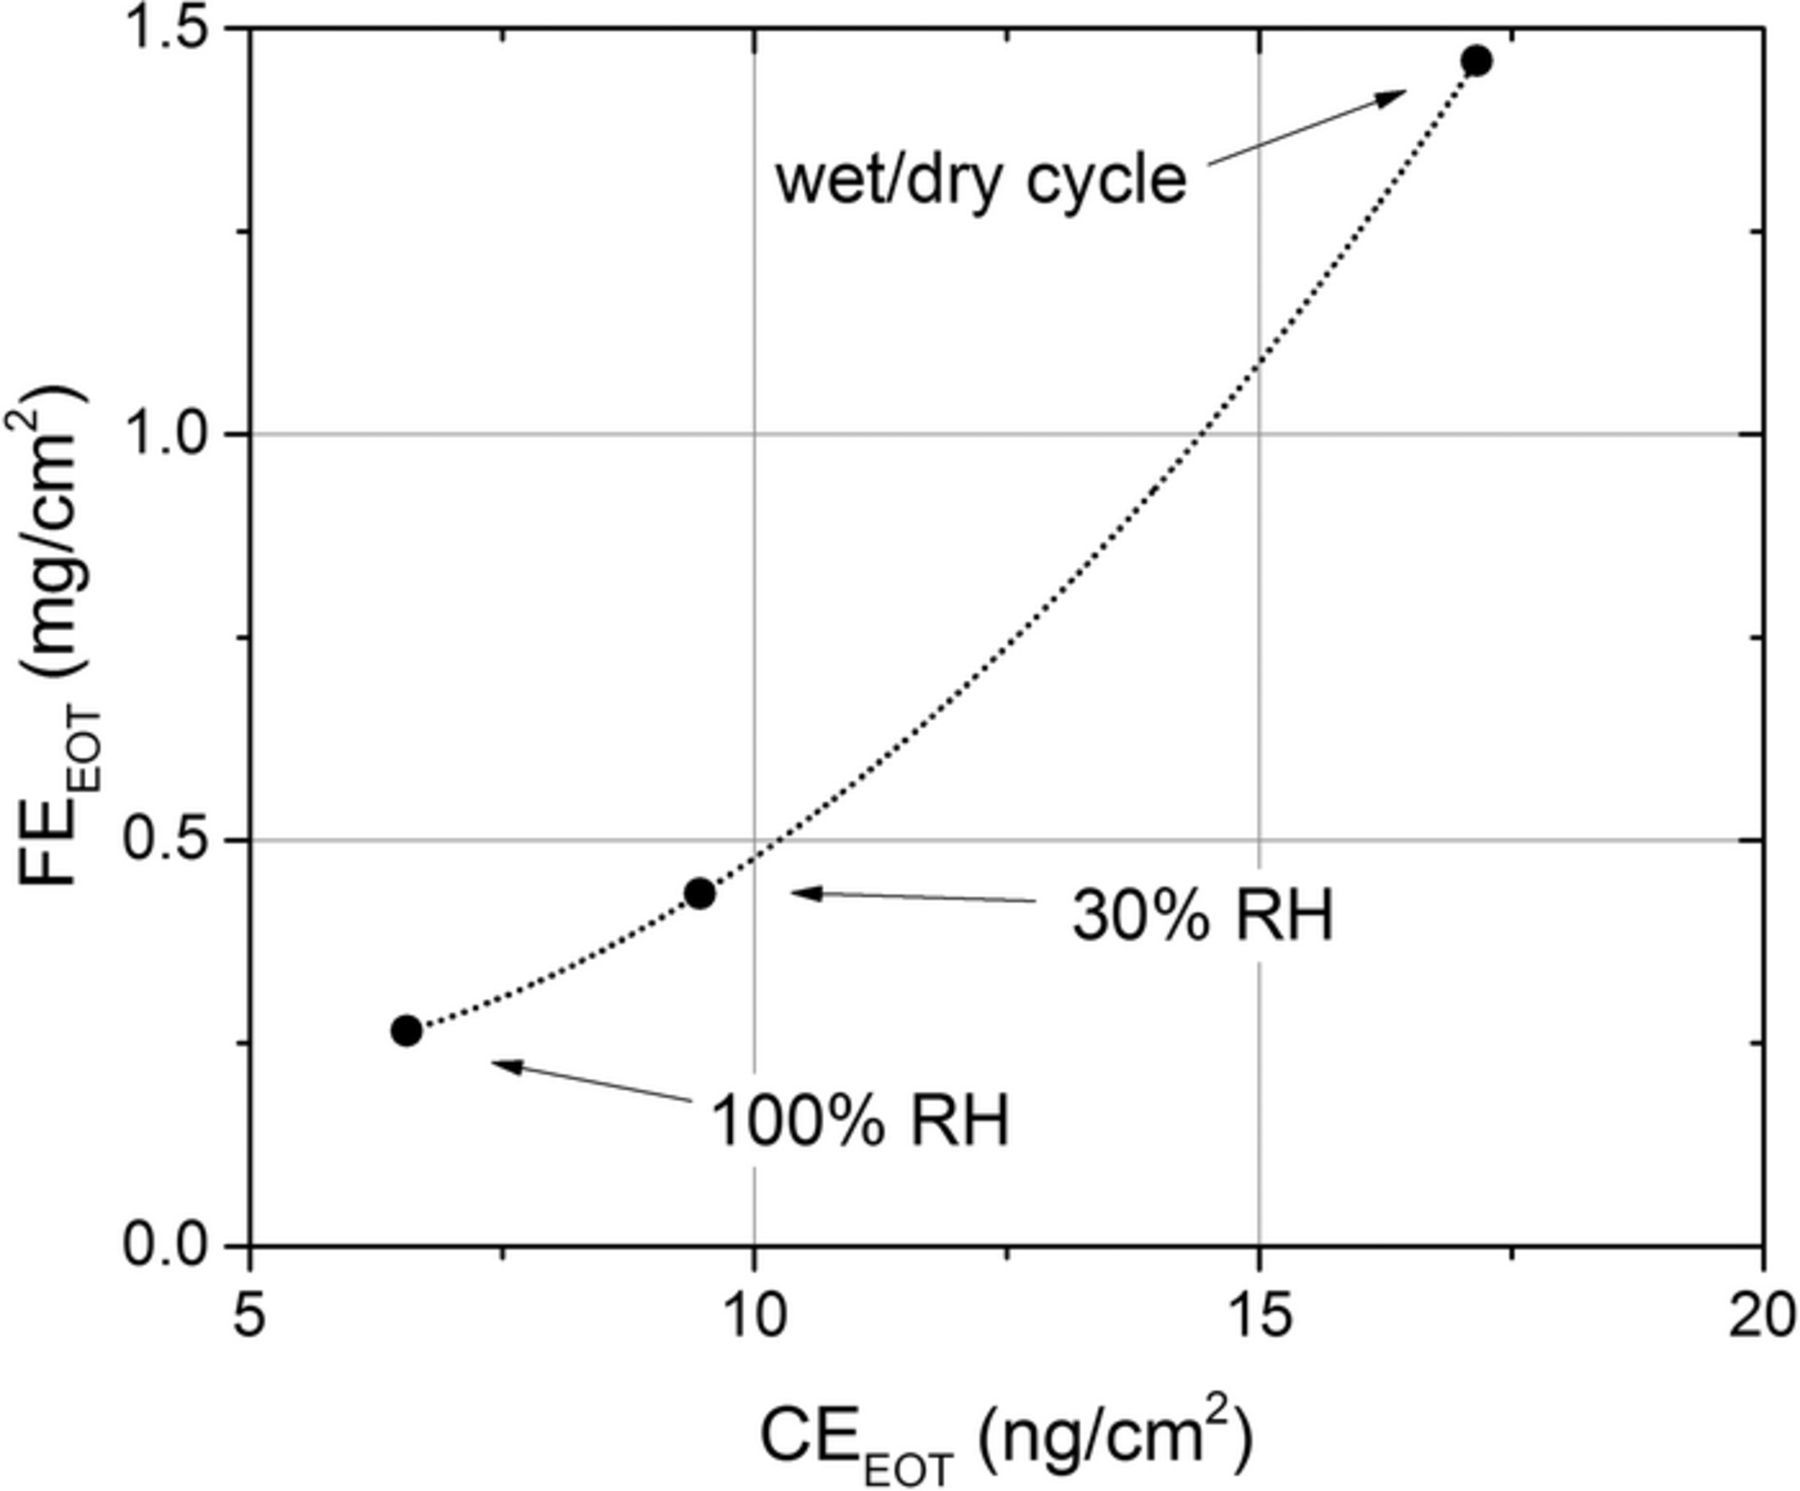
Figure 9. Relationship between total end-of-test fluoride (FEEOT) and cerium (CEEOT) emissions after ASTs.
Cerium stabilization on CL catalyst supports
Figure 10 reveals a strong inverse correlation between FER and the remaining cerium concentration in the PEM. This trend exists for both cerium area densities (Figure 10a) and mass concentrations (Figure 10b), which were obtained by normalizing area density measurements by the final thicknesses of the PEMs after ASTs shown in Figure 4. These correlations imply a relationship between cerium migration and degradation.

Figure 10. Relationship between total (anode + cathode) FERs and the residual (a) area densities and (b) mass concentrations of cerium in the PEMs after ASTs.
Cerium may initially partition from PEM into CLs due to concentration gradients and water/proton flux, as described in the Average through-thickness cerium migration during ASTs section. The reduced availability of radical scavengers in the PEM after migration could then lead to enhanced degradation in areas depleted of cerium. However, according to Figure 7b, the concentrations of cerium in the CLs significantly exceed expected values due to concentration gradients and water/proton flux, alone.
Therefore, an additional migration mechanism is proposed, whereby cerium is expelled from the PEM bound by a degradation product as explained in the Cerium migration due to side chain degradation section. In the PEM, the cerium to fluoride (Ce/F) ratio is ∼1/1000,2 however, Figure 8 shows that the Ce/F ratio is reduced to ∼1/30,000 in the effluent water. Therefore, a large portion of the cerium mobilized by degradation is subsequently stabilized within the MEA, instead of being removed from the cell. We propose that cerium and/or cerium-exchanged ionomer degradation products interact with the surface of the carbon catalyst supports in the CLs.54
In ex situ experiments, model fuel cell carbon compounds were mixed into cerium solutions at typical MEA concentrations in excess DI water. After filtering, it was observed that the Ce/C mass ratio in the filtrate is 0.043. This ratio is interpreted to signify that one mass unit of cerium is adsorbed on every 23 units of carbon. Cerium and carbon concentrations in the cathode CLs after ASTs (Figure 7a), correspond to Ce/C ratios between 0.029 and 0.043. Therefore, it is plausible that carbon catalyst supports have the capacity to adsorb the quantities of cerium measured in the CLs after ASTs. While the ex situ experiments do not fully replicate the chemistry of operating fuel cells, the results provide evidence for a possible mechanism for interaction between cerium and the carbon catalyst support particles. The nature of this mechanism is currently under investigation.
Conclusions
In this work, XRF was used to quantify cerium migration after AST operation at OCV under different humidification conditions. These conditions characterize AST aggressiveness, and strongly influence both in-plane and through-thickness migration.
Fully humidified operation results in significant cerium diffusion from the PEM border region into the active area. Cerium remains in the active area, but water flux from inlet to outlet generates in-plane cerium concentration gradients. Dry operation results in moderate cerium migration into the active area, however, within the active area, migration is dominated by uniform diffusion from the PEM to the CLs. Cycling between wet and dry reactant gases does not result in significant cerium migration into the active area. However, such conditions also generate in-plane concentration gradients in both the PEM and CLs. In addition, a greater quantity of cerium migrates from the PEM into the CLs than observed during dry operation alone.
During ASTs, cerium washout from the MEA into effluent waters was measured using ICP-MS. The most aggressive AST resulted in <0.5% cerium inventory loss, which is insignificant compared to the magnitude of migration within the MEA. While cerium washout is negligible at OCV, fluoride and cerium emissions in the effluent water are correlated, which suggests that the cerium measured in the effluent water is bound by a product released during ionomer side chain degradation.
FER is inversely correlated to residual cerium in the membrane, which implies a relationship between PEM degradation and cerium migration from the PEM into the CLs. It is proposed that cerium moves from the PEM into the CLs due to humidification conditions and degradation, and is subsequently stabilized there through an interaction with the carbon catalyst supports.
Cerium migration within the MEA has significant implications for cell performance and durability. The millimeter-scale, in-plane migration away from the inlet, as observed during 100% RH and wet/dry cycling ASTs (Figure 6c), could increase the susceptibility of ionomer there to radical attacks due to local depletion of radical scavengers. Increased in-plane cerium concentrations near the PEM outlet, as observed during the 100% RH case (Figure 6c), can also result in local, albeit minor, performance losses.13 More substantially, however, through-thickness cerium migration into the CLs greatly decreases cell performance by decreasing proton conductivity and increasing mean proton transport length in the CL ionomer.33–35 Therefore, material and control-level approaches for cerium stabilization in the PEM must be investigated. High aspect ratio compounds such as MWCNTs21–55 may be used as a support to reduce radical scavenger mobility. More effective scavengers, such as small, non-stoichiometric, ceria-based compounds22,56 may also be employed to further reduce degradation and subsequent migration. In addition, control schemes which reduce RH cycling and excursions into high or low RH operating regimes could be applied to minimize cerium migration.
Successful cerium stabilization will enable its localization to areas of high radical generation, which are most susceptible to radical attack, while mitigating performance losses due to cathode CL cerium poisoning. These improved systems will enhance PEM fuel cell durability and reduce lifetime costs, in order to address current barriers to commercialization.
Acknowledgments
The authors thank the U.S. Department of Energy, Office of Energy Efficiency and Renewable Energy, Fuel Cell Technologies Office (EERE-FCTO) for financial support, including Nancy Garland (Technology Manager) and Dimitrios Papageorgopoulos (Fuel Cells Team Leader). We acknowledge Dennis Torraco (LANL) and Stefan Williams (LANL) for assistance with AST testing and XRF, respectively. Prof. Ajay Prasad and Prof. Suresh Advani also acknowledge support from the University of Delaware's Fuel Cell Bus Program. This program is funded by the Federal Transit Administration at the Center for Fuel Cell Research at the University of Delaware.