Abstract
Herein, an investigation of the impact of the dopant and carbon content in iron-doped zinc oxide/carbon composites is presented. For this purpose, a comprehensive morphological, structural, and electrochemical characterization of a series of different compounds is reported, including techniques like X-ray diffraction (XRD), transmission electron microscopy (TEM), inductively coupled plasma optical emission spectroscopy (ICP-OES), thermogravimetric analysis (TGA), specific surface area using the Brunauer-Emmett-Teller (BET) algorithm, pycnometry, small-angle X-ray scattering (SAXS), cyclic voltammetry (CV), and galvanostatic cycling. The obtained results reveal an impact of the iron-dopant content on the crystallite and particle size as well as the detailed de-/lithiation mechanism. The effect on the cycling stability, however, appears to be rather minor. The carbon coating content, on the contrary, has a significant influence on the cycling stability and rate capability. According to these results, a carbon content of about 10 wt% is sufficient to achieve stable cycling at lower current densities, while a carbon content of 15–20 wt% allows for specific capacities of 425–500 mAh g−1, when applying a specific current of 1 A g−1, for instance.
Export citation and abstract BibTeX RIS

This is an open access article distributed under the terms of the Creative Commons Attribution Non-Commercial No Derivatives 4.0 License (CC BY-NC-ND, http://creativecommons.org/licenses/by-nc-nd/4.0/), which permits non-commercial reuse, distribution, and reproduction in any medium, provided the original work is not changed in any way and is properly cited. For permission for commercial reuse, please email: oa@electrochem.org.
Despite the tremendous commercial success of lithium-ion batteries for a wide variety of applications – ranging from small-scale portable electronics to electric bikes and scooters and, recently, electric vehicles – further enhanced energy and power densities are needed for the realization of a fully electrified public and private transport.1–4 While optimized cell designs and battery engineering have a great impact on such improvement, the next great leap forward will require the implementation of new battery chemistries. With regard to the anode side, most research activities within the past years have focused on replacing graphite by alloying or conversion materials, which commonly allow for substantially higher specific capacities.5–7 However, both material classes suffer intrinsic challenges like dramatic volume variations upon de-/lithiation (particularly in case of alloying materials) and relatively wide lithium reaction potentials, accompanied by a substantial voltage hysteresis between charge and discharge (especially in case of conversion materials), resulting in rapid capacity fading of the corresponding electrodes, comparably lower specific energies, and improvable energy storage efficiencies, respectively.5–7 In an attempt to overcome these challenges, we have recently reported a new class of materials – transition metal-doped metal oxides – for which the reduced transition metal (i.e., upon lithiation) enables the reversible formation of Li2O, i.e., the conversion reaction. Additionally, the metal itself can form a lithium alloy.8–12 Within this materials' class a particular focus was, so far, set on Fe-doped ZnO with a Zn:Fe ratio of 9:1, providing a theoretical specific capacity of 966 mAh g-1.8,9,12 While the nanoparticulate nature of these particles, originating from the utilization of sucrose as sterically shielding chelating agent,8,13 allows for shorter ion and electron transport pathways as well as decreased mechanical strain upon volume variation,14–23 the enlarged electrode/electrolyte interface also results in an increased incidence of parasitic side reactions with a detrimental impact on the de-/lithiation mechanism.17,19,23–26 One approach to overcome this latter issue is the application of a carbonaceous coating, simultaneously stabilizing the electrode/electrolyte interface by forming a suitable solid electrolyte interphase (SEI), enhancing the electronic conductivity within the electrode composite, buffering the occurring volume changes, and preventing particle agglomeration upon electrode fabrication and cycling.8,27–33 As a result, the performance of Zn0.9Fe0.1O was substantially improved when applying a carbonaceous coating (∼18.5 wt%).8,32 Nonetheless, a question that remained in this regard is: How much carbon is required to efficiently enhance the electrochemical performance of such materials, considering that large amounts generally lead to decreased overall capacities? And in the same context, though more fundamental, a second question appears: How much iron (or generally transition metal) is needed in the structure to enable the reversible formation of Li2O, as it does not alloy with lithium once reduced to the metallic state?
To address these two questions, we performed herein, in a first step, a detailed investigation of a series of Zn1-xFexO samples, varying x from 0.02 up to 0.12 and focusing on the impact of the dopant ratio on the materials' properties and their suitability as alternative lithium-ion anodes. In a second step, we fixed the iron ratio and varied the carbon content for realizing the optimum cycling performance and high rate capability. The results reveal that the dopant ratio not only affects the particle size, but moreover the detailed de-/lithiation mechanism, while the carbon coating content – above a certain threshold – basically impacts the rate performance of such active materials.
Experimental
Synthesis of Fe-doped zinc oxide
Fe-doped zinc oxide was synthesized by dissolving stoichiometric amounts of zinc (II) gluconate hydrate (abcr) and iron (II) D-gluconate dihydrate (Aldrich) in ultrapure water, considering the targeted dopant ratio. The total metal ion concentration was 0.2 M. The solution was added dropwise to an aqueous solution (1.2 M) of sucrose (Fluka). After continuous stirring at room temperature for 15 min, the solvent was evaporated at 160°C. To further dry the syrup-like solution and start the thermal degradation of the comprised sucrose, the temperature was increased to about 300°C. Subsequently, the remaining solid precursor was calcined in a tubular furnace (Nabertherm R50/250/12) under ambient atmosphere for 3 h at 450°C, applying a heating rate of 3°C min-1.
Carbon coating
For the application of a carbonaceous coating, the ground active material was dispersed in a solution of sucrose in ultrapure water. In order to study the influence of the carbon coating on Zn0.9Fe0.1O, i.e., the amount of carbon in the final composite, the weight ratio between the active material and sucrose was varied from 1:1 over 4:3 and 2:1 up to 4:1. The dispersion was homogenized by means of a planetary ball mill (Vario-Planetary Mill Pulverisette 4, Fritsch) using the following milling conditions: 2×45 min at 400/-800 rpm with 10 min rest in-between. Subsequently, the mixture was dried at 80°C under ambient atmosphere. After grinding, the obtained powder was annealed at 500°C for 4 h under a constant argon gas flow of about 750 mL min-1. The heating rate was set to 3°C min-1. Finally, the composite was ground again.
Electrode preparation
For the electrode preparation, the binding agent, sodium carboxymethyl cellulose (CMC, Dow Wolff Cellulosics), was dissolved in 1 to 2 mL of ultra-pure water. Subsequently, the conductive agent carbon black (Super C65, Imerys) and the active material were added. The composition of the dry electrode was 75 wt% of active material, 20 wt% of conductive carbon, and 5 wt% of binder. The dispersion was mixed by planetary ballmilling in a 12 ml zirconia jar with three 10 mm and eighteen 5 mm zirconia grinding balls. The following milling procedure was used: 4 × 30 min at 400/−800 rpm with each 10 min rest in-between. Subsequently, the resulting slurry was cast onto a sheet of dendritic copper foil (Schlenk) using a doctor blade (BYK Additive & Instruments) with an adjusted wet film thickness of 120 μm. The electrode sheets were first dried at 80°C for about 10 min in a laboratory oven (Binder) and then at room temperature overnight. Disc electrodes with a diameter of 12 mm were punched using a high precision puncher (Hohsen) prior to the final vacuum drying at 120°C for 24 h in a glass oven (Büchi B585). The average active material mass loading was about 1.5–2.5 mg cm−2.
Morphological, structural, and chemical characterizations
X-ray diffraction (XRD) was conducted employing a Bruker D8 Advance equipped with a one-dimensional position-sensitive-detector Lynx-Eye and a Cu-Kα1 X-ray source (λ = 154 pm) in Bragg Brentano geometry. The step size was set to 0.0092°.
The metal-ion concentration of the as-synthesized samples was determined by inductively coupled plasma optical emission spectroscopy (ICP-OES). For this purpose, the samples were dissolved in hot hydrochloric acid and analyzed by performing a double determination using a Spectro Arcos from Spectro Analytical Instruments with axial plasma view. To determine the residual carbon content for the carbon-coated samples, TGA was conducted under oxygen atmosphere using a TA Instruments Discovery TG. After a 30 min isothermal rest period at 40°C, the temperature was increased to 850°C, applying a heating rate of 5°C min-1. Transmission electron microscopy (TEM) was performed on a Philips CM 20 at an accelerating voltage of 200 kV. The samples were deposited on a copper grid, coated with a holey carbon film. The specific surface area was determined by means of an ASAP 2020 surface and porosity analyzer (Micromeritics). The bulk density of the as-synthesized samples was measured utilizing a Quantachrome Micro-UltraPyc 1200e and helium as analysis gas. Small-angle X-ray scattering (SAXS) was performed employing a modified Kratky camera.34,35 The data analysis includes several steps as the subtraction of the background, the so-called desmearing to correct the slit length effect, and the fitting of the data applying a unified fit according to Beaucage et al.36 The fit is based on the sum of local scattering laws at different structural levels. In case of the measurement presented in this work, the primary particle level was analyzed. The fit of the data provides various sample parameters including the gyration radius of the primary particles Rg. Assuming a spherical geometry, the particle diameter D can then be directly calculated from Rg.
Electrochemical characterization
For the electrochemical characterization, three-electrode Swagelok-type cells were assembled, comprising the prepared electrodes as working electrode and metallic lithium foils (Rockwood Lithium, battery grade) as counter and reference electrodes. The electrodes were separated by polypropylene fleeces (Freudenberg FS 2190) soaked with a 1M solution of LiPF6 in a 3:7 (wt) mixture of ethylene carbonate and diethyl carbonate (UBE). Galvanostatic cycling was performed using a Maccor Battery Tester 4300, setting the discharge and charge cutoff potentials to 0.01 and 3.0 V (vs. Li/Li+), respectively. Prior to the test, the cells were stored in a climatic chamber at 20 ± 2°C for 24 h. Cyclic voltammograms were recorded using a VMP multichannel potentiostat (Biologic), applying a scan rate of 50 μV s-1 and setting the reversing potentials to 0.01 and 3.0 V vs. Li/Li+. Again, before starting the test procedure, the cells were allowed to rest for 24 h in a climatic chamber at 20 ± 2°C.
Results and Discussion
Influence of the dopant ratio
The optimization of the dopant ratio in hybrid conversion/alloying anode materials is of particular interest, as the dopant itself is not contributing to the specific capacity arising from the alloying process but only to that from the conversion process. Nevertheless, only the incorporation of the transition metal dopant into the ZnO lattice enables the fully reversible formation of Li2O.8 The observation that a simple compounding of the respective oxides does not show the same effect, as a matter of fact, further confirms this conclusion.37–40 Accordingly, reducing the dopant concentration to the minimum value appears beneficial. For this purpose, ZnO was doped with varying amounts of iron, ranging from 2 over 4, 6, 8, and 10, up to 12 mol%. As demonstrated in Figure 1, the different Fe concentration is already visible by the decrease of the orange coloration with decreasing Fe content. In a next step, XRD analysis was performed to investigate the impact of the dopant ratio on the crystalline structure. As apparent from Figure 2, all samples are phase-pure within the XRD detection limits. Besides, it is evident that the reflection intensity rises with decreasing iron contents, indicating an increasing crystallite size. Such a dependence of the crystallite growth on the dopant ratio is, in fact, a common phenomenon, related to an increased effective crystallite surface energy for increasing dopant concentrations, leading to hampered crystallite growth.41 The targeted Zn:Fe ratio was confirmed by ICP-OES analysis and the results are summarized in Table I. The BET analysis (see also Table I), showing a decreasing surface area for an increasing Fe content, indicates that the trend for the crystallite size observed by means of XRD (Figure 2) is also reflected in the particle size. Also, the slight variation for the materials' true density (Table I, right column) is well within the experimental error, particularly considering the nanoparticulate nature of the samples, and close to the literature value for pure ZnO (5.6 g cm−3). The slightly lower density may be assigned to the introduction of ionic vacancies, resulting from the different oxidation state of the doping agent (Fe3+) and the zinc cation (Zn2+) in the hexagonal wurtzite structure.9 The dependence of the primary particle size on the Fe content was further studied by carrying out SAXS (Figure 3), which also reveals a decreasing particle diameter for an increasing dopant ratio, thus, affirming the trend observed for the XRD and BET analysis. Moreover, the analysis of the scattering curves at small scatter vectors indicates that the primary particles are present as fractal aggregates (Figure S1). The fractal dimensions of these aggregates range between 1.3 and 1.5. Accordingly, the samples show an open aggregate structure independent of the dopant content. Finally, the samples were investigated by means of TEM and selected micrographs as well as the corresponding statistical analysis of the particle size distribution are presented in Figure 4. Generally, all samples show an approximately spherical particle shape and a rather homogeneous particle size distribution (Figures 4a, 4c, and 4e). A statistical evaluation of the latter reveals, once more, the trend observed by XRD, BET, and SAXS analysis: With an increasing dopant concentration, the particle size decreases. More precisely, the median for the Zn0.90Fe0.10O particle size distribution is 8 nm (Figure 4b), rising to 11 nm for Zn0.94Fe0.06O (Figure 4d), and 14 nm for Zn0.98Fe0.02O (Figure 4f), when neglecting the outliers. In addition to this general trend regarding the average particle diameter, it appears that the particle size distribution is slightly narrower for higher iron ratios, which may be related to the varying crystallite growth kinetics.
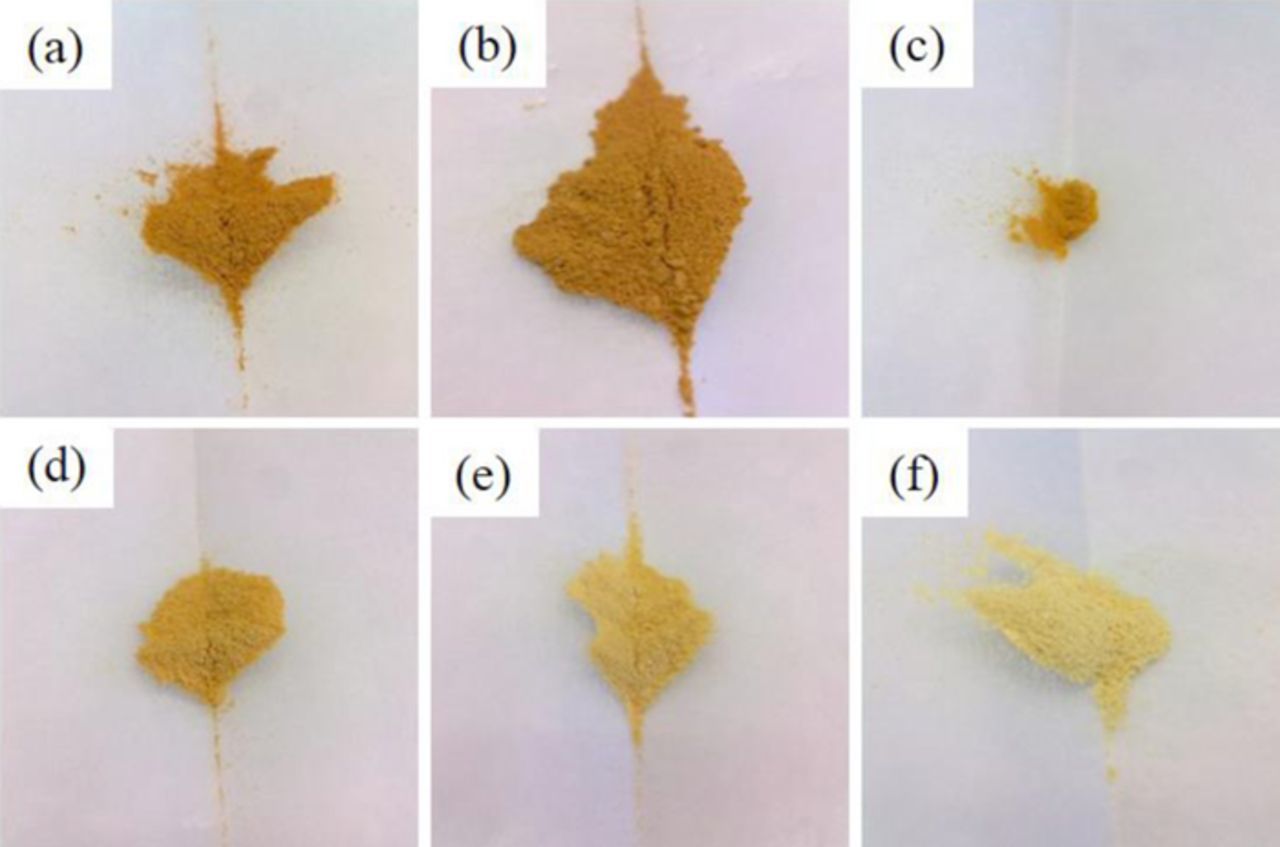
Figure 1. Photographs of Fe-doped ZnO with different Fe-dopant ratios: (a) Zn0.88Fe0.12O, (b) Zn0.90Fe0.10O, (c) Zn0.92Fe0.08O, (d) Zn0.94Fe0.06O, (e) Zn0.96Fe0.04O, and (f) Zn0.98Fe0.02O.
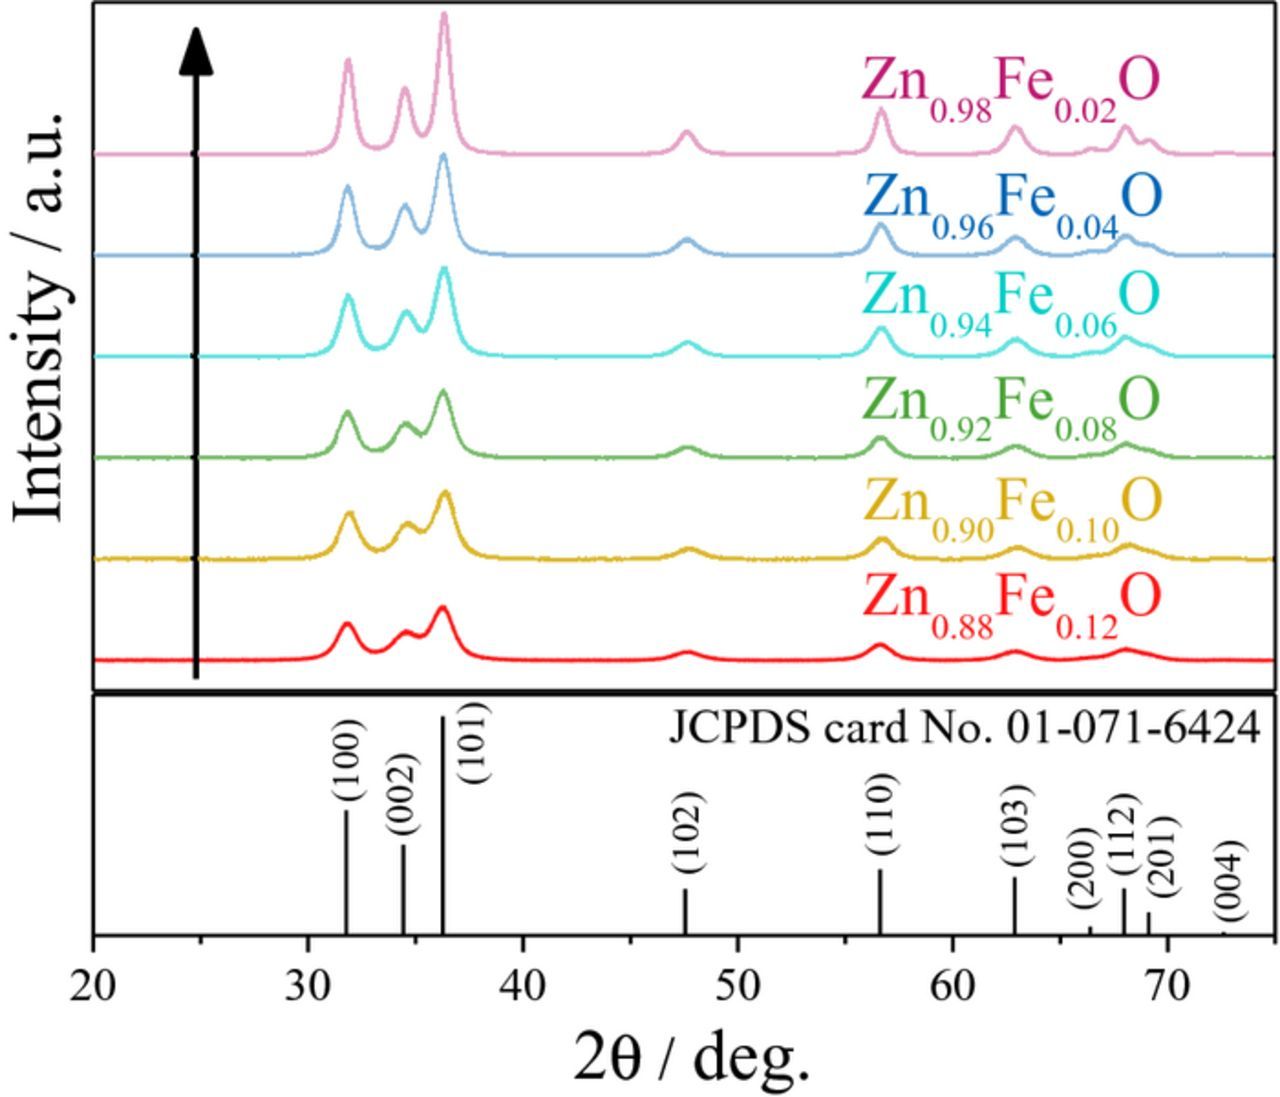
Figure 2. XRD patterns of as-prepared Zn0.88Fe0.12O (red), Zn0.90Fe0.10O (yellow), Zn0.92Fe0.08O (green), Zn0.94Fe0.06O (cyan), Zn0.96Fe0.04O (blue), and Zn0.98Fe0.02O (purple) in the 2θ range from 20 to 75°; as reference, wurtzite ZnO (JCPDS card No. 01-071-6424) is given in the bottom.
Table I. Molar concentration of Zn and Fe, as obtained by ICP-OES analysis, BET surface area, and density for the Fe-doped ZnO samples having different Fe-dopant concentrations.
| Sample | Molar concentration (Zn)/g mol−1 | Molar concentration (Fe)/g mol−1 | BET surface area/m² g−1 | Density/g cm−3 |
|---|---|---|---|---|
| Zn0.88Fe0.12O | 0.88 ± 0.01 | 0.12 ± 0.01 | 94 ± 2 | 5.5 ± 0.1 |
| Zn0.90Fe0.10O | 0.90 ± 0.01 | 0.10 ± 0.01 | 90 ± 2 | 5.4 ± 0.1 |
| Zn0.92Fe0.08O | 0.92 ± 0.01 | 0.08 ± 0.01 | 81 ± 2 | 5.4 ± 0.1 |
| Zn0.94Fe0.06O | 0.94 ± 0.01 | 0.06 ± 0.01 | 73 ± 2 | 5.3 ± 0.1 |
| Zn0.96Fe0.04O | 0.96 ± 0.01 | 0.04 ± 0.01 | 63 ± 2 | 5.4 ± 0.1 |
| Zn0.98Fe0.02O | 0.98 ± 0.01 | 0.02 ± 0.01 | 45 ± 2 | 5.4 ± 0.1 |
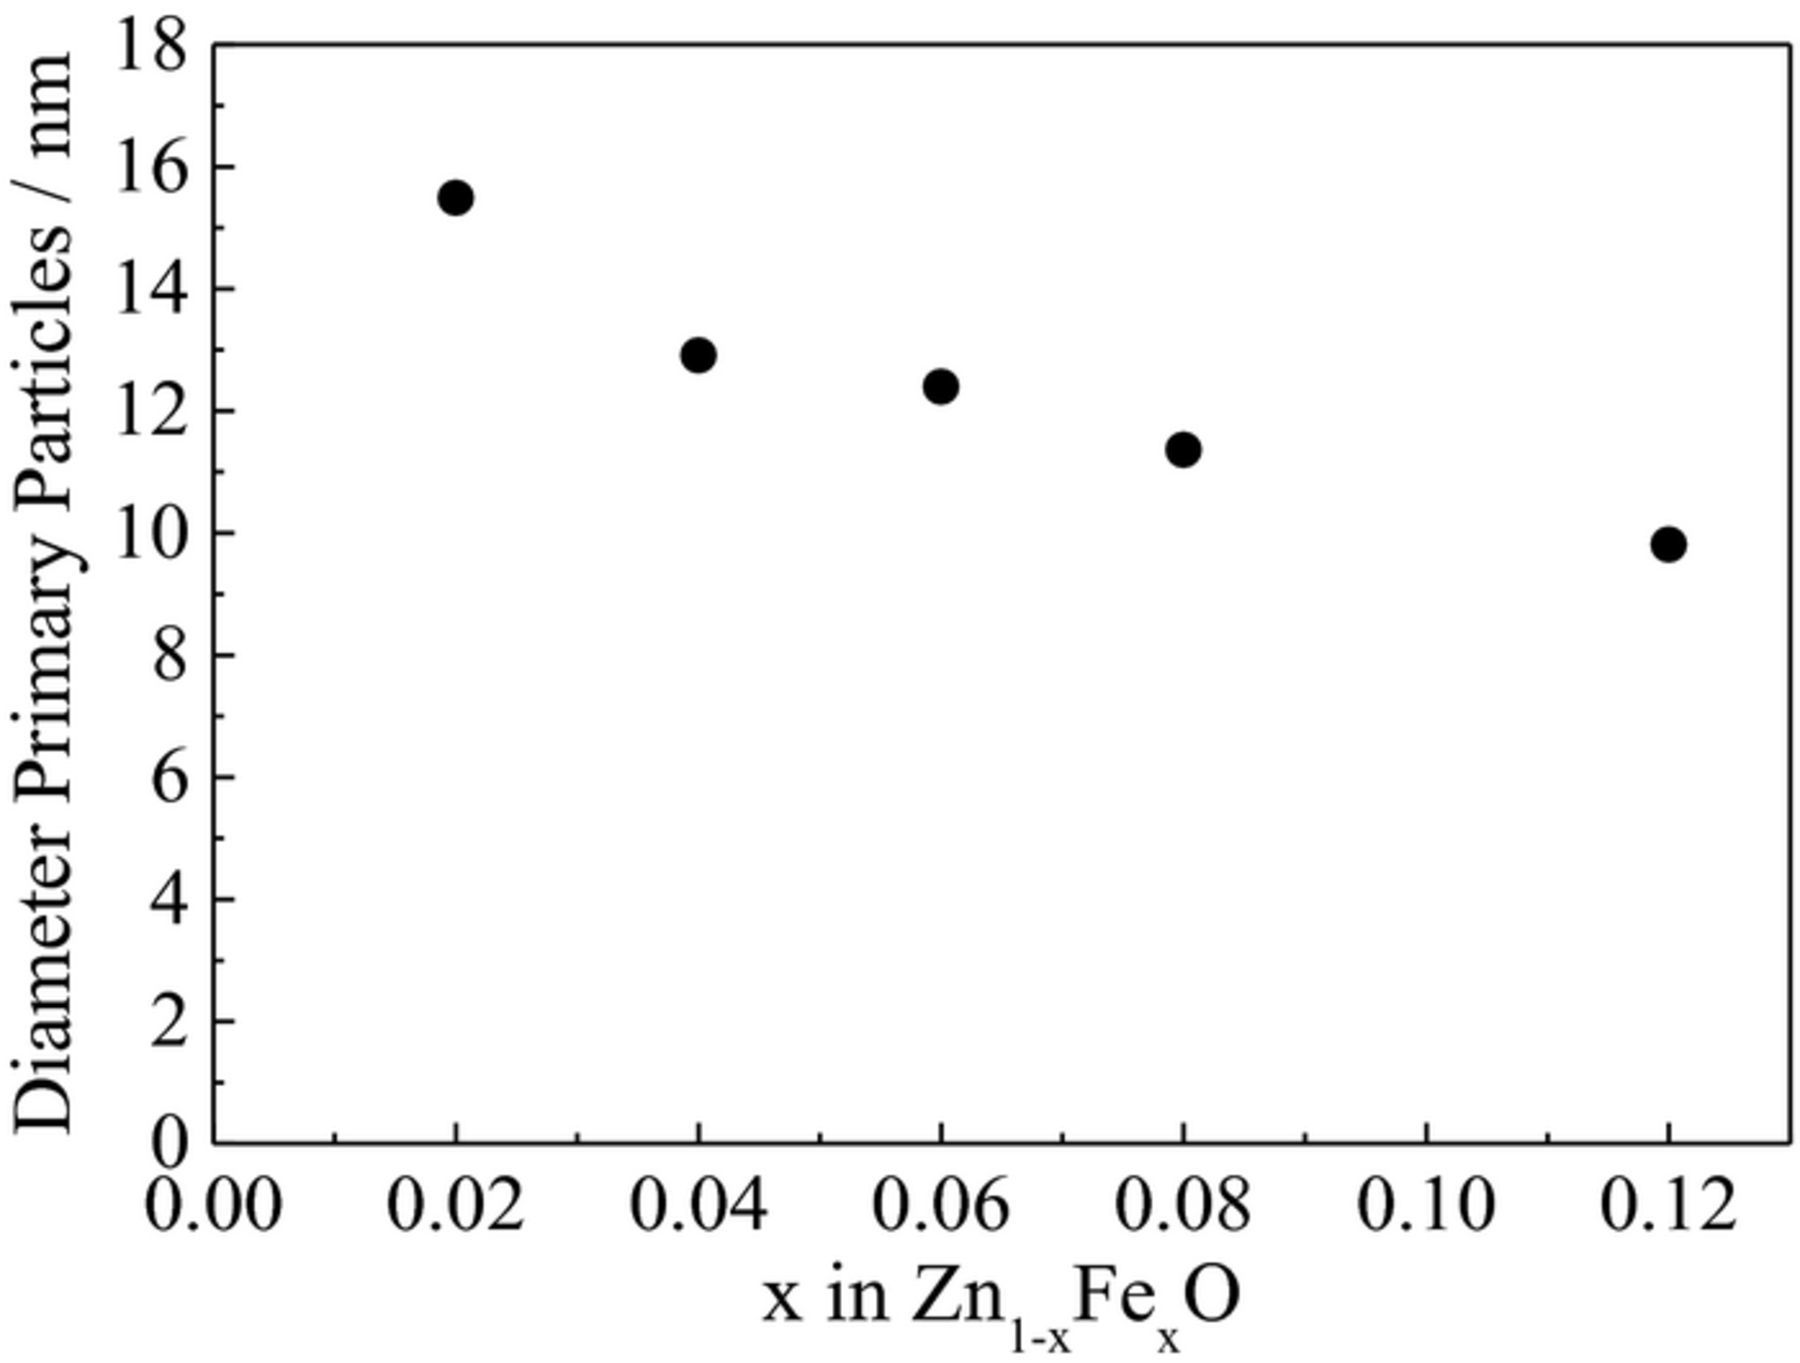
Figure 3. Primary particle diameter as determined from SAXS analyses of Fe-doped ZnO as a function of the Fe content.
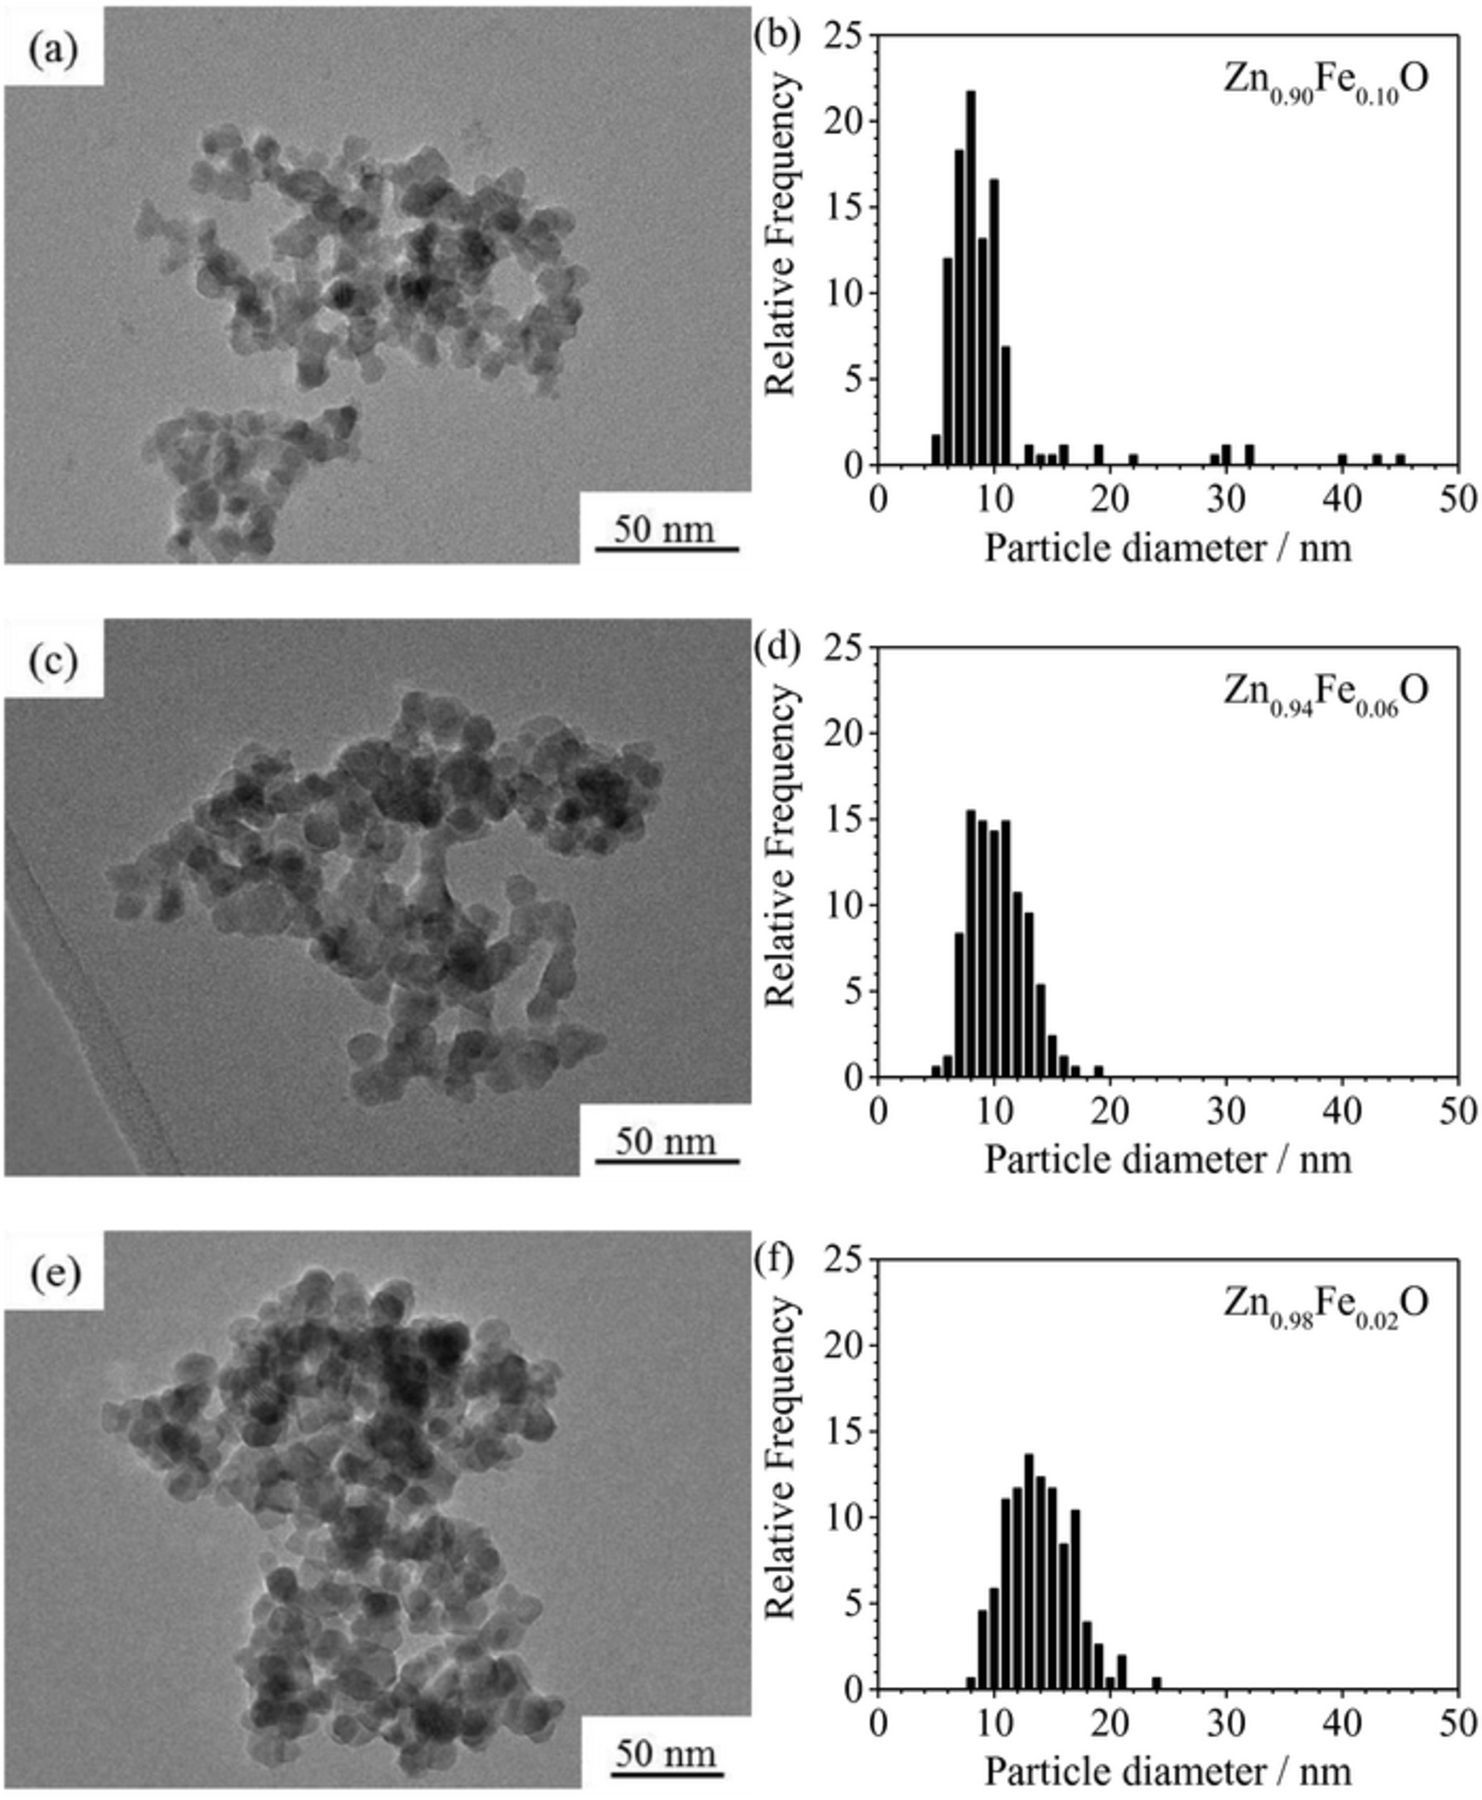
Figure 4. TEM micrographs of (a) Zn0.90Fe0.10O, (c) Zn0.94Fe0.06O, and (e) Zn0.98Fe0.02O and the corresponding statistical evaluation of the particle size for (b) Zn0.90Fe0.10O, (d) Zn0.94Fe0.06O, and (f) Zn0.98Fe0.02O given as histograms.
For the investigation of the impact of the dopant ratio on the de-/lithiation mechanism, cyclic voltammetry (CV) was performed. For clarity reasons, only the voltammograms for the two samples with the highest (0.12) and lowest (0.02) iron content are depicted in Figure 5. Figure 5a shows the first cyclic potentiodynamic sweep for both materials in comparison. In general, both voltammograms show similar features. The first cathodic sweep reveals two reduction peaks occurring at about (A) 0.62 V and (B) 0.34 V. Below (C) 0.19 V the specific current continuously declines until the electrode reaches the reversing potential. Peak (A) is generally assigned to the reduction of the carbonate-based electrolyte at the electrode/electrolyte interface accompanied by the formation of the SEI.42 The main peak (B) at 0.34 V is ascribed to the reduction of the Fe-doped ZnO to form metallic Fe and Zn as well as Li2O. The low-potential feature (C) is related to charge storage at the electrode surface and in the carbon black (i.e., the conductive additive). Moreover, at a potential below 0.2 V, the alloying of metallic Zn with Li occurs.8,11 However, for the Zn0.88Fe0.12O-based electrode (in black), peak (A) is more distinct, presumably related to the significantly larger surface area, and the features (B) and (C) are less pronounced as compared to Zn0.98Fe0.02O (in red). While the higher current intensity for feature (C) in case of Zn0.98Fe0.02O may be assigned to the increased contribution of the alloying reaction, the decreased intensity of peak (B) for Zn0.88Fe0.12O appears explainable only when considering a higher ratio of cationic vacancies9 and, thus, an increasing contribution of initial lithium ion insertion into the wurtzite structure.8,11 This is, as a matter of fact, in good agreement with the continuously higher current recorded for potentials below 1.5 V. For the subsequent anodic sweep, i.e., upon delithiation, the recorded current response for the two samples differs rather markedly. Zn0.98Fe0.02O, the sample with the lower Fe content, shows the characteristic features of pure ZnO at low potentials (D), i.e., the stepwise de-alloying of LiZn.11,43,44 Differently, Zn0.88Fe0.12O reveals only a very broad peak in region (D), similarly to Co-doped ZnO.11 For both samples, feature (D) is followed by a broad peak (E) between 1.32 and 1.51 V. The slightly higher current in case of Zn0.88Fe0.12O at higher potentials is in good agreement with the previously reported comparison of pure ZnO and Zn0.9Co0.1O.11 Thus, it may be ascribed to the re-oxidation of the transition metal. In the second potentiodynamic sweep (Figure 5b), the two cathodic peaks (A) and (B) vanish, while two new peaks appear at potentials of (F) 0.77 V and (G) 0.46 V. These changes were assigned to the substantial structural reorganization during the first lithiation and the reduced grain size of the active material,11 which is in accordance with the observation that the two new peaks are slightly more pronounced for Zn0.98Fe0.02O (red) than for Zn0.88Fe0.12O (black). Apart from this and in particular for the anodic sweep, the two voltammograms show the same features and differences as for the first cyclic sweep.
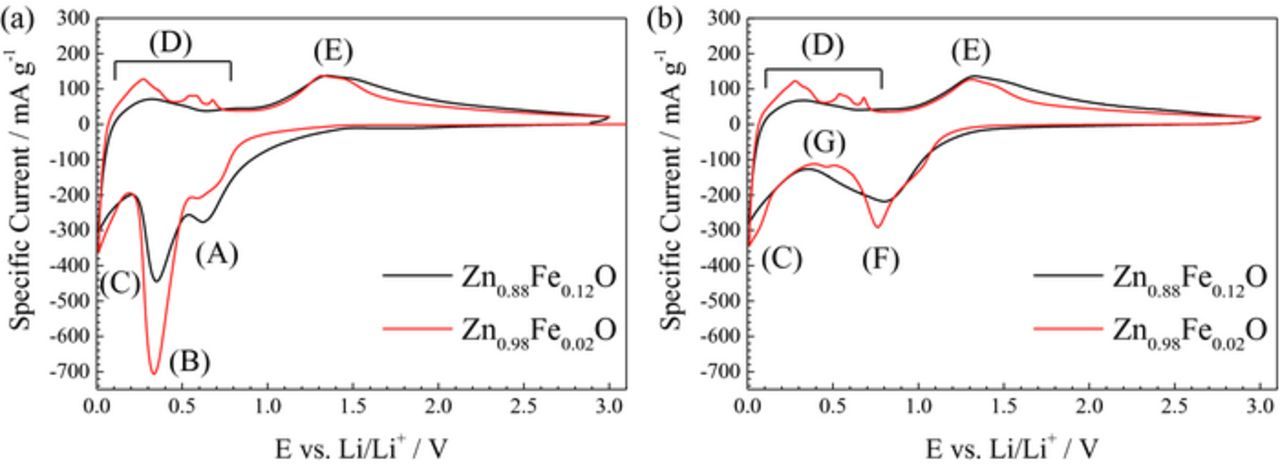
Figure 5. Cyclic voltammograms of Zn0.88Fe0.12O (in black) and Zn0.98Fe0.02O (in red) based electrodes: (a) 1st sweep and (b) 2nd sweep.
As the cycling stability upon galvanostatic cycling is highly dependent on the presence of a carbonaceous coating,8 all samples were subsequently coated with carbon, using a fixed amount for the carbon precursor, sucrose. The corresponding XRD patterns are presented in Figure 6, confirming that this additional processing does not result in any phase impurities while maintaining comparable reflection intensities and FWHM with respect to the uncoated samples. In Table II the specific surface area, the bulk density, and the residual carbon content of the carbon-coated samples are presented. The carbon content, determined by TGA, is comparable for all samples, i.e., about 20–21 wt%. Accordingly, the bulk density of all composites is similar (∼3.6 g cm−3) and lower than for the uncoated samples due to the lower density of carbon. The comparison of the BET surface area for the different samples shows practically negligible variations, indicating that it is basically determined by the nature of the carbonaceous coating.45,46
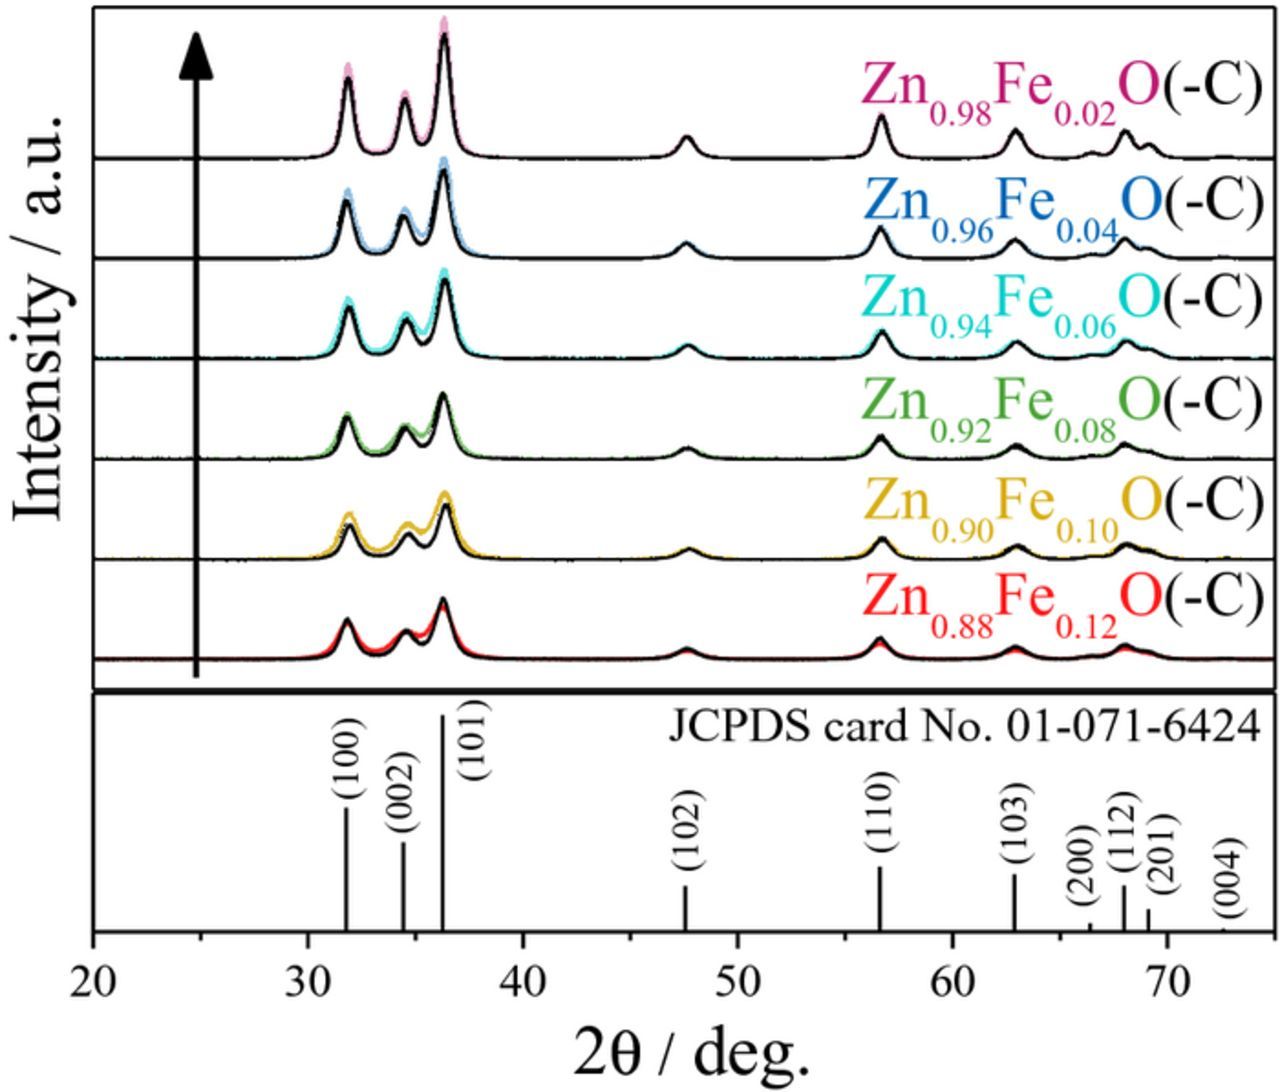
Figure 6. Direct comparison of the XRD patterns obtained for the as-prepared samples Zn0.88Fe0.12O (red), Zn0.90Fe0.10O (yellow), Zn0.92Fe0.08O (green), Zn0.94Fe0.06O (cyan), Zn0.96Fe0.04O (blue), and Zn0.98Fe0.02O (purple) and the carbon-coated equivalents (-C; in black); as reference, wurtzite ZnO (JCPDS card No. 01-071-6424) is given again in the bottom.
Table II. BET surface area, density, and residual carbon content of carbon-coated Fe-doped ZnO samples having different Fe-dopant concentrations.
| BET surface | Density/g | Residual carbon | |
|---|---|---|---|
| Sample | area/m² g−1 | cm−3 | content/wt.% |
| Zn0.88Fe0.12O-C | 93 ± 2 | 3.6 ± 0.1 | 21 ± 1 |
| Zn0.90Fe0.10O-C | 95 ± 2 | 3.6 ± 0.1 | 20 ± 1 |
| Zn0.92Fe0.08O-C | 99 ± 2 | 3.5 ± 0.1 | 21 ± 1 |
| Zn0.94Fe0.06O-C | 99 ± 2 | 3.6 ± 0.1 | 20 ± 1 |
| Zn0.96Fe0.04O-C | 104 ± 2 | 3.6 ± 0.1 | 21 ± 1 |
| Zn0.98Fe0.02O-C | 105 ± 2 | 3.6 ± 0.1 | 21 ± 1 |
In Figure 7a, the first cycle potential profiles of the various carbon-coated Fe-doped ZnO electrodes are shown. All samples exhibit the typical, smoothly decreasing profile of Fe-doped ZnO8 in accordance with the CV results (Figure 5). Nonetheless, there are slight variations, particularly for the initial lithiation at higher potentials, i.e., above the onset of the first voltage plateau. The capacity provided in this region tends to increase with an increasing iron content, which is assigned to a more pronounced lithium ion insertion into the wurtzite lattice due to the increasing amount of cationic vacancies,9 as earlier discussed for the CV results and in good agreement with a recently performed in situ X-ray absorption spectroscopy study (to be submitted in near future). Also, the occurrence of the first voltage plateau appears to be continuously shifted to higher potentials, which may be assigned to the higher standard reduction potential of iron compared to zinc.
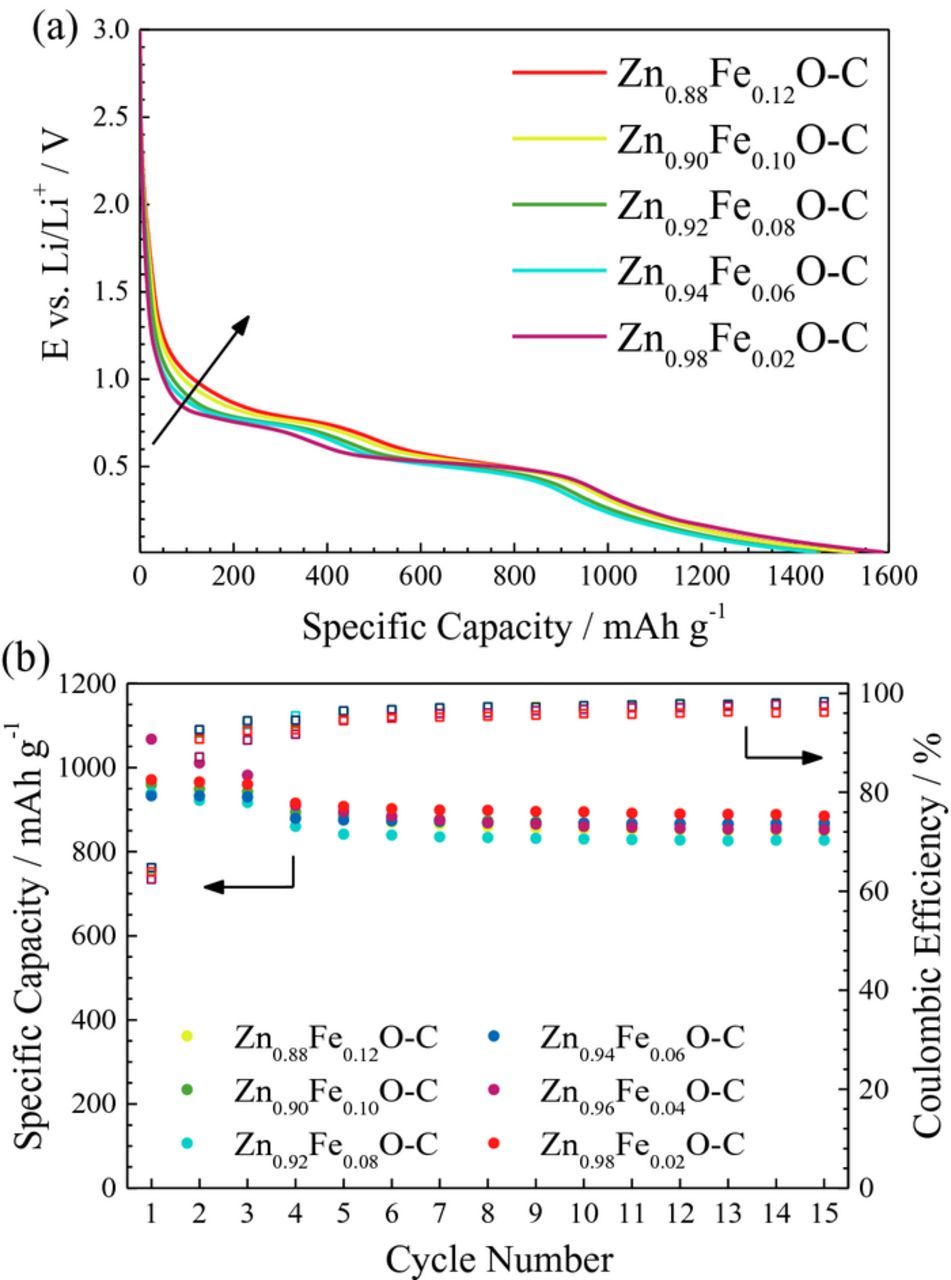
Figure 7. Galvanostatic cycling of electrodes based on Fe-doped ZnO with different Fe concentrations: (a) potential vs. specific capacity profiles for the 1st discharge, i.e., lithiation, and (b) constant current cycling (specific capacity vs. cycle number), applying a specific current of 50 mA g−1 for the first three cycles and 100 mAg−1 for the following ones.
The influence of the iron content on the cycling stability upon constant current cycling of the resulting electrodes is presented in Figure 7b. The first cycle coulombic efficiency is about 65% for all samples, indicating that the initial irreversibility is due to electrolyte decomposition at the electrode/electrolyte interface and SEI formation – both strongly related to the specific surface area,47 which is comparable for all the carbon-coated samples (see Table II). For the subsequent cycles, all electrodes show stable cycling performance and no clear trend is observable. Theoretically, the two end-members of the herein studied series, Zn0.88Fe0.12O and Zn0.98Fe0.02O, provide specific capacities of around 962 and 983 mAh g−1, respectively, i.e., a difference of about 20 mAh g−1 as a result of the different iron content. Indeed, the finding of comparable capacity values may be related to the experimental difficulties in precisely determining the active material content for such electrode composites, as this is always based on average values for all electrode components (active material including the carbon content, binder, conductive additive, and current collector). More importantly, however, is the result that all samples show such high capacities upon continuous de-/lithiation, revealing that even a relatively low iron concentration of only 0.02 is sufficient for enabling the reversible formation of Li2O. Summarizing, the dopant ratio affects the (initial) reaction mechanism, due to the increasing presence of cationic vacancies, and the reduction potential rather than the lithium storage capacity by conversion.
Influence of the carbon coating content
Focusing more on the practical application as alternative lithium-ion anode material in rechargeable batteries, the impact of the carbon coating content on the electrochemical performance was investigated. As mentioned in the introduction, the carbonaceous coating ideally fulfils several functions simultaneously: It enhances the electronic conductivity within the electrode composite, stabilizes the electrode/electrolyte interface by forming a suitable SEI, buffers occurring volume variations, and prevents particle agglomeration upon electrode processing and cycling.8,27–33 Additionally, it contributes to the reversible capacity by hosting lithium at relatively lower potentials.48 In fact, the application of a carbonaceous coating led to enhanced cycling stability and rate capability for Fe-doped ZnO.8 However, considering the capacity delivered by the conversion/alloying materials, a substantial amount of carbon results in a decreased overall specific capacity. This is because the latter provides a specific capacity of about 265 mAh g-1 (see Figure S2) and reduces the density of the active material (compare Table I and Table II), reducing the gravimetric and volumetric energy densities of the final full-cell. A recent study on the influence of the carbon coating precursor using ZnFe2O4 as active material revealed that the homogeneity of the coating is, in fact, more relevant than the total amount.28 Therefore, the overall carbon content should be kept as low as possible to achieve the optimum gravimetric and volumetric energy densities while warranting stable cycling performance and good rate capability.
Hence, in order to determine the optimum carbon content, a series of carbon-coated Zn1-xFexO samples, comprising varying amounts of carbon, was prepared. To rule out any impact of the Fe-content, we kept x in this study constant at 0.1. The targeted values for the remaining carbon and the experimentally determined ones are given in Table III (left and right column, respectively). Being in accordance with the XRD results presented in Figure 6, the coating procedure did not result in any significant structural changes - independent of the utilized amount of carbon precursor, while the latter remains amorphous (see Figure S3). Also, the comprised carbon appears to be homogeneously distributed throughout the sample, independent of the actual overall content and no significant carbon aggregates are observed (Figure S4), being in line with our previous study on carbon-coated Zn0.9Fe0.1O.8
Table III. Residual carbon content in Zn0.9Fe0.1O-C samples when varying the amount of sucrose utilized as precursor for the carbonaceous coating.
| Sample | Residual carbon content/wt.% |
|---|---|
| Zn0.9Fe0.1O-5wt.%-C | 5 ± 1 |
| Zn0.9Fe0.1O-10wt.%-C | 12 ± 1 |
| Zn0.9Fe0.1O-15wt.%-C | 16 ± 1 |
| Zn0.9Fe0.1O-20wt.%-C | 20 ± 1 |
When subjecting electrodes based on these four Zn0.9Fe0.1O-C composites to cyclic voltammetry (Figure 8), the recorded sweeps show similar features and peaks ((A) to (G), see Figure 8a) as those recorded for Zn0.88Fe0.12O (Figure 5, in black), indicating that the carbon coating does not have any great effect on the overall de-/lithiation mechanism. However, a comparison of the four panels with a focus on the development of the cyclic voltammograms upon continuous cycling reveals that the current intensity in case of 5 wt% of carbon (Figure 8a) decreases significantly, particularly for (F) and (E) upon reduction and oxidation, respectively. This decrease in current intensity for peak (F) is less pronounced for the materials containing 10 and 15 wt% carbon (Figures 8b and 8c) and may be counterbalanced by the concurrent increase observed for (G), while the decrease for (E) upon subsequent oxidation appears negligible. For 20 wt% of carbon (Figure 8d), no great changes are observed after the first reduction sweep, apart from a slight decrease of (F), accompanied by a slight increase of (G). These results indicate that the overall amount of carbon, in fact, plays an important role for the reversibility of the lithium ion uptake and release.
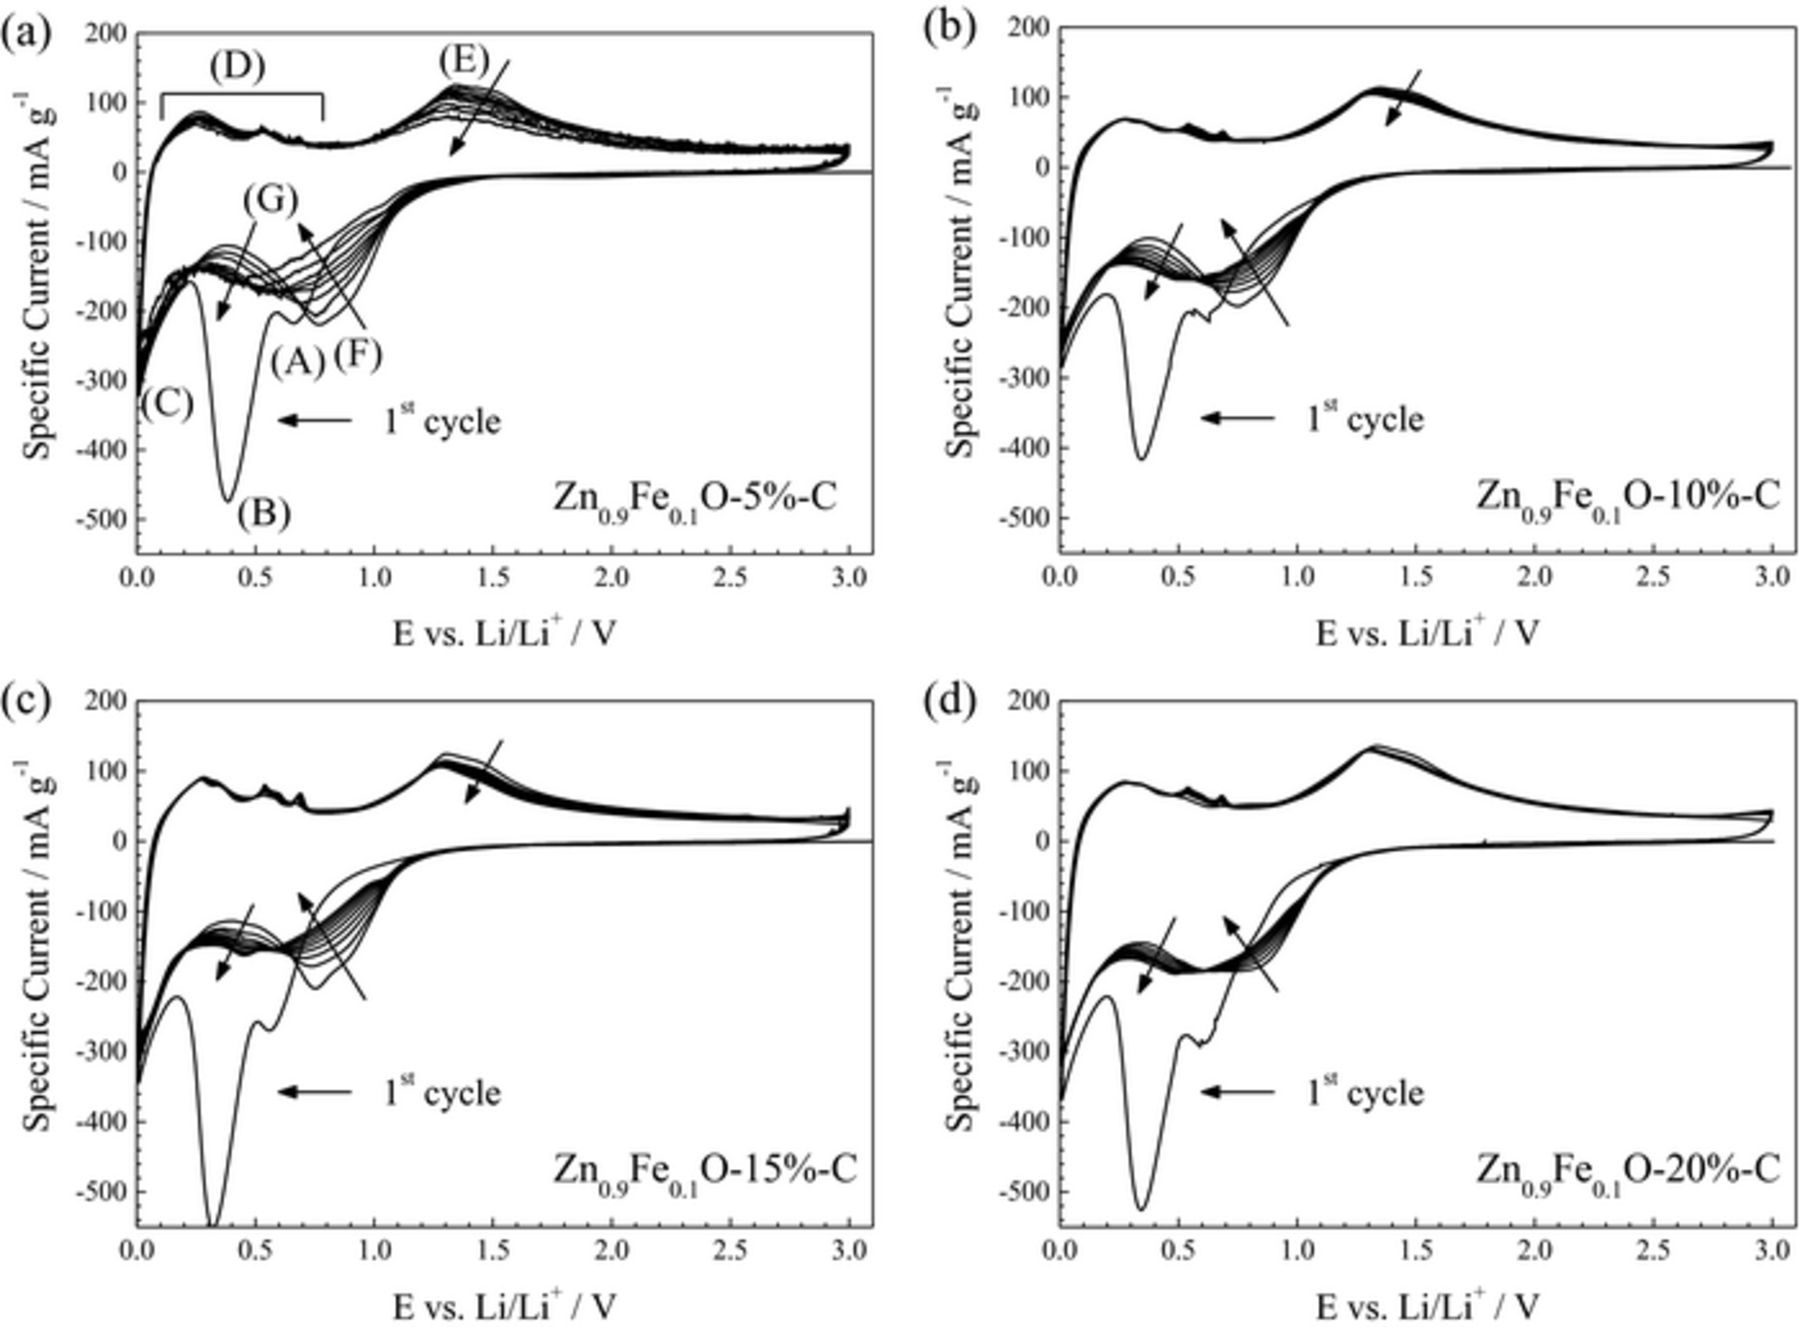
Figure 8. Cyclic voltammograms (1st to 10th cycle) recorded for electrodes based on carbon-coated Zn0.9Fe0.1O, comprising (a) 5 wt%, (b) 10 wt%, (c) 15 wt%, and (d) 20 wt% of carbon.
To further evaluate this influence of the carbon content, electrodes based on the four different composites were cycled galvanostatically (Figure 9). It should be noted that the calculation of the specific capacity is based on the weight of the overall Zn0.9Fe0.1O-C composite, thus including the weight of the carbon and not taking into account the lower capacity of the carbon (∼265 mAh g-1; see Figure S2). According to Figure 9a, it appears that for relatively low current densities (100 mA g-1) the carbon content has only little impact. A carbon coating content of 10 wt% is apparently sufficient for obtaining a stable cycling at about 865 mAh g−1. Only the sample with 5 wt% of carbon shows a lower coulombic efficiency accompanied by a slight, though continuous, capacity fading, presumably related to the occurrence of parasitic reactions and/or the loss of available active material; e.g., due to a loss of electronic contact. For elevated specific currents, however, a carbon content of at least 15 wt% appears preferable with respect to the power performance of these electrodes (Figure 9b), while 20 wt% of carbon appears, indeed, to be the optimum.
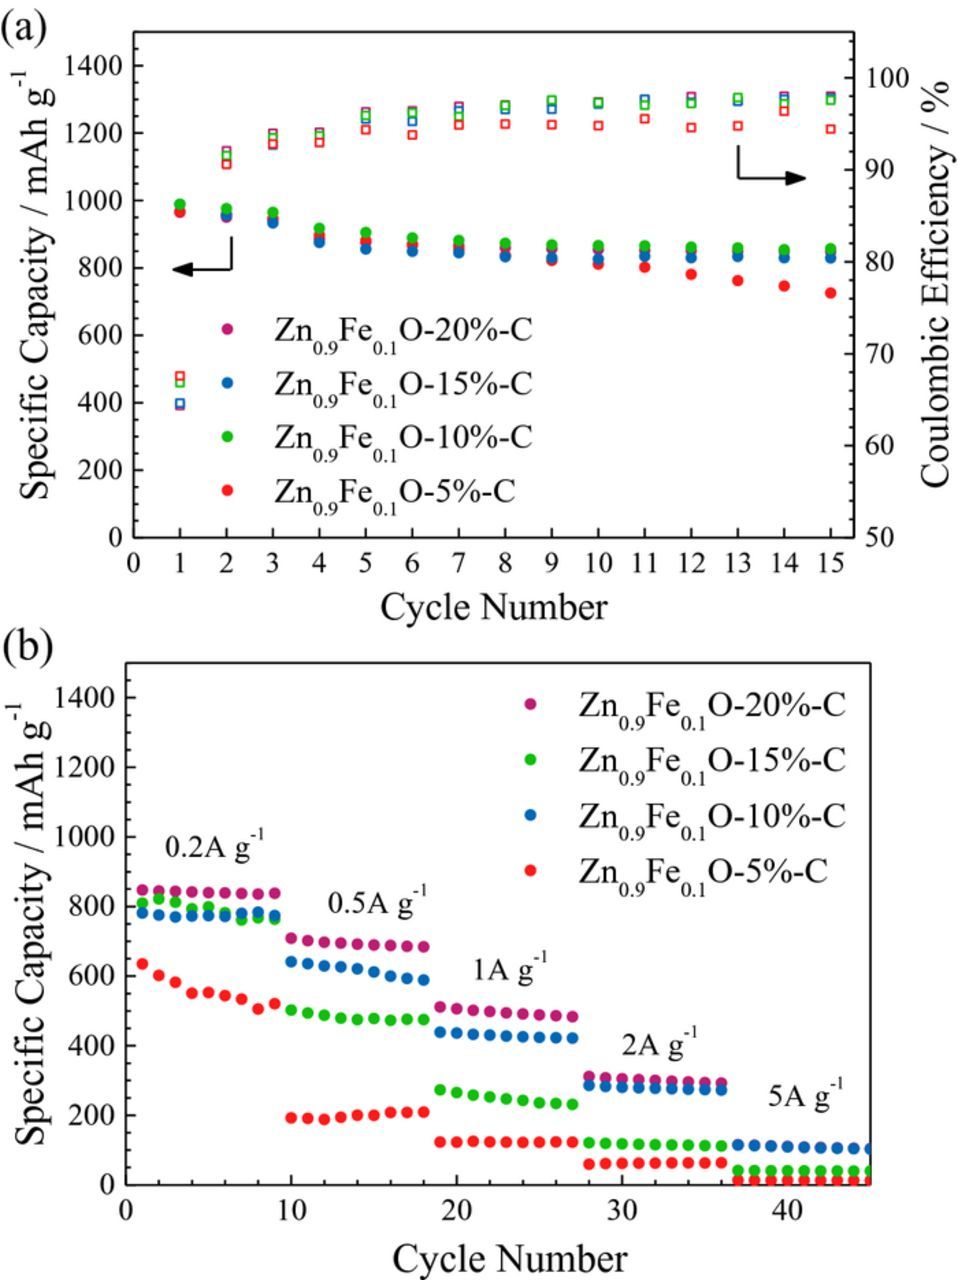
Figure 9. Galvanostatic cycling of electrodes based on carbon-coated Zn0.9Fe0.1O, containing 5 wt% (red), 10 wt% (green), 15 wt% (blue), and 20 wt% (purple) of carbon: (a) constant current cycling (specific current: 50 mA g−1 for the first three cycles and 100 mA g−1 for the following ones); (b) multi-rate cycling (1st cycle: 20 mA g−1, followed by each ten cycles at 0.05 A g−1, 0.1 A g−1, 0.2 A g−1, 0.5 A g−1, 1.0 A g−1, 2.0 A g−1, and 5.0 A g−1).
Conclusions
Hybrid conversion/alloying anode materials such as, for instance, transition metal-doped ZnO are a rather novel class of lithium-ion active materials and, so far, only little is known about the influence of different parameters on the electrochemical properties such as the dopant concentration or the effect of varying the amount of the carbon coating. To investigate the impact of these two parameters, a series of Zn1-xFexO samples was synthesized, with x ranging from 0.02-0.12, while the carbon coating content was varied from 5 to 20 wt% (x = 0.1). Their comprehensive characterization revealed that the variation of the dopant concentration in Fe-doped ZnO has a direct effect on the particle size (higher Fe concentrations lead to smaller particles) as well as the detailed de-/lithiation mechanism, indicated by the varying shape of the corresponding potential profiles. The electrochemical performance, however, is only little affected by the dopant concentration, revealing a reversible formation of Li2O even for the lowest herein studied iron content of x = 0.02. Regarding the impact of the overall weight ratio of the carbon coating in Zn0.9Fe0.1O-C composites, it was found that 10 wt% are sufficient for allowing a stable cycling at relatively low specific currents (100 mA g−1). Nevertheless, when applying elevated currents, the beneficial impact of higher carbon contents becomes evident and a minimum carbon amount of 15 wt% appears favorable, while 20 wt% appears optimal.
Generally, these results highlight that the composition and design of the active material (composite) are dependent on the targeted device (power vs. energy; volume vs. mass), thus rendering such studies highly important for their potential practical application.
Acknowledgments
Financial support by BMW AG within the ABILE (Air Batteries with Ionic Liquid Electrolytes) project is gratefully acknowledged. D.B. thanks the CEA NanoSciences Programme within the ELLIPSE project (14.4.1) and the CEA/EU Enhanced Eurotalents Fellowship for financial support.