Abstract
Composite Na-β"-alumina + yttria-stabilized zirconia (YSZ) samples were fabricated by vapor phase conversion of sintered α-alumina + YSZ two-phase samples. In the converted samples Na-β"-alumina and YSZ were both contiguous. The samples thus are mixed Na+-ion-O2−-ion conductors. Discs were tested separately under an oxygen chemical potential differential (H2-H2O-N2 gas mixture on one side and air on the other – fuel cell mode) and under a sodium chemical potential differential (Na-β-alumina + Na-β"-alumina on one side and α-alumina + Na-β-alumina on the other side). In both cases finite open circuit voltages were measured. In testing in fuel cell mode, the initially observed open circuit voltage was lower than expected for a single phase YSZ membrane, which was attributed to the transient flow of Na+ ions. After prolonged testing, the surface exposed to hydrogen containing gas mixture degraded forming a thin layer of α-alumina. The ionic conductivity of the samples was measured using both AC and DC methods.
Export citation and abstract BibTeX RIS

This is an open access article distributed under the terms of the Creative Commons Attribution 4.0 License (CC BY, http://creativecommons.org/licenses/by/4.0/), which permits unrestricted reuse of the work in any medium, provided the original work is properly cited.
Sodium β"-alumina is a sodium ion conductor with applications in sodium-sulfur and sodium-nickel chloride (ZEBRA) batteries, as well as in alkali metal thermoelectric convertors (AMTEC).1–3 YSZ is the most commonly used oxygen ion conducting solid electrolyte in solid oxide cells.4 Conventional Na-β"-alumina samples are made by sintering a calcined mixture containing Na-β-alumina and Na-β"-alumina (with some NaAlO2) in Pt or magnesia containers by a transient liquid phase mechanism.5 Usually some NaAlO2 remains at grain boundaries, which makes Na-β"-alumina electrolyte samples susceptible to degradation due to moisture and CO2 present in the atmosphere. Thus, Na-β"-alumina electrolytes are stored in desiccators. A vapor phase process to form a two-phase mixture of Na-β"-alumina + YSZ has been developed in which a sintered two phase mixture of α-alumina + YSZ is exposed to a vapor of Na2O by packing in Na-β"-alumina powder and heat treating over a temperature range from 1200°C to 1400°C for several hours.6 During the vapor phase process, Na2O from the vapor phase is incorporated into the sintered α-alumina + YSZ samples to form Na-β"-alumina + YSZ. The process occurs by coupled diffusion of 2Na+ through the formed Na-β"-alumina and O2− through YSZ. Over time, the entire sample can be converted into a two-phase mixture of Na-β"-alumina + YSZ. Since no NaAlO2 is present during the process, such Na-β"-alumina + YSZ samples are resistant to degradation in the ambient atmosphere. Parthasarathy and Virkar7 have reported on the mechanism and the kinetics of the conversion process.
The Na-β"-alumina + YSZ composite has both phases contiguous. Thus, it can conduct both Na+-ions (through the Na-β"-alumina phase) and O2− -ions (through the YSZ phase) simultaneously if gradients in electrochemical potentials of Na+ and O2− ions can be established. Also, by using blocking electrodes to one of the species, it should be possible to allow the transport of the other species. The objective of the present work was to conduct electrochemical studies in which either one or both ions are transported through the sample using suitable electrodes. Also, as Na+ ions can be replaced (at least partially) by other alkali ions by ion exchange, and also by divalent and trivalent cations, it should also allow a study of many other systems.8–11 Such composite electrolytes should allow thermodynamic and kinetic studies on many inorganic systems.
Experimental
Sample fabrication
A mixture containing 61 wt% α-alumina (CR-30 Baikowski) and 39 wt% YSZ (TZ-3Y, Tosoh) was made. This corresponds to ∼70 vol.% alumina and ∼30 vol.% YSZ. The mixture was wet-milled using Fritsch Pulversette planetary mill for 24 h, and heated to 500°C in air for 1 h. Disks were uniaxially pressed using a Carver press at ∼10 kpsi (∼69 MPa) followed by isostatic pressing (Autoclave Engineers Model IP4-22-60) at 30 kpsi (207 MPa). All samples were sintered in air at 1550°C for 3 h. The discs were then placed in an alumina crucible, loosely packed in Na-β"-alumina powder containing ∼8.85 wt% Na2O, ∼0.75 wt% Li2O and balance Al2O3, covered with a lid and heat-treated at 1450°C in air for 10 h. Full conversion was ensured by monitoring the weight change of the sample. Platinum paste was applied on both sides of the discs and fired at 1000°C for 1 h in air. The diameter of the electrodes was ∼9.52 mm.
Galvanic cell measurements were conducted in two sets of experiments. In set 1, one side was exposed to an H2/H2O/N2 gaseous mixture and the other side was exposed to air. This is called the fuel cell mode, although all tests were conducted only at open circuit (OCV). Figure 1 shows the apparatus used. An alumina tube was used to isolate the inner part of the tube from the outside environment (air). The tube was closed with a flange on one end and the disk-shaped sample with platinum electrodes was secured at the other end using a mica gasket for sealing. The inside of the tube was exposed to H2/H2O/N2 atmosphere. The requisite H2O vapor pressure was achieved by bubbling through a flask of water maintained at 40°C using a water bath (Cole-Parmer, WV 14576-08). The corresponding water vapor pressure was 7.3 × 10⁻² atm and the hydrogen vapor pressure was 9.27 × 10⁻² atm. The gas flow rate was 138 ml.min−1 measured using a rotameter (Omega Engineering, FT1102CABN). The rotameter was calibrated with a gas flow calibrator (Definer 220). The apparatus was placed in a furnace in such a way that the disk was positioned in the middle of the furnace. The system was heated at a rate of 3°C min−1. The temperature was monitored with K-type thermocouple (Omega Engineering) placed on the air side. Stable voltage within ±5 mV was typically achieved within 1 h. Measurements were made over a temperature range from 500°C to 1100°C. Figure 2 shows the polarity of the meter as connected to the cell. Thus, the cell voltage is expected to be positive.
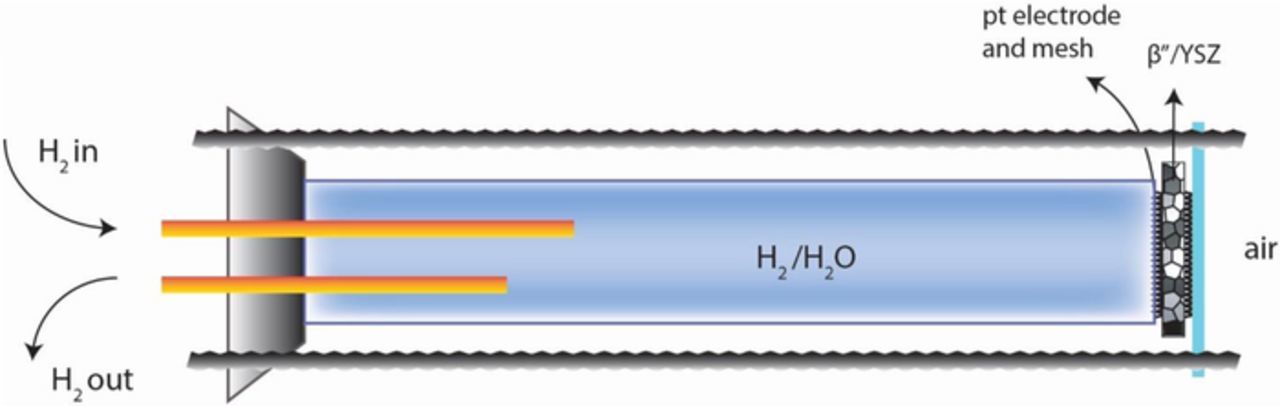
Figure 1. A schematic of the test set-up for fuel cell testing.
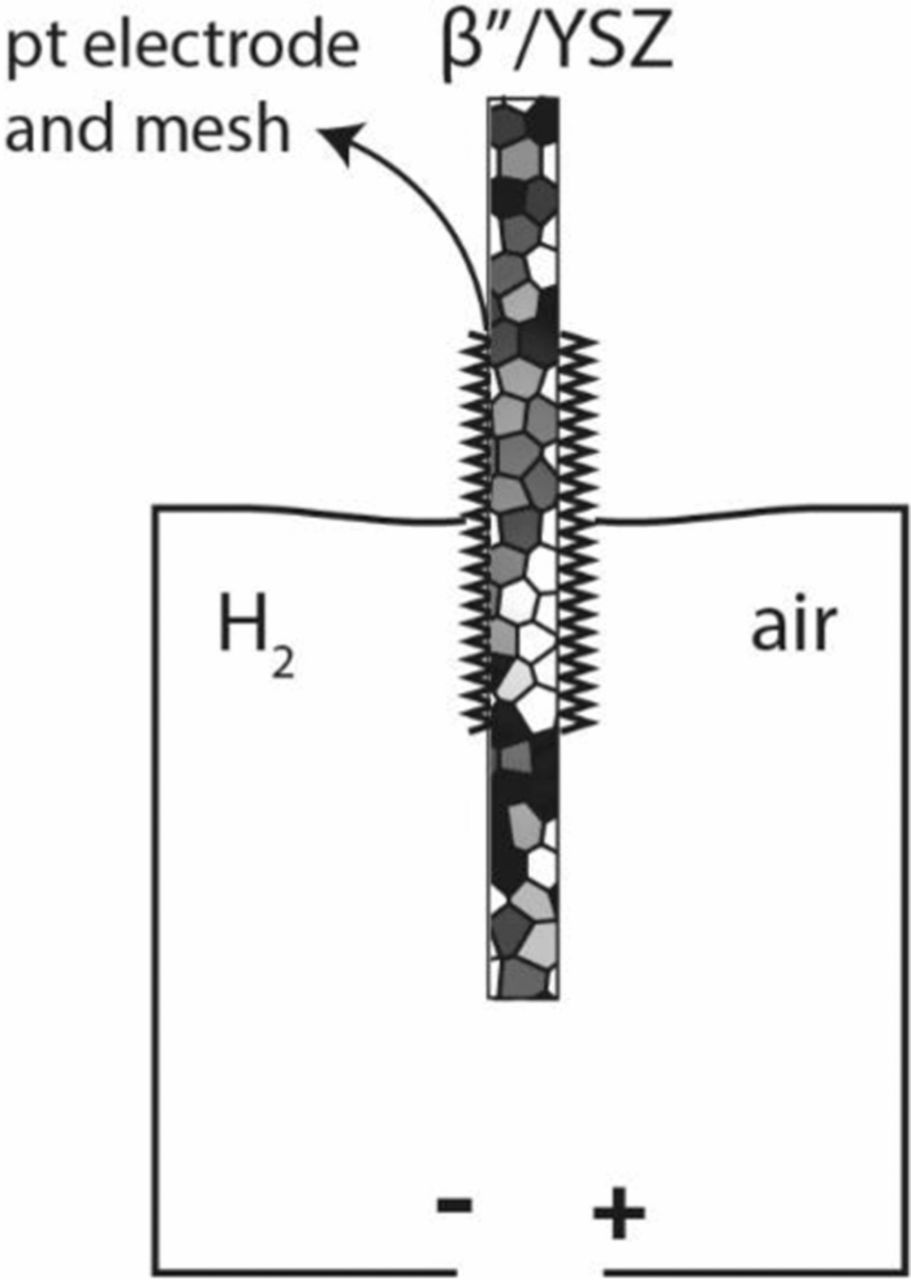
Figure 2. Fuel cell testing and the polarity of the meter.
In set 2, the same disk that was used once in the fuel cell mode was used. One electrode was a pressed powder pellet containing a mixture of Na-β-alumina (Na2O.11Al2O3) and Na-β"-alumina, and the other electrode was a pressed powder pellet containing a mixture of Na-β-alumina and α-alumina. The cell was tested in air in set 2. Thus, the first set represents a cell with different oxygen chemical potentials at the two electrodes. The second set represents a cell with different chemical potentials of sodium at the two electrodes. Figure 3 shows a schematic of testing under a chemical potential differential of sodium. The left electrode consisted of a Pt mesh over the Pt-paste electrode and a pressed powder pellet containing α-alumina and Na-β-alumina. This establishes thermodynamic activity of Na2O corresponding to α-alumina + Na-β-alumina two phase field in air. The right electrode consisted of a Pt mesh over Pt-paste electrode and a pressed pellet of Na-β-alumina + Na-β"-alumina. This establishes thermodynamic activity of Na2O corresponding to the two phase field of Na-β-alumina + Na-β"-alumina in air. Since the test is conducted in air, the activity of oxygen is the same at both electrodes. Thus, effectively, the left electrode represents thermodynamic activity of sodium in the two phase field containing α-alumina and Na-β-alumina. The right electrode represents thermodynamic activity of sodium corresponding to the two phase field containing Na-β-alumina + Na-β"-alumina. Thus, the left electrode is expected to be at a higher electric potential compared to the right electrode. With the polarity of the meter shown in Figure 3, we expect the measured voltage to be negative.
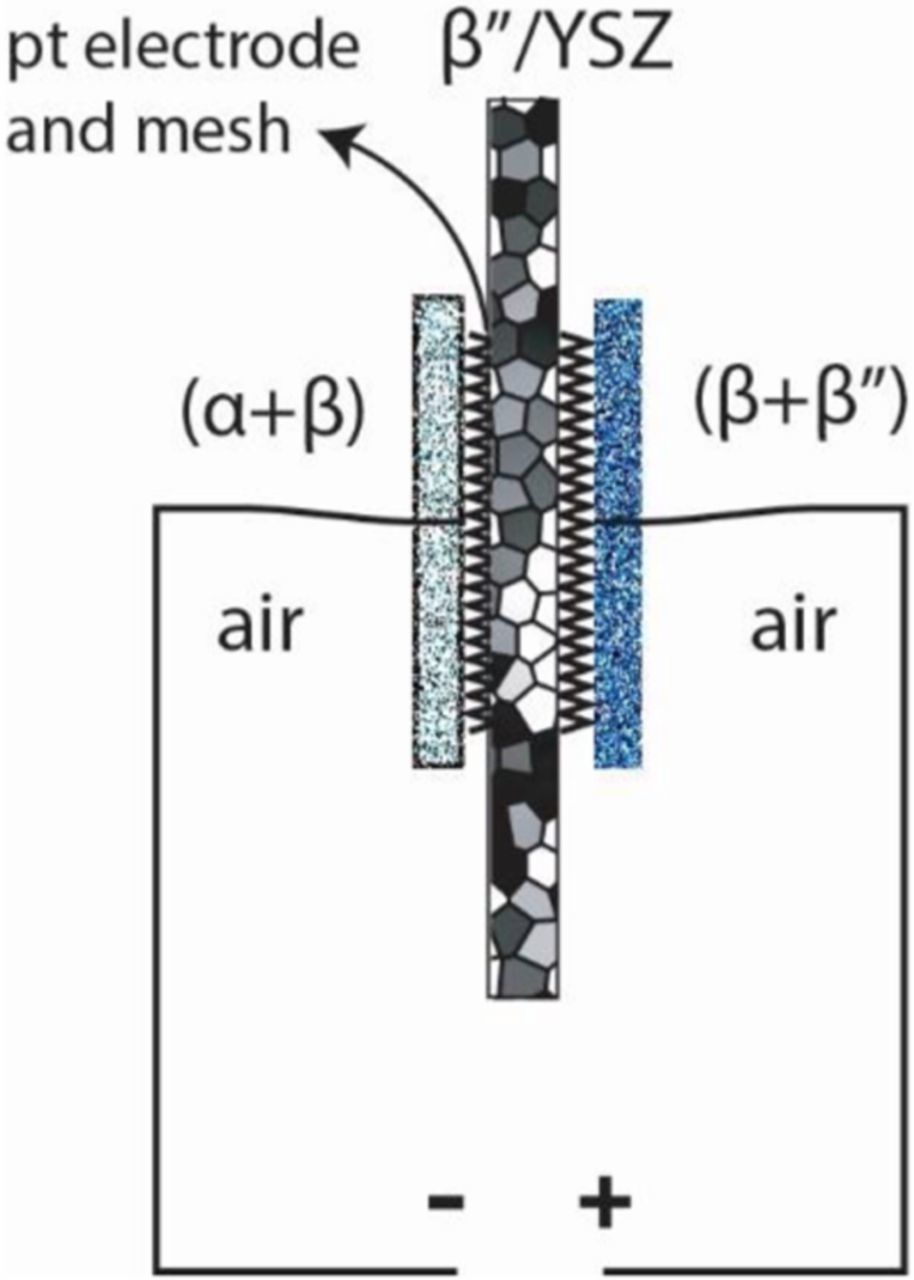
Figure 3. Application of sodium chemical potential differential and the polarity of the meter.
Voltage measurements were primarily made with a Keithley 6514 meter, which is an electrometer with an input impedance >200 TΩ. In some experiments, measurements were also made using impedance/gain-phase analyzer (SI 1260) and using a Keithley 2000 meter. These measurements were made to assess the role of the meter resistance in comparison to the sample resistance on the measured cell voltage. Electrochemical impedance spectroscopy (EIS) was conducted using Solartron electrochemical interface (SI 1287) and impedance/gain-phase analyzer (SI 1260) using a two-probe method over a range of frequencies from 100 Hz to 1 MHZ with a 10 mV amplitude. The temperature of the cell was monitored with an Omega K-type thermocouple read from a Keithley 2000 meter.
X-ray diffraction (Bruker D2 Phaser) using CuKα radiation was used to characterize the as-sintered samples and after a number of tests to determine the phases present. Scanning electron microscopy (NOVA NANOSEM 600) was used to examine the microstructure of the samples before and after the various electrochemical tests. Also, EDS scans were obtained near the surface regions before and after the various tests.
Results and Discussion
Cell voltage across a mixed sodium ion and oxygen ion conductor
Goldman-Hodgkin-Katz equation describes cell potential across a membrane that can transport multiple ionic species.12,13 This equation is routinely used in describing cell potential across biological membranes. Such an equation is given in terms of transport properties of the membrane and concentrations of the ionic species in adjacent reservoirs. A similar equation can also be given in terms of chemical potentials of neutral species at the electrodes and transport properties of the membrane and electrode polarization resistances.14 The cell potential corresponding to differentials of oxygen chemical potential and sodium chemical potential across a mixed sodium and oxygen ion conducting membrane is given by
![Equation ([1])](https://content.cld.iop.org/journals/1945-7111/166/10/F679/revision1/d0001.gif)
where  and ENa are respectively Nernst potentials corresponding to oxygen chemical potential and sodium chemical potential,
  is the area specific resistance for oxygen ion transport including the polarization resistances at the two electrodes,
  is the area specific resistance for the transport of sodium ions including the polarization resistances at the two electrodes, and Re is the area specific electronic resistance including the two electrolyte/electrode interfaces.
If  the measured cell voltage will be ENa. Also, if
  , and only oxygen chemical potential differential exists, the measured cell voltage will be
  .
.
Figure 4 shows an SEM image of a typical sintered and converted samples of Na-β"-alumina (dark phase) and YSZ (light phase). Both phases are contiguous. They appear not contiguous in the two dimensional image. As seen in the figure, the sample is nearly fully dense and very fine-grained.
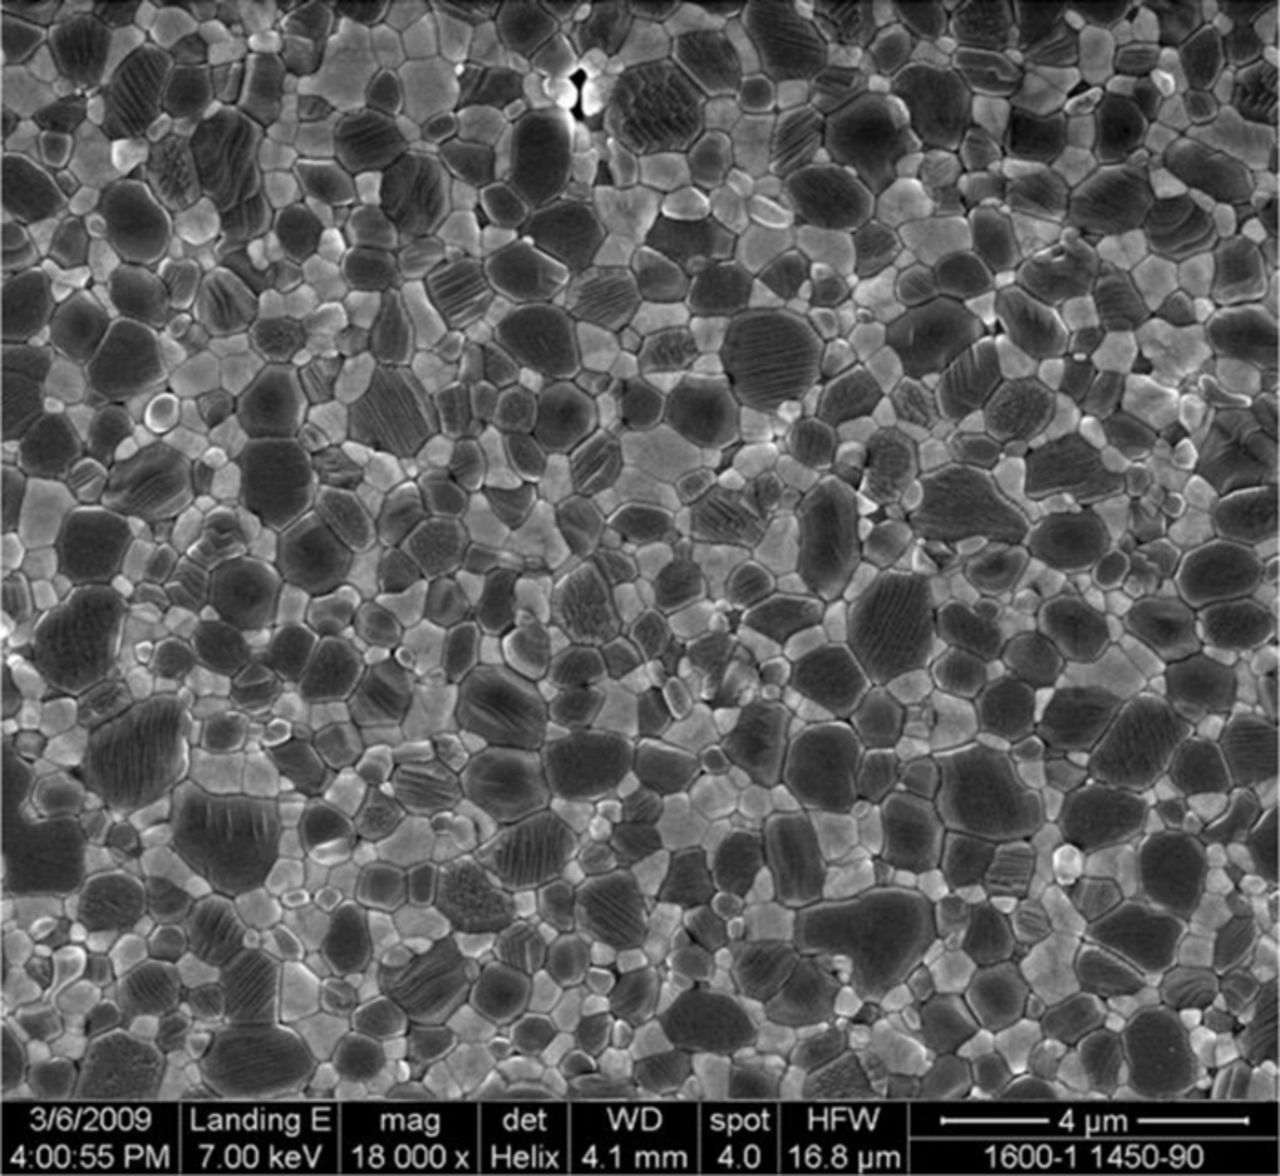
Figure 4. An SEM image of a sintered and converted sample. The dark phase is Na-β"-alumina and the light phase is YSZ.
Testing under fuel cell mode
Figure 5 shows the measured open circuit voltage for the first and second experiments. During the first experiment, the measured cell potential was ∼0.5 V at 527°C and increased to ∼0.7 V at ∼1027°C. The corresponding calculated Nernst voltage, however, ranges between ∼1.02 V and ∼0.85 V. The sample was then cooled down to room temperature. During the second test, the measured voltage was very close to the theoretical voltage over the entire range of temperatures tested. The observed lower than the expected voltage during the initial test is attributed to the transient transport of Na+ ions. For the polarity of the meter shown in Figure 2, the right electrode is expected to be positive, and the left electrode is expected to be negative, as observed. Both electrodes serve as source/sink for oxygen (reversible for oxygen). However, both electrodes are blocking to sodium as neither electrode is a source for sodium. As the right electrode becomes positive due to oxygen transport, sodium ions transport from the right side of the sample toward the left side in an attempt to neutralize the voltage created. This transport is dictated by the diffusion of Na+ ions. This process is expected to take some time. During this process, which is a transient process, the measured voltage is lower than expected. As the temperature is increased, more and more sodium ions transport to the left side. Eventually, the transport of sodium ions ceases when the gradient in the electrochemical potential of Na+ ions,  , vanishes; that is
![Equation ([2])](https://content.cld.iop.org/journals/1945-7111/166/10/F679/revision1/d0002.gif)
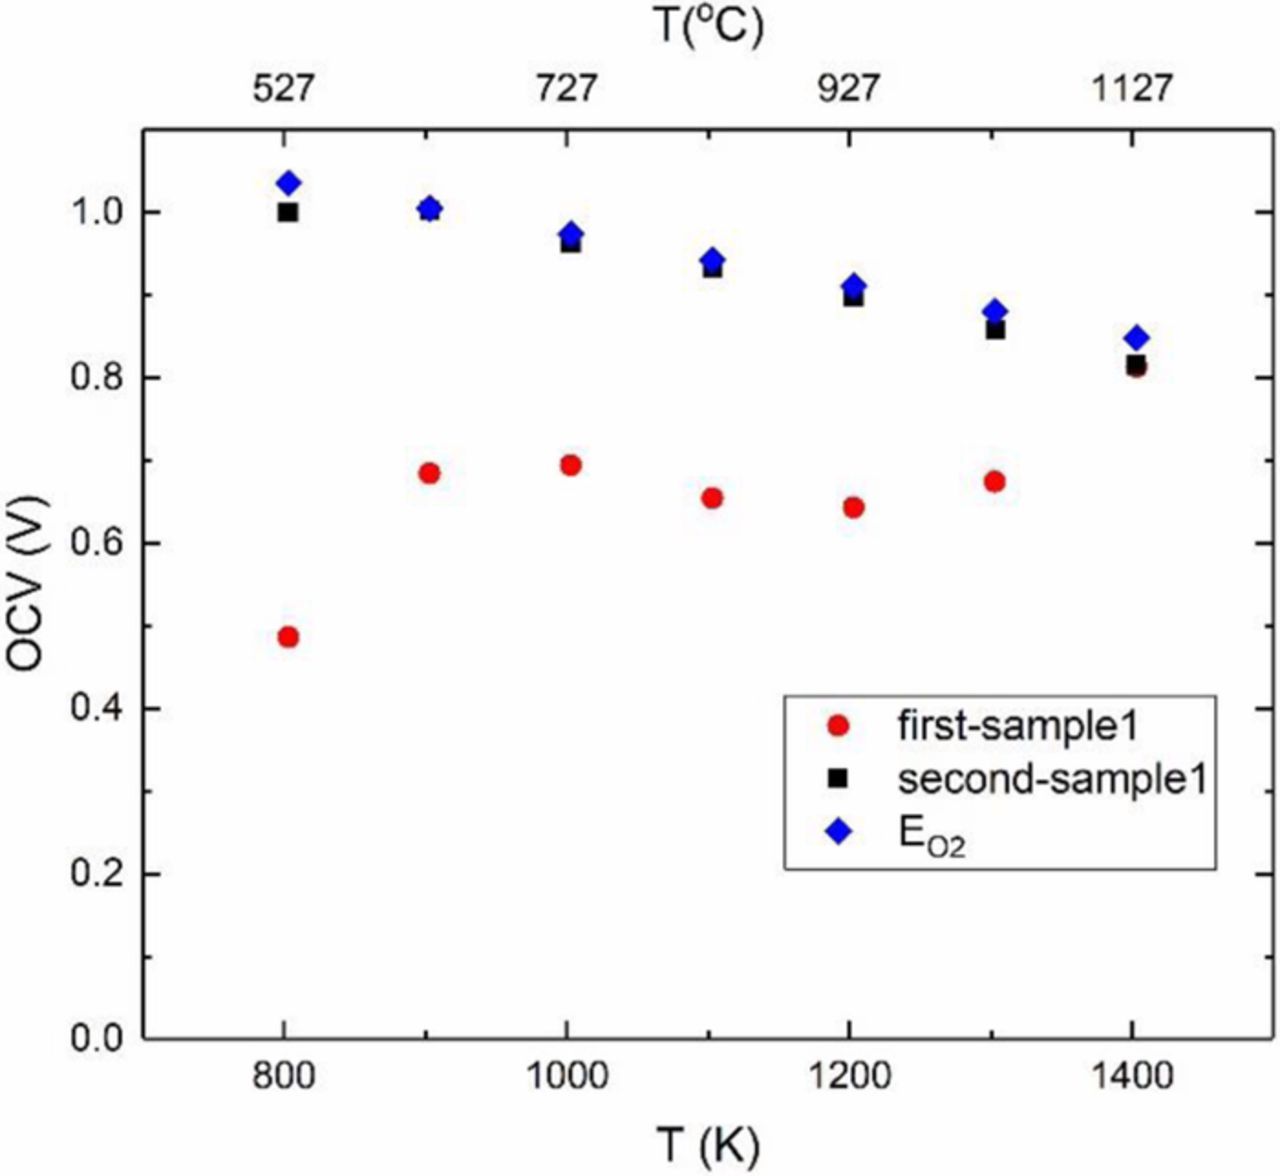
Figure 5. Measured open circuit voltage in the fuel cell mode for two consecutive tests and comparison with the calculated Nernst voltage corresponding to the applied oxygen chemical potential differential ( ).
).
The time dependence of the transport of Na+ ions is expected to be a function of the diffusion coefficient of Na+ ions in the sample,  . If the thickness of the sample is l, then the approximate time constant (the process is not exponential, so this is not exactly a time constant) required for equilibration is
![Equation ([3])](https://content.cld.iop.org/journals/1945-7111/166/10/F679/revision1/d0003.gif)
For a sample thickness of ∼2 mm, using the diffusion coefficient for Na-β-alumina given by Whittingham and Huggins,15 the estimated time constant is on the order of 30 minutes at 500°C, and decreases with increasing temperature. Once the gradient in  vanishes, this is effectively a parallel plate capacitor which is fully charged and thus does not reflect in the electrochemical measurements. Also, as only a small fraction of Na+ needs to be redistributed, the concentration of Na+ is essentially uniform throughout the sample. As the meter is connected to the two electrodes, oxygen reduction at one electrode and oxygen ion oxidation (or hydrogen oxidation) occurs at the other electrode (as determined by the very low level current that flows through the meter). The measured voltage thus corresponds to the corresponding Nernst voltage given by
![Equation ([4])](https://content.cld.iop.org/journals/1945-7111/166/10/F679/revision1/d0004.gif)
In terms of the Goldman-Hodgkin-Katz equation, it means the concentrations of Na+ are zero in both electrodes. In such case, the measured cell voltage only reflects oxygen chemical potential differential.
Testing under sodium chemical potential differential
Figure 3 shows a schematic of testing with a chemical potential differential of Na2O established across the sample. As the oxygen partial pressure is the same at the two electrodes, this effectively establishes a differential in chemical potentials of sodium at the two electrodes. The right electrode (Na-β-alumina + Na-β"-alumina) has a higher chemical potential of Na, μRNa, than the left electrode, (α-alumina + Na-β-alumina), μLNa. Thus, some sodium ions will migrate from right to left, making the left electrode positive. With the polarity of the meter as-connected, the measured cell potential should thus be negative. Figure 6 shows the measured cell potential during three cycles as the cell was heated from room temperature to ∼1000°C. As seen in the figure, the measured cell voltage is negative and is in the range from ∼ −0.03 V to ∼ −0.075 V. During the second run, data were also obtained at lower temperatures. At lower temperatures, the observed data represent transient conditions, indicating the sodium ion distribution had not stabilized. When stabilized, the cell voltage is given by
![Equation ([5])](https://content.cld.iop.org/journals/1945-7111/166/10/F679/revision1/d0005.gif)
where aRNa and aLNa are the thermodynamic activities of sodium at the right and the left electrodes, respectively. With the given polarity of the meter, the measured voltage is negative, as expected. The estimated ratio of the activities of sodium is in the range of 1.5 to 3. Many authors have reported on the activities of sodium (or sodium oxide) in the beta alumina system. There is a wide variation in the measured activities.16 This is attributed to the very refractory electrodes containing Na-β-alumina, Na-β"-alumina and α-alumina, which makes it difficult to ensure the establishment of equilibrium at low temperatures.
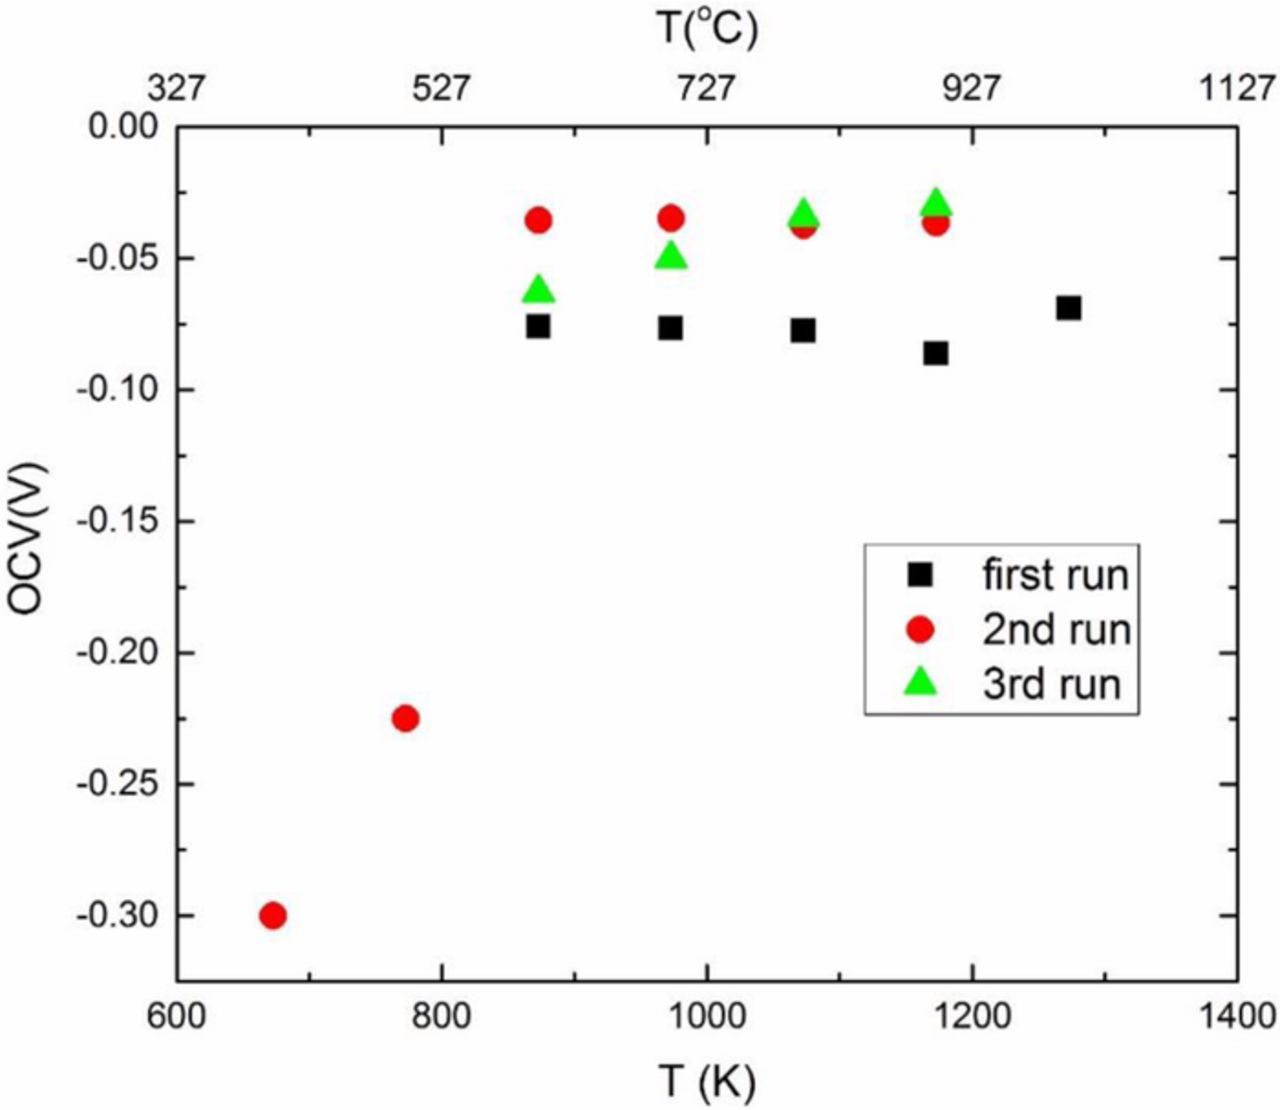
Figure 6. Measured open circuit voltage on sample 1 under a sodium chemical potential differential in three consecutive tests.
Up to this test, sample 1 had been tested for 28 h in fuel cell mode and an additional 87 h under sodium chemical potential differential. During this latter testing, it is expected that Na+ is essentially uniformly distributed, noting that the maximum potential as about 0.075 V due to sodium chemical potential differential. Thus, we expect the sample to return near its original state, insofar as the sodium distribution is concerned.
Retesting under fuel cell mode
The sample was again tested in fuel cell mode. Figure 7 shows the first fuel cell test in this series (which is the 3rd overall fuel cell test). At 500°C, the measured cell voltage was ∼0.82 V. But that at 600°C was ∼0.6 V and increased to ∼0.8 V at 900°C. The cell was cooled to room temperature and retested two more times (4th run and 5th run). The measured cell potential eventually returns to the estimated Nernst voltage corresponding to the oxygen chemical potential differential across the cell. This test essentially reproduces the results of the first set of fuel cell tests shown in Figure 4. Figure 8a shows the results of the final run in fuel cell mode on sample 1. The observed cell voltage was very close to the expected Nernst voltage corresponding to the oxygen chemical potential differential imposed. During this test, EIS was conducted at each temperature to measure the total conductivity of the sample, which includes both oxygen ion conduction through YSZ and sodium ion conduction through Na-β"-alumina. EIS was also conducted in air to measure the total conductivity. Both sets of data essentially overlap. There is some slight curvature in the Arrhenius plots at higher temperatures (Figure 8b). The approximate value of the activation energy is ∼0.36 eV, which is in between the values for sodium ion conduction in Na-β"-alumina and oxygen ion conduction in YSZ.
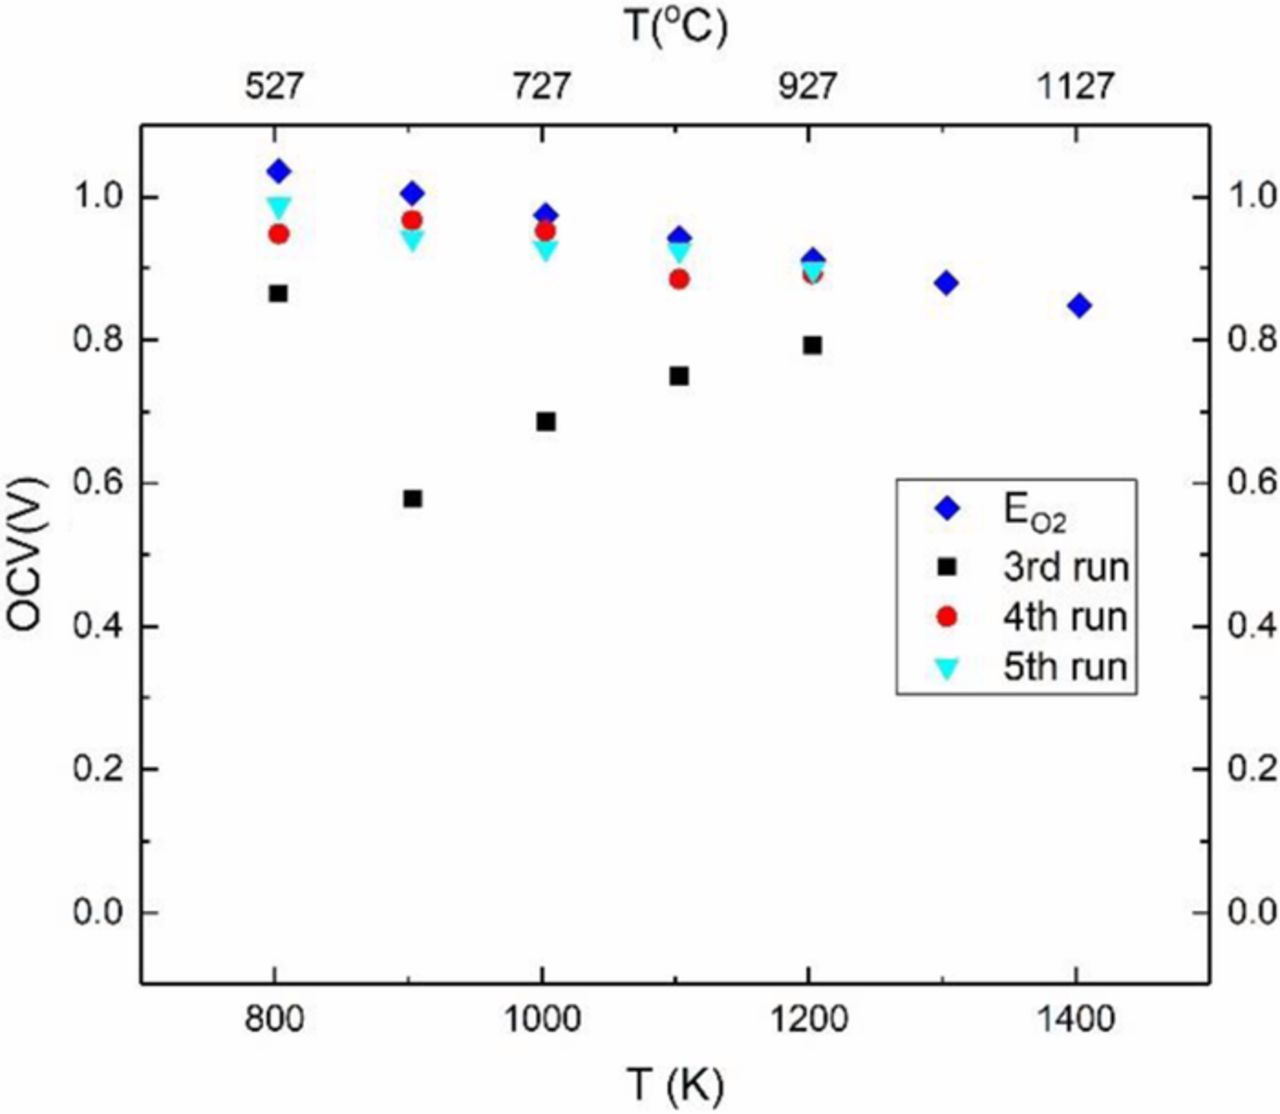
Figure 7. Open circuit voltage on sample 1 in fuel cell mode for three consecutive tests after the tests under chemical potential differential of sodium.
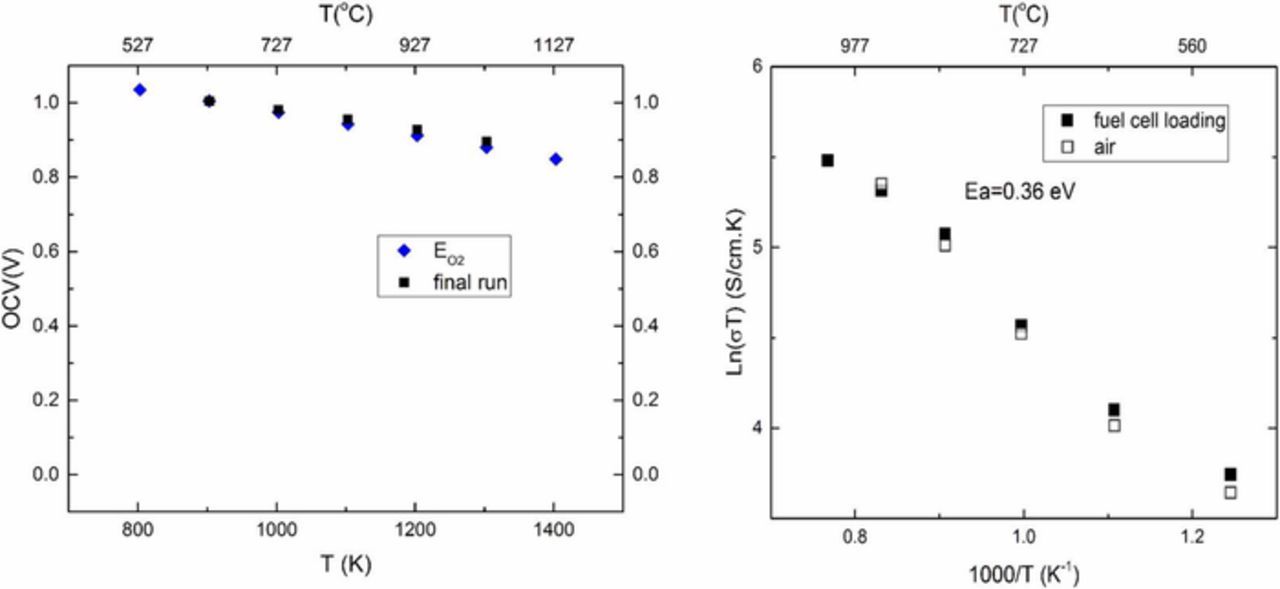
Figure 8. (a) Open circuit voltage of sample 1 in fuel cell mode and comparison with the calculated Nernst voltage ( ). (b) Arrhenius plots of conducivity of sample 1measured by EIS in air and under fuel cell mode.
The majority of the galvanic cell measurements were conducted using Keithley 6514 meter which has an input impedance of >200 TΩ. Previous tests on a YSZ disc using 6514 meter showed that the cell impedance (which includes the electrolyte resistance and the charge transfer resistances at the two electrodes) was much smaller that the meter resistance.17 In such a case, DC measurements accurately reflect the true cell voltage. Measurements of cell voltage were also made using Solartron electrochemical interface (SI 1287), which has an input impedance on the order of ∼10 GΩ. The use of a shield during the measurements lowered the input resistance of the SI 1287 to ∼66 kΩ. Figure 9 shows the cell voltage measured during fuel testing using both Keithely 6514 meter and SI 1287. Measurements made using Keithley 6514 meter correspond to the expected cell voltage over the entire range of temperatures measured, consistent with the expectations that the cell impedance was much lower than the meter input impedance. By contrast, the cell voltage measured with SI 1287 was much lower at lower temperatures. This suggests that at lower temperatures, the cell impedance was comparable to the SI 1287 impedance. As the temperature is increased, the cell impedance decreases. At and above 927°C, the cell voltage measured by SI 1287 essentially merges with that measured using Keithley 6514, indicating that above this temperature, the cell impedance is much lower than the input impedance of SI 1287. Szendrei et al.17 have proposed a new method of measuring cell impedance using two meters, one with impedance comparable to cell impedance and one with much higher impedance. Using this method the total conductivity (which includes electrode polarization resistances) was determined and is plotted in Figure 10. This conductivity was much lower than that measured by EIS. The corresponding activation energy was estimated as ∼1.08 eV. At this stage, sample 1 had been tested a total of 159 h in the fuel cell mode. Significant discrepancy between the conductivity measured by EIS shown in Figure 8b and by DC method of Szendrei et al.,17 while accounting of electrode effects, requires further scrutiny.
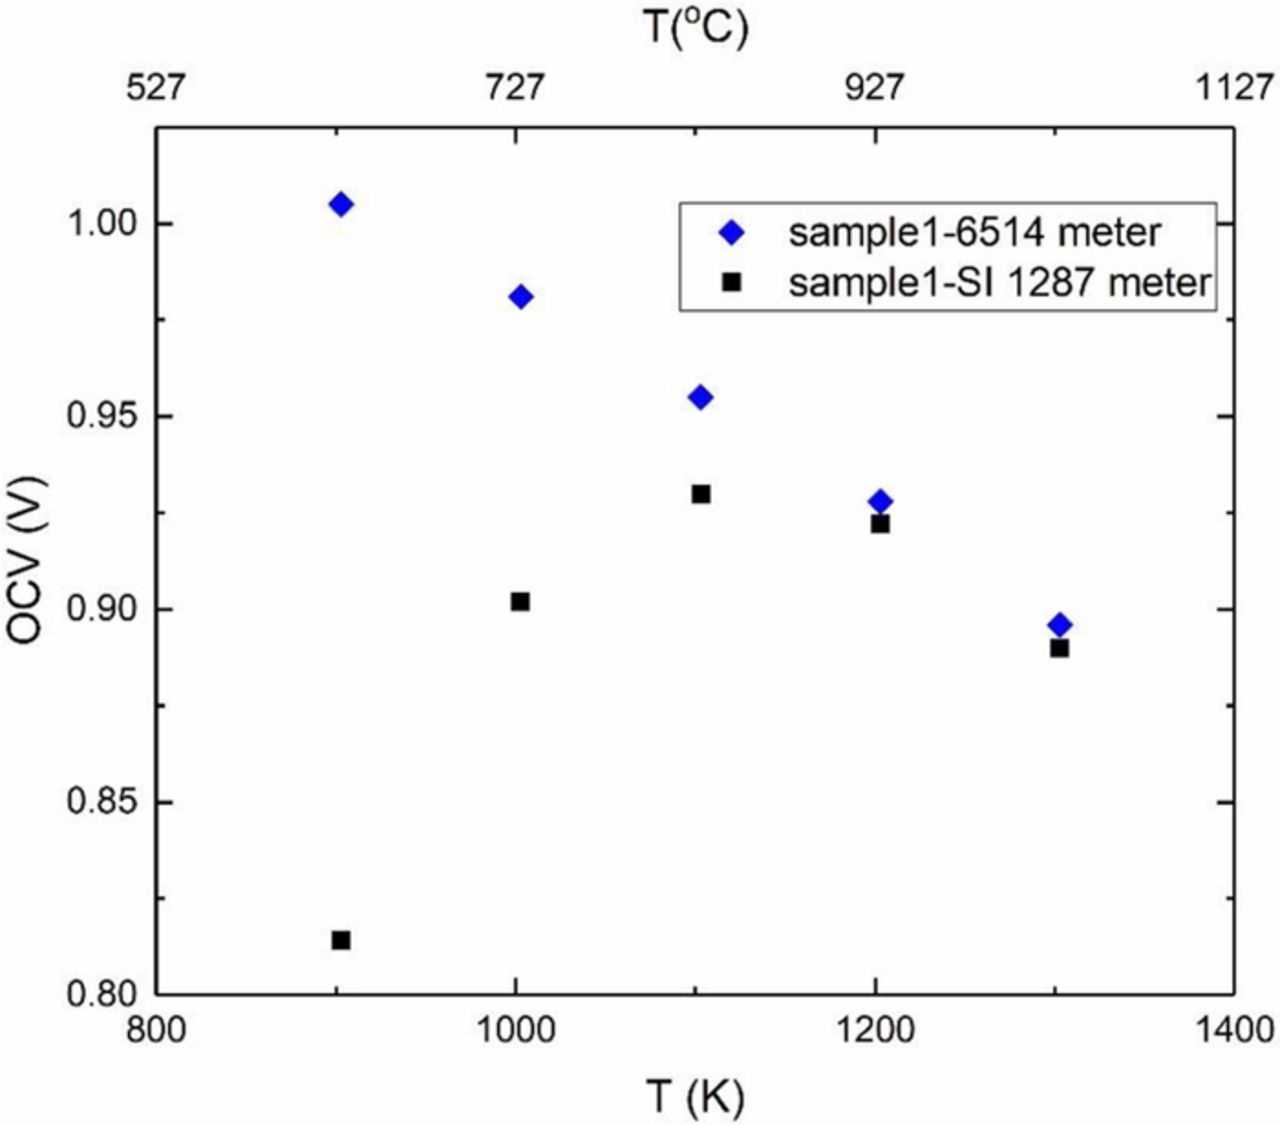
Figure 9. Comparison of the open circuit voltage of sample 1 in fuel cell mode measured by impedance/gain-phase analyzer (SI 1260) and by Keithley meter 6514.
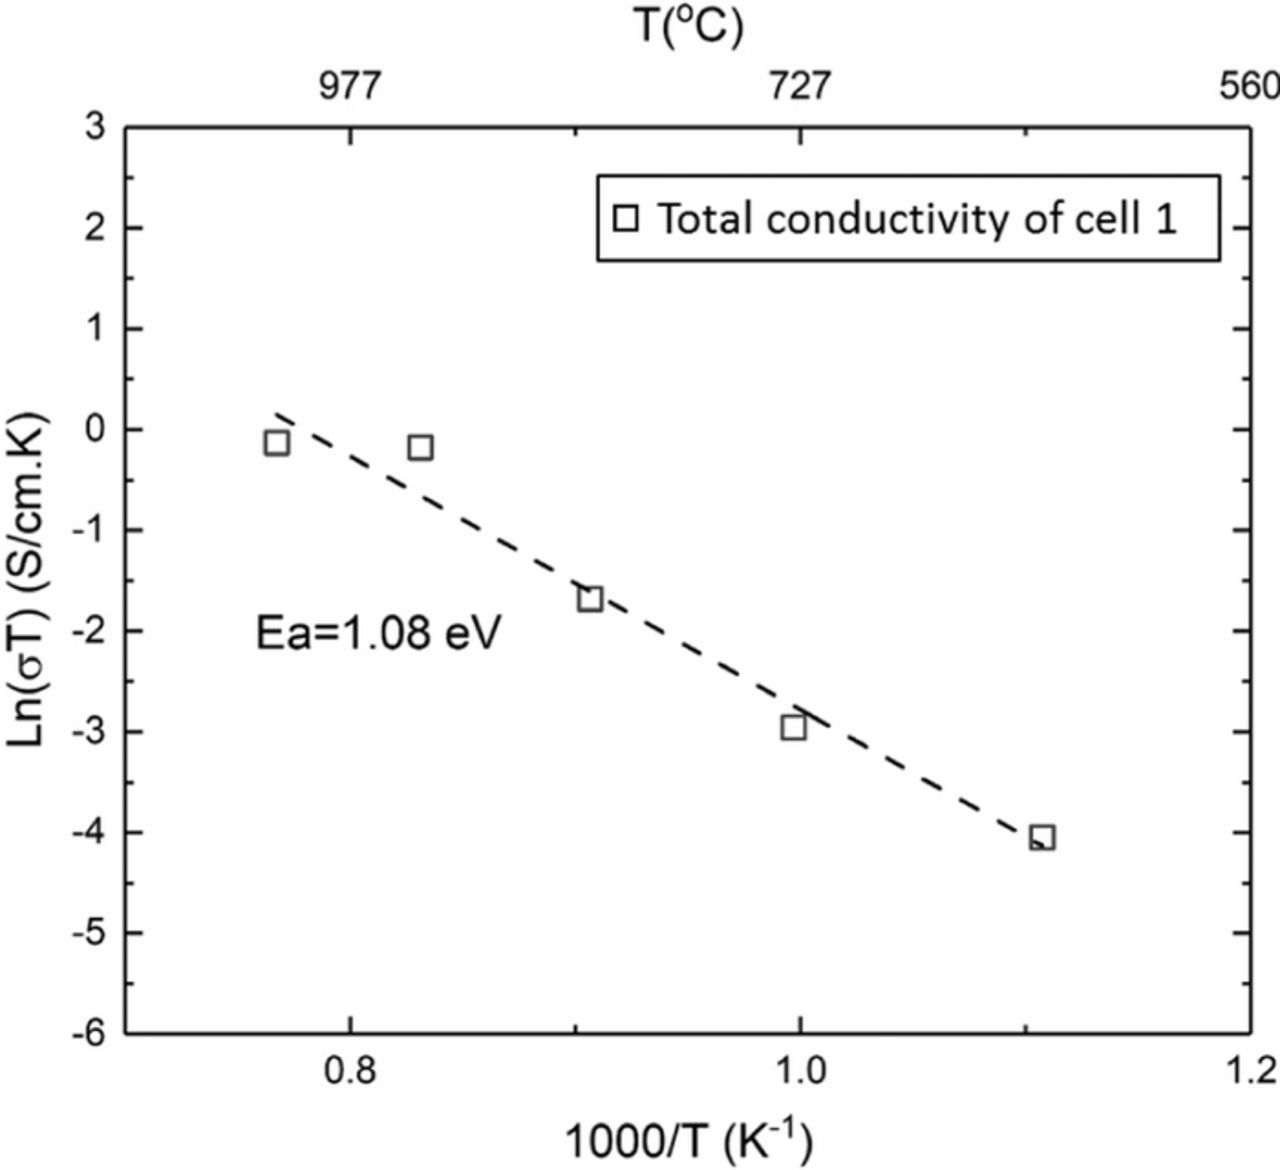
Figure 10. Arrhenius plot of the total conductivity (which includes electrode effects) of sample 1 under a fuel cell mode during the last test using the two meter DC method by Szendrei et al.17
Figure 11 shows the conductivity of the sample measured by EIS during the 8th experiment. Also included in Figure 10 are conductivity measurements by EIS on two as-fabricated samples and data on 8YSZ samples by Zhang et al.18 The conductivity of sample 1 is comparable to the other two pristine samples but is somewhat lower and also has a higher activation energy. Higher conductivity and lower activation energy of the composite samples compared to 8YSZ sample over much of the temperature range is consistent with higher sodium ion conductivity and lower activation energy of Na-β"-alumina than oxygen ion conduction in 3YSZ. In EIS measurements, conduction of both ions is reflected in the measurements. A possible equivalent circuit for EIS measurements is given in Figure 12a which includes contributions from the transport of Na+ ions across Na-β"-alumina/Na-β"-alumina grain boundaries (and the corresponding grain boundary capacitance) and from the transport of O2− ions across YSZ/YSZ grain boundaries (and the corresponding grain boundary capacitance). In an EIS study, at high frequencies the electrode capacitances as well as the grain boundary capacitances will be shorted out resulting in parallel resistances of Na-β"-alumina and YSZ (Figure 12b). In such a case, at low temperatures, conduction in Na-β"-alumina dominates. Lower activation energy than that in YSZ in Figure 12 is thus attributed to Na-β"-alumina.
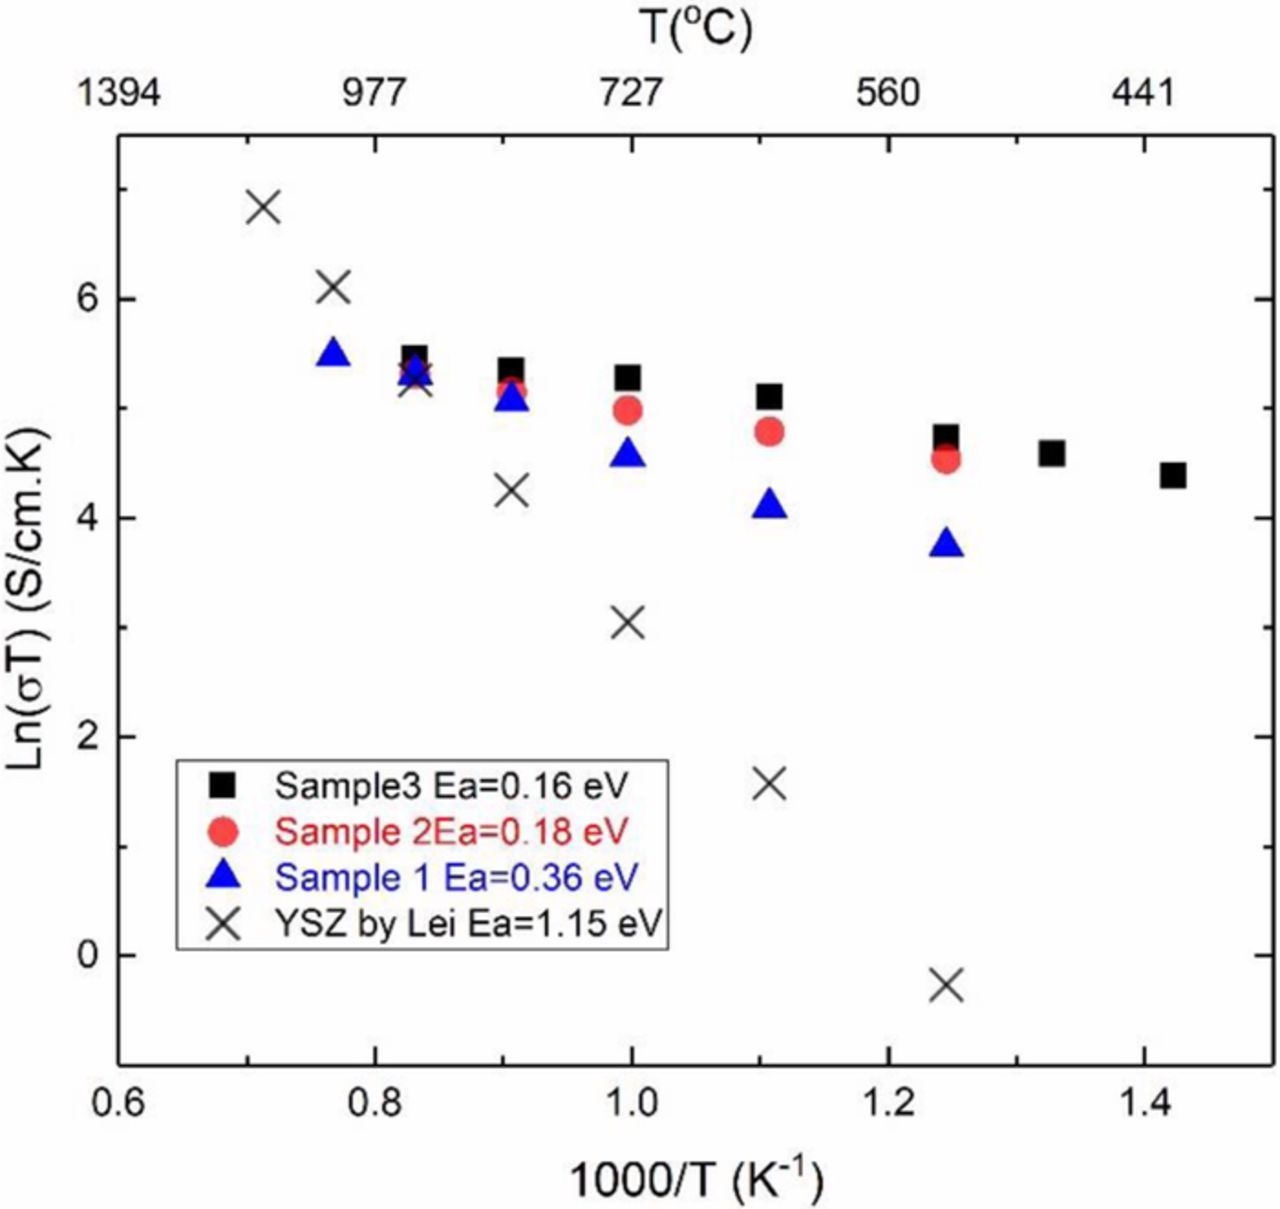
Figure 11. Comparison of Arrhenius plots of ionic conductivity of sample 1 and two pristine samples with that of 8YSZ.18
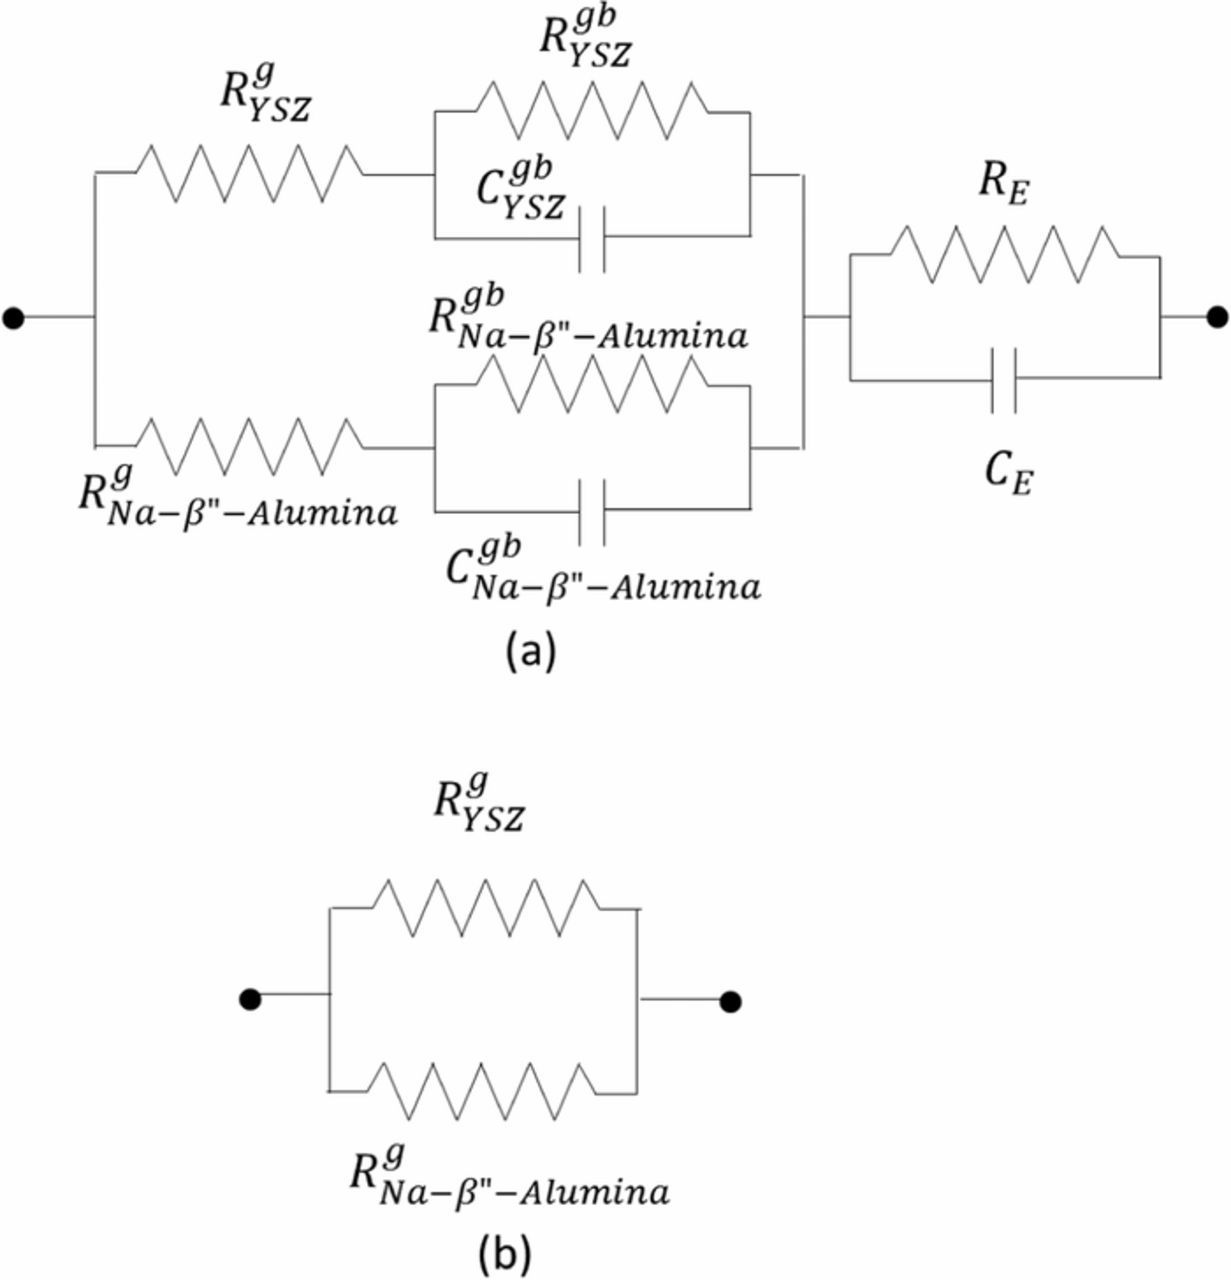
Figure 12. (a) An equivalent circuit for a Na-β"-alumina + YSZ composite (b) An equivalent circuit at high frequencies.
The large difference in the measured conductivities by DC (Figure 10) and EIS (Figure 11) on the sample after several tests suggests the presence of an insulating layer. In order to explore the possible origin, XRD patterns of the sample were obtained from the side exposed to fuel (anode) and that exposed to air (cathode). Figure 13 shows the corresponding XRD patterns. The cathode side pattern shows the presence of zirconia (TZ (111)), Na-β"-alumina and the Pt electrode. The anode side pattern, however, shows the presence of zirconia, α-alumina and Pt. No peaks corresponding to Na-β"-alumina are observed. This suggests that some of the Na-β"-alumina on the surface converted into α-alumina indicating a loss of Na2O and the layer is likely a few microns thick.
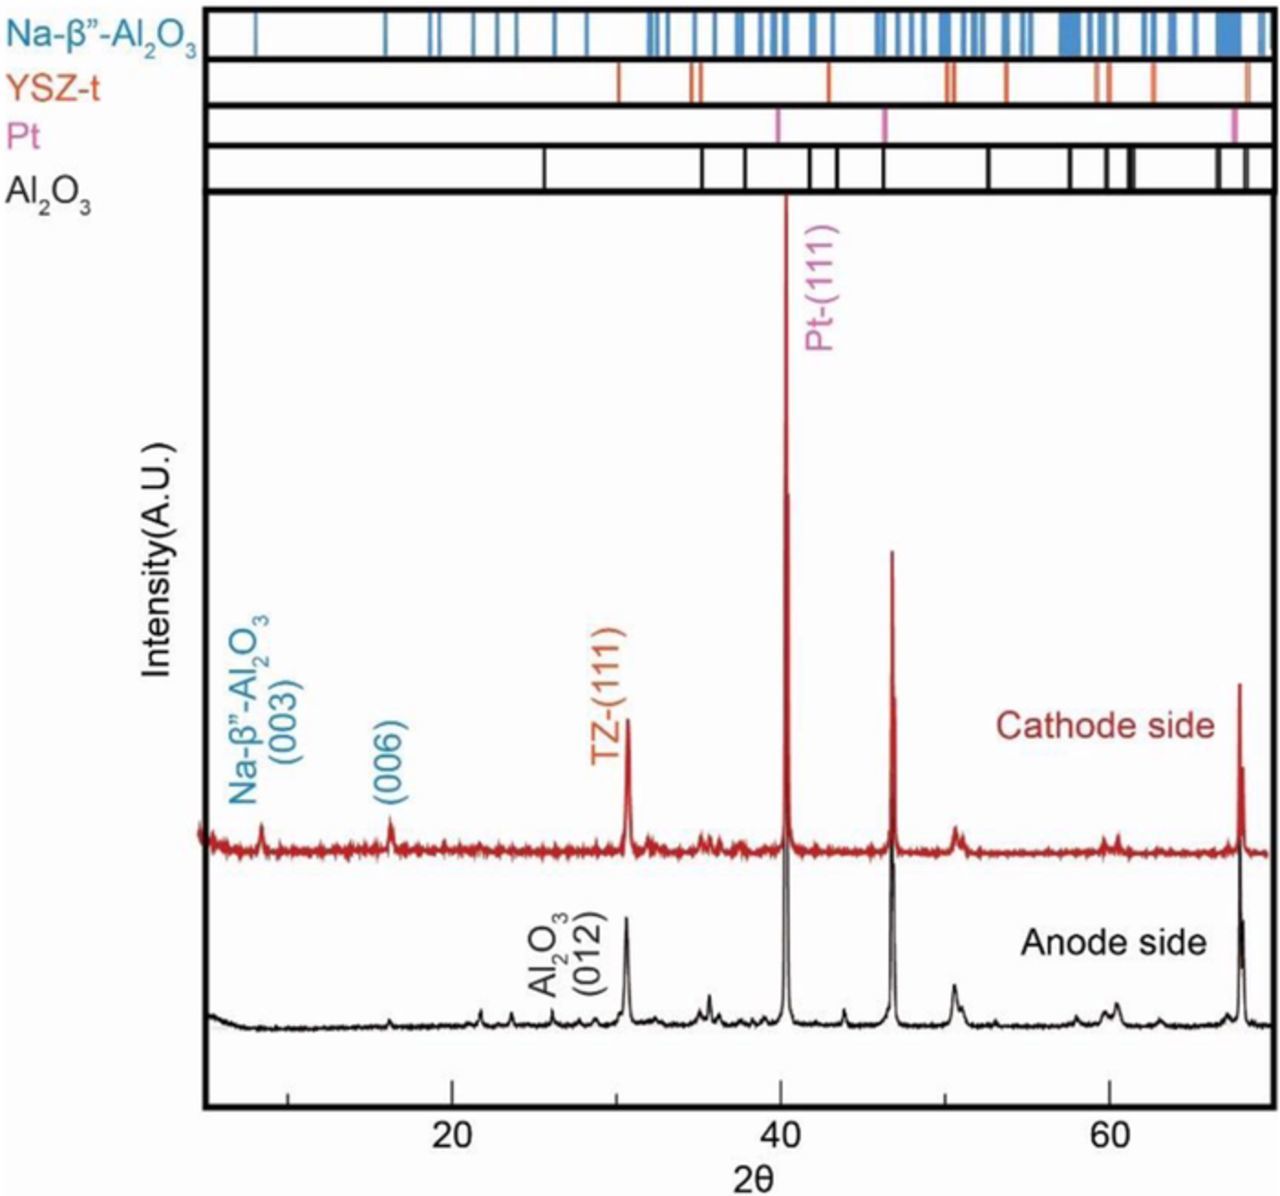
Figure 13. XRD patterns of sample 1; comparison from the cathode side and the anode side.
EDS analysis provides further insight into the degradation on the anode side. Figure 14a shows EDS line scan conducted on the cathode side and Figure 14b shows the corresponding SEM image. In the micrograph, the light phase is YSZ and the dark phase is Na-β"-alumina. The grain size is on the order 1 to 2 μm. The EDS scan was performed to a depth of ∼9 μm. The measurement of Na concentration using EDS is not accurate since it is an element with low atomic number. However, EDS does provide qualitative results for comparative purposes. Approximately periodic variation in the measured counts for Na, Zr and Al is consistent with the two phase material with a grain size on the order of 1 to 2 microns. On the cathode side one observes relatively high counts for Na (excluding edge effects). On the anode side (Figure 14c), however, one observes relatively low counts for Na but correspondingly high counts for Al. This is consistent with loss of Na (or more precisely loss of Na2O) from the anode side and the formation of α-alumina. Figure 14d shows the corresponding SEM on the anode side. A thin layer of about 2 μm appears light in color, and is probably a thin alumina layer. Also, along with Na2O loss, there should be a local loss of volume. This could produce some porosity, which should be on a nano-scale and thus not resolved at the magnification of the SEM image.
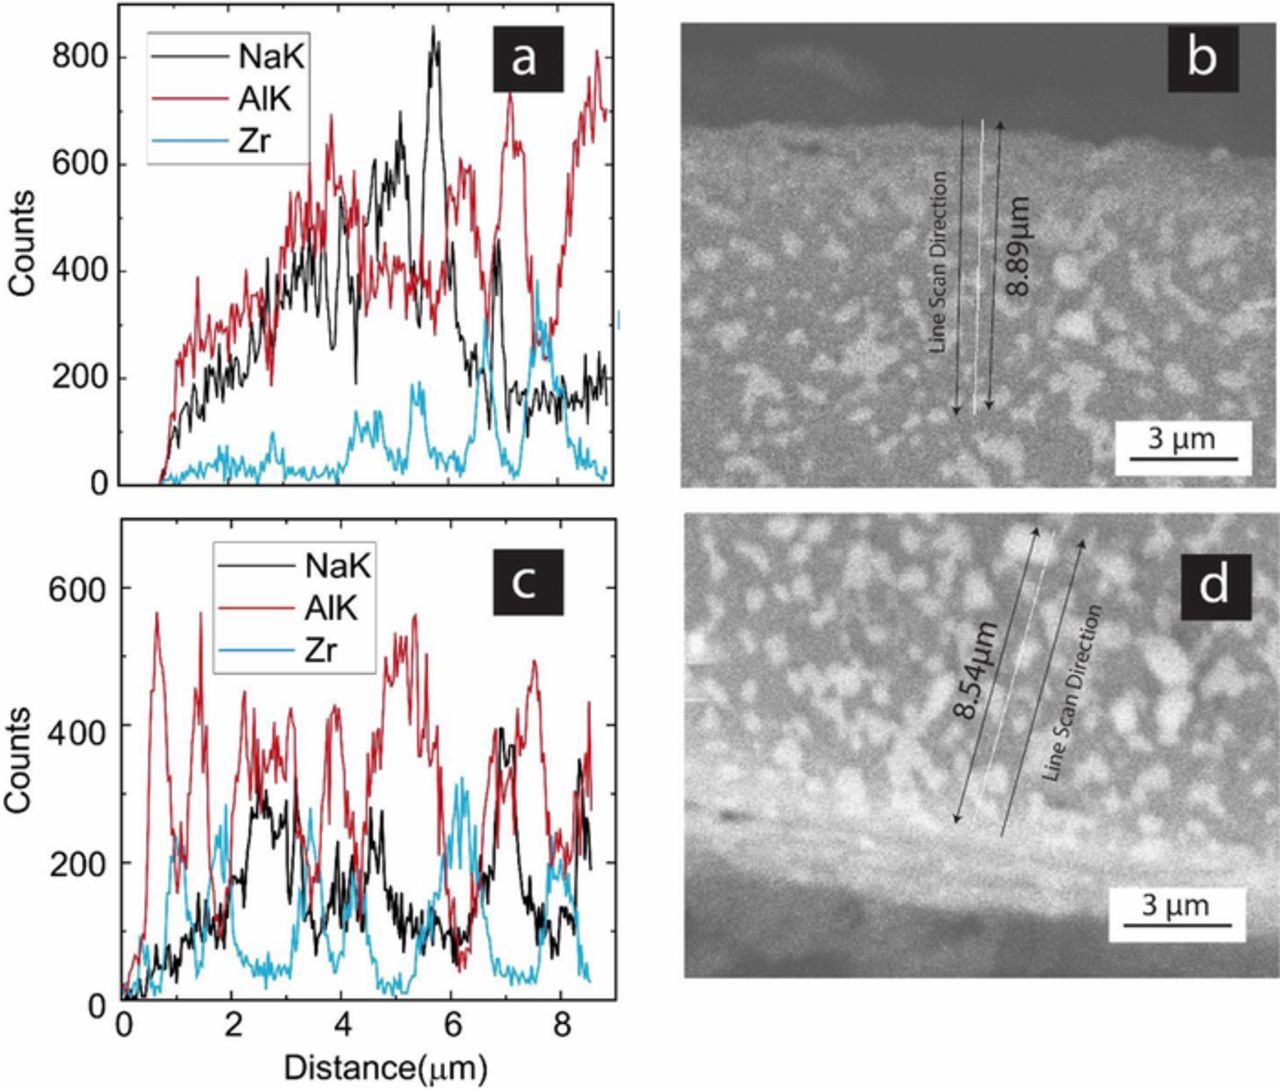
Figure 14. (a) EDS analysis of sample 1, cathode side. (b) The corresponding SEM micrograph. (c) EDS analysis of sample 1, anode side. (d) The corresponding SEM micrograph.
Loss of Na2O requires some transport of Na+ and O2− in a 2:1 ratio. This process likely occurs by a coupled transport of 2Na+ through Na-β"-alumina and O2− through YSZ. The depth of Na2O loss is limited to a couple of microns because once a thin layer of α-alumina is formed, further decomposition is difficult since diffusion coefficient of Na+ through α-alumina is expected to be small. However, if the α-alumina layer formed is porous, coupled transport may continue to occur through the underlying Na-β"-alumina + YSZ composite, thus leading to continued degradation.
The formation of a thin layer of α-alumina and the possible porous layer, in addition to the electrode polarization resistances, is likely the reason for the observed large difference in the measured total conductivity via DC and AC methods after multiple fuel cell tests (Figures 10 and 11). In a DC measurement with a thin layer of α-alumina on the surface, the measured conductivity is expected to be low as seen in Figure 9. Also, in DC measurements electrode polarization resistances are included in the measurements. By contrast, in EIS measurements, the thin layer could be represented as a parallel R-C circuit and could be shorted out at high frequencies. In such a case, the measured total conductivity will be representative of transport of Na+ through Na-β"-alumina and of O2− through YSZ. For this reason, the total conductivity in the EIS measurements (triangles in Figure 11) is orders of magnitude higher than the DC measurements shown in Figure 10. There is also a large difference in activation energies, consistent with expectations. The effects of degradation are also apparent in EIS measurements when the conductivity measurements on the degraded sample (triangles in Figure 11) are compared to the results on pristine samples (circles and squares in Figure 11) – the conductivity in the degraded sample is lower and the corresponding activation energy is higher.
In order to test if a sample of Na-β"-alumina + YSZ degrades in a reducing atmosphere, similar to that on the anode side, a pristine sample was placed in a furnace under a flowing gas mixture of 10% H2 and balance N2, bubbled through a water bath maintained at 40°C. Tests were conducted at two temperatures, 800°C and 1100°C, for 7 days. The weight of the sample was measured before and after the tests. No change was observed in the sample tested at 800°C. The weight of the sample decreased by about 1.1% in the sample tested at 1100°C in the reducing atmosphere. In the conversion process, the weight of the original α-alumina + YSZ sample increased by about 6.1%. This suggests that about 18% of Na2O was lost through the vapor phase in the reducing atmosphere at 1100°C. There were no signs of degradation. XRD of the sample before and after are shown in Figure 15. No alumina peaks were detected and the XRD patterns before and after the test were virtually identical. Thus, the loss of Na2O must have occurred throughout the sample, probably uniformly, via a coupled transport of 2Na+ through Na-β"-alumina and O2− through YSZ. This suggests that some aspects of the electrochemical test in which the cell was subjected to an oxygen chemical potential differential with meter connected must have contributed to the observed degradation.
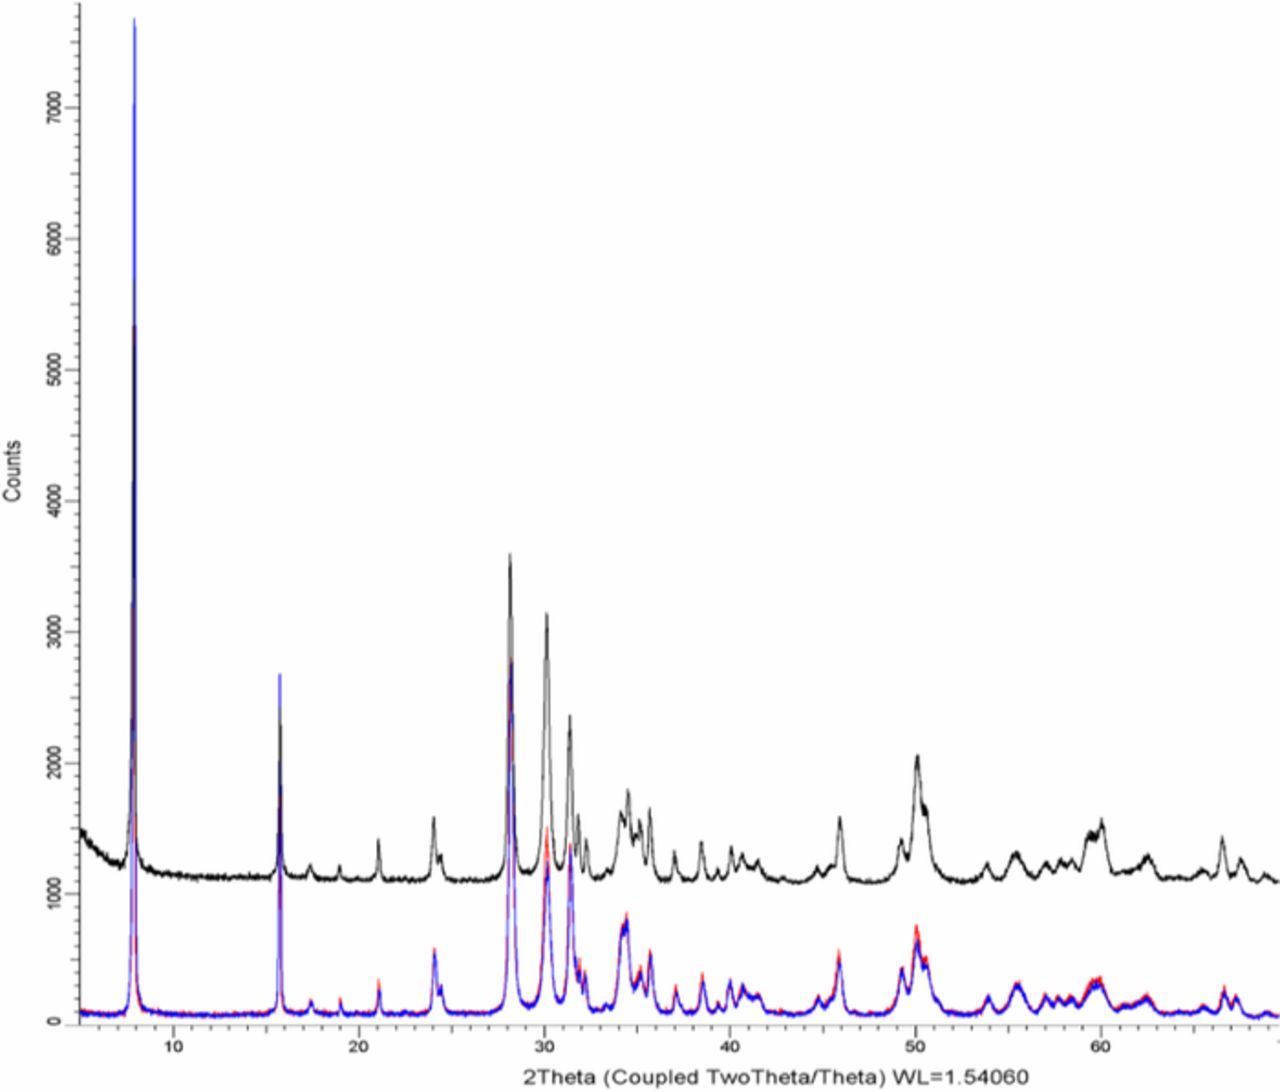
Figure 15. XRD pattern of a pristine sample (top). XRD pattern of the sample after exposing to H2/H2O/N2 gas mixture for 7 days at 1100°C (bottom).
Summary
Samples of two phase Na-β"-alumina +YSZ were fabricated by vapor phase conversion of sintered two phase composites of α-alumina + YSZ. The resulting samples are mixed Na+ ion and O2− ion conductors. A disc with platinum electrodes was tested in a fuel cell mode (at open circuit) thus applying an oxygen chemical potential differential. In the initial tests, the OCV observed was lower than the expected Nernst voltage. This result was attributed to the transient transport of Na+ ions in an attempt to nullify the Nernst voltage. Once the Na+ ion distribution achieved a stable state, the observed Nernst voltage was consistent with the expectation of a fuel cell mode. The cell was also tested under a sodium chemical potential differential using α-alumina + Na-β-alumina as one electrode and Na-β-alumina + Na-β"-alumina as the other electrode. From the measurements the ratio of sodium activities in the two electrodes was determined. The cell was retested several times in the fuel cell mode. The cell on the anode side degraded leading to the formation of a thin layer of alumina suggesting a loss of Na2O through the vapor phase. This resulted in a large increase in the total resistance as measured using a DC method. In the measurements made using EIS, the conductivity was much higher (albeit lower than pristine samples). This suggests that in EIS measurements, the thin surface layer of alumina was shorted out at high frequencies. Mixed Na+ ion and O2− ion conductor thus can be used to investigate electrochemical systems involving differentials in both oxygen and sodium chemical potentials at the two electrodes. Also, since sodium ions can be replaced by other alkali ions, as well as by divalent cations and trivalent cations by ion exchange,9–11 this composite electrolyte may also be suitable for thermodynamic studies involving two species into many other systems.
Acknowledgments
This work was supported in part by the National Science Foundation under grant numbers DMR-1407048 and DMR-1742696, and in part by the US Department of Energy under grant number DE-FG02-03ER46086.
ORCID
Taylor D. Sparks 0000-0001-8020-7711
Anil V. Virkar 0000-0003-4530-6807