Abstract
A mechanism of cobalt bottom-up trench fill for advanced node interconnect metallization was studied. The mechanism in question employs a single additive which suppresses cobalt plating and directly impacts the plating rate. Hydrogen, generated simultaneously during plating by electrolysis, reacts with the suppressor via hydrogen reduction, and the product of this reaction is a deactivated form of the suppressor. The local plating rate is governed by the relative concentrations of the activated/deactivated forms. Cyclic voltammetry (CV) shows that the suppressor deactivation is impacted by electrochemical potential, suppressor concentration, rotation rate, and pH, all of which may be controlled to generate bottom up fill in interconnects. Such impacts were confirmed on the plating of patterned coupons. This hydrogen reduction-induced deactivation mechanism provides a theoretical explanation for bottom-up plating in a single additive bath, and the factors that may impact the bottom-up filling.
Export citation and abstract BibTeX RIS

This is an open access article distributed under the terms of the Creative Commons Attribution 4.0 License (CC BY, http://creativecommons.org/licenses/by/4.0/), which permits unrestricted reuse of the work in any medium, provided the original work is properly cited.
As on-chip interconnect sizes continue to shrink to address the increased device density needs, conductor metal properties become more and more important in the quest for integrating toward a complete solution at 7 nm nodes and beyond. Recent work has suggested the use of short electron Mean Free Path (MFP) metals in order to continue scaling down device size without running into resistance scaling effects the traditional metals bring.1–3 Additional improvements are being sought in reducing heterogeneous interfaces, both metal to metal as well as dielectric to metal, to reduce overall scattering events and thus reduce effective resistance of conductor traces and contact interfaces. Seams formed during metal Chemical Vapor Deposition (CVD) processes and interfaces due to multi-metal barrier and liner stacks are detrimental to performance for state of the art device designs. Byproducts formed during the traditional tungsten via filling necessitate thicker barriers, thereby reducing the total conductor volume and further reducing the interconnect conductance. Recent development strategies have implemented cobalt as a favorable MFP interconnect metal for contact interconnect levels already at 10 nm node4 and is also considered for use as a conductor in higher metal levels. CVD cobalt has been considered, but appears too costly and time consuming for high volume manufacturing. Electro chemical deposition (ECD) of cobalt is deemed the most promising candidate, and has already been implemented into manufacturing lines of the advanced chip manufacturers.
Some cobalt superconformal fill mechanisms for through silicon vias5 and submicrometer trenches6–8 have been reported in the literature. One such mechanism is termed S-shaped negative differential resistance (S-NDR), which functions by competition between additive adsorption/desorption and consumption characterized by hysteresis and inhibition breakdown in CV. The current-dependent consumption or disruption of the additives may cause the inhibition breakdown, which also induces superconformal cobalt filling of submicrometer trenches.5,6 Similar breakdown of the suppression and a hysteresis in CV was also reported to enable the preferential deposition at the bottom of a small damascene feature.7 Recently the differential current efficiency fill mechanism was proposed to give superconformal cobalt fill in sub-50 nm interconnect features.8
In our previous paper, we proposed a hydrogen induced deactivation (HID) model for cobalt bottom-up fill in sub-5 nm features.9 In this work, the additive deactivation is further studied and hydrogen reduction is believed to cause the additive deactivation. This paper details a theoretical model for the bottom-up fill phenomenon as observed in the single additive cobalt electrodeposition process developed by Atotech.
Experimental
Electrolyte
The VMS (Virgin Makeup Solution) contains 0.05M CoSO4.7H2O and 0.5M H3BO3 adjusted to pH 4.2. In the pH test, H2SO4 was added to adjust the pH to 2.5 and 3. The plating bath is made with 0.1 mM Atomplate Co Suppressor XF in VMS, unless otherwise specified.
Cyclic voltammagram(CV)
All CV experiments were performed using a Metrohm RDE equipped with an automated dosino system. A Pt rod and Ag/AgCl electrode were used as the counter and reference electrode, respectively. A Pt RDE (3mm) pre-plated with Co was used as the working electrode, as follows. Before each experiment, the Pt RDE was electrochemically cleaned in 0.5M H2SO4 by scanning between −0.45 and 1.95V. The cell was then rinsed with DI water. For the pre-plating of Co, 20ml of VMS was added in the cell and the cell was purged with N2 for 15min. Then a thin layer (∼340 nm) of Co was deposited on the Pt working electrode in VMS at 10mA/cm2 for 100 s, while rotating at 1000RPM. The additive was then added to the cell and N2 purge was switched off. Finally the CV was run at a scan rate of 5mV/s. The rotation rate is 30 rpm during CVs unless otherwise specified.
Coupon plating
Electrolytic cobalt plating was carried out in a 500 mL bath. A Ag/AgCl electrode and cobalt anode were used as reference and counter electrodes respectively. Coupons measuring approximately 25 × 25 mm were cleaved from wafers. The patterned coupons used in the bottom-up filling experiment had a 4 nm thick CVD Co seed. The opening of the features varied from 2nm to 100nm. Before plating, the bath was purged for 15 minutes with N2. The temperature of the bath was kept at room temperature. Plated coupons were rinsed with deionized water and immediately dried with compressed N2. Cross sectional images were obtained by FIB-SEM (FEI Helios Nanolab 450S), and were used to evaluate fill behavior.
Results and Discussion
Additive deactivation mechanism
In our previous work, we proposed an additive deactivation mechanism of Co bottom-up fill (Fig. 1). We demonstrated that the presence of a hysteresis in the CV scan is associated with a bottom up filling capability, while the absence of such hysteresis is associated with conformal plating.9 Fig. 2a shows that the forward scan is shifted cathodically in the presence of Atomplate Co Suppressor XF compared to VMS, while in the reverse scan, the traces of Atomplate Co Suppressor XF and VMS overlap. In other words, Atomplate Co Suppressor XF acts as a suppressor (activated mode) in the forward scan, but loses the capacity for suppression (deactivated mode) in the reverse scan. This means one single additive can give two very different currents at the same potential (Δi in Fig. 2a), depending on whether the additive is activated or deactivated. This phenomenon has significant importance in bottom up filling since it enables variations in plating rate at different locations within a sample or within a feature. The local current in the interconnect features is governed by the surface coverage of the activated and deactivated additive. If a higher ratio of deactivated/activated additive can be achieved at the bottom of the feature as compared to the field and upper sidewall, then a void-free bottom up filling becomes possible. Fig. 2b shows a single additive bath that can fill features with pre-plate opening dimensions in the range of 2–100nm.
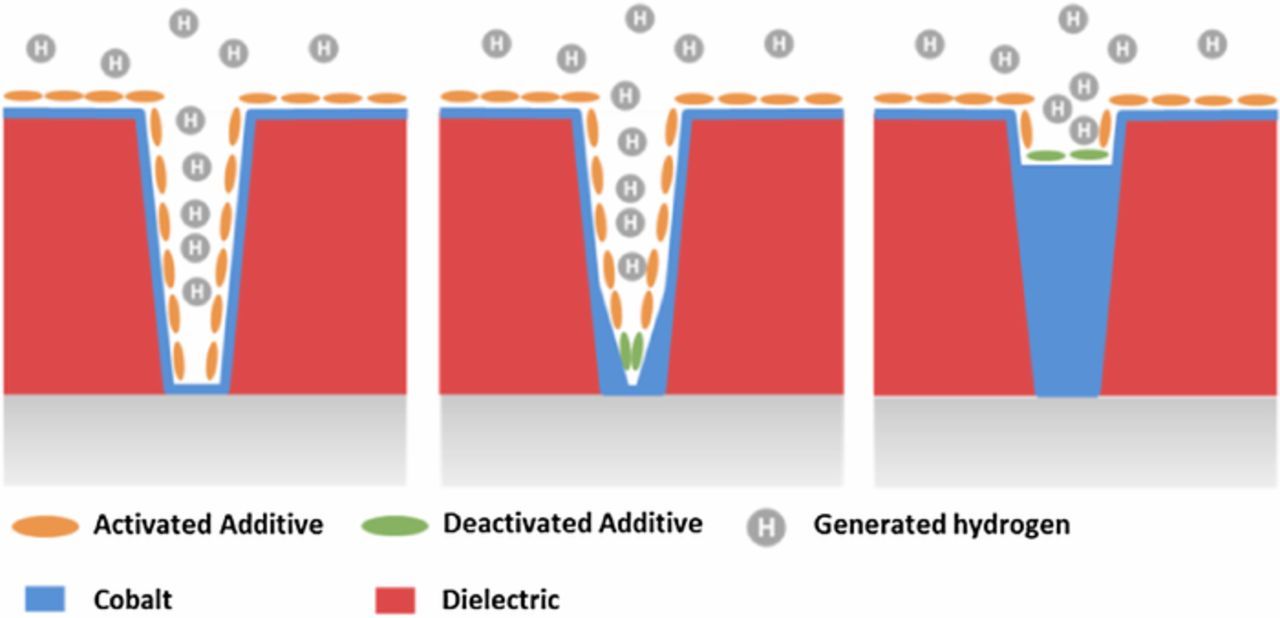
Figure 1. Additive deactivation mechanism of cobalt bottom-up fill.
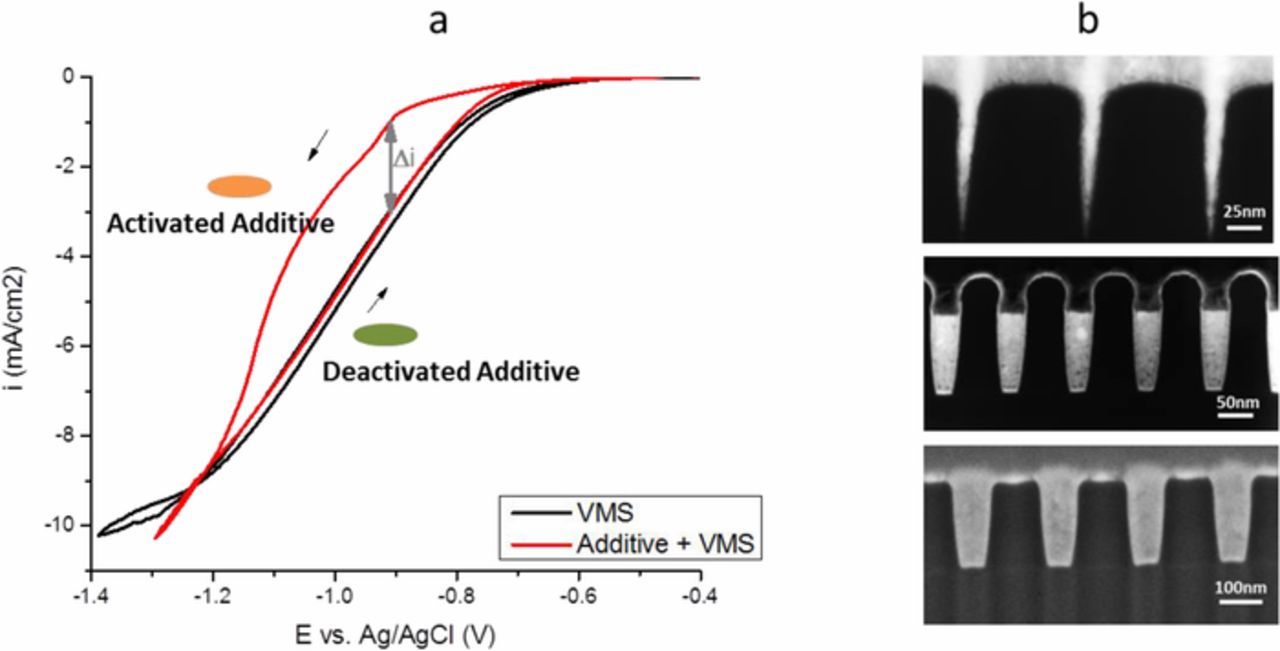
Figure 2. a: Cyclic voltammetry of VMS (black line) and Atomplate Co Suppressor XF (red line). The activated form of Atomplate Co Suppressor XF is schematically represented by the orange oval, and the deactivated form as a green oval, see Fig. 1. b: Bottom up filling of damascene features with pre-plated opening of 2nm (top), 48nm (middle) and 100nm (bottom).
The central question in this report relates to why the additive in the bottom of the feature is deactivated, yet remains activated in the field. Three hypotheses are discussed to explain this deactivation: H1. the additive is desorbed from the surface at some cathodic potential. H2: The additive is deactivated by an electrochemical reaction at some cathodic potential. H3. the additive is deactivated by a reaction with some other by-product. There are a limited number of species in the bath, and a limited number of reaction candidates; for the purposes of this paper, we will restrict ourselves to Reactions 1–5. Reactions 1 and 2 represent cobalt plating and hydrogen evolution respectively, and are in competition with each other in the relevant potential range. Reaction 1 is inhibited by the presence of Atomplate Co Suppressor XF as seen in Fig. 2a, represented by the adsorption Reaction 3. Reaction 4 (hypothetical H2) shows an electrochemical reduction of Atomplate Co Suppressor XF producing a deactivated form D. Reaction 5 (hypothetical H3) illustrates hydrogen reduction of Atomplate Co Suppressor XF into a deactivated form D.
![Equation ([1])](https://content.cld.iop.org/journals/1945-7111/166/1/D3136/revision1/d0001.gif)
![Equation ([2a])](https://content.cld.iop.org/journals/1945-7111/166/1/D3136/revision1/d0002.gif)
![Equation ([2b])](https://content.cld.iop.org/journals/1945-7111/166/1/D3136/revision1/d0003.gif)
![Equation ([Reactions 2a + 2b = Reaction 2])](https://content.cld.iop.org/journals/1945-7111/166/1/D3136/revision1/d0004.gif)
![Equation ([3])](https://content.cld.iop.org/journals/1945-7111/166/1/D3136/revision1/d0005.gif)
![Equation ([4])](https://content.cld.iop.org/journals/1945-7111/166/1/D3136/revision1/d0006.gif)
![Equation ([5])](https://content.cld.iop.org/journals/1945-7111/166/1/D3136/revision1/d0007.gif)
A series of experiments were performed to illustrate the impact of plating parameters on additive deactivation, thus illustrating mechanistic properties of the above.
Cyclic voltammetry
Co(II)-free bath
To test the first two hypotheses, a CV scan was performed in a plating bath with no cobalt in solution, sweeping across the range of potential relevant for cobalt plating from −0.4 V to −1.6 V vs. Ag/AgCl (Fig. 3). The test solution contained Atomplate Co Suppressor XF in boric acid (0.5M), compared to a control sample containing only boric acid. In the case of H1 or H2, a desorption and/or electrochemical reduction reaction (see Reactions 3 and 4), a reduction peak would occur in the Atomplate Co Suppressor XF trace somewhere within this potential window. Fig. 3 shows the results of this experiment, and it is observed that the two traces nearly overlap: there is no reduction peak attributable to Atomplate Co Suppressor XF. Thus, these results fail to support H1 and H2, but say nothing about H3 (Reaction 5). Indeed, since Atomplate Co Suppressor XF is apparently electrochemically inert at the absence of Co(II), any electrochemical investigation of the mechanism of Atomplate Co Suppressor XF must be indirect, i.e. illustrated through the effect on the Co plating signal. Thus further electrochemical testing of H3 was performed in cobalt plating baths.
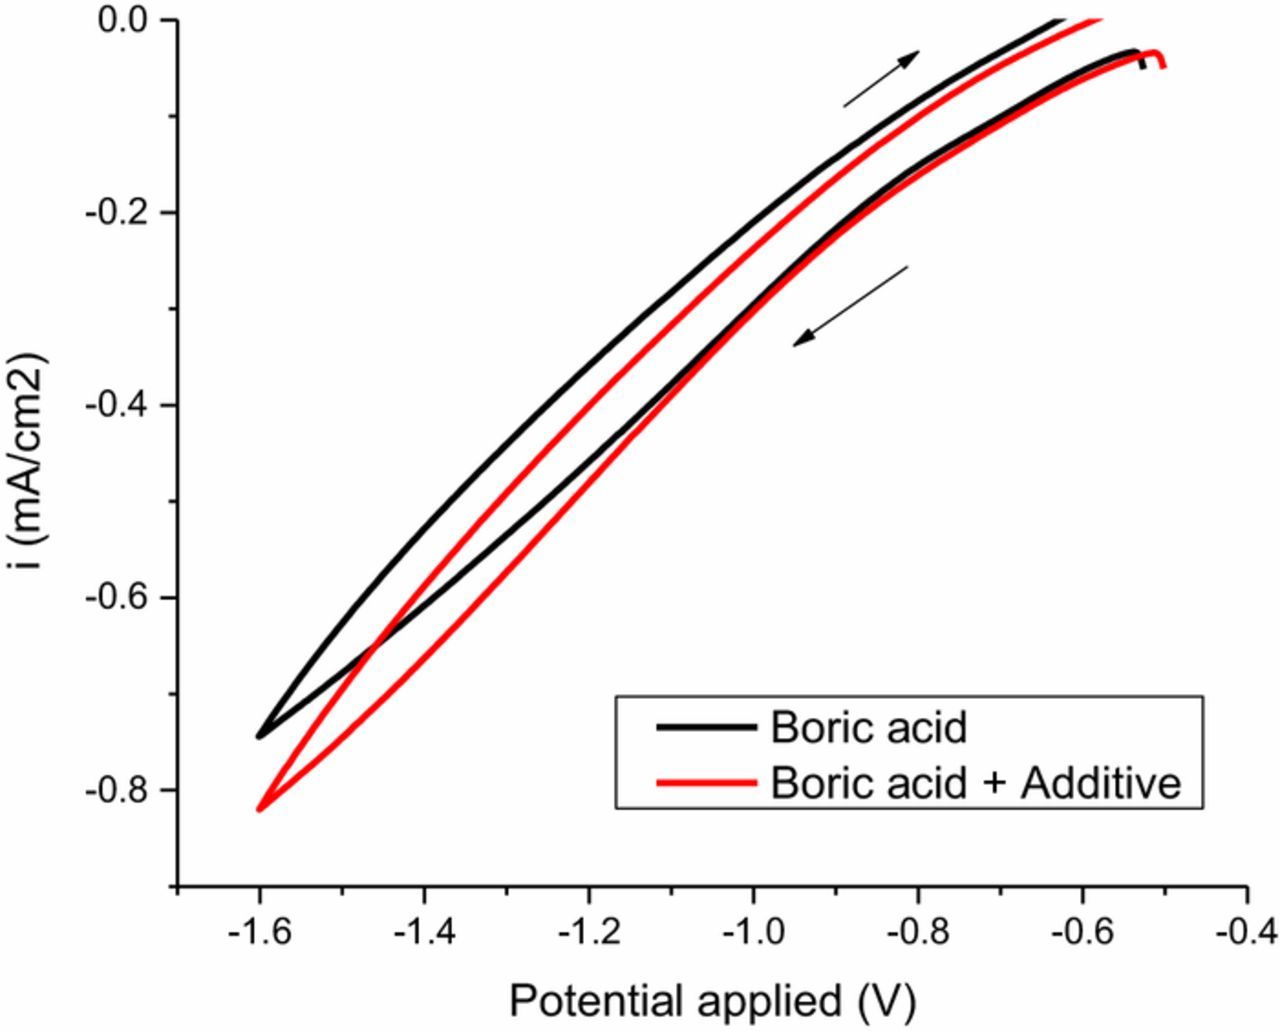
Figure 3. Cyclic voltammetry of boric acid (black line) and boric acid + 0.1mM Atomplate Co Suppressor XF (red lines).
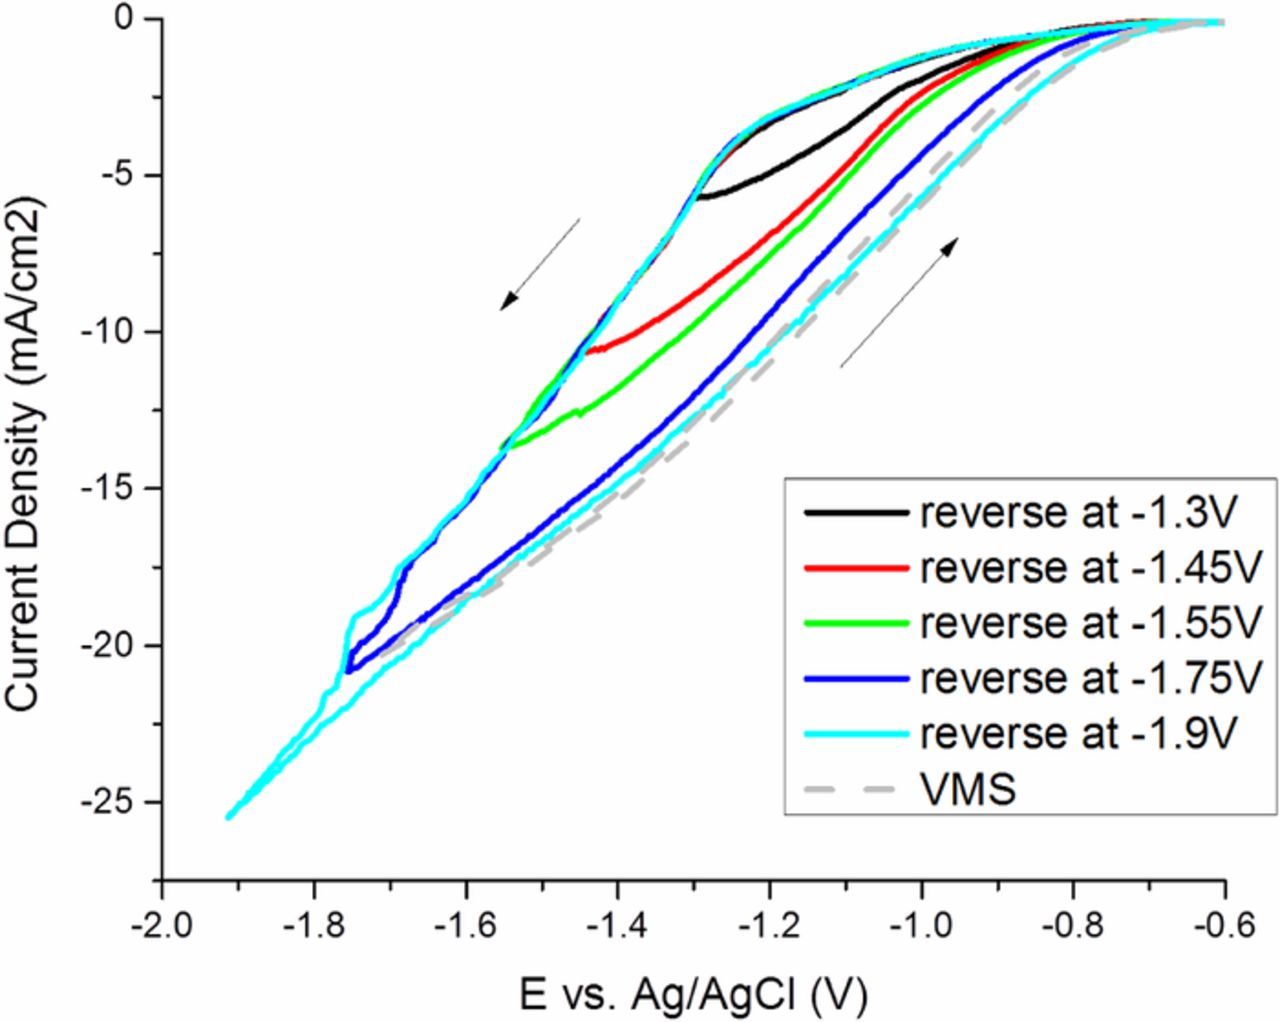
Figure 4. Cyclic voltammetry of VMS (dash line) and Atomplate Co Suppressor XF (solid lines) with different switching potential.
Co(II)-containing bath
A series of CVs were performed starting the cathodic sweep from −0.4 V, where the test solution contained VMS and Atomplate Co Suppressor XF, compared to a control sample containing VMS only. The results in Fig. 4 show that in the forward scan Atomplate Co Suppressor XF suppresses Co plating (activated mode), which is observable by the cathodic shift compared to the VMS-only trace. The key parameter in this experiment is the cathodic switching potential, which was varied from −1.3V to −1.9V. Traces in the reverse scan direction vary with the switching potential: more negative switching potentials cause the reverse scan to move closer to the position of the VMS scan. For example, when the forward scan was reversed at −1.3V, reverse scan potential is more positive than the forward scan, but still more negative than that of VMS. So under the same potential, current density was greater at the reverse scan vs. the forward scan, but still less than that of VMS. When the forward scan was reversed at −1.9V, the reverse scan completely overlaps with the trace for VMS. Collectively, these data suggest that Atomplate Co Suppressor XF is adsorbed on the electrode during the forward scan, is partially deactivated at moderate cathodic potentials, and is completely deactivated after reaching a higher cathodic potential. These data lend much to the discussion of H3 above. Due to the close reduction overpotentials of cobalt (Reaction 1) and hydrogen (Reaction 2), hydrogen is produced during electrodeposition throughout the CV scan.10–12 Current efficiency measurements support this assertion (Fig. 5a). The current efficiency was less than 100% under all tested current density in both the presence and absence of additive. In both cases, current efficiency decreased with current density, meaning more percentage of current was contributed to hydrogen reduction rather than cobalt reduction. However, the total amount of hydrogen produced was still larger at high current than that at low current. This can be seen in Fig. 5b, where the current density for hydrogen reduction ( = current efficiency x total current density) increased with current density. Atomplate Co Suppressor XF contains a functional group that can be reduced by hydrogen on metal surface such as Co, Ni or Pd.13 Thus, it is reasonable to suppose that hydrogen reduction can cause deactivation of the additive by hydrogenation of this functional group (Reaction 5). H3 is supported by the CV scans in Figure 4: in the case of an excess supply of hydrogen generated at very cathodic switching potential of −1.9V, the entire supply of Atomplate Co Suppressor XF is consumed by Reaction 5 and the return scan overlaps with VMS.
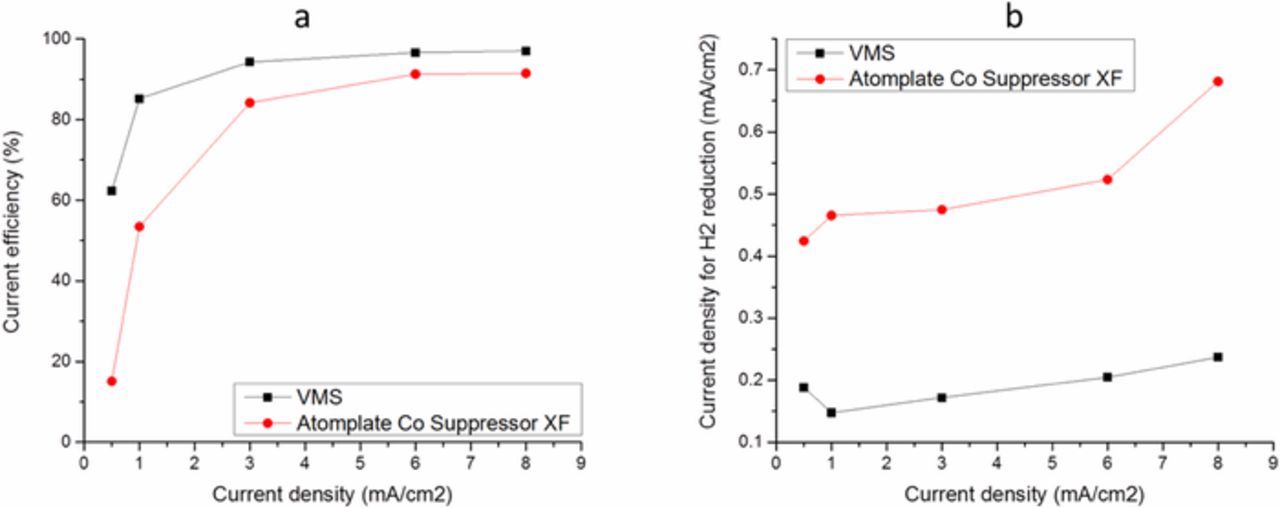
Figure 5. Current efficiency (a) and current density for hydrogen reduction (b) of Co bath in the absence (black line) and presence (red line) of 0.08mM Atomplate Co Suppressor XF. Rotation rate: 30rpm.
This proposed mechanism of additive deactivation is illustrated in Fig. 6. Protons are reduced to H· and adsorbed on freshly deposited metallic Co. Two H· can either combine with each other to form H2, or combine with the functional group to reduce the additive. As the functional group is reduced, the additive loses its capacity for suppression and is deactivated. The deactivated species then desorbs from the surface, and the surface becomes additive-free. The surface can be fully covered with activated additive, completely free of additive, or partially covered with additive depending on the local supply of replenishing additive and H·. When the forward scan is reversed at a moderate switching potential (−1.3V), the additive on the surface is only partially deactivated as the amount of H· that is generated is not enough to reduce all additive that is adsorbed and locally available for replenishment. When the switching potential is more cathodic (−1.9V), the amount of generated H· is sufficient to reduce all adsorbed Atomplate Co Suppressor XF and all fresh additive as it is transported toward the metal surface. It is straightforward to speculate that the amount of activated/deactivated Atomplate Co Suppressor XF at the surface ought to be dependent on the concentration of protons (pH), concentration of additive, and the rate of replenishment (flux of flow). All three factors were studied with CV and coupon plating as described in the following experiments for the further testing of H3 and the hydrogen reduction mechanism.
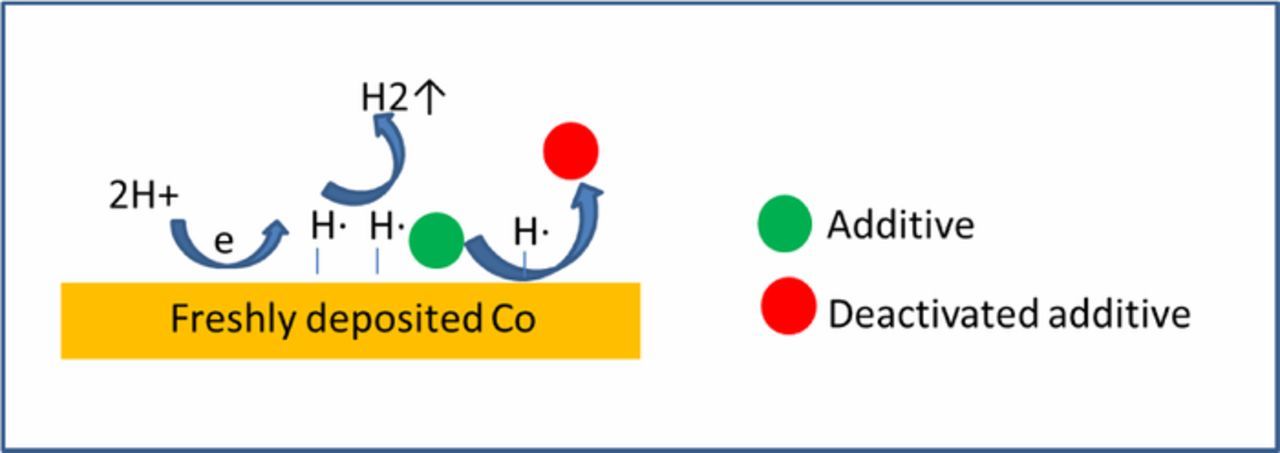
Figure 6. Illustration of additive deactivation by hydrogen reduction.
Impact of pH
If hydrogen reduction is the mechanism of additive deactivation, then a higher proton concentration ought to accelerate the deactivation reaction and thus weaken the suppression effect. A series of CVs were performed in solutions containing Atomplate Co Suppressor XF at various pH values between 2.5–4.2, and were compared to control solutions of VMS only adjusted to the same pH values (Fig. 7). The cathodic switching potential was adjusted such that each trace reached a similar final current density of approximately i = −5.5 mA/cm2. Fig. 7 shows the results of this experiment: suppression strength is reduced as pH is reduced from 4.2 to 2.5. As mentioned previously, hydrogen is generated throughout this potential region. At lower pH, more hydrogen is available from outset, so in the case where all other conditions remain the same the deactivation of Atomplate Co Suppressor XF is accelerated. Therefore, in both forward and reverse scan, the suppression provided by Atomplate Co Suppressor XF is weakened at lower pH. The magnitude of the hysteresis within the CV scan Δi also decreases at lower pH.
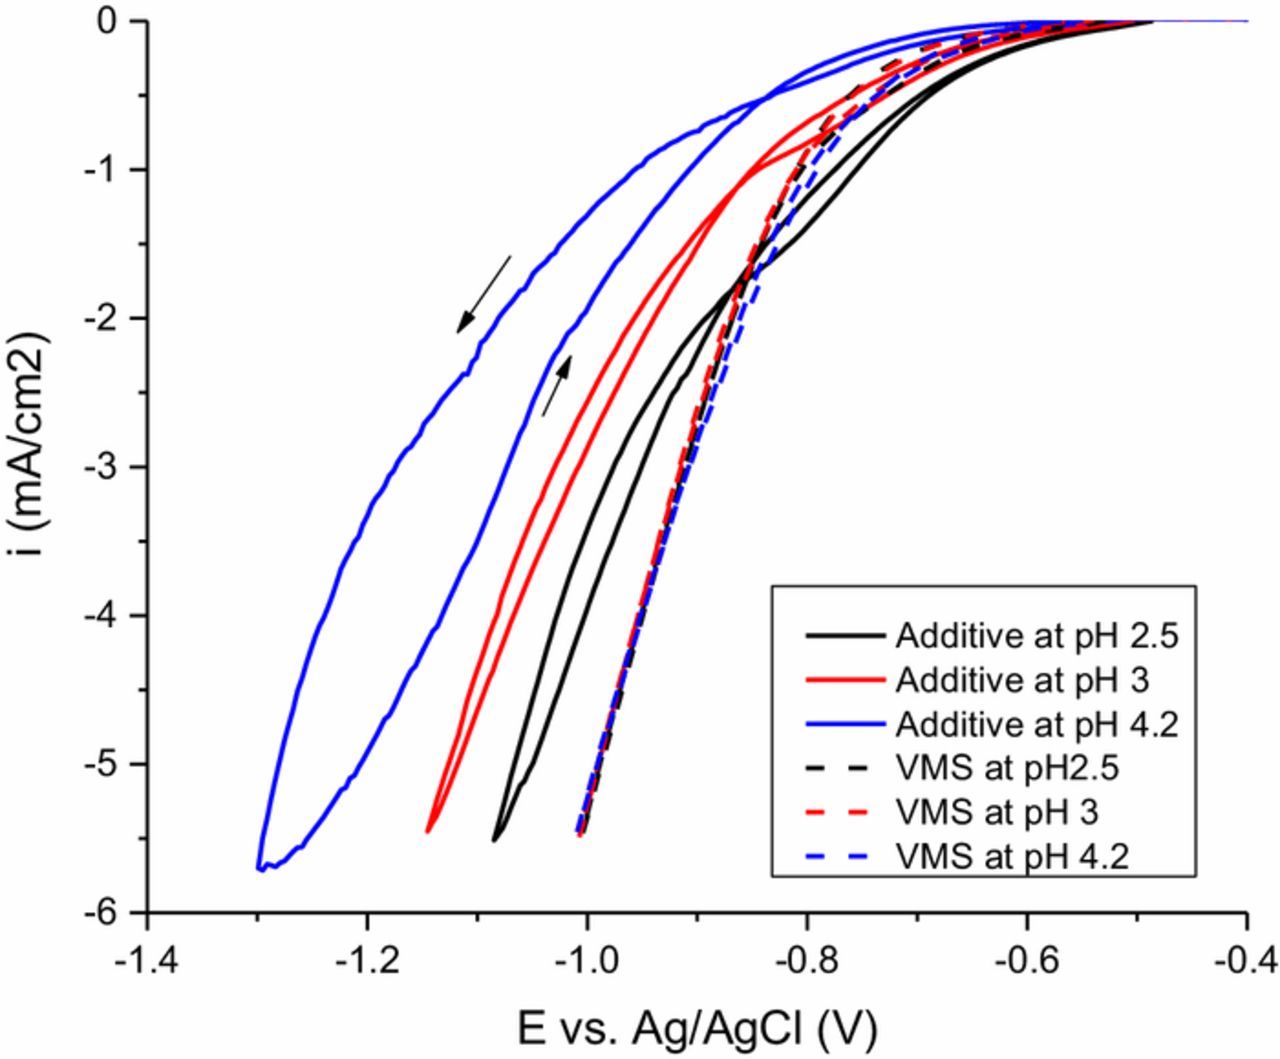
Figure 7. Cyclic voltammetry of Atomplate Co Suppressor XF (solid lines) and VMS (dash lines) at pH 2.5 (black lines), pH 3 (red lines) and pH 4.2 (blue lines). Rotation rate is 100 rpm.
Impact of additive concentration
It is straightforward to suppose that suppression strength ought to depend on the availability of the suppressor species Atomplate Co Suppressor XF. A series of CV scans containing various concentrations of Atomplate Co Suppressor XF were performed, in the range of 0.0–0.8mM. The cathodic switching potential was controlled such that the maximum current density for each concentration was approximately −10mA/cm2. The results in Fig. 8 show that suppression strength increases with increasing concentration in both the forward and reverse scans. This may be easily observed by comparing the forward scan between concentrations in the range 0.0–0.4mM, where higher concentration of Atomplate Co Suppressor XF display decreased current density, or stronger suppression, at a given potential, due to increased surface coverage of the active form of Atomplate Co Suppressor XF. So too in the reverse scan, where at higher concentrations more activated Atomplate Co Suppressor XF is available when the amount of H· generated remains similar between traces. At 0.4 mM the surface is apparently saturated with Atomplate Co Suppressor XF, since the CV trace does not shift noticeably at 0.8 mM vs. 0.4 mM. The size of hysteresis is smaller at 0.8 mM, which again may be attributed to greater availability of Atomplate Co Suppressor XF compared to the concentration of hydrogen driving Reaction 5. Collectively, the data in Fig. 8 show that suppression strength in both forward and reverse scan may be controlled through the concentration of Atomplate Co Suppressor XF, in support of the hydrogenation reaction mechanism.
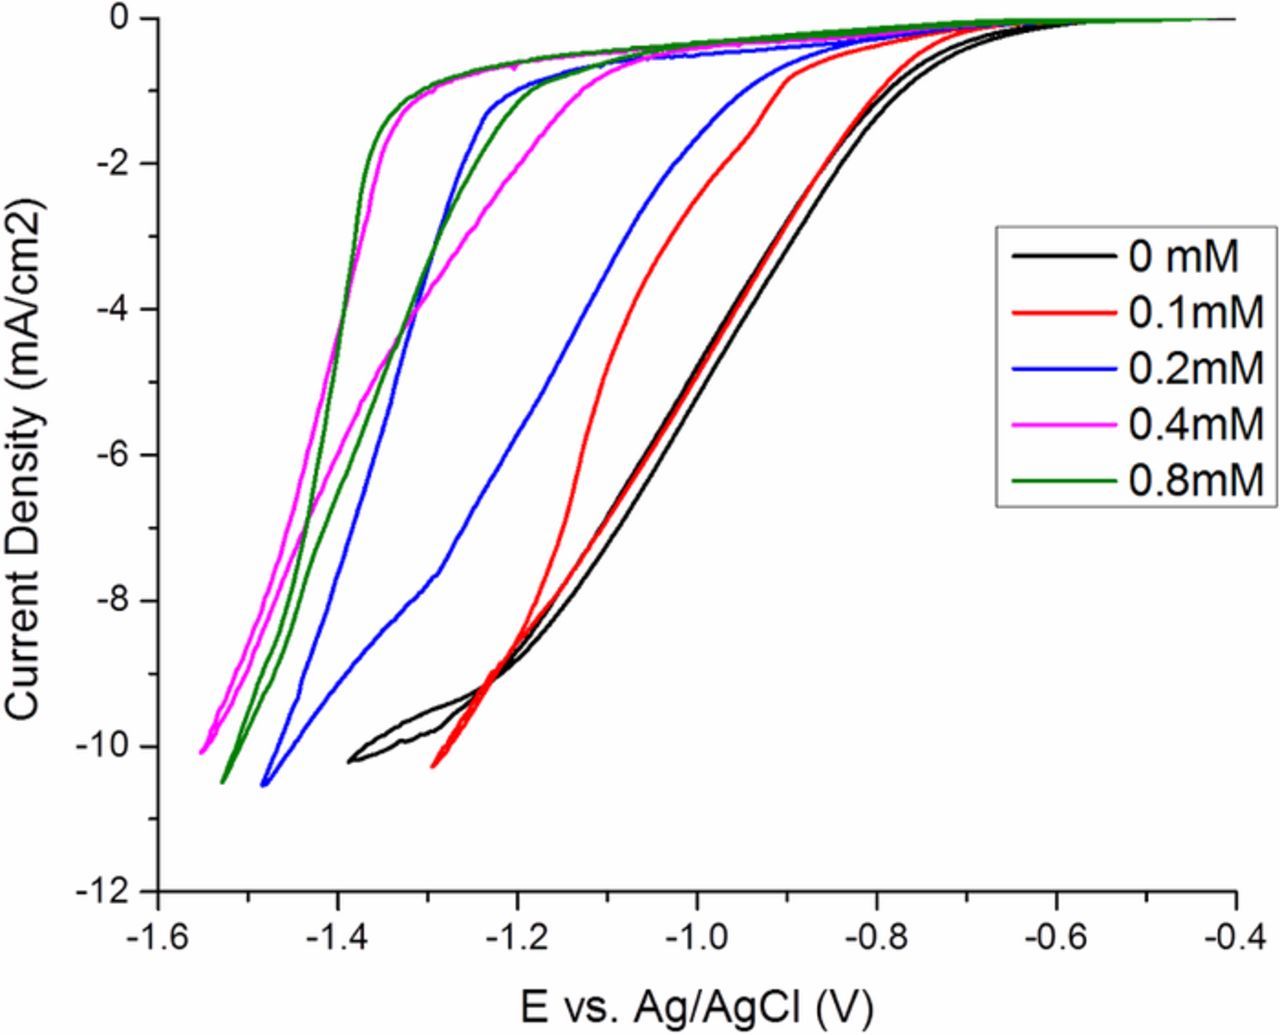
Figure 8. Cyclic voltammetry of Atomplate Co Suppressor XF at different concentrations.
Impact of RPM
Since the availability of Atomplate Co Suppressor XF has already been shown to be a viable control mechanism for suppression strength, it follows that changing the convective transport rate would produce an analogous control mechanism for bottom-up fill. Fig. 9 shows CV results of an experiment in which a solution of Atomplate Co Suppressor XF was plated at various rotation rates 0, 30, and 100rpm, compared to control solutions of VMS only at the same rotation rates. The cathodic switching potential was controlled such that the final current density was approximately −5mA/cm2. Fig. 9 shows that analogous to effect of increasing the bath concentration of Atomplate Co Suppressor XF, both the forward and reverse scans in Fig. 9 shift cathodically with increasing rotation rate. In the forward scan, higher RPM brings more additive to the surface and results in stronger suppression. At 0 RPM, replenishment of Atomplate Co Suppressor XF is slow, causing complete loss of suppression at approximately −0.9 V. As RPM increases, increased replenishment of activated Atomplate Co Suppressor XF causes increased suppression, visible by comparing the current density of forward scans at a constant potential. The reverse scans follow a similar trend: at 0 RPM, the reverse scan overlaps with the VMS trace. The data in Fig. 9 show that RPM is a viable control strategy for suppression strength, consistent with the hydrogen reduction mechanism.
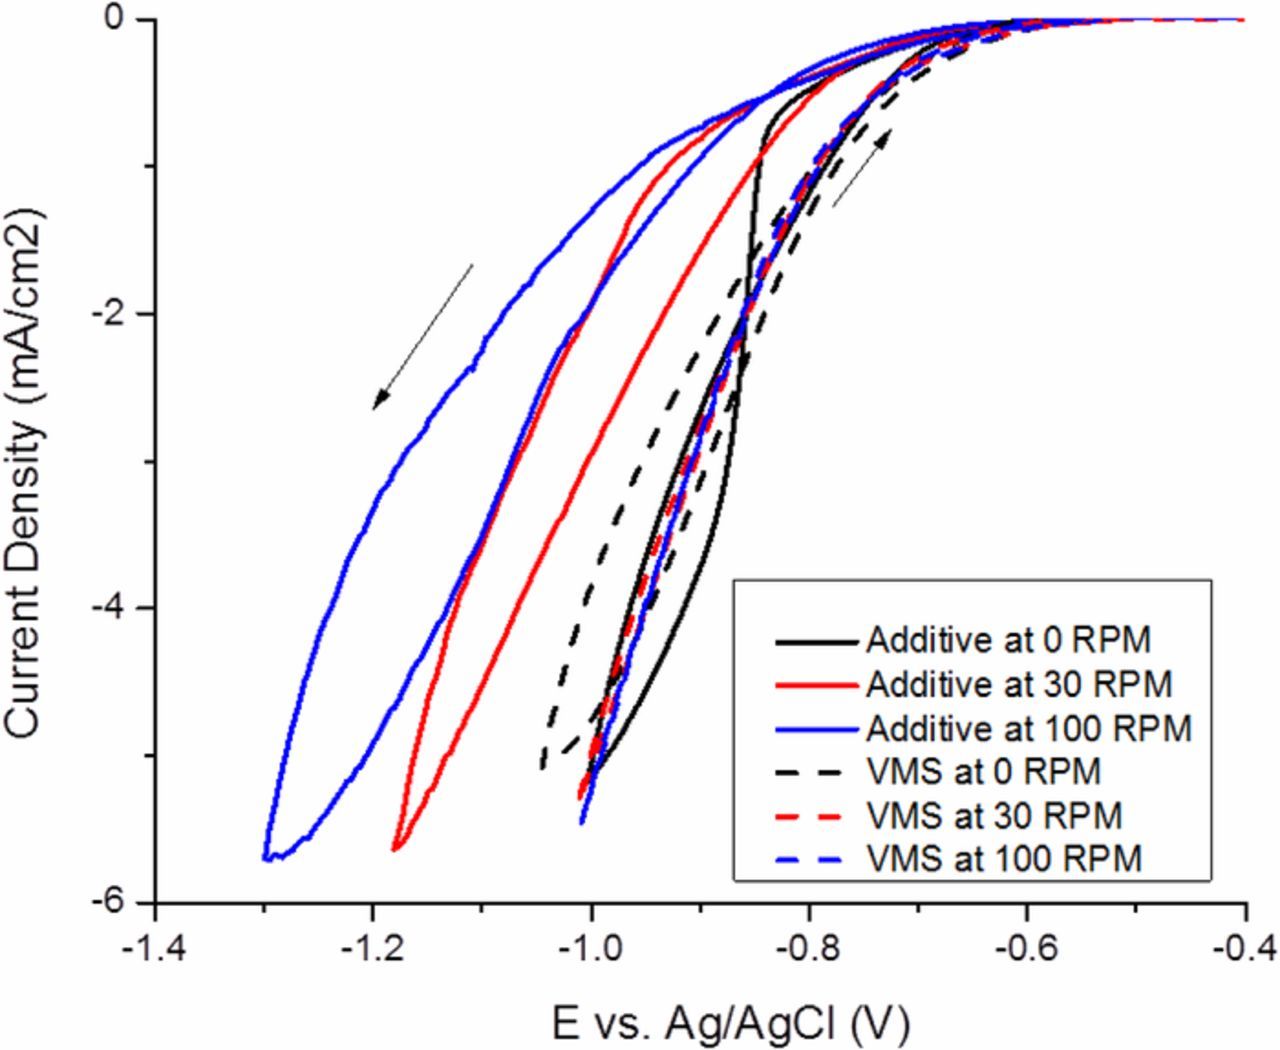
Figure 9. Cyclic voltammetry of Atomplate Co Suppressor XF at different rotation rate.
Factors that impact plating
Based on the above electrochemical experiments, we contend that Atomplate Co Suppressor XF is reduced by hydrogen and subsequently desorbed from the cobalt surface. In a semiconductor plating environment, fresh Atomplate Co Suppressor XF will continually diffuse/convect toward to the electrode surface and may be adsorbed to available surface sites. The rates of these two opposing processes determine the surface coverage of the activated and deactivated forms of Atomplate Co Suppressor XF, and hence determine the local current density. Since the rates of these two opposing processes is governed by the relative amount of hydrogen and suppressor at different location, the distribution of these two species at different position in the feature should determine the filling profile in the feature. On a patterned wafer, features typically have small dimensions as narrow as a few nanometers in opening and depth-to-opening aspect ratio exceeding 10:1. At this length scale, transport of additives to the bottom of feature is primarily accomplished through diffusion. The length scale of the depth of the feature is so small (∼200nm) that the diffusion time scale of the additive to the bottom of the feature is very short (∼0.01ms) assuming the diffusion coefficient of Atomplate Co Suppressor XF is ∼10−5 cm2/s. This means the rate of replenishment of Atomplate Co Suppressor XF at the feature floor is not transport limited and fast enough to give the same concentration in the feature as in the bulk. So the current density at different location remains the same in the very beginning of the plating. However, while hydrogen was generated along with the cobalt deposition, more hydrogen was generated and accumulated in the feature bottom due to larger surface to volume ratio. It is straightforward to envision a situation in which, hydrogen will completely reduce all of available additive at the floor of the trench, and the trench floor will be completely un-suppressed. The local current density at the trench floor then exceeds than that of the field; compare this scenario to the Δi marker in Fig. 2a, and it is straightforward to compare the bottom of the trench to the return scan, and the field to the forward scan. As a result, bottom up filling of cobalt is initiated with one single additive. Once the bottom up plating is initiated, the local current density in the feature becomes larger than that on the field. As discussed in the previous current efficiency part and shown in the plot in Fig. 5b, the amount of hydrogen is larger at higher current density than at lower current density. This current density effect causes more hydrogen generation in the feature and therefore further enhances the bottom up plating. As a matter of fact, in some cases when excessive hydrogen was produced in the feature, we observed "spongy" filling of the feature. When the bottom up filling propels close to the opening of the features, this surface to volume effect diminishes. But the local current density at the feature is still much larger than that at the neighboring field area at this moment. The current density effect still remains to provide more hydrogen, at the feature area. Therefore, despite the diminishing of the surface to volume effect, the momentum of the bottom up filling continues, which results in a mushroom shape bump (Fig. 2b 100nm feature). These plating bumps were observed in features with different critical dimension (2−100nm), but can be easily removed by switching to high current density (∼8mA/cm2) after features are full filled. In this case, the current density is high enough to generate sufficient hydrogen to reduce the additive at all locations. In a summary, the bottom up fill is initiated due to the surface to volume effect and later enhanced and continued due to the current density effect. In both effects, the hydrogen generation is more in the feature than at the field.
Since the driving force for the bottom up fill process is the current difference Δi illustrated in Fig 2, larger Δi should produce superior bottom up filling. In the previous sections, CV and blanket coupon plating results show that the three factors – pH, concentration and rotation rate, have a big impact on the magnutide of Δi. Based on results, it may be generally stated that higher pH, greater additive concentration, and faster rotation rate will result in superior bottom up filling, and vice versa. This prediction has been confirmed by patterned coupon plating. Fig. 10 shows the cross-section of 100nm features that were plated under different conditions, as listed in Table I. Features of this relatively large size were chosen for ease of illustration; much smaller openings down to approximately 2 nm opening may be plated using the same additive. Fig. 10a shows a bottom-up fill exhibiting a U shaped profile, in which the field and upper side wall are completely suppressed by adsorbed Atomplate Co Suppressor XF, while the feature floor is unsuppressed due to localized hydrogen-induced deactivation. When the additive concentration (Fig 10b) or rotation rate (Fig 10c) are decreased, the fill profile becomes V-shaped. This occurs in a situation of fractional surface coverage of Atomplate Co Suppressor XF, in a gradient from the field (higher concentration of Atomplate Co Suppressor XF, lower concentration of deactivated form D, partially suppressed), compared to the floor (lower concentration of Atomplate Co Suppressor XF, higher concentration of Additive D, un-suppressed). This causes slow plating on the sidewall during bottom-up fill at the floor. When pH is lowered to 2.5 (Fig. 10d), plating is either conformal, or current efficiency is too low to plate Co in the features.
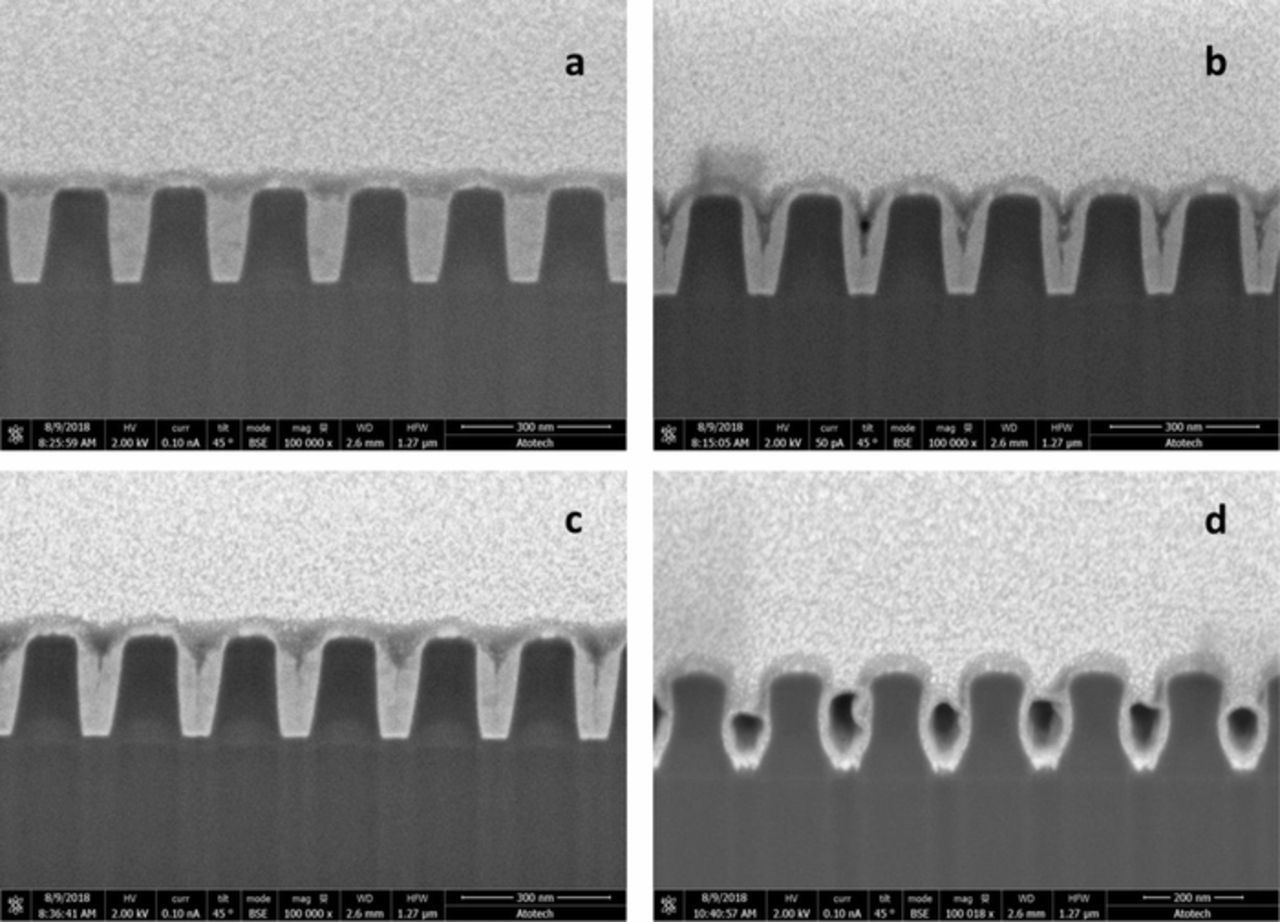
Figure 10. Cross-section of samples plated at conditions described in Table I.
Table I. Plating conditions for samples 10a-d.
| Additive A | |||
|---|---|---|---|
| Sample # | pH | concentration (mM) | Rotation rate (rpm) |
| 10a | 4.2 | 0.1 | 60 |
| 10b | 4.2 | 0.05 | 60 |
| 10c | 4.2 | 0.1 | 30 |
| 10d | 2.5 | 0.1 | 60 |
Conclusions
In this work, cobalt bottom-up fill of interconnect features in a single additive bath is studied, and a mechanism is proposed. Adsorption of Atomplate Co Suppressor XF to the electrode surface is believed to cause suppressed plating rate wherever the additive is present. Hydrogen reduction of Atomplate Co Suppressor XF is believed to be the reason for the additive deactivation at the surface of the electrode, which occurs simultaneously with cobalt reduction. Thus, competitive balance between hydrogen-induced deactivation of Atomplate Co Suppressor XF vs. the replenishment rate of fresh Atomplate Co Suppressor XF from the bulk determines the activation/deactivation state at the surface, therefore determining the local current density and consequently the plating rate. The bottom up fill is initiated due to the surface to volume effect and later enhanced and continued due to the current density effect. CV experiments and patterned coupon plating experiments confirm the impact of additive concentration, rotation rate and pH within this proposed mechanistic environment. Broadly stated, lower current density, higher additive concentration, faster rotation rate, and higher pH within the tested range produce superior bottom up fill properties.
Acknowledgment
The authors thank SUNY Polytechnic Institute for providing all the tested coupons for this work.
ORCID
J. Wu 0000-0002-6441-1170