Abstract
Safety and performance of lithium-ion batteries over a wide temperature window are of paramount importance, especially for electric vehicles. The safety concerns are predicated on the thermal behavior as the occurrence of local temperature excursions may lead to thermal runaway. In this work, the role of electrode microstructure and implications on the cell thermal behavior are examined. A microstructure-aware electrochemical-thermal coupled model has been proposed, which delineates the electrode-level thermal complexations due to the structure-transport-electrochemistry interactions. Detailed analysis of the spatio-temporal variation of the heat generation rates (ohmic, reaction and reversible contributions) for different electrode microstructural configurations is presented to explain the dominant factors causing temperature rise. The tradeoff between the cell performance and safety is discussed from an electrode-level, bottom-up view point. This study aims to provide valuable insights into potentially tuning electrode-level structural features as an internal safety switch toward limiting the Li-ion cell temperature rise during operation.
Export citation and abstract BibTeX RIS

This is an open access article distributed under the terms of the Creative Commons Attribution Non-Commercial No Derivatives 4.0 License (CC BY-NC-ND, http://creativecommons.org/licenses/by-nc-nd/4.0/), which permits non-commercial reuse, distribution, and reproduction in any medium, provided the original work is not changed in any way and is properly cited. For permission for commercial reuse, please email: oa@electrochem.org.
Lithium-ion batteries (LIBs) are ubiquitous in portable electronics and are making their way into large-scale applications, such as electric vehicles and grid storage, owing to their high energy and power density.1–4 Due to the wide spectrum of energy and power requirements, significant efforts have also been focused in the recent past on studying the coupled electrochemical-thermal response of LIBs and the implications thereof on the cell performance and thermal behavior.5–11 Previous studies have shown that an increase in cell temperature may diminish capacity loss and favorably affect the power ability.12–14 In addition, temperature increase may also abate mechanical degradation (i.e. micro-crack formation) and prevent lithium deposition in the anode.15 However, an increase in the cell temperature beyond a critical limit may also initiate undesirable exothermic decomposition reactions, which may lead to extreme thermal events such as thermal runaway.16–18
The electrode microstructure of LIBs has a profound impact on the cell performance. A typical electrode consists of the active material (AM), conductive additives (CA), and binder (B). Electrode microstructural variation has been proven to have an influence on chemical and mechanical degradation,19,20 internal resistance,21,22 solid-phase diffusion,23 and consequently, cell performance.13 The porosity and tortuosity of the porous electrode can significantly affect the electrolyte transport resistance, which is expected to impact cell performance and thermal behavior. Porosity is the volume fraction of void space for the occupation of the electrolyte. Tortuosity is a measure of the resistance offered by the complex porous pathways to species transport path.24,25 Tortuosity is dominated by microstructural heterogeneity,26–28 electrode architecture,29 and active particle orientation anisotropy.30 Due to the influence of particle morphology, the conventional Bruggeman (ideal) relation (τ = ε− 0.5) is no longer applicable. Besides, the interfacial area for electrochemical reaction is also determined by the size and morphology of the active particle and the simplistic formulations of the interfacial area like 3εs/Rs do not necessarily represent the effective interfacial area. Finally, estimation of effective properties, e.g. electronic conductivity of the solid phase comprising multiple constituents (such as, AM+CA+B) is critical. In this regard, virtual microstructure reconstruction to obtain realistic estimates of these geometric and transport properties can be an enabler.
The influence of thermal effects in Li-ion batteries was comprehensively presented by Ji et al.12 However, the interaction between Li-ion battery electrode microstructure properties and thermal behavior is still not well understood. For example, the study by Ji et al.12 did not consider the complexity of electrode microstructures, which may underestimate the influence of transport resistance resulting from the porous electrode microstructural complexity represented by tortuosity, and heat generation localization. Consequently, in this study, a microstructure-aware electrochemical-thermal coupled model (MAECT) has been proposed in order to connect the impact of electrode microstructures to the underlying coupled electrochemical reaction, transport mechanisms and heat generation in Li-ion batteries.
In this work, the role of electrode microstructure on the Li-ion battery thermal behavior has been studied in detail. Representative realizations of different electrode microstructures have been reconstructed stochastically. The cell thermal behavior is analyzed based on the local temporal and spatial distribution of different heating source (i.e. joule heating, reversible heating, and reaction heating) at varying state of charge (SOC)). The interplay between the electrode microstructure and the cell thermal behavior has been elucidated. This study demonstrates that that there exists a trade-off between the desired cell capacity and safe temperature operation window. The microstructure dependent thermal behavior provides fundamental insight into the role of electrode microstructure design to maintain the cell temperature within the safety limits without using external control mechanisms.
Microstructure-Aware Electrochemical-Thermal Coupled Model
To increase the cell capacity, a commonly adopted approach is to increase the amount of active material in the electrode. Figure 1a shows representative electrode microstructure realizations with an increase in the active material vol. % (the wt % of active material, carbon additive, and binder is maintained at 90:5:5). With the increase in the amount of active material, the porosity decreases (volume of the electrode is maintained constant) and the electrochemical interfacial area (active material/electrolyte) increases. Correspondingly, the decrease in porosity is also accompanied by an increase in tortuosity. If the anode capacity is kept fixed, the increase in the amount of active material of cathode also changes the Negative/Positive electrode (N/P) loading ratio of the cell. The change in N/P loading ratio affects the electrochemical window of operation, i.e. the range of the open-circuit potential of the electrode pair. The change in electrode microstructure properties can further affect the thermal behavior of electrode. As demonstrated in Figure 1a, the decrease in porosity and hence an increase in the pore-space tortuosity can enhance the Li+ concentration gradient and electrolyte potential, and therefore an increase in the internal resistance. The increase of internal resistance magnifies joule heating inside the cell. The variation of the interfacial area changes the overpotential for the electrochemical reaction and hence may affect the reaction heat. The difference in the N/P loading ratio changes the OCP range of the electrode pair, which can affect the reversible heat generation. To capture the interaction between the electrode microstructure variation and thermal behavior of the cell, a Microstructure-aware Electrochemical-Thermal Coupled Model (MAECT) has been developed. Figure 1b shows a schematic representation of the MAECT model. The detailed description of the model, estimation of the different heat sources, and reconstruction of the microstructure are presented in the following sections.
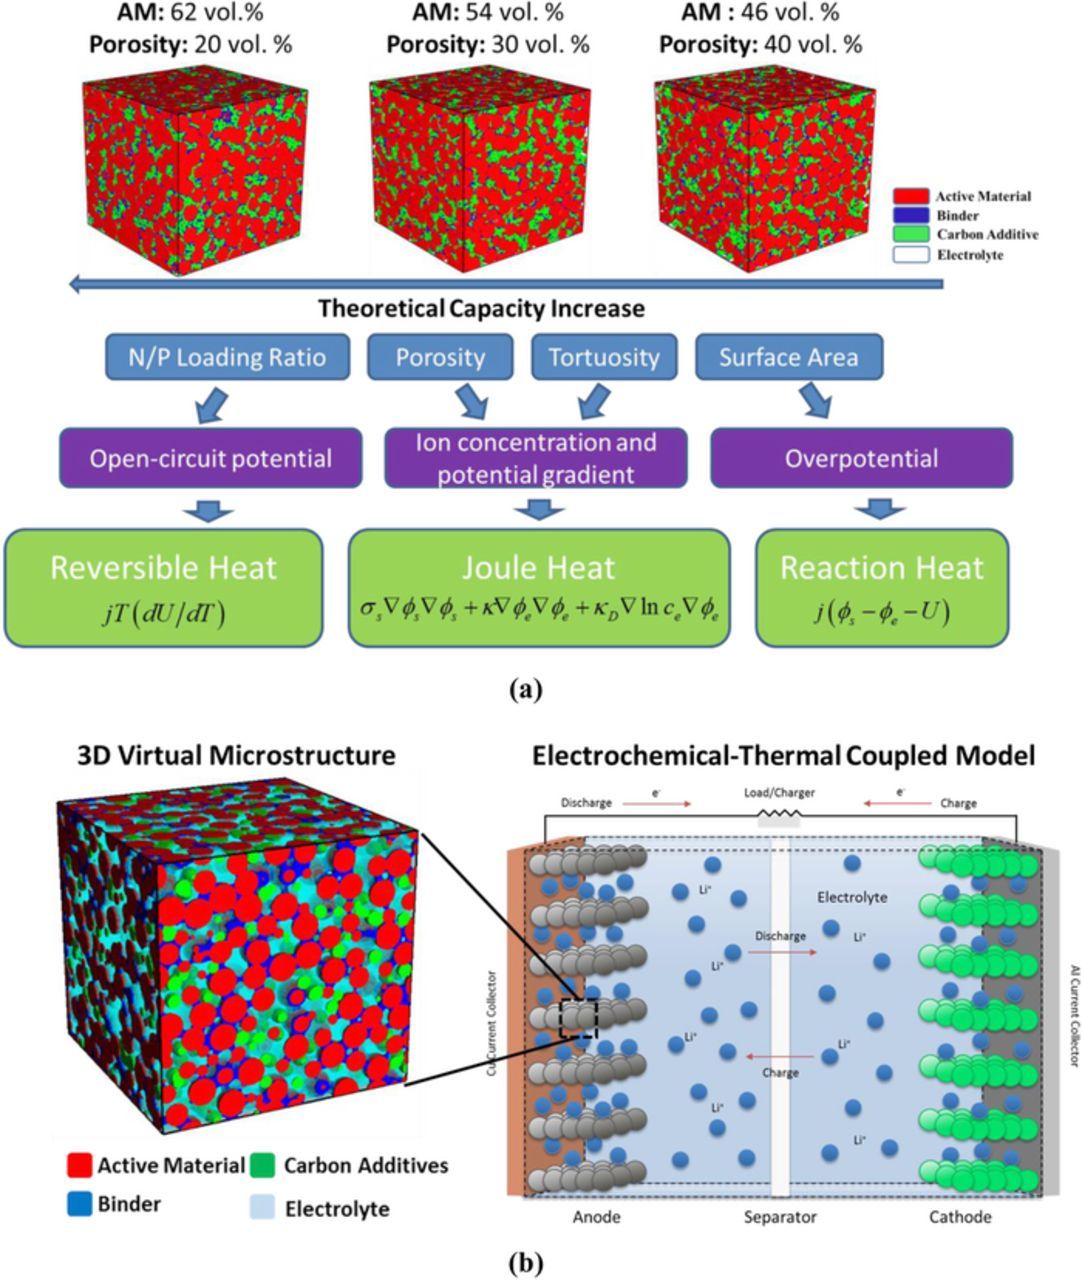
Figure 1. (a) Interaction between microstructure and heat generation. The wt % of active material, carbon additive, and binder is 90:5:5. Active material content decreases from left to right, hence theoretical capacity increases from right to left. (b) Schematic diagram of the microstructure-aware electrochemical-thermal coupled (MAETC) model. Individual electrodes are reconstructed stochastically for realistic microstructure properties which are fed into the electrochemical-thermal model.
In this work, a typical Li-ion cell with Li(Ni1/3Mn1/3Co1/3)O2 cathode and graphite anode is considered. The nominal cell design parameters, summarized in Table I, are adopted from Ji et al.,12 and the variation of cathode porosity is investigated while keeping anode porosity fixed. The set of coupled thermo-electrochemical governing equations is given below.
Table I. Li-ion cell design parameters.12
| Anode | Cathode | ||
|---|---|---|---|
| Parameters | (Graphite) | Separator | Li(Ni1/3Mn1/3Co1/3)O2 |
| L (m) | 80 × 10− 6 | 20 × 10− 6 | 78 × 10− 6 |
| ε (-) | 0.264 | 0.46 | 0.281 |
| ce, init (mol/m3) | 1200 | ||
| A (m2) | 0.06 | ||
| cp(J/kg-K) | 823 | ||
| h (W/m2-K) | 28.4 |
Butler-Volmer kinetics is used to describe the electrochemical reaction.
![Equation ([1])](https://content.cld.iop.org/journals/1945-7111/164/11/E3146/revision1/d0001.gif)
![Equation ([2])](https://content.cld.iop.org/journals/1945-7111/164/11/E3146/revision1/d0002.gif)
![Equation ([3])](https://content.cld.iop.org/journals/1945-7111/164/11/E3146/revision1/d0003.gif)
![Equation ([4])](https://content.cld.iop.org/journals/1945-7111/164/11/E3146/revision1/d0004.gif)
The functional relationships of the open circuit potential (OCP) with SOC (state of charge) for graphite and Li(Ni1/3Mn1/3Co1/3)O2 are adopted from Ji et al.12
Species conservation in solid phase
Active material particles are considered to have spherical geometry and Fickian diffusion is used for solving lithium transport inside the particles.
![Equation ([5])](https://content.cld.iop.org/journals/1945-7111/164/11/E3146/revision1/d0005.gif)
Species conservation in the electrolyte phase
Diffusion of lithium ions inside the electrolyte is also modeled using Fick's law with Deffe giving the effective diffusion rate of lithium ions in the electrolyte phase. Volumetric current production/destruction is given by j.
![Equation ([6])](https://content.cld.iop.org/journals/1945-7111/164/11/E3146/revision1/d0007.gif)
![Equation ([7])](https://content.cld.iop.org/journals/1945-7111/164/11/E3146/revision1/d0008.gif)
Charge conservation in solid phase
Electric potential in the solid phase ϕs can be evaluated using Ohm's law.
![Equation ([8])](https://content.cld.iop.org/journals/1945-7111/164/11/E3146/revision1/d0009.gif)
Charge conservation in electrolyte phase
Charge transport in the electrolyte phase is driven by gradients of electrolyte potential, ϕe and ionic concentration, ce.
![Equation ([9])](https://content.cld.iop.org/journals/1945-7111/164/11/E3146/revision1/d0010.gif)
![Equation ([10])](https://content.cld.iop.org/journals/1945-7111/164/11/E3146/revision1/d0011.gif)
![Equation ([11])](https://content.cld.iop.org/journals/1945-7111/164/11/E3146/revision1/d0012.gif)
Energy conservation
Temperature evolution in a typical Li-ion cell sandwich can be studied based on a lumped thermal model under typical external cooling conditions owing to low Biot number characteristics.
![Equation ([12])](https://content.cld.iop.org/journals/1945-7111/164/11/E3146/revision1/d0013.gif)
![Equation ([13])](https://content.cld.iop.org/journals/1945-7111/164/11/E3146/revision1/d0014.gif)
The heat generation rate  consists of reaction/irreversible heat, reversible/entropic heat and joule/ohmic heat. Joule heating is the predominant component with contributions from electronic resistance (σeffs∇ϕs · ∇ϕs), ionic resistance under potential gradient, (κeff∇ϕe · ∇ϕe) and concentration gradient, (κeffD∇ln ce · ∇ϕe). Reaction heat is given by(j(ϕs − ϕe − Ueq) and entropic heat is given by
  . The total rate is calculated by integrating the source terms over the entire length of the cell and multiplying with the electrode area, A. The open circuit potential, Ueq and entropic coefficient, dUeq/dT for both electrodes are provided in Table II. The electrolyte properties, listed in Table III, are adopted from Valoen and Reimers,31 which show functional dependence on Li+ concentration in the electrolyte and cell temperature. The boundary conditions for the electrochemical-thermal model are given in Table IV. A Dirichlet BC is prescribed at the cathode – current collector interface for the electrolyte phase potential, ϕe to enable the solution of the Poisson charge conservation equations which otherwise have all Neumann BCs. The initial conditions correspond to the SOC values in each electrode at the start of discharge.
Table II. Electrode Properties.
| Values | ||
|---|---|---|
| Parameters | Anode | Cathode |
| k (m2.5 mol−0.5 s−1) | 2.3238 × 10− 10 | 2.4177 × 10− 11 |
| csmax (mol/m3) | 30900 | 49500 |
| Eact (i0) (J/mol) | 68000 | 50000 |
| Ds (m2/s) | 1.6 × 10− 14 | 3.0 × 10− 14 |
| Eact(Ds)(J/mol) | 30000 | 30000 |
| Ueq(V) | ||
 |
 |
|
 (mV/K) (mV/K) |
 |
 |
| Rc (Ohm-m2) | 6 × 10− 4 | |
Table III. Electrolyte Properties.
| Parameters | Value |
|---|---|
| De(m2/s) |  |
| κ(S/m) |  |
| V(−) | 0.601 − 0.24(10− 3c)0.5 |
| + 0.982(1 − 0.0052(T − 294))(10− 3c)1.5 | |
| t+(−) | 0.363 |
Table IV. Boundary Conditions.
| Parameters | CC - anode x = 0 | Anode–separator x = La | Separator-cathode x = La + Ls | Cathode-CC x = La + Ls + Lc |
|---|---|---|---|---|
| ce |  |
 |
 |
 |
| ϕe |  |
 |
 |
 |
| ϕs |  |
 |
 |
 |
Electrode microstructure reconstruction and evaluation of effective transport properties
In this work, several realizations of 3D electrode microstructures are stochastically reconstructed with varying composition of the active material, conductive additive, and binder.19,21,32,33 Active material, representative of nearly spherical shape of NMC (Ni-Mn-Co oxide) based cathode active particles, are randomly distributed with the desired volume %. The particles are prohibited from overlapping when the vol. % of the active material is smaller than 50 vol. %. The conductive additives are represented as platelets and also randomly distributed. The conductive additives are prohibited to overlap with active materials, but allowed to overlap with each other. The binder is randomly added to a structure in the shape of a concave meniscus in locations where material surfaces get close together. In the cathode, such as (Li(Ni1/3Mn1/3Co1/3)O2) cathode in this work, the wt % of the active material carbon-based conductive additive, and binder (PVDF) is maintained at 90:5:5. In the anode, wt % of the active material and the binder is maintained at 95:5. Figure 1a shows representative cathode microstructures with different active material loadings based on stochastic reconstruction.
Effective electrode properties are estimated based on direct numerical simulation (DNS) calculations on reconstructed electrode microstructures. The electrolyte transport properties depend on the porosity and tortuosity of the pore space. Similarly, the presence of multiple components in the solid phase (AM+CA+B) necessitates estimation of the effective electronic conductivity. The DNS calculations involve the solution of diffusion equation on 3-D electrode microstructures with Dirichlet boundary conditions along the transport direction and periodic boundary conditions span-wise directions. Stochastic electrode microstructure reconstruction and effective transport property calculations were performed using GeoDict.34
It is worth mentioning that the diffusion mechanism is dependent on the Knudsen number, which is characterized by the pore size relative to the mean free path of the diffusing ions. In the case of typical porous electrodes for Li-ion batteries, the Knudsen number is very small (Kn<<1), which means that the pore diameters are large compared to the mean free path length of the diffusing ions. Thus, diffusion can be modeled based on the Laplace equation,
![Equation ([14])](https://content.cld.iop.org/journals/1945-7111/164/11/E3146/revision1/d0015.gif)
along with the following boundary conditions.
![Equation ([15])](https://content.cld.iop.org/journals/1945-7111/164/11/E3146/revision1/d0017.gif)
Periodic boundary conditions are applied on the remaining four faces for the diffusivity calculations. At the electrode-electrolyte interface,  is satisfied. The effective diffusivity can now be computed by equating species flux obtained from the DNS calculation and effective diffusivity based flux formulation:
![Equation ([16])](https://content.cld.iop.org/journals/1945-7111/164/11/E3146/revision1/d0018.gif)
![Equation ([17])](https://content.cld.iop.org/journals/1945-7111/164/11/E3146/revision1/d0019.gif)
Similar diffusivity calculations are performed in y, and z directions which are then used to determine the tortuosity in the principal directions using following relation25,35
![Equation ([18])](https://content.cld.iop.org/journals/1945-7111/164/11/E3146/revision1/d0020.gif)
where D is the intrinsic diffusivity of void phase, ɛ is the porosity (i.e. volume fraction of pore space) of the microstructure and τ is the tortuosity of the microstructure. The arithmetic mean of the tortuosity calculated in the individual direction is used to estimate the tortuosity value, τ = (τx + τy + τz)/3.0 which is then used for computation of effective ionic diffusivity, ionic conductivity and diffusional conductivity for input into the electrochemical performance model.
![Equation ([19])](https://content.cld.iop.org/journals/1945-7111/164/11/E3146/revision1/d0021.gif)
Similar to the evaluation of effective diffusivity, the effective electrical conductivity can also be calculated by solving the Laplace's equation for electrical potential ∇.(σ∇ϕ) = 0 and Eq. 21.
![Equation ([20])](https://content.cld.iop.org/journals/1945-7111/164/11/E3146/revision1/d0022.gif)
![Equation ([21])](https://content.cld.iop.org/journals/1945-7111/164/11/E3146/revision1/d0023.gif)
The effective electrical conductivity is calculated according to the material electrical conductivity σj provided in Table V. The calculated effective transport properties (i.e. tortuosity, electrical conductivity) of different electrode microstructures and the corresponding theoretical capacity values are furnished in Table VI. One should note that, in this study, we focus on the influence of cathode microstructures on the Li-ion cell thermal behavior. Therefore, the anode microstructure is kept fixed for all the simulations.
Table V. Material properties of cathode and anode.
| Cathode | Li(Ni1/3Mn1/3Co1/3)O2 | 10a | 0.0010636 | 4.836 |
| Graphite | 4a | 1670033 | 1.9533 | |
| PVDF/C | – | 76036 | 1.86a | |
| Anode | Graphite | 20a | 1670033 | 1.9533 |
| PVDF/C | – | 76036 | 1.86a |
Table VI. Variation of microstructure properties with porosity and corresponding theoretical capacity values of a Li-ion cell.
| Cathode | Anode | ||||||
|---|---|---|---|---|---|---|---|
| Porosity | |||||||
| 0.15 | 0.2 | 0.25 | 0.3 | 0.35 | 0.4 | 0.25 | |
| vol. % of NMC | 66.39 | 62.49 | 58.58 | 54.68 | 50.77 | 46.87 | 70.52 |
| vol. % of additive | 9.08 | 8.54 | 8.01 | 7.47 | 6.94 | 6.40 | 0 |
| vol. % of binder | 9.51 | 8.95 | 8.39 | 7.83 | 7.27 | 6.71 | 4.43 |
| σeff | 96.938 | 54.09 | 36.13 | 25.47 | 7.02 | 6.45 | 5900 |
| Tortuosity | 7.194 | 4.064 | 3.190 | 2.687 | 2.138 | 1.945 | 3.2 |
| Capacity (Ah) | 2.631 | 2.476 | 2.321 | 2.166 | 2.012 | 1.945 | 2.713 |
Results and Discussion
Model verification and validation
The macrohomogeneous thermo-electrochemical model is validated for varying C-rates and ambient temperature (25°C) operation with the experimental data for a Li-ion cell, with 2.2 Ah nominal capacity, from Ji and Wang et al.12 (see, Figure 2a). The simulation results e.g., discharge performance and average temperature rise at 1 C and 3 C, show good agreement with the experimental data. The effect of tortuosity is further investigated. In the macrohomogeneous, porous electrode theory, the tortuosity is calculated based on the idealized Bruggeman relation (Eq. 22).
![Equation ([22])](https://content.cld.iop.org/journals/1945-7111/164/11/E3146/revision1/d0024.gif)
However, the Bruggeman relation is based on the assumption that the particles are spherical and uniformly distributed.24 Since typical Li-ion battery electrodes include multiple phases (e.g., active particle, conductive additive, binder) and dense solid phase packing, the Bruggeman relation is not sufficient to represent the pore space tortuosity.30 Figure 2b shows the comparison of the tortuosity estimation based on stochastically reconstructed 3-D electrode microstructures and the idealized Bruggeman relation. The larger deviation in the tortuosity estimation with decreasing porosity will further affect the discharge performance, heat generation, and temperature evolution as shown in Figures 2c, 2d, and 2e, respectively. An increase in pore space tortuosity also amplified the internal resistance, which increases voltage drop, joule heating rate, and consequently the cell temperature rise. It is important to note that tortuosity significantly affects joule heating rate, while its influence on reaction and reversible heat rates is quite negligible.
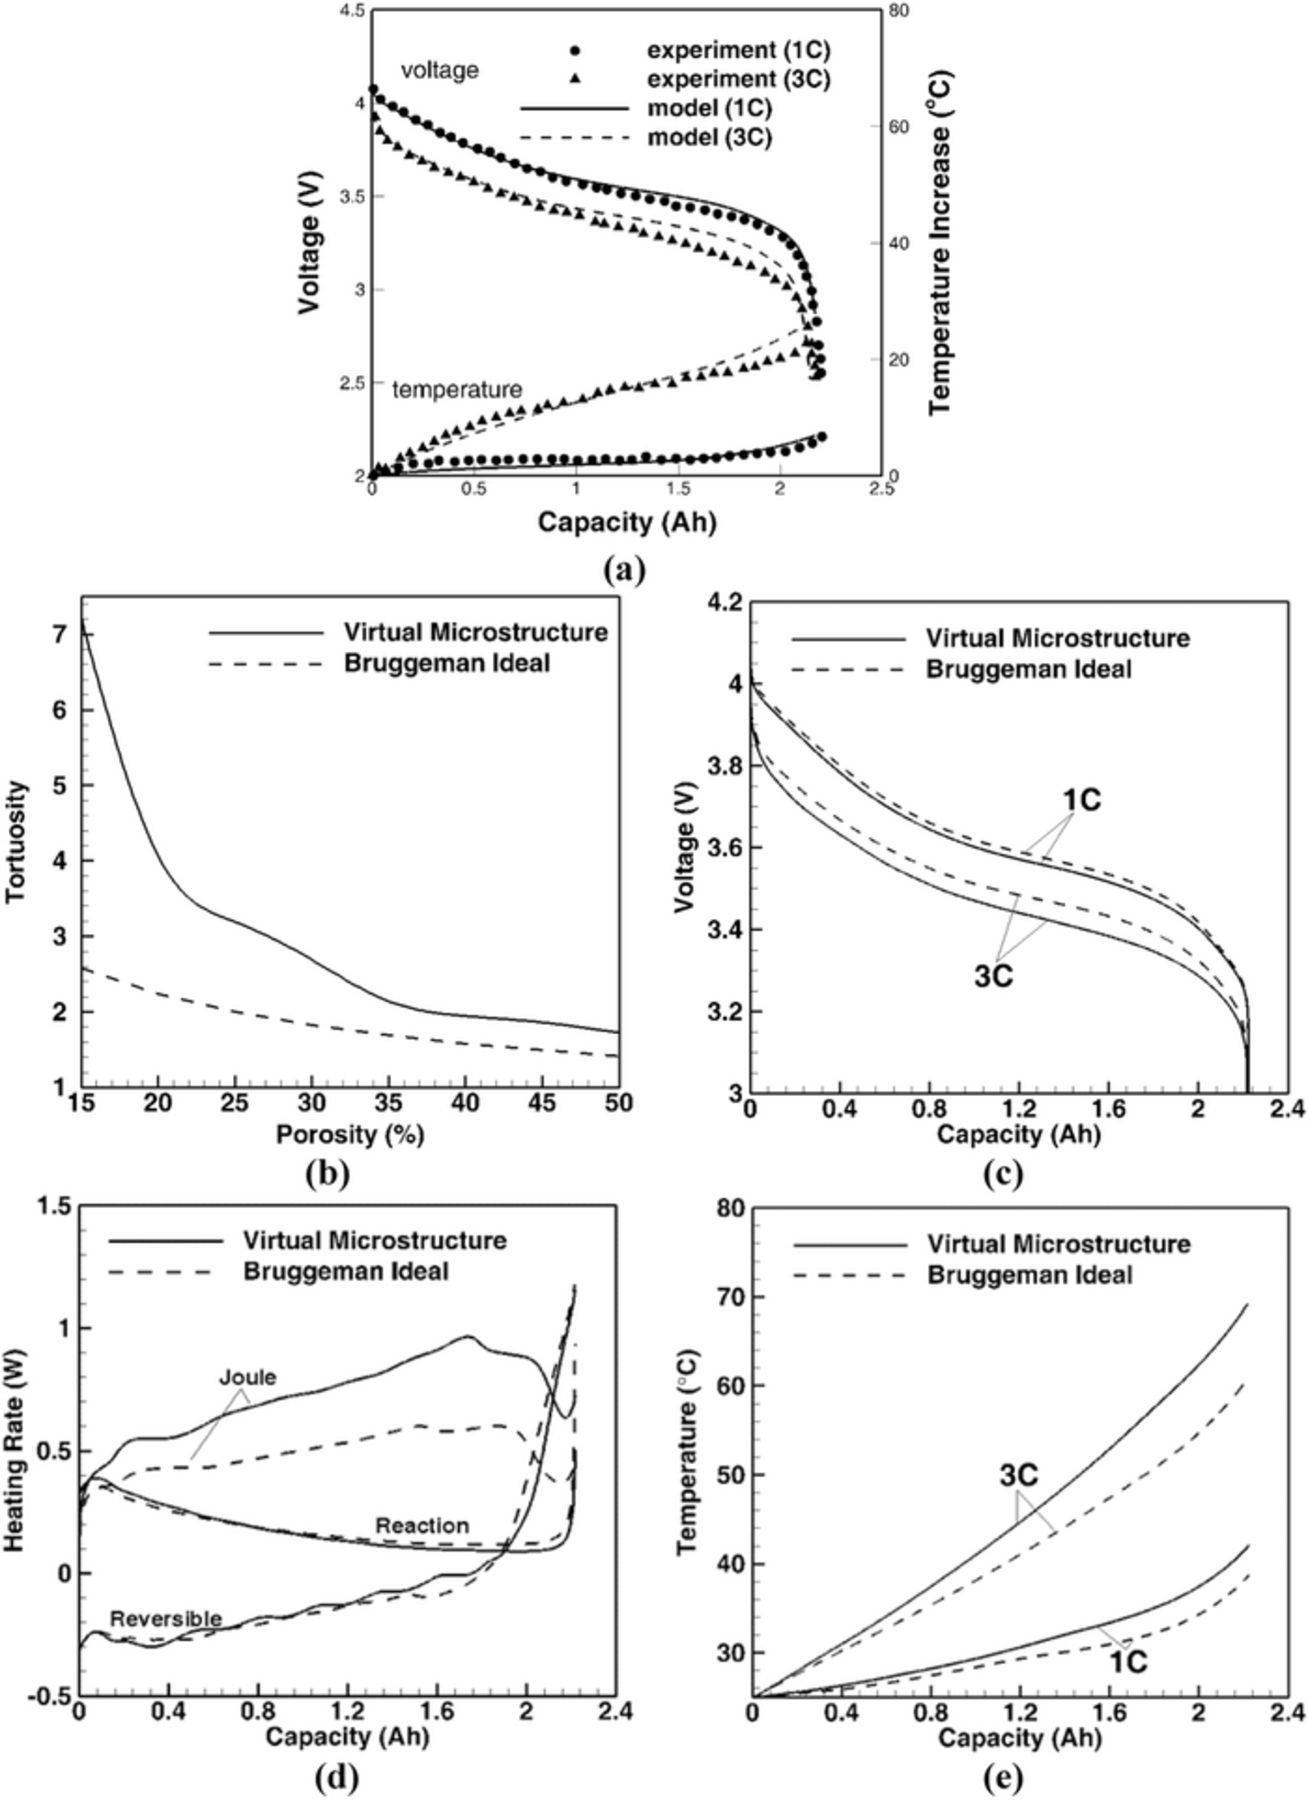
Figure 2. (a) Validation of the microstructure-aware electrochemical-thermal coupled model with the data from Ji et al.12 For C-rates of 1 C and 3 C, the discharge performance (top) and temperature rise (bottom) profiles show good agreement with experimental data. Comparison of (b) tortuosity, (c) discharge performance, (d) heat generation, and (e) temperature evolution between Bruggeman idealization and microstructure-aware electrochemical-thermal coupled model. The porosity of cathode (NMC) and anode (Graphite) is 0.25. The cell operating temperature is 25°C. Higher tortuosity from microstructural complexation, as compared to Bruggeman idealization, leads to higher Joule heating.
Influence of electrode microstructure on thermal behavior
The Li-ion cell temperature needs to be maintained below a safety limit (e.g. < 80°C) with as little compromise on the achievable capacity as possible. The objective, therefore, is to study the existence of a potential electrode design window within which the capacity can be maximized while maintaining the maximum temperature rise within the safety limit. In this regard, the spatio-temporal variations of different heat sources for varying cathode microstructures are analyzed based on the cell sandwich model. The trade-off between achievable capacity and maximum temperature rise is investigated in order to develop a thermo-electrochemical safety window based on the electrode microstructure analysis.
Figure 3 shows the influence of microstructure on the cell capacity, and temperature evolution. Figure 3a shows the reconstructed 3-D cathode microstructures with varying active material loading. Since the wt % of active material, carbon additive, and binder is maintained at 90:5:5, the amount of binder and carbon additives increases with increase in the amount of active material. Consequently, the porosity of the electrode decreases, which results in an increase in tortuosity as shown in Figure 2a. Figure 3b shows the improvement of capacity when the amount of active material is increased. The corresponding 2-D microstructural slices are also included in Figure 3b. The temporal evolution of temperature is shown in Figure 3c. It can be observed that the temperature increases faster in the cell with low porosity cathode. This can be further explained by analyzing the effect of porosity, and hence tortuosity, variation on the heat generation source terms which is presented in the following section.

Figure 3. (a) Stochastically reconstructed cathode microstructure realizations with different porosity values, e.g. 20, 30, and 40 vol. %. (b) Influence of microstructure on cell discharge performance along with representative microstructural cross-sections for I = 6A (i.e. 2.42C for ε = 0.20, 2.77C for ε = 0.30 and 3.08C for ε = 0.40) and T = 25°C operation. Lower porosity cathode has higher capacity because of higher amount of active material. (c) Influence of microstructure on cell temperature evolution along with representative microstructural cross-sections for I = 6A and T = 25°C operation. Cathode with a lower porosity shows higher temperature rise due to larger Joule heating contribution.
For the sake of completeness, the terminology and salient parameters used in the simulations are reviewed briefly. The state of charge (SOC) has been defined both at the cell level and individual electrode level for better explaining the electrode microstructure implications on the cell capacity and temperature rise. At the cell level, SOC is defined as the ratio of the discharge capacity at a particular C-rate to the discharge capacity obtained at 1 C and 25°C. Depth of discharge (DOD) is defined as (1 – SOC) at the cell level. The electrode level SOC is defined as the average fractional occupancy of lithium in the electrode. The anode SOC can range from 0 to 1 as graphite shows fully reversible intercalation/deintercalation over the entire SOC range. The Li(Ni1/3Mn1/3Co1/3)O2 cathode shows reversible intercalation/deintercalation in the SOC range of 0.3–1. At the beginning of discharge, the anode SOC is fixed at 0.95 and the cathode SOC is close to 0.3 which gives an initial voltage close to 4.2 V. The discharge simulations are carried out till the voltage goes below 3 V (or the cathode is fully lithiated).
Analysis of heat generation sources
Joule/ohmic heat
Figures 4a and 5a–5c show the temporal and spatial distributions of joule heat rates, respectively for different electrode microstructural variation. From Figure 4a, it can beconcluded that the lowest porosity cathode (ε = 0.2) is associated with the highest Joule heat rate. Lower porosity results in higher tortuosity of the cathode, which impedes Li+ ion transport in the electrolyte, thereby increasing the charge transport resistance. This high internal resistance increases the polarization of Li+ concentration and electrolyte potential. Consequently, according to Eq. 13, steep concentration and potential gradients ensue, leading to increased ohmic heat. Figures 5a–5c show the spatial distribution of the Joule heating rates for different cathode microstructures with varying porosities. It is evident that the maximum ohmic heating rate occurs in the vicinity of the cathode-separator interface. This is due to the existence of higher concentration and potential gradients close to the separator-electrode interface. Since the anode microstructure is unchanged for all the scenarios studied here, the heating rate inside the anode shows little variation, except near the end of discharge. It can be concluded that higher concentration and potential gradients in the region near cathode-electrolyte interface contribute significantly to the Joule heating rate in a Li-ion cell with a low-porosity cathode. It is also worth noticing that, toward the end of discharge, the joule heating rate as well as the extent of the heating region in the anode diminishes for such a low-porosity cathode configuration. This phenomenon can be explained by the temperature dependence of electrolyte transport properties. The steeper temperature rise accompanying the low porosity cathode improves the ionic conductivity and diffusivity. Hence, the electrolyte concentration and potential gradients become less steep in the anode (with a fixed porosity), thereby leading to lower ohmic heat rate in anode as the cathode porosity decreases from 0.4 to 0.2. This temperature increase during discharge also alters the heating zone in the cathode. However, in the cathode, there are two competing factors, decreased porosity leading to higher tortuosity, and higher temperature leading to improved transport properties. The tortuosity increase emerges as the dominant factor and the deleterious effect thereof cannot be compensated by the betterment of the electrolyte transport properties. Consequently, higher ohmic heat rates can be observed with lower porosity in the cathode during the discharge. At the end of discharge, the disparity in the heat rates for the three different porosity cathodes becomes smaller which can be attributed to the temperature rise, which can improve electrolyte transport properties, as compared to the negative effect from enhanced tortuosity for lower porosity cathode microstructure.

Figure 4. Microstructure effect on: (a) Joule heat rate, (b) reaction heat rate, (c) reversible heat rate, and (d) total heat rate for I = 6A (i.e. 2.42C for ε = 0.20, 2.77C for ε = 0.30 and 3.08C for ε = 0.40) and T = 25°C operation. The anode microstructure is considered to have a fixed porosity. Low porosity increases transport resistance leading to higher Joule heat contribution. Reaction heat has opposite trend to Joule heat for most part of the DOD range because of higher interfacial area. Reversible heat is similar for the three porosities investigated except for end of discharge. Joule heat is the dominant contributor to the total heat generation rate.
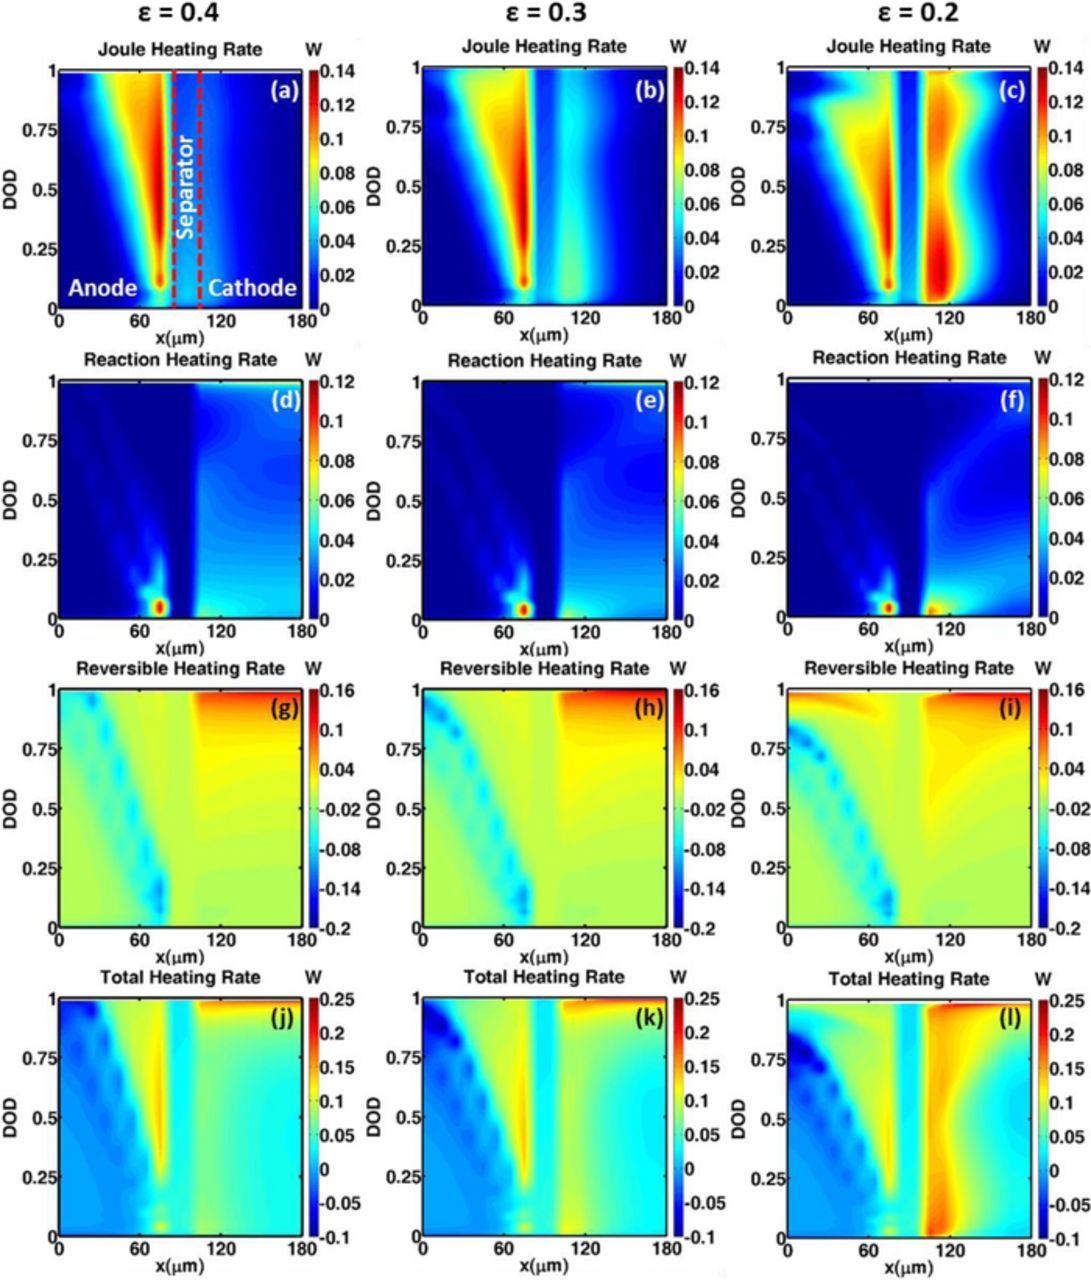
Figure 5. Influence of microstructure heat generation rates for I = 6A (i.e. 2.42C for ε = 0.20, 2.77C for ε = 0.30 and 3.08C for ε = 0.40) and T = 25°C operation. (a–c) Joule heat rate; (d–f) Reaction heat rate; (g–i) Reversible heat rate; (j–l) Total heat generation rate. Reaction and reversible heat are zero in the separator region.
Reaction/irreversible heat
Figure 4b shows the temporal evolution of reaction heating rate. In contrast to joule heating, the cell with a low-porosity cathode has the least reaction heating rate during the discharge process. The difference in reaction heating rate is mainly due to the difference in interfacial area between the electrode and electrolyte. The increase in the amount of active material is accompanied by an increase in interfacial area for the porosity range investigated here (0.2–0.4). This enlargement of the interfacial area leads to a reduction in the overpotential for the same current density. According to Eq. 13, the decrease in overpotential lowers the reaction heating rate. The spatial distribution of reaction heating rates, shown in Figs. 5d–5f, also corroborates this trend. The magnitude of the reaction heat rate in the anode is less as compared to that in the cathode due to a higher exchange current density of graphite as compared to Li(Ni1/3Mn1/3Co1/3)O2. The distribution of reaction heating rates shown in Figs. 5d–5f is directly related to the spatial distribution of reaction current density. At the beginning of discharge, the reaction heating zone is concentrated in the region close to the separator, as the reaction current density peaks close to the separator-electrode interface. In addition, as the discharge progresses, the distribution of reaction heat rate is more uniform in the cell with a high-porosity cathode. This is because the distribution of the reaction current density is more uniform in the cell with a higher porosity cathode. The reaction heat rate is zero in the separator region as there is no reaction inside the separator.
Reversible heat
The magnitude of the reversible heat rate is negligible when the depth of discharge (DOD) ranges from 0–0.8 (see, Fig. 4c), except toward the end of discharge. This is a direct consequence of the magnitude of entropic heat ∂Ueq/∂T being negligible (∼0.5 mV/K) for both the cathode and anode material for this DOD range. At the end of discharge (DOD > 0.8), the cell with a low-porosity cathode (0.2) shows higher reversible heat rate compared to the cell with a high-porosity cathode (0.4). This results from the variation in the state of charge (SOC) range for anode with a change in porosity and is explained further below. Figures 5g–5i show the spatial distribution of the reversible heat rates. The difference in the reversible heat rate in the cathode for porosity variation is almost negligible, since the range of cathode SOC during discharge does not vary. This is a direct consequence of the cell being limited by the cathode loading. Consequently, the aforementioned difference in reversible heat rate at the end of discharge is mainly due to the usage of anode SOC during the discharge process. The change in the active material amount of cathode changes the negative/positive electrode (N/P) ratio. For the cell with a 40% porosity cathode, the SOC range of the anode during discharge is 0.95–0.4. For the cell with 20% porosity cathode, the SOC range of anode during discharge is 0.95 – 0.2. For a graphite anode, the value of dUeq/dT is negative (heat depletion as j is positive in anode during discharge) when the SOC ranges between 0.3 and 1, and the value of dUeq/dT is positive (heat generation as j is positive in anode during discharge) when SOC < 0.3. Since the SOC range of the anode in the cell with 20% porosity cathode can achieve the positive reversible heat region (SOC < 0.3), there is reversible heat at the end of discharge. It is interesting to note that the reversible heat also takes on negative values as seen in Figs. 5g–5i. Similar to the reaction heat, the reversible heat is also zero in the separator as there is no reaction occurring in the separator.
Total heat rate
Figures 4d and 5j–5l show the temporal evolution and spatial distribution of the total heat rate, i.e. the sum of Joule, reaction and reversible heat rates. As shown in Fig. 4d, the total heat rate increases with the decrease in cathode porosity, which explains the faster temperature increase in the cell with a lower porosity cathode. The total heat rate variation, for cathodes with porosity ranging between 30% and 40%, happens primarily when DOD = 0–0.8. Closer to the end of discharge, the total heat rate curves converge. From the spatial distributions of the total heat rates (see Figs. 5j–5l), it can be observed that the heat rates shows higher values closes to the cathode-separator interface. In the anode, the difference in the total heat rate is primarily due to the variation in the reversible heat rate based on the N/P ratio.
Trade-off between temperature control and cell capacity
Since the heat generation rate is also affected by the discharge rate and ambient temperature, analyzing the influence of electrode microstructure on the cell thermal behavior under different operation conditions is important. Figure 6 presents the maximum temperature and cell capacity for varying cathode porosities during discharge for different C-rates. Figures 6a, 6c show the maximum temperature and capacity when the cell operates at ambient temperature of 25°C, and Figs. 6b, 6d show the show the same for cell operation at an ambient temperature of 40°C. In Figs. 6a and 6b, based on the maximum temperature, there distinct regimes can be identified. The "Unsafe" region refers to T >80°C, where the cell runs high risk of going into potential thermal runaway. The region of "Potential Risk" refers to a temperature range of 60°C <T <80°C, where the cell has the potential for being driven into thermal runaway if a sudden heat generation rate spike is observed,for example due to an external short. The "Safe" region refers to T < 60°C, where the cell can operate within a thermally safe window. Figure 6a suggests that when the discharge current is below 7A, the maximum cell temperature rise within a cathode porosity range of ɛ ∼ 0.4–0.18 can remain outside the unsafe zone. However, the cell can reach the unsafe temperature region, for the same cathode porosity range, when the discharge current is higher than 7A. An interesting thermo-electrochemical behavior can be seen in the low porosity region. The maximum temperature reached in this region does not cross the unsafe barrier even at higher C-rates. The lower maximum temperature for the cell with cathode porosity of ɛ ∼0.18–0.20 is due to the self-shutdown of the cell. At high discharge rate, because of large internal resistance of a low-porosity cathode, the cell shuts down before the full discharge in the operating window of 3.0 - 4.2 V. Figure 6c also shows the capacity lost due to the self-shut down for a low-porosity cathode. Under high discharge currents (e.g., I > 5A), there is significant capacity lost for a low-porosity electrode compared to the capacity obtained under low discharge current. Due to the self-shutdown, although the heat generation rate is large, the reduction in time for temperature rise decreases the maximum temperature obtained for a low-porosity cathode. The dashed lines in Figs. 6c and 6d correspond to the current at a fixed C-rate value for different porosity cathodes. As the porosity decreases, the nominal cathode capacity increases, hence an increase in the current corresponding to a particular C-rate can be observed with lower porosity. For porosity greater than 0.35, for 1 C operation, the current goes below 2A as evident by the dashed line intersecting the porosity axis.

Figure 6. Influence of discharge current and cathode porosity on the maximum temperature at the end of discharge for: (a) Tamb = 25°C, and (b) Tamb = 40°C. Safe region corresponds to T < 60°C. Potential Risk region corresponds to 60°C < T < 80°C. Unsafe region corresponds to T > 80°C. Effect of discharge current and cathode porosity on the cell capacity at the end of discharge for: (a) Tamb = 25°C, and (b) Tamb = 40°C.
From Fig. 6b, it is evident that the unsafe region expands when the cell operates at a higher ambient temperatures (e.g., Tamb = 40°C). With the exception of the cathode porosity of 40%, cells with other cathode porosities run the risk of reaching the unsafe temperatures, and hence the maximum allowable discharge current decreases with decrease in the cathode porosity. Similar to Fig. 6a, for the cathode porosity of ∼18%, if the discharge current is larger than 7A, the induced self-shutdown limits the maximum temperature below 80°C. The self-shutdown for Tamb = 40°C also can be observed from the capacity contour plot shown in Fig. 6d. It is worth noticing that a loss in the achievable capacity happens at higher discharge current and lower porosity cathode when Tamb = 40°C as compared to that for Tamb = 25°C. This is because an increase in the ambient temperature enhances the ionic conductivity and diffusivity, which further decreases the internal resistance. The decrease in internal resistance shrinks the range of discharge current and porosity, which can trigger self-shutdown.
From Figure 6, it can be concluded that the maximum cell temperature rise is linked to electrode porosity and discharge current. To limit the maximum temperature of the cell, two routes may be adopted. One way is external shut down, which shuts down the cell when it reaches the maximum temperature limit with external control or mechanism. However, with this shutdown mechanism, the cells are forced to stop before full discharge as shown in Fig. 7a. Figure 7a shows an example of a scenario if we want to limit the temperature below 60°C. Figure 7b presents the obtained capacities if the temperature is limited to 60°C and 70°C, respectively. If there is no temperature control, the cell with cathode porosity of 20% has the highest capacity when the discharge current is 6A. The decrease in capacity for a cathode porosity of ∼18% is due to the self-shutdown. When the temperature is limited to 70°C, a cell with the cathode porosity of 20% can no longer provide the maximum capacity, while a cell with the cathode porosity of 25% becomes the best case scenario. If we further limit the temperature at 60°C, the cathode porosity, which can provide the maximum capacity, shifts to 35%.

Figure 7. (a) Cell depth of discharge (DOD) with different cathode porosities when the cell temperature reaches 60°C. To limit the cell temperature at a certain temperature, discharge needs to be cut-off at different DOD, which which comes at the cost of cell capacity. (b) Cell capacity that can be obtained with different cut-off temperature. The temperature evolution and maximum temperature corresponding to cell discharge at I = 6A (i.e., 2.28C for ε = 0.15, 2.42C for ε = 0.20, 2.58C for ε = 0.25, 2.77C for ε = 0.30, 2.98C for ε = 0.35, and 3.08C for ε = 0.40) and Tamb = 25°C.
An alternate way to control the cell temperature is by controlling the electrode (cathode) microstructure. From Figs. 6a and 6b, it can be concluded that by controlling the porosity (i.e. amount of active material), the maximum temperature can be controlled. To keep the maximum temperature away from the unsafe region, shown in Figs. 6a and 6b, the cathode porosity can be an internal control, for example increase the cathode porosity slightly to lower the temperature rise or decrease the porosity to a threshold value (such as, ∼20%) to induce self-shutdown of the cell. Figures 8a and 8b expand on this point further and show the optimum window of cathode microstructure design when the discharge current is 8A. In Figure 8a, if the desired temperature safety limit is 80°C, the cell should have cathode porosity larger than 26% or smaller than 18%. Similarly, if the desired temperature limit is 70°C, the cell should have cathode porosity larger than 36% or smaller than 16%. The lower the desired maximum temperature limit, the lesser the available options are for the cathode microstructure design. Similar to the external temperature control mechanism, when the electrode microstructure is designed to control the temperature, there is some variation in the obtained cell capacity as well. The corresponding capacity that the designed electrode microstructure can obtain is also shown in Fig. 8a. As is evident, the choice of increasing porosity (i.e. decreasing the amount of active material) seems to be a preferred route as it can result in a higher capacity of the cell (e.g. 2.2 Ah for 26% porosity as compared to 1.7 Ah for 18% porosity for Tmax = 80°C). A similar analysis was also performed for obtaining the optimum microstructure design window when the ambient temperature is 40°C, as shown in Fig. 8b. The design window of the cathode microstructure shrinks further for a cell operating at Tamb = 25°C, as compared to 40°C operation.
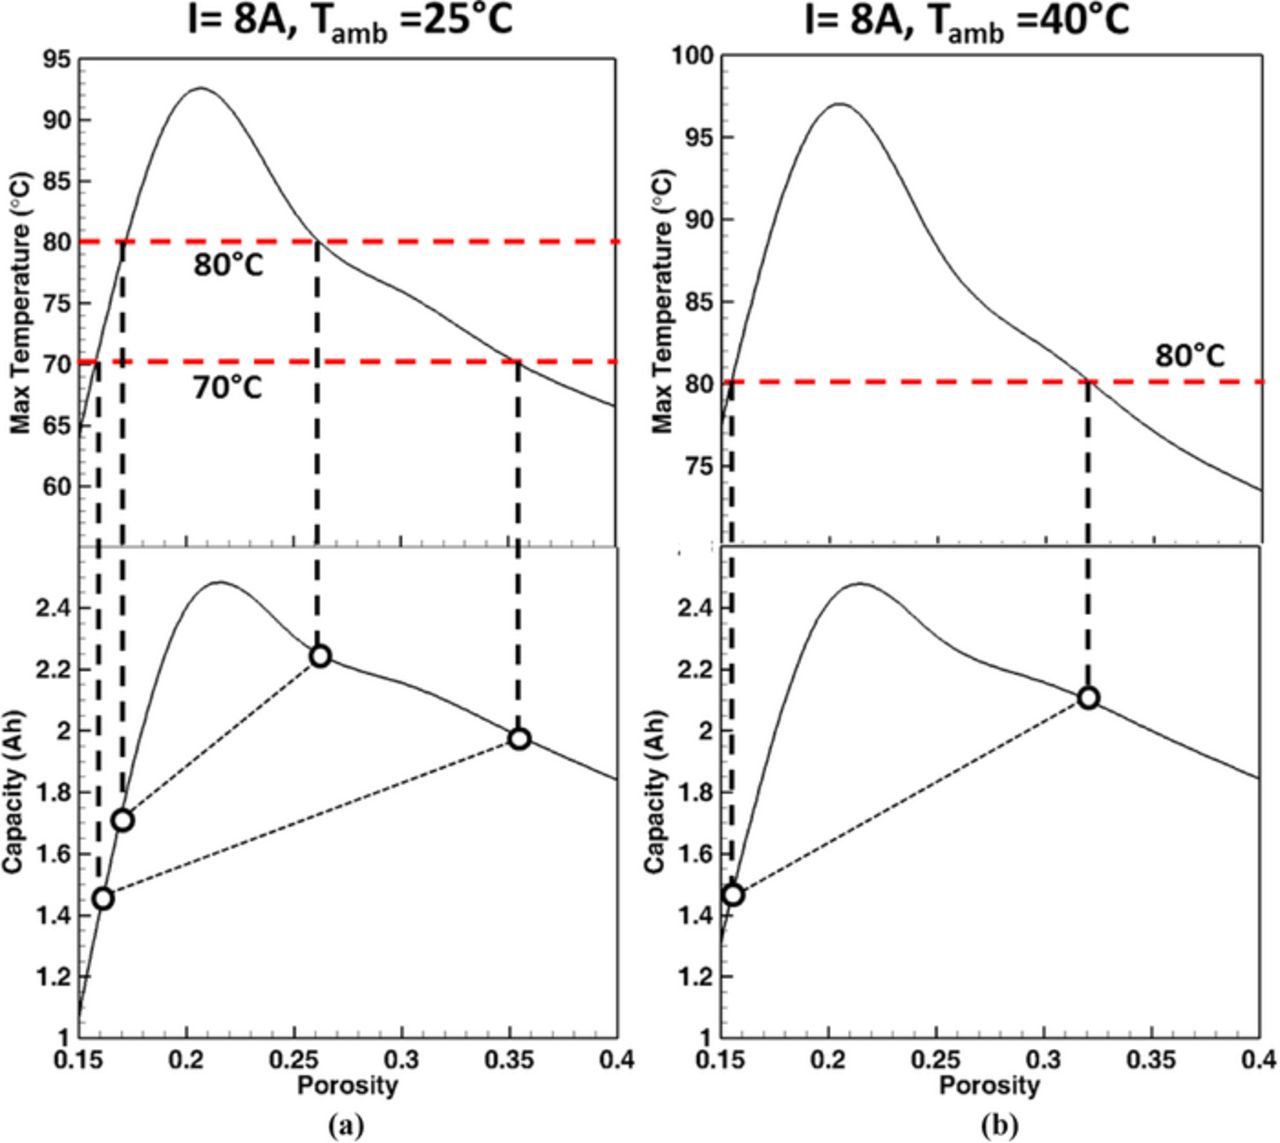
Figure 8. Cell discharge capacity with different cathode porosity and maximum temperature at the end of discharge for: (a) I = 8A and Tamb = 25°C, and (b) when I = 8A and Tamb = 40°C (i.e. 3.04C for ε = 0.15, 3.23C for ε = 0.20, 3.45C for ε = 0.25, 3.69C for ε = 0.30, 3.98C for ε = 0.35, and 4.11C for ε = 0.40). The maximum temperature reached shows a peak at medium porosity range. For limiting temperature below the maximum allowable temperature, either low porosity range or high porosity range should be used.
This study highlights that for cell temperature control via electrode microstructure, porosity increase is more beneficial especially for operation at high C-rates. However, this is only true if the high discharge current is "intentional". There can be extenuating circumstances, where the high current is "not intentional", such as the failure of the control system and external short. To account for these conditions, decreasing the porosity to such limits so as to initiate self shutdown is a better choice. As shown in Fig. 8a, for the discharge current range of 0A–10A, both low-porosity electrodes (ɛ = 0.15–0.18) and high-porosity electrodes (ɛ = 0.32–0.4) maintain the maximum temperature below 80°C. An additional advantage of using the low-porosity electrode is the higher capacity under low C-rate discharge. Generally, for normal operation the load on the cell draws less than 1C current, and consequently low porosity electrode (ɛ = 0.15–0.18) will allow higher capacity to achieve due to the larger amount of active material without an appreciable temperature rise. Therefore, low-porosity electrodes (ɛ = 0.15–0.18) have the advantage of: (i) high capacity under low discharge current, (ii) self shutdown mechanism to prevent the temperature rise to an extreme and avoid thermal runaway at high discharge currents. Such cells can be useful for constant load operations where the current drawn from the cell is not very high (< 2C) and does not show significant fluctuations. The usage of these low-porosity electrodes for electric vehicle batteries will, however, be a bit tricky as vehicular operation involves C-rate swings, which may sometime require currents in excess of 5C. It can be inferred that that a battery pack consisting of both low- and high-porosity (electrode) cells may be a promising option for electric vehicle (EV) batteries. A battery management system devised such that low currents are drawn from the low porosity cells and high current loads invoke the usage of higher porosity cells will go a long way into increasing the capacity as well as power capability of EV batteries without allowing the temperature to exceed the critical (safety) limit. This study points to the existence of an optimum electrode microstructure design, based on the cell operation conditions and electrode microstructure dependent thermal behavior, to ensure the safety of a Li-ion cell.
Conclusions
In this work, the influence of electrode microstructure, especially cathode, on the thermal behavior of lithium-ion batteries has been elucidated. In this regard, a microstructure-aware electrochemical-thermal model has been proposed, which includes stochastically reconstructed 3-D virtual electrode microstructure to extract effective transport and geometric properties. This model can better capture the tortuosity, conductivity and active area in Li-ion battery batteries as compared to the macrohomogeneous electrochemical models based on the porous electrode theory. The impact of cathode microstructure on the cell temperature rise has been addressed and analyzed in detail by studying the temporal evolution and spatial distribution of different heat sources (i.e Joule heat, reversible heat, and reaction heat). During discharge, the influence of cathode microstructure on the joule heat and reaction heat is mainly observed in the cathode, and the influence of microstructure on the reversible heat is mainly observed in the anode. The difference in the total heat rate is mainly observed near the cathode/separator interface and at the end of discharge.
From this study of the microstructure dependent thermal behavior, the trade-off between cell capacity and temperature control has been deliberated. Although increasing the amount of active material can boost the cell capacity, it can also raise the cell temperature and increases the risk of thermal runaway. To maintain the cell temperature below the safety limit, while not significantly sacrificing the cell capacity, an optimal electrode microstructural (porosity) and transport (tortuosity) combination is required. Increasing the electrode porosity can decrease the cell temperature due to the lower heat generation rate. On the other hand, the self-shutdown mechanism can also limit the cell temperature if the electrode porosity is low enough, especially for discharge with high current. In summary, elucidating the microstructure dependent thermal behavior provides a direction toward potentially improving the Li-ion battery safety without additional external control mechanisms.
The proposed microstructure aware thermo-electrochemical model can be extended to other chemistries and electrode microstructures. The variation would lie in the electrode microstructure reconstruction with different active material morphology and size distribution. While the lumped thermal modeling approach is a good approximation, for large format cells significant spatial variation of temperature inside the cell is expected which will require fully resolved energy equation. The current model presented here is, however, readily extensible to different chemistries and electrode configurations which will be explored in a future study.
List of Symbols
| A | Electrode area (m2) |
| Asurf | Cell surface area (m2) |
| as | Specific surface area of electrode (m2/m3) |
| ce | Electrolyte concentration (mol/m3) |
| cs | Concentration of Li in solid phase (mol/m3) |
| csmax | Maximum Li solid phase concentration (mol/m3) |
| De | Electrolyte diffusivity (m2/s) |
| Deeff | Effective electrolyte diffusivity (m2/s) |
| Ds | Solid phase diffusivity (m2/s) |
| d | Total derivative |
| dUeq/dT | Entropic coefficient (mV/K) |
| F | Faraday's constant (C/mol) |
| h | Heat transfer coefficient (W/m2-K) |
| i | Current density (A/m2) |
| io | Exchange current density (A/m2) |
| j | Volumetric current density (A/m3) |
| k | Reaction rate constant (m2.5 mol−0.5 s−1) |
| La | Anode thickness (m) |
| Lc | Cathode thickness (m) |
| Lsep | Separator thickness (m) |
 |
Total heat generation (W/m3) |
| R | Universal gas constant (J/mol-K) |
| Rs | Particle radius (m) |
| T | Temperature (K) |
| t+ | Transference number (-) |
| Ua | Anode open circuit potential (V) |
| Uc | Cathode open circuit potential (V) |
Greek
| ∂ | Partial derivative |
| ∇ | Gradient |
| η | Overpotential (V) |
| σs | electronic conductivity (S/m) |
| σseff | Effective electronic conductivity (S/m) |
| θs | Surface stoichiometry of spherical particle (-) |
| ϕs | Solid phase potential (V) |
| κ | Ionic conductivity (S/m) |
| κD | Diffusional conductivity (A/m) |
| ϕe | Electrolyte phase potential (V) |
Subscripts
| s | Solid |
| a | Anode |
| sep | Separator |
| e | Electrolyte |
| c | Cathode |
| surf | Surface |
Superscripts
| eff | Effective property |
| max | Maximum concentration |
Acknowledgment
Financial support from the U. S. Department of Energy (DOE) Computer Aided Engineering for Batteries (CAEBAT III) program (Program Manager: Brian Cunningham) is gratefully acknowledged. The authors would like to thank Kandler Smith from National Renewable Energy Laboratory for fruitful discussions as part of the CAEBAT III project.