Abstract
The vast majority of semiconductors photocatalysts reported for artificial nitrogen fixation have a large bandgap at around 3.0 eV, thus photocatalytic nitrogen reduction is driven mainly by ultraviolet light. In contrast, this report demonstrates for the first time that bismuth iron molybdate (Bi3FeMo2O12) with a bandgap of 2.25 eV exhibits visible-light photocatalytic activity toward nitrogen-to-ammonia conversion. Furthermore, introduction of oxygen vacancy to this photocatalyst increases the ammonia production rate remarkably. Density functional theory (DFT) calculation reveals that the oxygen vacancies help adsorb and stabilize the N-H intermediate species, and lower the energy barrier of intermediate reactions. This work has an implication in design of semiconductor photocatalysts for sustainable ammonia synthesis under the ambient condition using solar energy.
Export citation and abstract BibTeX RIS

This is an open access article distributed under the terms of the Creative Commons Attribution Non-Commercial No Derivatives 4.0 License (CC BY-NC-ND, http://creativecommons.org/licenses/by-nc-nd/4.0/), which permits non-commercial reuse, distribution, and reproduction in any medium, provided the original work is not changed in any way and is properly cited. For permission for commercial reuse, please email: oa@electrochem.org.
Ammonia serves as a fertilizer in agriculture and also as an important industrial feedstock.1,2 Haber-Bosch process, which utilizes heterogeneous catalysis for ammonia synthesis from nitrogen and hydrogen (N2+3H2→2NH3), requires high temperature and pressure (300–550°C, 15–25 MPa) and high-purity nitrogen and hydrogen feedstocks.3,4 As a result, about 2% global energy supply is consumed and 1% global greenhouse gas emission are produced for industrial ammonia synthesis.5 This demands the development of a sustainable nitrogen fixation process to overcome the energy and environmental issues associated with the Haber-Bosch process.6,7 Photocatalysis is an alternative and promising nitrogen fixation process.8 Because it can be conducted at ambient temperature and pressure using sunlight as the energy supply and water as the protons source, it is considered as a sustainable ammonia synthesis process.9 For example, researchers are developing metal oxides (TiO2, Fe2O3, BiO, Ga2O3)10–14 and oxyhalides (BiOBr, BiOCl, Bi5O7I, Bi5O7Br)14–18 for artificial nitrogen fixation. However, the vast majority of those semiconductors reported for nitrogen fixation have a large bandgap at around 3.0 eV. Although these wide bandgap semiconductors have suitable band energetics and photovoltage for driving photocatalytic nitrogen reduction reaction, they have limited light-absorption spectral range (mainly collecting ultraviolet (UV) light within ∼5% of the solar radiation spectrum).19 The ideal condition is the conduction band and the valence band of the semiconductor straddle the N2/NH3 and H2O/O2 redox potentials, respectively, but with a narrow bandgap.
In search for prospective semiconductor photocatalysts for ammonia synthesis, we are inspired by natural nitrogen fixation with nitrogenase, in which the Mo and Fe cluster center play a vital role in the activation and reduction of nitrogen.20–24 Theoretical calculations have been done to create the volcano plots for screening catalysts that thermodynamically favor the nitrogen reduction reaction.25,26 Mo and Fe stand close to the apex of the absorption and the desorption side of the nitrogen reduction volcano plot, respectively.27 This further indicates that Mo-Fe-based semiconductors could be among the most promising for photocatalytic nitrogen fixation. Therefore, herein Bi3FeMo2O12 is selected as the photocatalyst candidate for artificial nitrogen fixation because it contains the Mo-O-Fe center. In addition, its conduction band and valence band straddle the N2/NH3 and H2O/O2 redox potentials, respectively. Furthermore, its bandgap is ∼2.25 eV, which enables visible-light absorption up to 544 nm. This study demonstrates for the first time that Bi3FeMo2O12 nanoparticles can be used as the visible-light photocatalyst for nitrogen fixation. After introducing oxygen vacancies into Bi3FeMo2O12 by heat-treatment under the hydrogen-containing atmosphere, the photocatalytic activity of the Bi3FeMo2O12 is improved for nitrogen reduction. Moreover, Density Functional Theory (DFT) calculation was performed on the photocatalytic nitrogen fixation process to help analyze the reaction mechanism and pathways.
Experimental
Characterization
Morphology and structure of the samples were obtained by field-emission scanning electron microscope (FE-SEM) (JEOL 7600F). Transmission Electron Microscope (TEM) and High Resolution-Transmission Electron Microscope (HRTEM) images were acquired by transmission electron microscope (TEM, JEOL JEM 2100F). UV−Vis spectra were recorded with Shimadzu 2550 UV-Visible spectrometer under the diffuse reflection model using an integrating sphere (UV 2401/2, Shimadzu). Raman spectra were recorded by a portable B&W Tek i-Raman Plus with 785 nm wavelength laser excitation. The chemical status of elements was analyzed with X-ray photoelectron spectroscopy (XPS, PHI 5000 Versa Probe system, Physical Electronics). Collected spectra were corrected for charging effects by normalizing data to naturally occurring adventitious carbon (Ebinding = 284.8 eV) on the samples as a reference point.
Synthesis of Bi3FeMo2O12
0.5 mmol of Na2MoO4·2H2O (purchased from ACROS Organics) was dissolved in 60 mL of DI-water, followed by adding stoichiometric amounts of Bi(NO3)3·6H2O and Fe(NO3)3·9H2O (from Alfa-Aesar) with vigorous stirring. After about 10 minutes, the pH was tuned to 5 using NaOH solution. After stirring was continued for another 30 minutes, the final suspension was transferred to a PTFE-lined autoclave, then placed in a convection oven at 180°C for 20 hours. The samples were then cooled down naturally to room temperature. The samples were then washed with deionized (DI) water and ethanol 3 times and dried at 60°C overnight to obtain dry powder samples.
Hydrogen treatment of Bi3FeMo2O12
The as-synthesized Bi3FeMo2O12 powder in a ceramic combustion boat was placed into a tube furnace with a constant gas flow (N2: H2 = 95: 5%) at various temperatures for 4 hours. Samples are labeled as H-Bi3FeMo2O12-X, where X is hydrogen treatment temperature for that sample.
Photocatalytic nitrogen fixation
50 mg of Bi3FeMo2O12 or H-Bi3FeMo2O12-X powder sample was dispersed in 100 mL of DI water and treated ultrasonically for 30 minutes. The Bi3FeMo2O12 suspension was then bubbled with ultra-high purity N2 for 30 min. Photocatalysis was performed using a 450 W high-pressure mercury vapor lamp as the light source. After every 15 min of reaction, 3 mL of suspension was removed from the reaction solution with a syringe with catalysts removed using a 0.22 μm syringe filter. The ammonia concentration in the reaction solution was quantified by Indophenol blue method. A N2 gas flow was maintained at 50 mL/min during the photocatalytic nitrogen fixation experiments.
Electrochemical testing
Catalyst slurries were made by dispersing Bi3FeMo2O12 or H-Bi3FeMo2O12-X powder in 2-Proponal (10 mg/mL) with Nafion-117 solution (10 μL/mL). Ultrasonication was conducted for at least 2 h to form uniform slurry. Fluorine-doped tin oxide (FTO) glass pieces were pre-cleaned by ethanol, acetone, and 2-propanol. Catalyst slurry was drop coated on FTO glasses with concentration of 3.5 mg/cm2. The working electrode was made of the FTO glass coated with a Bi3FeMo2O12 thin film with a copper wire electrical contact attached to a conductive silver paste. The Ag|AgCl electrode (Sat. KCl; Eo = 0.197 V vs. NHE) and Pt were used as the reference and counter electrodes, respectively. 0.1 M Na2SO4 aqueous solution was employed as the electrolyte. For argon- or nitrogen-saturated measurement, the electrolyte was bubbled for 20 minutes with Ar or N2 gas prior to testing. Gas bubbling was continued during the linear sweep voltammetry scans and chronoamperometry tests. Mott-Schottky plots (M-S) were recorded by a three-electrode configuration at an AC frequency of 5 kHz using 20 mV AC voltage. The capacitance calculated by equation:

Where f is frequency, Zimg is imaginary part of the impedance, C is capacitance. Flat band potential could be obtained by extrapolation of the linear range of M-S plots.
Quantification of ammonia
A solution of 10 g of analytical grade phenol dissolved in 50 mL of ethanol was prepared. Another solution containing 0.5 g of sodium nitroprusside in 100 mL of DI water was also prepared. The phenol and sodium nitroprusside stock solutions were pre-made and kept in a refrigerator (T = 4°C) for future use. An alkaline solution was prepared by dissolving 100 g of sodium citrate and 5 g of sodium hydroxide in 500 mL of DI water. Fresh oxidation solution was made by adding 25 mL of 6% sodium hypochlorite into 100 mL of alkaline solution. A standard ammonium chloride solution was made by dissolving 0.3874 g of NH4Cl (pre-dried at 120°C for 2 h) in 500 mL of DI water (10 mM), and then diluted to 100 μM, 50 μM, 25 μM, 10 μM, 5 μM, 1 μM and 0.5 μM. For ammonia detection, phenol solution, sodium nitroprusside solution, and fresh oxidation solution into 3 mL of standard ammonium chloride solution, mixed well after each addition. The combined solution was kept in the dark at room temperature for 1 h to generate blue color. The absorption intensity at 630 nm was read using DI water as the reference. Calibration curves were created by plotting absorption intensity at 630 nm against the known ammonium concentration in the standard solution. To measure ammonia concentrations generated during photocatalytic nitrogen fixation experiments, phenol solution, sodium nitroprusside solution, and oxidation solution were added into 3 mL of sample reactant solution with subsequent measurement steps as above carried out.
DFT calculation
Thermodynamic properties are predicted for the reaction steps of the associative and dissociative pathways. These approximated reaction steps assisted this study overall to analyze the Bi3FeMo2O12 structure configuration by means of experimental and density functional theory (DFT)35 approaches to ascertain the performance of nitrogen fixation as surface oxygen vacancy occurs. The DFT calculations ultimately relied on the functional form of the pseudo-wave function, which overall is based on Perdew-Burke-Ernzerhof (PBE) exchange-correlation function. The exchange-correlation function potential had a cutoff radius of 1.5 keV (110 Ry) and a density cutoff radious of 1.8 keV (1320 Ry), these cutoff radiuses proved quite accurate for the studied Bi3FeMo2O12 unit cell structure configuration. To allow the reduction of computational expense, an ultra-soft pseudopotential and pseudized wave function were implemented. The steps for relaxing the unit cell are as fallows. The unit cell initially is relaxed in the bulk structure and then set up as a slab and relaxed again. For the initial relaxation of the bulk structure, a Monkhorst-Pack with a k-point mesh sampled by 2 × 2 × 2 grid with an overall offset of 1/2, 1/2, 1/2 was used. The slab geometry used gamma k-point with a super cell size of 2 × 2 × 1. After the initial relaxation, a 10 Å vacuum is placed on top of the slab and then relaxed again. Note that the slab overall geometry was relaxed prior to any introduction of the adsorbates (N, H, NH, etc.).
The computational details described, allowed accurate solving of the electronic densities self-consistently. The adsorbates that are placed above the structure were relaxed to a relative total energy less than 1 × 10⁻¹⁰. Before any of the adsorbates were implemented in the structure, the unit cell was relaxed with the vacuum. After relaxation of the structure in the vacuum, the substrate atoms are kept fixed and then adsorbates were allowed to relax in the 10 Å vacuum on the structure surface. Due to over-analyticity of the functionals and exchange-correlation terms used for DFT prediction, energies are often under approximated. Thus, from a theoretical stand point the reported energies attained by DFT calculations are used to show and study the relevant trends for the structure configuration.
Results and Discussion
Bi3FeMo2O12 nanoparticles were synthesized by hydrothermal methods at 180°C for 20 h. Figure 1 shows the Bi3FeMo2O12 particles were in rod shape in a diameter of <50 nm and a length of around 100 nm. There is no evident difference in the particle morphology before and after hydrogen treatment. Both the as-synthesized and the hydrogen-treated nanoparticles were highly crystalline, as shown in the XRD pattern (Figure 1g) and HRTEM images (Figures 1c and 1f). The XRD patterns of the as-synthesized and the hydrogen-treated samples at 300°C (H-Bi3FeMo2O12-300) samples were indexed to the standard pattern for Bi3FeMo2O12 (JCPDS: 70-0031) in the absence of any impurity peak. Clear lattice fringes are shown in the HRTEM images with an interplanar crystal spacing of 0.318 nm, corresponding to (221) interplanar spacing (JCPDS: 70-0031). After hydrogen treatment at 300°C, the sample retained the same crystal structure. However, the sample after hydrogen treatment at 400°C becomes three different phases based on corresponding XRD pattern, which are Bi3FeMo2O12, metallic Bi (JCPDS: 85-1329) and Bi2O2.5 (JCPDS: 74-1999). This is due to the bismuth ions in the matrix of Bi3FeMo2O12 was reduced under hydrogen atmosphere at higher temperatures.
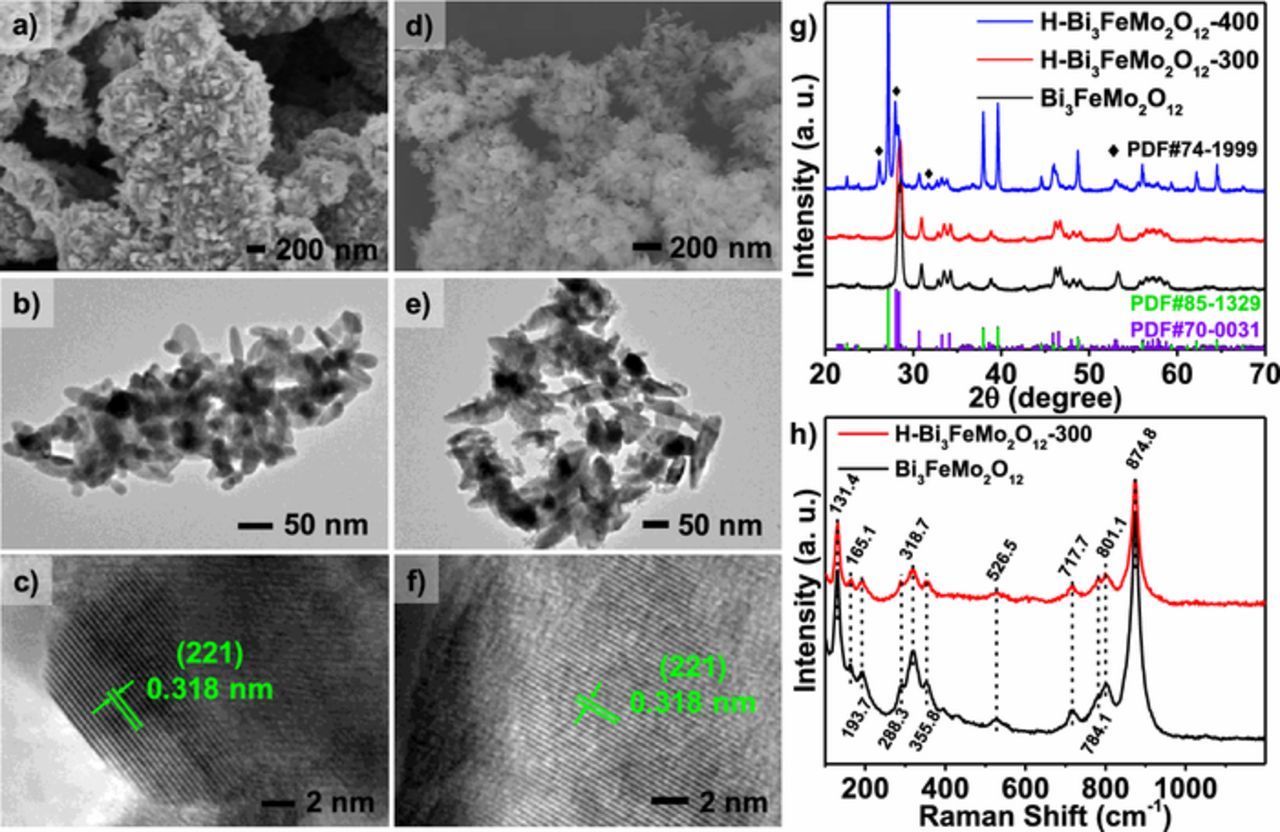
Figure 1. a) SEM, b) TEM, c) HRTEM and d) SEM, e) TEM, f) HRTEM images of Bi3FeMo2O12 and hydrogen-treated Bi3FeMo2O12 at 300°C respectively. HRTEM images show interplanar spacing of corresponding lattice plane. g) XRD patterns and h) Raman spectra of corresponding samples.
Bi3FeMo2O12 has a scheelite type crystal structure; and Mo is tetrahedrally connected with 4 O atoms to form MoO4 groups.28 Raman spectra (Figure 1h) were used to further investigate composition and structure of the Bi3FeMo2O12 samples. The bands at 874.8 cm−1 and 318.7 cm−1 were ascribed to the vibration mode and the bending mode of MoO4 groups, respectively. The band at 717.7 cm−1 was associated with the dioxo bridge bonding to Mo atom. The signal from Bi-O unit in the structure was observed at 526.5 cm−1. The characteristic vibration mode of FeO4 unit in the structure was assigned to 784.1 cm−1 and 355.8 cm−1. Other bands at lower wavenumber may come from rotation or translation modes.29,30 The Raman peak intensities of the H-Bi3FeMo2O12-300 sample decrease relative to the as-synthesized Bi3FeMo2O12 Raman spectra, indicating lower crystallinity of the hydrogen-treated sample.
XPS was performed to investigate elemental composition and chemical bonding state of the samples. There were no detectable impurities signals in the XPS survey spectrum. Figure 2 shows the detailed-scan XPS spectra of the Bi 4f, Fe 2p, Mo 3d and O 1s core-levels. Two different Bi binding conditions were observed in the Bi 4f spectra, which were confirmed by different lone-pair distortions of Bi atoms.31 The peaks at 165.5 eV and 160.2 eV were associated with the longer Bi-O bond length (Bi1). The peaks at 162.3 eV and 157.0 eV could be ascribed to the shorter Bi-O bond (Bi2). In addition, the peaks at 164.6 eV and 159.3 eV were attributed to the Fe-O-Bi bond. The Fe 2p peaks at 711.0 eV and 708.6 eV belonged to Fe3+ and Fe2+, respectively, which is not surprising because the Fe3+/Fe2+ redox couples usually exist in Fe-based semiconductors. The Mo 3d peaks at 232.2 eV and 230.0 eV corresponded to the Mo-O-Bi bond with Mo in a Mo6+ state. From O 1s spectra, the Fe-O-Bi and the Mo-O-Bi (Bi1) peaks overlapped at 530.3 eV while the Mo-O-Bi (Bi2) bond displayed a peak at 528.1 eV. After hydrogen treatment, the relative peak intensity ratio of Mo-O-Bi (Bi2) to Mo-O-Bi (Bi1) decreased significantly, which indicated that the oxygen vacancies at the Mo-O-Bi (Bi2) coordination site were introduced by hydrogen treatment. In addition, a new peak appeared at 231.5 eV in the Mo 3d spectra after hydrogen treatment (Figure 2g), which was consistent with Mo5+ accompanied by a 0.4–0.6 eV shift for each Bi-Mo-O peak.32 This was the further evidence that oxygen vacancies were formed on the sites coordinated with Mo, in agreement with the reduced O 1s peak intensity associated with Mo-O-Bi (Bi2).
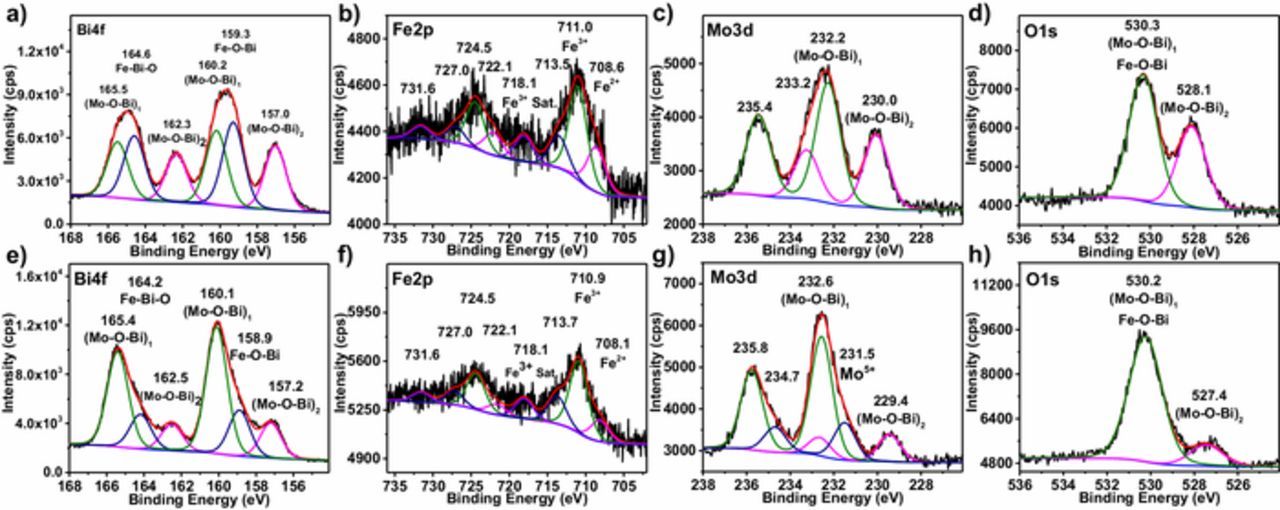
Figure 2. a-d) XPS spectra for Bi 4f, Fe 2p, Mo 3d and O 1s of the as-synthesized Bi3FeMo2O12. e-h) XPS spectra for Bi 4f, Fe 2p, Mo 3d and O 1s of the hydrogen-treated Bi3FeMo2O12 at 300°C.
To further examine the activity for nitrogen fixation of samples before and after hydrogen treatment, electrochemical polarization and chronoamperometry measurements were conducted in the 0.1 M Na2SO4 electrolyte under argon- and nitrogen-saturated conditions (Figure 3b). From polarization curves, both the samples showed electro-activity for nitrogen fixation, but H-Bi3FeMo2O12-300 exhibited much higher current response to nitrogen than the as-synthesized sample. Chronoamperometric experiments were conducted at a bias of −0.7 V vs. Ag|AgCl (Figures 3c and 3d). The recorded average current density difference between argon-saturated and nitrogen-saturated electrolyte denoted as Δj (jN2 - jAr). It can be seen that Δj was 0.65 μA and 5.03 μA for the as-synthesized and H-Bi3FeMo2O12-300 samples, respectively. This further indicated that oxygen vacancies greatly enhanced the activity of nitrogen fixation.
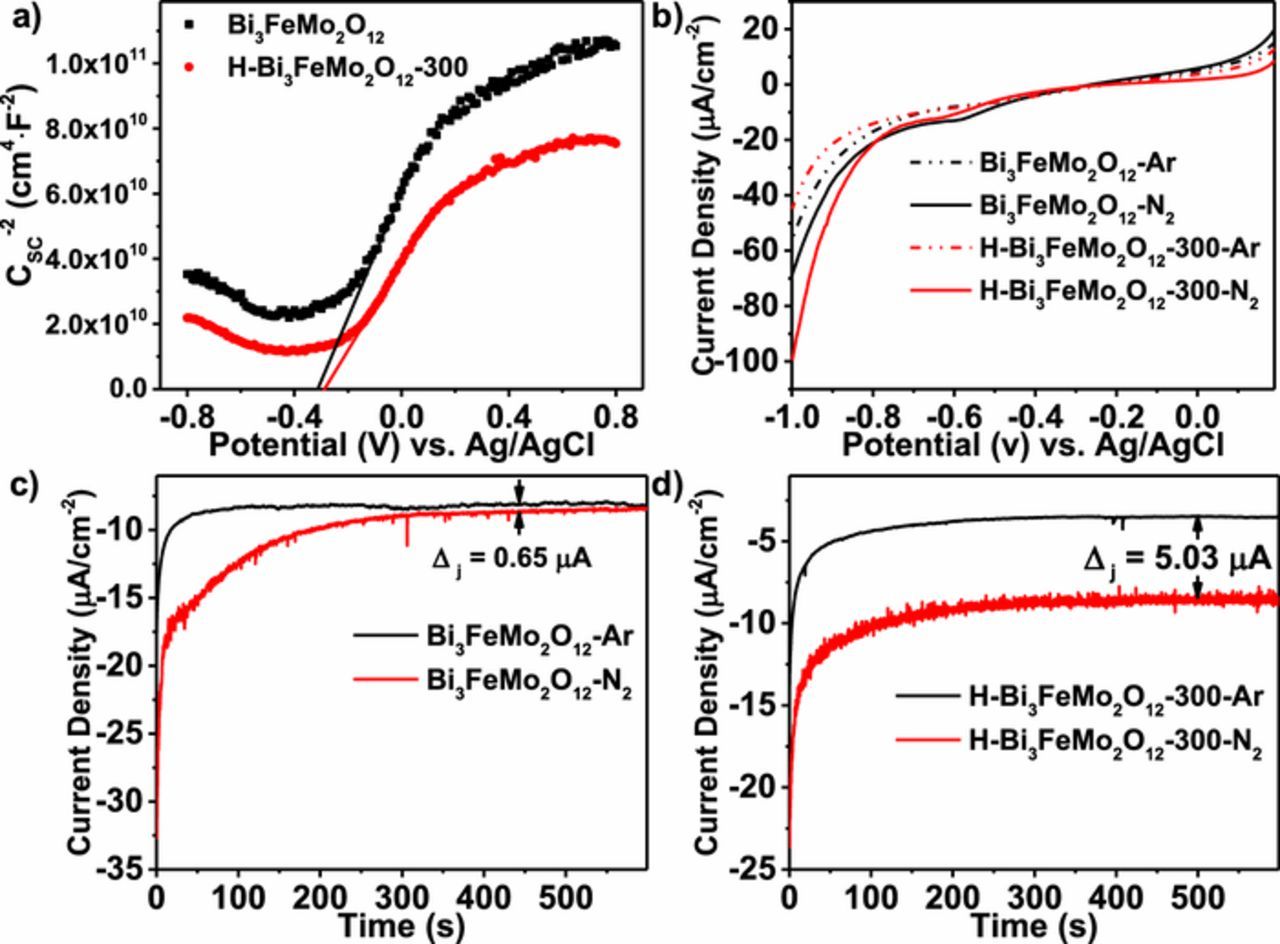
Figure 3. a) Mott-Schottky plots and b) polarization curves of the as-synthesized Bi3FeMo2O12 and the hydrogen-treated Bi3FeMo2O12 at 300°C under argon- or nitrogen-saturated 0.1 M Na2SO4 electrolyte. c, d) Chronoamperometric curves at applied bias of −0.7 V vs. Ag|AgCl.
Optical properties of samples were studied by UV-Visible absorption spectroscopy (Figure 4a), Bi3FeMo2O12 showed excellent absorption in visible-light; and hydrogen treatment resulted in the absorption tail due to the presence of oxygen vacancies. Band gap was estimated to about 2.25 eV based on UV-visible absorption spectra, which was consistent well with reported results.33 According to the electrochemical Mott-Schottky experiments (Figure 3a), the flatband potential was about −0.3 V vs. Ag|AgCl; and there was no any evident change in the flatband potential after hydrogen treatment. In addition, the positive slope of Mott-Schottky curve implied that Bi3FeMo2O12 was an n-type semiconductor. For the n-type semiconductor, we assume that flatband potential was 0.1–0.3 V below conduction band.34 Here the conduction band was estimated at −0.5 V vs. Ag|AgCl. Along with estimated bandgap above, the band position of Bi3FeMo2O12 was shown in Figure 4c (potential vs. normal hydrogen electrode (NHE) at pH = 0); and the shallow states induced by the oxygen vacancy were formed below the conduction band. Standard redox potential of N2/NH3 was 0.55 V vs. NHE;8 and 1.23 V vs. NHE for H2O/O2 (Figure 4c). It can be seen that conduction band and the valence band of Bi3FeMo2O12 straddled the N2/NH3 and H2O/O2 redox potentials, enabling thermodynamically driving nitrogen reduction.
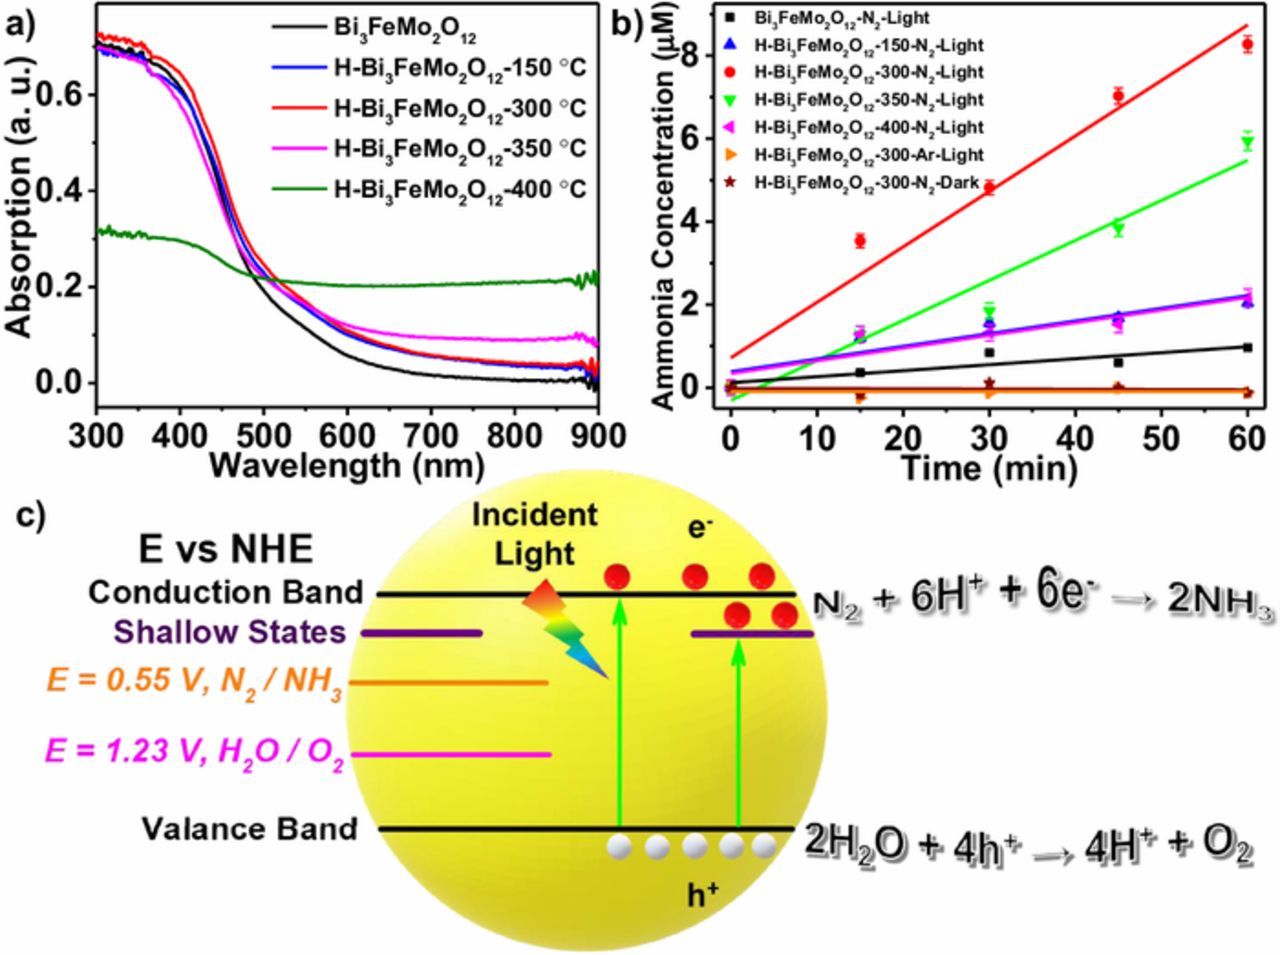
Figure 4. a) UV-Vis spectra of the as-synthesized Bi3FeMo2O12 and the hydrogen-treated Bi3FeMo2O12. b) Ammonia concentration quantifications of corresponding samples under different conditions. c) Band alignment of Bi3FeMo2O12 with oxygen vacancies induced shallow states and schematic of photocatalytic nitrogen fixation.
Figure 4b shows photocatalytic activity toward nitrogen fixation. The ammonia concentration was quantified by establishing a calibration curve of standard ammonium chloride solution through the indophenol blue method. H-Bi3FeMo2O12-300 exhibited the highest ammonia production rate of 80.16 μM·h−1 (0.5 g/L catalysts), which was about 9 times higher than that (8.68 μM·h−1) of the as-synthesized sample (0.5 g/L catalysts). Control experiments were conducted using hydrogen-treated Bi3FeMo2O12 in the argon-saturated solution under light illumination or in the nitrogen-saturated solution under dark. There was no obvious ammonia detected under both control conditions. This indicated that ammonia was produced only in the nitrogen-saturated solution under light illumination. Hydrogen-treatment was optimized at different temperatures, which resulted in different UV-Vis spectra and photocatalysis curves as shown in Figures 4a and 4b. With increasing temperature up to 300°C, the photocatalytic performance increased because more oxygen vacancies were formed. The ammonia production rate was 19.21 μM·h−1 for the H-Bi3FeMo2O12-150, and 80.16 μM·h−1 for the H-Bi3FeMo2O12-300°C sample (0.5 g/L catalysts), respectively. If further increasing temperature higher than 300°C, the photocatalysis performance gradually decreased. The ammonia production rate was 57.83 μM·h−1 for H-Bi3FeMo2O12-350 and 18.31 μM·h−1 for H-Bi3FeMo2O12-400, respectively. This was attributed to degradation of the sample under strong reducing hydrogen atmosphere at high (>300°C) temperature. Further evidence for the degradation can be seen from the reduced light absorbance of these samples in Figure 4a. The schematic of photocatalytic nitrogen fixation was shown in Figure 4c. When light illuminates to a photocatalyst sample, electrons in the valence band are excited to conduction band, leaving holes in the valence band. Holes diffuse to surface to drive the water oxidation reaction, which provides protons for nitrogen reduction, while electrons in conduction band move to the surface, reducing nitrogen to ammonia.
DFT calculations were conducted to reveal the possible mechanism of nitrogen reduction on Bi3FeMo2O12 (Figure 5). The calculations suggest that the photocatalyst in the absence of oxygen vacancy has the limiting step associated with reaction at Step 8 and 14 (Table I). Step 8 (associative pathway) and Step 14 (dissociative pathway) pertain to the breaking of the triple covalent N-N bond. Note that when any oxygen vacancy is introduced, the adsorbate species (N, H, NH, etc.) tend to better stabilize on the surface of the Bi3FeMo2O12 structure configuration, which is expressed in the reaction steps as consecutive negative reaction steps from one reaction to another. For the most part, the Bi3FeMo2O12 structure did not have great affinity toward N species, but when a low amount of oxygen vacancies is introduced, the Bi3FeMo2O12 structure favored N species to maintain the overall configuration stability, thus allowing the overall structure to account for the loss of oxygen vacancy. It is noted that the unit cell proved to lose stability for a high level of oxygen vacancy. Consistent with our experiment results, hydrogen treatment at higher temperature (>300°C), nitrogen fixation activity decreased, and the Bi3FeMo2O12 was chemically reduced during hydrogen treatment at higher temperature (>300°C). Also, introducing a low level of oxygen vacancy allowed both the associative and the dissociative pathways to better proceed with the reaction steps associated with nitrogen fixation. This is illustrated by the negative reaction steps for a low level of oxygen vacancy, which favors a spontaneous reaction. Note that theoretical calculations are used to demonstrate a trend in the overall calculation. Experimental results also suggest better activity toward nitrogen fixation as a low level of oxygen vacancies are introduced into the Bi3FeMo2O12 structure. The oxygen vacancy induced coordination unsaturated Mo atoms exposed on the surface, based on our results, Mo5+ formed on the surface as the active sites. The more oxygen vacancy formed on the surface, the more Mo5+ species exposed to the surface, leading to significantly increased activity.
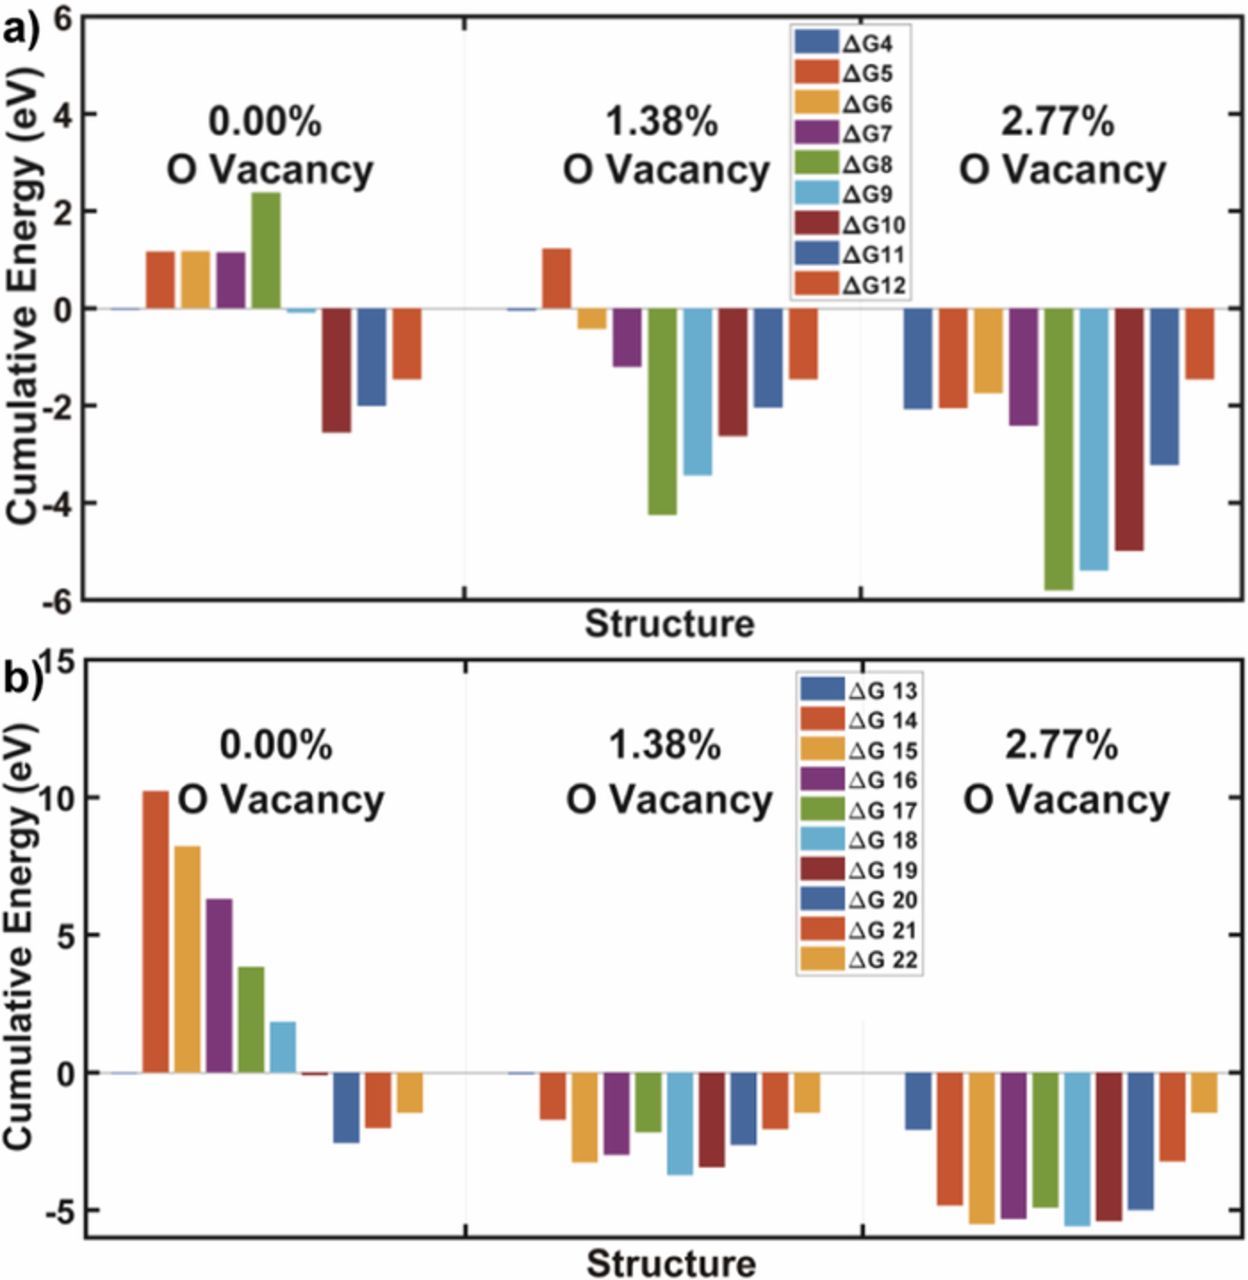
Figure 5. DFT-calculated cumulative energy of Bi3FeMo2O12 with different amount of oxygen vacancies. a) Associative and b) dissociative pathway. The detailed reaction pathways equations are shown in Table I.
Table I. Reaction pathways for DFT calculations.
| Overall Reaction: 2N2(g) + 6H2O↔4NH3(g) + 3O2(g) | (1) | ||
| N2(g) + 6H+ + 6e−↔2NH3(g) | (2) | 2H2O↔4H+ + O2(g) | (3) |
| Associative Pathway | Dissociative Pathway | ||
| N2(g) + 6(H+ + e−) + *↔N2* + 6(H+ + e−) | (4) | N2(g) + 6(H+ + e−) + *↔N2* + 6(H+ + e−) | (13) |
| N2* + 6(H+ + e−)↔N2H* + 5(H+ + e−) | (5) | N2* + 6(H+ + e−) + *↔2N* + 6(H+ + e−) | (14) |
| N2H* + 5(H+ + e−)↔N2H2* + 4(H+ + e−) | (6) | 2N* + 6(H+ + e−)↔NH* + N* + 5(H+ + e−) | (15) |
| N2H2* + 4(H+ + e−)↔N2H3* + 3(H+ + e−) | (7) | NH* + N* + 5(H+ + e−)↔NH2* + N* + 4(H+ + e−) | (16) |
| N2H3* + 3(H+ + e−) + *↔2NH2* + 2(H+ + e−) | (8) | NH2* + N* + 4(H+ + e−)↔NH3* + N* + 3(H+ + e−) | (17) |
| 2NH2* + 2(H+ + e−)↔NH3* + NH2* + (H+ + e−) | (9) | NH3* + N* + 3(H+ + e−)↔NH3* + NH* + 2(H+ + e−) | (18) |
| NH3* + NH2* + (H+ + e−)↔2NH3* | (10) | NH3* + NH* + 2(H+ + e−)↔NH3* + NH2* + (H+ + e−) | (19) |
| 2NH3*↔NH3* + NH3(g) + * | (11) | NH3* + NH2* + (H+ + e−)↔2NH3* | (20) |
| NH3* + NH3(g)↔2NH3(g) + * | (12) | 2NH3*↔NH3* + NH3(g) + * | (21) |
| ∗Represents for catalysts surface. | NH3(g) + NH3*↔ 2NH3(g) + * | (22) | |
Conclusions
In summary, this work demonstrated that Bi3FeMo2O12 nanoparticles can serve as visible-light photocatalysts for nitrogen fixation without use of a sacrificial agent. The oxygen vacancies induced by hydrogen-treatments resulted in the Mo5+ species, which can act as the active sites for nitrogen reduction. DFT calculation reveals that oxygen vacancy stabilized the adsorbates (N, H, NH, etc.) on Bi3FeMo2O12, and facilitated both the associative and the dissociative nitrogen reduction reaction pathways. The results may help understand and design new semiconductors photocatalyst for artificial nitrogen fixation.
Acknowledgments
B.L. is partially supported by the Postgraduate Research & Practice Innovation Program of Jiangsu Province (KYCX18_1119), China.
ORCID
Nianqiang Wu 0000-0002-8888-2444