Abstract
The Solid electrolyte interphase (SEI), either naturally formed or artificially designed, plays a critical role in the stability and durability of Li-ion batteries (LIBs). It is even more important for high energy density electrodes such as Li metal anodes, which is subjected to large volumetric and interfacial variations due to Li deposition/stripping cycles during operation. Currently, there is a lack of understanding of the role of SEI/Li interfaces and their mechanical and electrochemical properties. In this paper, we present an interfacial study to evaluate the two major SEI components, LiF and Li2CO3, based on density functional theory (DFT) calculations. The calculated interfacial energy results show that the Li2CO3/Li interface has higher interfacial mechanical strength. The density of states (DOS) and electrostatic potential results demonstrate that the LiF/Li interface has higher electron tunneling energy barrier from Li metal to SEI. These results provide quantitative inputs for related meso-scale simulations and valuable insights for advanced electrode protective coating design.
Export citation and abstract BibTeX RIS

This is an open access article distributed under the terms of the Creative Commons Attribution Non-Commercial No Derivatives 4.0 License (CC BY-NC-ND, http://creativecommons.org/licenses/by-nc-nd/4.0/), which permits non-commercial reuse, distribution, and reproduction in any medium, provided the original work is not changed in any way and is properly cited. For permission for commercial reuse, please email: oa@electrochem.org.
To achieve the practical application of reversible high energy density Li metal electrode (3860 mAh g−1) for future "beyond Li-ion batteries",1–3 one of the most significant challenges is to mitigate irreversible Li-dendrite formation.4–10 Dendrite formation is also often a concern for fast charging and low temperature operation in current Li-ion battery technology. Li dendrite formation and growth can be controlled by many factors. Intrinsically, dendrite morphology is determined by material properties, such as surface energy and growth anisotropy. However, it may also be influenced by other factors such as local current distribution11,12 (due to electrode surface roughness and compositional inhomogeneity, etc.), operation voltage and charging rate,13,14 as well as electrolyte composition.7,15
The dendrite growth process can also be strongly affected by the properties of solid electrolyte interphase (SEI), the passivation thin layer between electrolyte and electrode. Electrolyte solvents, such as ethylene carbonate (EC) and dimethyl carbonate (DMC) will naturally reduce and decompose at the low potential Li metal surface and spontaneously form an SEI layer.16 First proposed by Peled in 1970s,17 SEI remains "the most important but least understood"18,19 in rechargeable LIBs due to its complicated content that is highly dependent on numerous factors such as electrolytes and additives,20 electrode surface21,22 and operating conditions.23 Many recent efforts have been focused on using different electrolytes to alter the property of SEI or developing artificial coatings on the Li surface to mitigate dendrite growth. Therefore, it is important to understand how the SEI and coating properties may impact Li dendrite formation.
After decades of debates,4,17,24,25 there are some general agreements on the role of SEI in Li dendrites formation mechanisms (Figure 1). Since Li metal oxidizes instantly when in contact with electrolyte, the only two probable Li plating sites are inside SEI and at Li anode surface, which is further determined by two processes: electron tunneling from anode to SEI and Li ion diffusion from electrolyte to anode. In most LIBs, where the well formed SEI is insulating enough to block electron tunneling from anode and Li ion transport within SEI is fast, Li plating usually occurs at the anode/SEI interface. However, if the SEI is less insulating or Li ion diffusion is limited in SEI, e.g. at low temperature or higher local transport barriers, Li plating is more likely to take place inside the SEI layer. Compared with plating at anode surface, Li dendrite nuclei formed within SEI layer are far more detrimental because these Li metal nuclei lose direct contact with electrode and thus cause more inhomogeneous Li plating due to local charge distribution. These isolated Li dendrites within SEI may also potentially lead to SEI cracks and even delamination. Therefore, to mitigate Li plating within SEI, an ideal SEI should be an electronic insulator and a fast Li ion conductor. In addition, the mechanical property of SEI is also critical to the electrochemical performance of high energy density electrodes with large volumetric changes (∼100% in Li metal anode) during operation cycles. Zhang et al.26 recently successfully measured the SEI mechanical properties at Si electrode by the laser acoustic wave (LAW) method, revealing that stiffer SEI layer better protects the electrode and thus leads to higher Coulombic efficiency.

Figure 1. Schematic diagrams: (a-b) Li plating at Li metal LIB anode during discharge cycles at macroscale (c-d) Li dendrite nucleation and growth mechanisms at Li metal LIB anode during discharge cycles at microscale.
The property of SEI is closely correlated to its composition and structure. The generally accepted model of SEI consists of a porous organic (e.g. (CH2OCO2Li)2 and ROLi) outer layer near the electrolyte/SEI interface and a dense inorganic (Li2O, LiF, Li2CO3, etc.) inner layer near the electrode/SEI interface.27–32 This double-layer structure of SEI was confirmed by Lu et al.'s33 TOF-SIMS isotope experiments on SEI depth profiles. In a later study combining computation and experimental observations, first-principle calculation on Li2CO3 bulk by Shi et al.34 further proposed a two-layer/two-mechanism SEI diffusion model: pore diffusion in the outer layer and interstitial knock-off diffusion in the inner layer. They also demonstrated that the charge transfer "rate-determining step" (rds) in the LIB system is the Li ion transport in the dense inner layer of SEI. Therefore, in order to elucidate the transport related dendrite formation, it is important to understand the interface between the electrode (Li metal in this case) and the dense inorganic inner layer of SEI.
Due to the difficulty in experimental measurements in the micro scale of SEI, computational approaches have been widely utilized. First principle calculations based on density functional theory (DFT) method have played an important role in determining some critical properties of SEI components, although they are still limited to bulk crystalline and single component systems. Chen et al.35 calculated the electronic structures and Li migration energy barriers along major diffusion pathways of the three main components (Li2CO3, Li2O, LiF) of inner SEI layer from DFT bulk study. Pan et al.'s36 work on defect physics in LiF demonstrated that the defect formation and Li ion conduction through SEI components is very sensitive to the external potential of the electrode. For SEI/electrode interfacial study, Leung et al.37 combined constrained density functional theory (cDFT) and ab initio molecular dynamics (AIMD) to investigate the solvent decomposition at atomic layer deposition (ALD) α-Al2O3 coated Li metal electrode, elaborating that the electron transfer rate at the electrode surface is lowered due to the coating layer, and further confirmed that the ALD coating reduces electrolyte decomposition effectively. Panahian et al.38 developed a DFT method to study the interfacial properties of single layer crystalline LiF nanocluster grown on graphene surface, demonstrating the bilayer interfacial stability of different orientations and the electrostatic effects on the atomic structure of SEI layer in LIBs. Santosh et al.39 provided a first-principle method study on the point defect diffusion and electronic properties at Li/γ-Li3PO4 electrode-electrolyte interface in solid state LIBs, revealing that the high formation energy of Li ion defects leads to the low conductivity across the interface, which is further affected by both mechanical strain and impurities. Lepley et al.40 applied a DFT method to study the Li ion transport and interfacial properties of the two promising solid electrolyte materials, Li3PS4 and Li3PO4, reporting that the latter forms more stable idealized interface with Li metal. Although the real electrode/SEI interface is far more complex than the atomically flat interfaces formed between Li metal and crystalline Li2CO3/LiF, the simplified atomistic models39,40 can still provide valuable insights on transport and mechanical properties of the interface. To have a systematic understanding on the mechanical and electronic properties of SEI/Li metal interfaces is important not only for the Li metal anode, but also for other anodes prone to Li dendrites formation.
In this paper, we studied and compared the electrochemical and mechanical properties of two important interfaces, LiF/Li and Li2CO3/Li associated with SEI at a Li metal anode, by DFT method. The choice of these two systems is based on the fact that LiF and Li2CO3 are the two major components in the inner inorganic SEI layer and closely related to the overall properties of SEI. Supercells with incoherent sharp interfaces are carefully constructed based on interfacial orientations and in-plane misfit minimization. Then energetics of each interface (i.e. interfacial energy, strain energy and work of adhesion) were calculated for mechanical stability evaluation. The density of states (DOS) and electrostatic potentials profiles of each interface were also plotted for electrochemical analysis. This will shed some light on the electron transport from Li through the SEI component, thus help us understand where Li metal will nucleate (near the interface or inside the SEI). This work also aims to provide a straightforward and effective way to predict and evaluate the overall properties of the two major SEI components, LiF and Li2CO3, from interfacial studies.
Method
First-principles calculations
DFT calculations in this work were performed using Vienna Ab-initio Simulation Package (VASP)41,42 with plane wave basis sets and projector-augmented wave (PAW) pseudopotentials.43 The exchange-correlation (X-C) functionals were treated within the generalized gradient approximation (GGA) of Perdew-Burke-Ernzerhof44 revised for solids (PBEsol).45 Valence electron configurations for each element were as follows: 1s22s1 for Li, 2s22p2 for C, 2s22p4 for O, and 2s22p5 for F. The cutoff energy for the plane-wave basis was 500 eV, which was tested and applied for all supercells. Bulk and surface studies of each material were conducted prior to interface investigations. For the bulk structure optimization, Monkhorst-Pack k-points mesh was tested and set to 10 × 10 × 10, 4 × 8 × 6 and 12 × 12 × 12 for the conventional cells of Li (body-center cubic (b.c.c.), space group: Im m, No. 229), Li2CO3 (monoclinic, space group: C2/c, No. 15) and LiF (rocksalt structure, space group: Fm
 m, No. 225) respectively. Using slab method, the k-points samplings were reset for surface structure optimization, based on the geometry of each structure with one k-point in the surface normal direction and the same k-point number in-plane as in the bulk calculations. The total energy of each interface structure was converged to 10−4 eV/supercell, while 10−6 eV/supercell criterion was used for bulk and surface supercells. The Hellmann−Feynman force was converged to 0.02 eV/Å. Methfessel-Paxton smearing (order equals 1) was used for Li metal and Gaussian smearing was used for Li2CO3 and LiF, with a 0.2 eV energy broadening in all cases. For the interface structure with extended supercells in each phase, a 1 × 1 × 1 Monkhorst-Pack k-points mesh was used in the self-consistent calculations, whereas 3 × 3 × 3 Monkhorst-Pack k-points mesh was applied to obtain the density of states (DOS).
Interface supercell construction
We used several rules to build the periodic dense interfacial supercells. (i) Interfacial orientations: Based on the surface studies, orientations with the lower surface energy and similar in-plane lattice type were selected for Li, LiF and Li2CO3. (ii) Sufficient number of atomic layers of each phase (more than the minimum layer number for each surface energy to converge) was used along the selected directions, in order to minimize interactions between the two interfaces (total layer thickness larger than 10 Å for each phase). (iii) Symmetry: At least an inversion (P -1) symmetry should be included in the constructed interface structure to guarantee the equivalency of the two interfaces in one supercell and preclude dipole moment (computation efficiency purpose). (iv) Interfacial terminations: Only stoichiometric interfacial terminations were studied in this work. (v) Misfit: The artificially added in-plane strain to match the two parts in the interface structure should be less than 5%.
Surface energy calculation
The surface energy from slab method is the difference between the total energy of the relaxed slab structure and the bulk energy with the same number of atoms. The thickness of slab and vacuum layer is assumed to be large enough to neglect the interaction between the two surfaces of the slab (At least 10 Å vacuum layer was tested and added between slab surfaces in this calculation). The surface energy can be expressed as
![Equation ([1])](https://content.cld.iop.org/journals/1945-7111/163/3/A592/revision1/d0001.gif)
where ENSlab is the total energy of the relaxed slab containing N units, EBulk is the unit bulk total energy, S is the surface area, and the coefficient 2 indicates two equivalent surfaces in the supercell. To avoid error caused by EBulk calculation with different supercells and different k-point mesh from ENSlab, Fiorentini and Methfessel method46 was applied to obtain EBulk by linear fitting the slab supercell total energy data versus N and taking the slope of the straight line to reach the converged surface energy values efficiently with least atomic number of layers.
Interfacial energetics
The difference between the energy of the fully relaxed interface structure and the energy sum of the two stress-free pure phases with the same atomic unit numbers is defined as interface formation energy. For an interfacial supercell of constituents A and B, the interface formation energy, Ef, can be written as
![Equation ([2])](https://content.cld.iop.org/journals/1945-7111/163/3/A592/revision1/d0002.gif)
where EAB is the total energy of the fully relaxed interfacial supercell, containing NA units of A and NB units of B. EA and EB are the energy per unit of the stress-free pure A and B bulk structure, respectively. To form a coherent interface without any lattice mismatch dislocations, the lattice mismatch of A and B needs to be small. The formation of the AB interface can be separated into two steps: first A and B slabs needed to elastically deform to the common simulation cell length, then they joined and formed a coherent interface. Thus the interface formation energy is separated into strain energy and interfacial energy corresponding to the two steps, and expressed as
![Equation ([3])](https://content.cld.iop.org/journals/1945-7111/163/3/A592/revision1/d0003.gif)
where σ is the interfacial energy, V is the fully relaxed cell volume, and Eelastic is the elastic strain energy per unit volume. S is the interfacial area and the factor 2 in front of S is due to the two interfaces in one interfacial supercell. Eq. 3 will allow us to evaluate the contribution of the strain energy and compare the chemical contribution of forming an interface when different strain needs to be applied form interfaces of varying orientation and materials.
The following method47 was applied to separate the two energies. First, the constructed interface structures were fully relaxed (with respect to cell volume, shape and atomic coordinates) to their external stress-free states. Then, pure A and B bulk structures with the same interfacial geometry and similar atomic layer numbers, were relaxed along interface normal direction (z) respectively, with fixed strained in-plane (x and y) lattice vectors obtained from the fully relaxed interfacial geometry. Same k-point mesh and cutoff energy were used for the two steps. The interfacial energy can be then calculated by
![Equation ([4])](https://content.cld.iop.org/journals/1945-7111/163/3/A592/revision1/d0004.gif)
where EAB(xyz) is the fully-relaxed total energy of the interfacial structure. EA(z) and EB(z) are the energy per atomic layer of the pure A and B bulk structures after constrained relaxation along interface normal direction (z direction) with fixed x and y lattice vectors. NA and NB are the atomic layer numbers of A and B in the interfacial supercell, respectively. The elastic strain energy is then written as
![Equation ([5])](https://content.cld.iop.org/journals/1945-7111/163/3/A592/revision1/d0005.gif)
With all the calculation results, the work of adhesion of the interface can be expressed as
![Equation ([6])](https://content.cld.iop.org/journals/1945-7111/163/3/A592/revision1/d0006.gif)
where γA, γB and are the surface energies of A and B from unstrained slab method, respectively. σAB is the interfacial energy of A/B interface.
Results
Bulk and surface
The ground-state lattice constants of Li, Li2CO3 and LiF were calculated and tabulated with experimental values in Table I, as a check of the methodology. The equilibrium geometries of the three determined by energy optimization with respect to lattice parameters are in agreement with experimental measurement. The surface energy results and minimum atomic layer numbers needed to converge were listed together with available results from other computational and experimental works in Table II.
Table I. DFT calculated lattice constants for Li2CO3, LiF and Li with experimental references.49–51
| Lattice Constants | |||||||
|---|---|---|---|---|---|---|---|
| Material | Symmetry | a (Å) | b (Å) | c (Å) | α (°) | β (°) | γ (°) |
| Li2CO3 | C/2c | 8.355 | 4.991 | 6.139 | 90 | 114.543 | 90 |
| Li2CO3 (Exp.) | 8.359 | 4.974 | 6.194 | 90 | 114.789 | 90 | |
| LiF | Fm m m |
4.010 | - | - | 90 | - | - |
| LiF(Exp.) | 4.027 | - | - | 90 | - | - | |
| Li | Im m m |
3.437 | - | - | 90 | - | - |
| Li (Exp.) | 3.48 | - | - | 90 | - | - | |
Table II. DFT calculated low-indexes surface energies for Li2CO3, LiF and Li with experimental references.38,52–55
| Li2CO3 | LiF | Li | ||||||
|---|---|---|---|---|---|---|---|---|
| Material Orientations | (001) | ( 01) 01) |
(110) | (001) | (110) | (001) | (110) | (111) |
| Layer # to converge | 2 | 3 | 3 | 5 | 7 | 5 | 5 | 7 |
| Surface Energy (J/m2) | 0.18 | 0.30 | 0.59 | 0.36 | 0.84 | 0.48 | 0.51 | 0.56 |
| Other computation (J/m2) | 0.18 | 0.28 | 0.57 | 0.32 | 0.78 | 0.46 | 0.49 | 0.56 |
| Exp. (J/m2) | 0.353 | 0.472 | ||||||
The calculated surface energy values of the three materials, as listed in the table, are well matched with the available experimental measurements. The lowest surface energy is usually in the most close-packed directions with least number of daggling bonds. For b.c.c. Li metal, the three low-indexes surfaces, (001), (110) and (111), show close values of surface energies, with the lowest of 0.49 J/m2 along (001) direction.
For monoclinic Li2CO3, (001) orientation has the lowest surface energy of 0.18 J/m2, prominently smaller than the other two low-indexes surfaces, ( 01) and (110). For rocksalt-structured LiF, the (001) orientation has the lowest surface energy of 0.36 J/m2, almost two times smaller than (110) direction. The LiF (111) surface is not energetically favorable due to net dipole along surface normal direction produced by alternating stack of F-only and Li-only layers.
Interface
Based on the surface energy results and construction rules elaborated in the Method section, two LiF/Li and two Li2CO3/Li interfaces were built. The interface projection view in the interface normal direction of each matching counterparts are shown in Figure 2. Since Li is rather isotropic, the two lowest energy surfaces, (001) and (110), are both considered in the interface model. On the other hand, LiF and Li2CO3 are rather anisotropic, only the orientations with the lowest surface energy were considered. The super-lattice size of Li metal were selected to match the lowest energy surfaces, (001) of LiF and (001) of Li2CO3, respectively. Each surface was cleaved and expanded to match the counterpart, reducing the interfacial mismatches to ∼3% for all interface supercells, as listed in Table III.
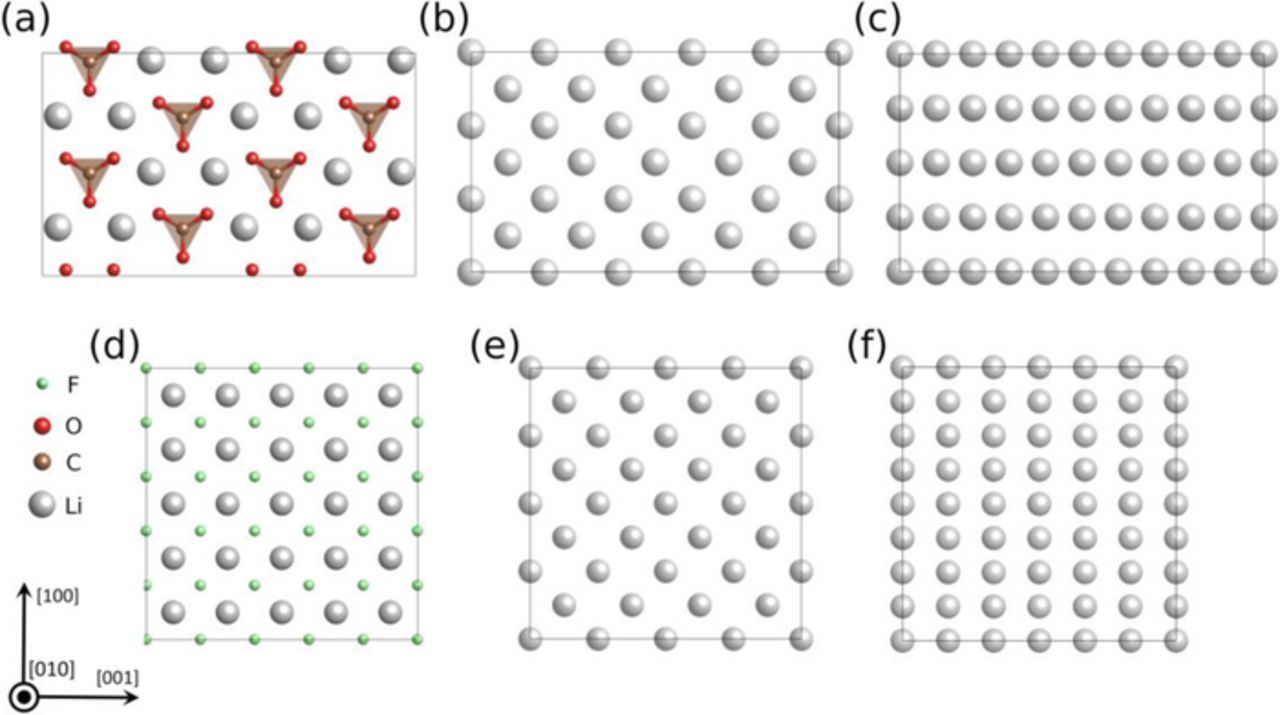
Figure 2. Top view of the atomic structures of each matching part in Li2CO3 (001)/Li interfaces: (a) 2 × 2 Li2CO3 (001), (b) 3 × 5 Li (001), (c) 2 × 5 Li (110), and each matching part in LiF (001)/Li interfaces: (d) 5 × 5 LiF (001), (e) 4 × 4 Li (001), (f) 3 × 4 Li (110), respectively.
Table III. Misfit along the two in-plane directions upon interface matching for each supercell.
| Interface | Li(001)/Li2CO3(001) | Li(110)/Li2CO3(001) | Li(001)/LiF(001) | Li(110)/LiF(001) |
|---|---|---|---|---|
| Matching | 3 × 5 / 2 × 2 | 2 × 5 / 2 × 2 | 4 × 4 / 5 × 5 | 3 × 4 / 5 × 5 |
| Misfit in [001] | 2.76% | 2.76% | 2.78% | 2.77% |
| Misfit in [010] | 3.20% | 2.67% | 2.78% | 2.78% |
The initial as-constructed and the final fully-relaxed interfacial supercells of Li(001)/Li2CO3(001) and Li(001)/LiF(001) and interfaces are shown in Figure 3. Compared with LiF/Li interfaces, the relaxed Li2CO3/Li interfaces underwent drastic structural changes, indicated by the large distortion in the CO3 groups near the interfacial region. By contrast, the relaxed LiF/Li interfaces experienced less lattice distortion, and instead, only slight atomic layer bending near interfacial region is observed. To further analyze the structural relaxation in Li/Li2CO3 interface, the angle between CO3 planar group and interface is defined as A(CO3-010) to characterize the structural relaxation. As shown in Figure 3, even A(CO3-010) in the same layer shows large variation due to the mismatch between Li lattice and Li2CO3 lattice. For example, in the interfacial supercell of Li(001)/Li2CO3(001), the A(CO3-010) in Layer 1 (interface) varies from 16.8° to 22.7°. In Layer 2, it converges to 20°, which is close to the value in bulk Li2CO3 (18.6°). In the interfacial supercell of Li(110)/Li2CO3(001), the divergence of A(CO3-010) is even larger. Even in the second layer, they still vary from 17.8° to 27.1°. This is quite different from what is observed in the model of Li2CO3 exposed to vacuum,48 where the A(CO3-010) is very close to its bulk value in the 2nd layer and the computed work function is converged when the Li2CO3 is more than 4 layers thick. The large distortion observed in the relaxed Li(001)/Li2CO3(001) structure is primarily due to the prominent difference in the lattice type of Li metal (b.c.c.) and Li2CO3 (monoclinic). When interfaced with cubic Li metal, the tilted CO3 tends to decrease the angle between the interface plane while still maintain the bulk-like structure, so that the total energy of the interface is minimized. The interface lattice mismatch in the model also causes more local structural variation in the interface model, and four layers of Li2CO3 may not be thick enough to recover the bulk structure in the middle of the slab yet.
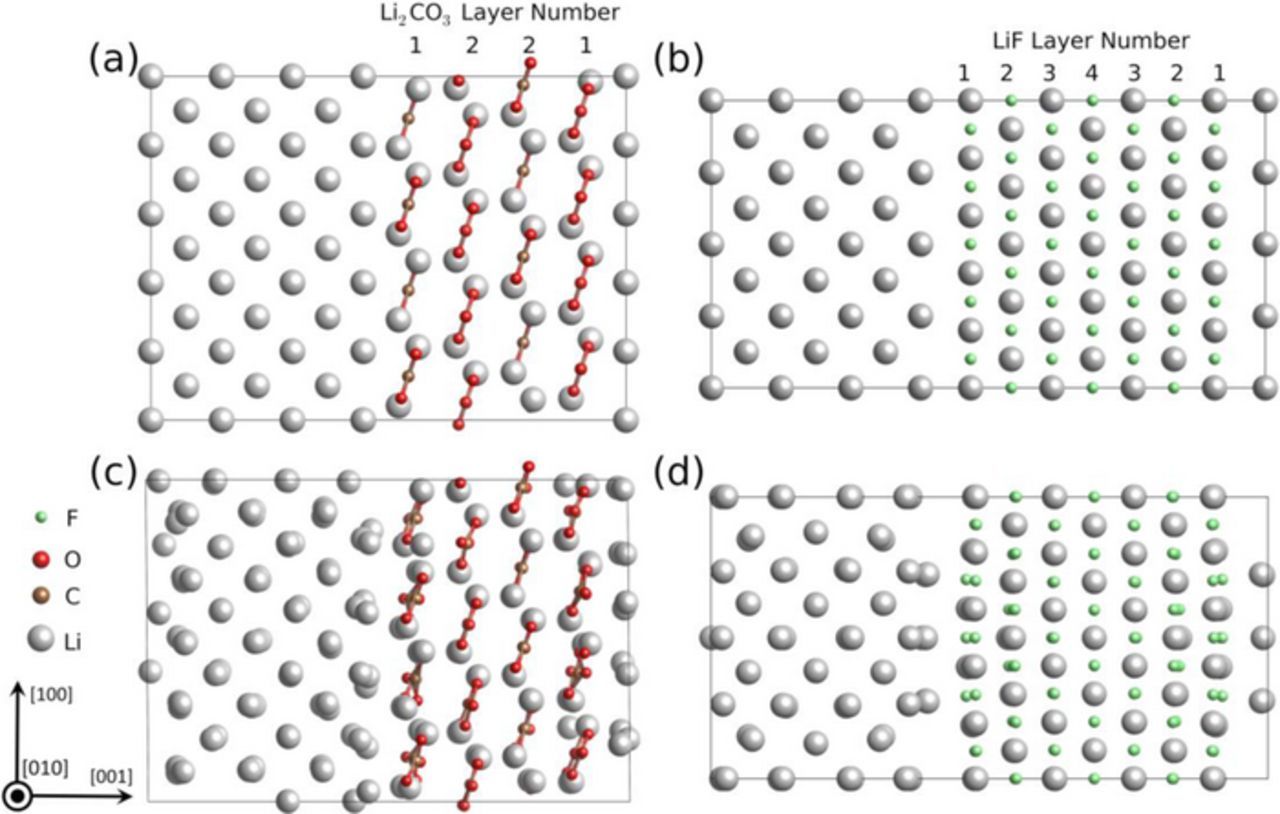
Figure 3. Atomic structures (with atomic layer labels) of the (a) as-constructed and (b) fully relaxed supercells of Li(001)/Li2CO3(001) interfaces, and the (c) as-constructed and (d) fully relaxed supercells of Li(001)/LiF(001) interface.
Energy calculation
The energetic calculation results of the four interfaces are tabulated in Table IV. Since the calculation results of elastic strain energies depend on how a supercell is constructed (interfacial misfit), the interfacial energy and work of adhesion results are used for the evaluation of interface mechanical stability. The work of adhesion is the energy cost to separate the two parts of the interface, and thus higher work of adhesion corresponds to better interfacial strength, and vice versa. The strain energy contributions to the total interface formation energy were also listed to further guarantee that each interface model was built reasonably with small elastic strain.
Table IV. DFT calculated energetics for different fully-relaxed interfacial supercells.
| Li(001)/Li2CO3(001) | Li(110)/Li2CO3(001) | Li(001)/LiF(001) | Li(110)/LiF(001) | |
|---|---|---|---|---|
| Formation Energy (10−18 J/simulation cell) | 1.836 | 1.926 | 3.103 | 3.267 |
| Interfacial Energy (J/m2) | 0.498 | 0.573 | 0.747 | 0.803 |
| Work of Adhesion (J/m2) | 0.167 | 0.124 | 0.093 | 0.065 |
| Strain Energy (mJ/m3) | 52.711 | 6.248 | 16.342 | 1.121 |
| Strain Energy Contribution (%) | 11.73 | 1.32 | 2.99 | 0.23 |
The work of adhesion of all four interfaces (0.065∼0.167 J/m2) are lower than the decohesion energy of the bulk materials, which is twice of the surface energy listed in Table III. This means under tension, interface delamination is likely to occur. From the Li (001) and (110) orientations, the former shows higher work of adhesion and lower interfacial energy values in contact with either LiF or Li2CO3. Since Li (110) and (001) have similar surface energy, the interfaces with Li (001) are more stable when they both exist and are covered by LiF or Li2CO3, while (110) surface may become exposed again due to delamination. Meanwhile, Li2CO3 interfaces show only half of the interfacial energy and almost twice of the work of adhesion of LiF for either Li (001) or (110). This indicates that Li2CO3 as a SEI component on Li metal anode is more mechanically stable covering Li metal surface than LiF, and that Li2CO3/Li interfaces are less likely to delaminate than LiF/Li interfaces. The lower interfacial energy and the higher work of adhesion of Li2CO3/Li interface are closely related to the total energy decrease from larger lattice distortion after relaxation as mentioned above.
Density of States
In order to understand the influence of interfacial band structure variation on electrochemical property, the projected density of states (PDOS) curves were calculated for each fully-relaxed interfacial supercell and split into the sums of different atomic layers in Li metal, Li2CO3 and LiF, respectively. The DOS curves of the two energetically-favored interfaces, Li(001)/LiF(001) and Li(001)/Li2CO3(001) are shown in Figure 4.
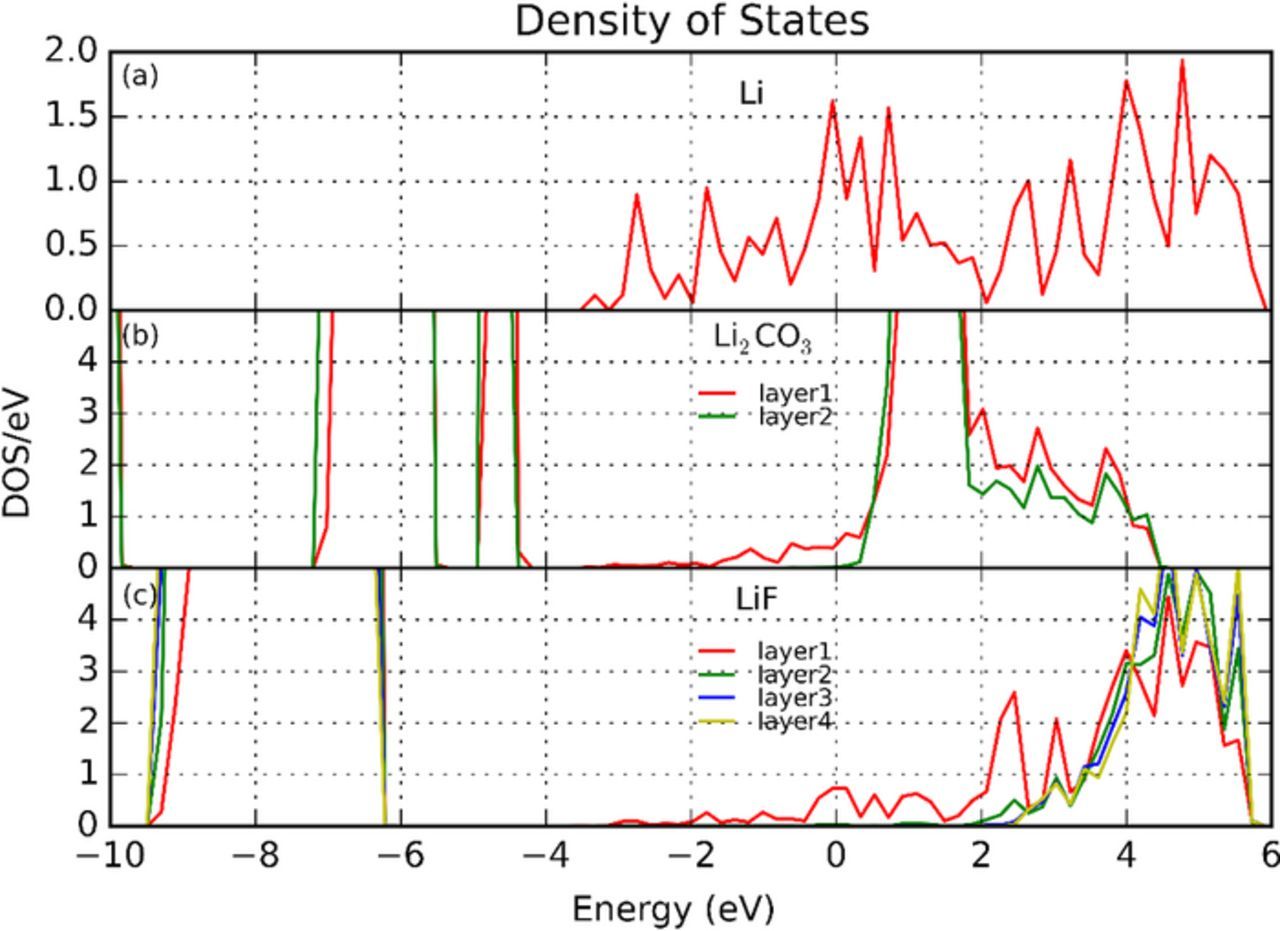
Figure 4. Density of states profiles by atomic layer with Fermi level at 0 eV: (a) mid-layer of Li metal in fully relaxed interfacial supercell, (b) layer 1 and layer 2 of Li2CO3 in fully-relaxed Li(001)/Li2CO3(001) interfacial supercell, and (c) layer 1 to layer 4 of LiF in fully-relaxed Li(001)/LiF(001) interfacial supercell.
The DOS curves were found similar for each Li metal layer, so only the mid-layer Li DOS are presented here. However, the DOS curves for each LiF and Li2CO3 layer varies prominently from interfacial layer to bulk-like inner layer (Figure 4). Meanwhile substantial band offset can be observed in DOS curves from layer 1 (interface) to layer 4 (bulk-like) in LiF, and Layer 1 (interface) to layer 2 (more bulk-like) in Li2CO3.
This mainly results from the coupling effect with the band structure of Li metal and the influence of atomic structure reconstruction as already shown in Figure 3. As demonstrated in the relaxed interface, large distortion occurred inside Li2CO3 near the interface, where CO3 layer tilted rather than staying planar. In comparison, the lattice distortion of LiF is much less. The electron tunneling barrier from Li to LiF or Li2CO3 can be read directly from DOS profiles by taking the difference of conduction band minimum (CBM) and Fermi level (0 eV). The electron tunneling barrier from Li to Li2CO3 (either layer 1 or layer 2) is close to 0 eV, which is much lower than the bandgap value in bulk, indicating that two atomic layers of Li2CO3 is not insulating enough to block electron from migrating from Li metal to Li2CO3. In contrast, the electron tunneling barrier from Li to LiF increases from 0 (layer 1) to 1.8 eV at layer 2, and reaches 2.6 eV at layer 4, suggesting that LiF is more effective in blocking electrons from Li anode to SEI. Despite the limit in computational size, it still can be concluded that given the same thickness, LiF is more electronically insulating than Li2CO3 in terms of confining electrons within Li metal and thus to mitigate Li dendrite nucleation inside SEI. However, it is also possible that a thickness of 4 layers of Li2CO3 is not enough to reach the bulk bandgap of Li2CO3. As analyzed in Figure 3, the planar CO3 groups are still tilted and have not converged to its bulk value in layer 2. Yet including more layers of Li2CO3 for the interface model is currently out of our computation limitation.
Electrostatic potential
In DFT calculations, the local potential, or local effective potential (Veff) is a sum of local electrostatic potential (Velst) and exchange correlation potential (Vxc), where the former includes ionic potential (Vion) and Hartree potential (VH). Therefore, the choice of exchange correlation potential has influence on the total local potential, but little impact on the electrostatic potential. The difference between planar averaged Velst and the Veff exists near the core positions. Thus, in this section, the planar averaged electrostatic potential (ESP) along the interface normal direction is studied for each fully-relaxed interfacial supercell.
The ESP curves of the two energetically-favored interfaces, Li(001)/LiF(001) and Li(001)/Li2CO3(001), are shown in Figure 5. Similar trends are observed in ESP curves for other interfaces. The potential curves oscillate within each phase while drop substantially at the interfacial region. Each valley of the curves can be treated as the approximated position of an atomic layer. The highest occupied electron level in each phase can be roughly estimated by taking the average of peak values. Therefore, the Fermi level difference between Li metal and 4-layer LiF is found much larger than 2-layer Li2CO3, indicating higher work function in LiF phase over Li2CO3 phase with respect to Li metal. This conclusion is in agreement with and supplementary to our DOS calculation results.
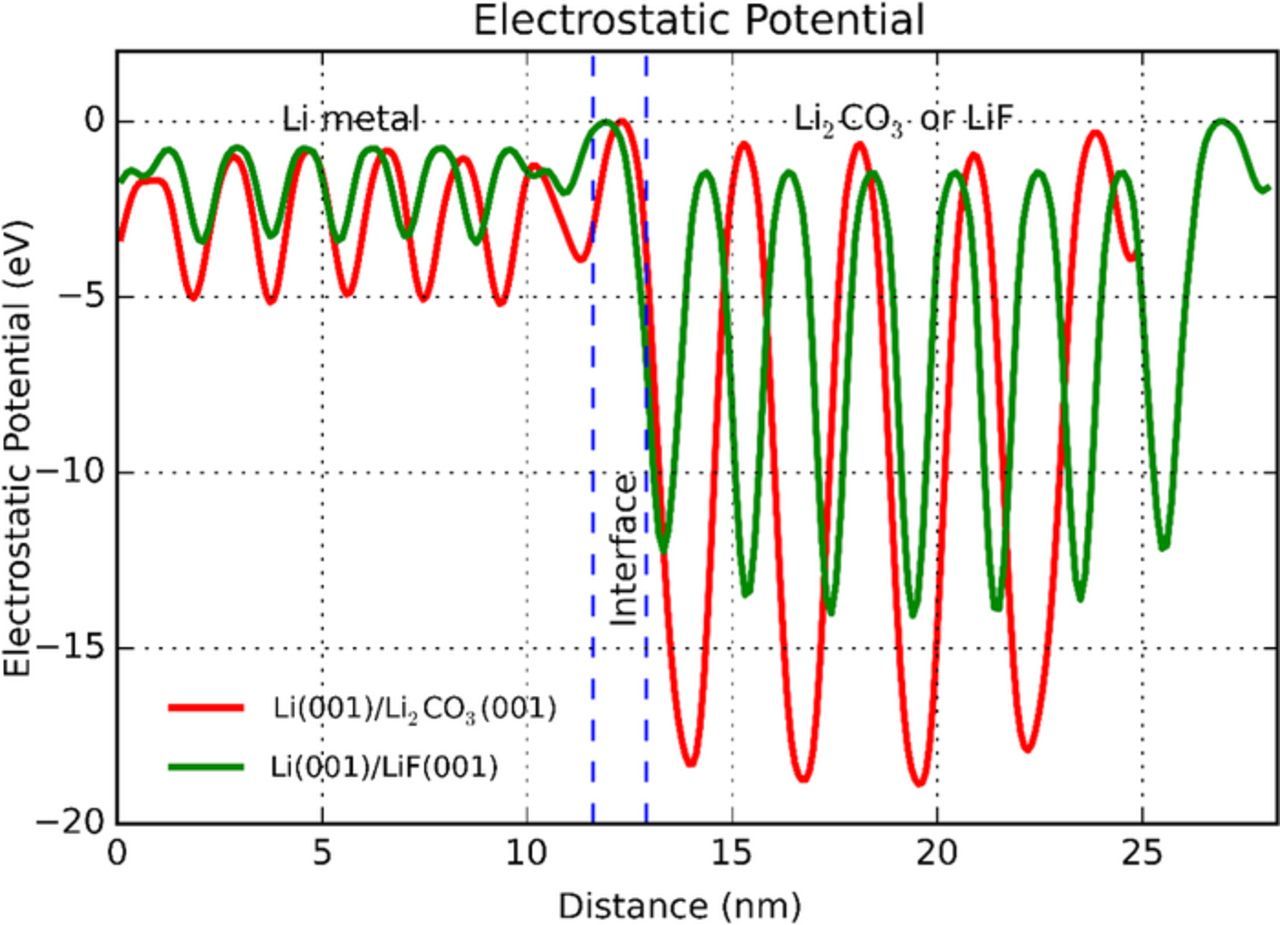
Figure 5. Electrostatic potential profiles of fully-relaxed Li(001)/LiF(001) and Li(001)/Li2CO3(001) interfaces with offset.
According to Figure 1, if the electrons are well blocked beneath the SEI layer, Li should continue to electrodeposit at the Li/SEI interface; otherwise it might form new Li metal nuclei inside the SEI, which is then undesirably isolated from the rest of electrode. Thus LiF may favor Li growth at the Li/SEI interface, while Li2CO3, if not sufficiently thick, may form isolated Li metal inside SEI layer. Further experiments to compare these two coating materials would provide more insights to elaborate the role of SEI coating on Li plating.
Conclusions
To understand the mechanical and electrochemical properties of the SEI/Li interface, interfacial supercells were constructed by matching the two important inorganic SEI components, LiF and Li2CO3, to Li metal, and studied from the DFT method. The calculated interfacial energy and work of adhesion of each interface show that Li(001) is the most energetically stable interfacial orientation and that Li2CO3 shows better interfacial mechanical stability than LiF in SEI. Further calculation on DOS and ESP of each interface provides the migration barriers of electrons from anode to SEI at each interface. Given either same atomic layer number or thickness, larger electron tunneling barrier was obtained for LiF/Li interface, denoting LiF having less electron tunneling probability than Li2CO3. Particularly, during charging cycles with limited Li ion transport from electrolyte to anode surface, undesirable Li dendrites are more likely to nucleate and grow within SEI at Li2CO3/Li than LiF/Li interfaces. Based on this DFT interfacial study, a map can be established by this method, linking SEI components to their mechanical and electrochemical properties, which can hardly be measured by state-of-art experimental techniques. Meanwhile, the energetic results obtained can be used as important inputs to other meso-scale simulations, e.g. Li dendrite and SEI phase evolution during LIB working cycles. More importantly, this study on SEI/Li metal interfaces provides valuable insights to the design of LIB electrode protective coating material, or artificial SEI layer.
Acknowledgment
The authors are grateful for the financial support by NSF GOALI under CMMI-1235092. The computer simulations were carried out on the LION clusters at the Pennsylvania State University.