Abstract
The effectiveness of three cyclic sulfate additives, ethylene sulfate (or 1,3,2-dioxathiolane-2,2-dioxide (DTD)), trimethylene sulfate (or 1,3,2-dioxathiane 2,2-dioxide (TMS)) and propylene sulfate (or 4-methyl-1,3,2-dioxathiolane-2,2-dioxide (PLS)) and one sulfonate additive, methylene methane disulfonate (1,5,2,4-dioxadithiane-2,2,4,4-tetraoxide (MMDS)) were studied in graphite/LiCoO2 (LCO) pouch cells. The additives were studied singly and in combination with 2% vinylene carbonate (VC) using high precision coulometry, AC impedance spectroscopy, volume change to infer gas evolution and open circuit storage experiments. During formation, TMS can significantly reduce the irreversible capacity and gas evolution while PLS and DTD cannot. When added alone, cells with DTD, TMS or PLS perform much worse than cells with 2% VC in all of coulombic efficiency, charge endpoint capacity slippage and voltage drop during storage. When combined with 2% VC, cells with TMS and VC provide similar performance to cells with 2% VC alone, cells with VC + MMDS are better and cells with VC + DTD and VC + PLS are worse. The trends found here are different from the results obtained using the same additives in graphite/Li[Ni1/3Mn1/3Co1/3]O2 (NMC) pouch cells where cells with VC + DTD and VC + MMDS were found to provide benefit compared to VC alone. It is hard to distinguish any difference between 2% VC and 2%VC + 1% TMS in both graphite/LCO cells and graphite/NMC cells, suggesting that TMS is nearly "inert" in the presence of VC in these cells.
Export citation and abstract BibTeX RIS

This is an open access article distributed under the terms of the Creative Commons Attribution 4.0 License (CC BY, http://creativecommons.org/licenses/by/4.0/), which permits unrestricted reuse of the work in any medium, provided the original work is properly cited.
Li-ion batteries have been extensively used in portable electronics, power tools and are now used in electrified vehicles and grid energy storage devices. However, parasitic reactions occurring in lithium-ion cells, such as electrolyte oxidation,1 electrolyte reduction,2 or transition metal dissolution,3 can shorten life-time and cause cell failure. Electrolyte additives have been widely used in Li-ion batteries. Electrolyte additives are believed to function by forming or modifying a solid electrolyte interface (SEI) layer on the surface of the positive or negative electrode thus impacting the cycle life, calendar life and safety of Li-ion batteries.4,5
Testing the effectiveness of an additive in a Li-ion cell under realistic conditions usually takes years and many battery manufactures or researchers usually adopt high rate cycling to evaluate the impact of additives in their cells.6–9 For example, Huang et al.8 tested an Ag additive in commercial Li/LiCoO2 coin cells using rates from 1C to 10C. Lalia et al.9 studied a binary mixture of triethylphosphate and ethylene carbonate as a non-flammable additive for ionic liquid-based electrolytes at discharge rates of 1C and 3C. Such accelerated testing methods can be misleading because large numbers of cycles can be collected in short periods of time which allows researchers to "beat the clock" on parasitic reactions that are slowly occurring in cells.10 Moreover, evaluating the impact of additives on the lifetime of a Li-ion cell should include the careful measurement of coulombic efficiency (CE). Factors including the formation, growth and repair of the solid electrolyte interphase, electrolyte oxidation, transition metal dissolution and damage to the positive electrode which impact the cycle life also impact CE.11 Our group has developed advanced diagnostics, including high precision coulometry (HPC)11,12 and ultra high precision coulometry,13 automated storage,14 electrochemical impedance spectroscopy on symmetric cells15,16 and measurements of gas evolution17,18 to investigate the impact of electrolyte additives on cell lifetime. Through these combined methods, Wang et al.19 screened over 110 additive sets and introduced a "Figure of Merit" approach to evaluate the overall effectiveness of additive blends in graphite/Li[Ni1/3Mn1/3Co1/3]O2 (NMC111) pouch cells. Reference 19 shows that cells with the most attractive "Figure of Merit" normally have the longest lifetime. Using the same method, Xia et al. have confirmed the benefits of sulfur-containing electrolyte additives including 1,5,2,4-dioxadithiane-2,2,4,4-tetraoxide – also called methylene methane disulfonate (MMDS),20,21 1,3,2-dioxathiolane-2,2-dioxide – also called ethylene sulfate (DTD),22 1,3,2-Dioxathiane 2,2-dioxide – also called trimethylene sulfate (TMS),22 ethylene sulfite (ES)18 and prop-1-ene-1,3-sultone (PES)23 in graphite/NMC111 Li-ion cells. However, it was not reported whether these sulfur-containing additives show a similar impact in graphite/LiCoO2 (graphite/LCO) pouch-type Li-ion cells.
Of course, it is important to know the mechanisms by which these sulfur containing additives function when used alone or in combination with other additives. It is extremely important that readers appreciate the complexity of determining how several additives function together. As an example, using gas chromatography/mass spectroscopy (GC−MS) and X-ray photoelectron spectroscopy (XPS) studies on electrodes from graphite/NMC111 cells, Madec et al.24 found TMS-containing electrolyte creates a similar negative electrode SEI composition to that of control electrolyte. They also showed that TMS+VC gave a similar SEI to electrolytes with VC alone, suggesting that TMS should have a minimal impact on the lifetime on graphite/NMC cells. Madec et al. also studied the surface films in cells containing DTD and DTD + VC, where DTD was shown to be beneficial for cell lifetime compared to cells with only control electrolyte. The XPS results showed that the SEI films formed in the presence of DTD had a much lower fraction of inorganic compounds arising from the degradation of the LiPF6 salt and a higher fraction of organic species that presumably leads to improved lifetime. Even in the presence of comprehensive surface science measurements, it was still not possible to have an atomic scale understanding of how additives act. In this paper, as in the papers that preceded19,20 the study by Madec et al.,24 studies of the impact of sulfur-containing additives on the performance of graphite/LCO cells will be made and detailed surface science studies will be subject of future work.
In this paper, the three cyclic sulfates DTD, TMS and PLS as well as the sulfonate additive, MMDS, were studied as electrolyte additives in graphite/LCO pouch-type Li-ion cells using the same diagnostics introduced in Ref. 22. The structures of these three molecules are shown in Figure 1. The impact of these sulfate and sulfonate additives on both graphite/LCO and graphite/NMC pouch type cells is compared and discussed.
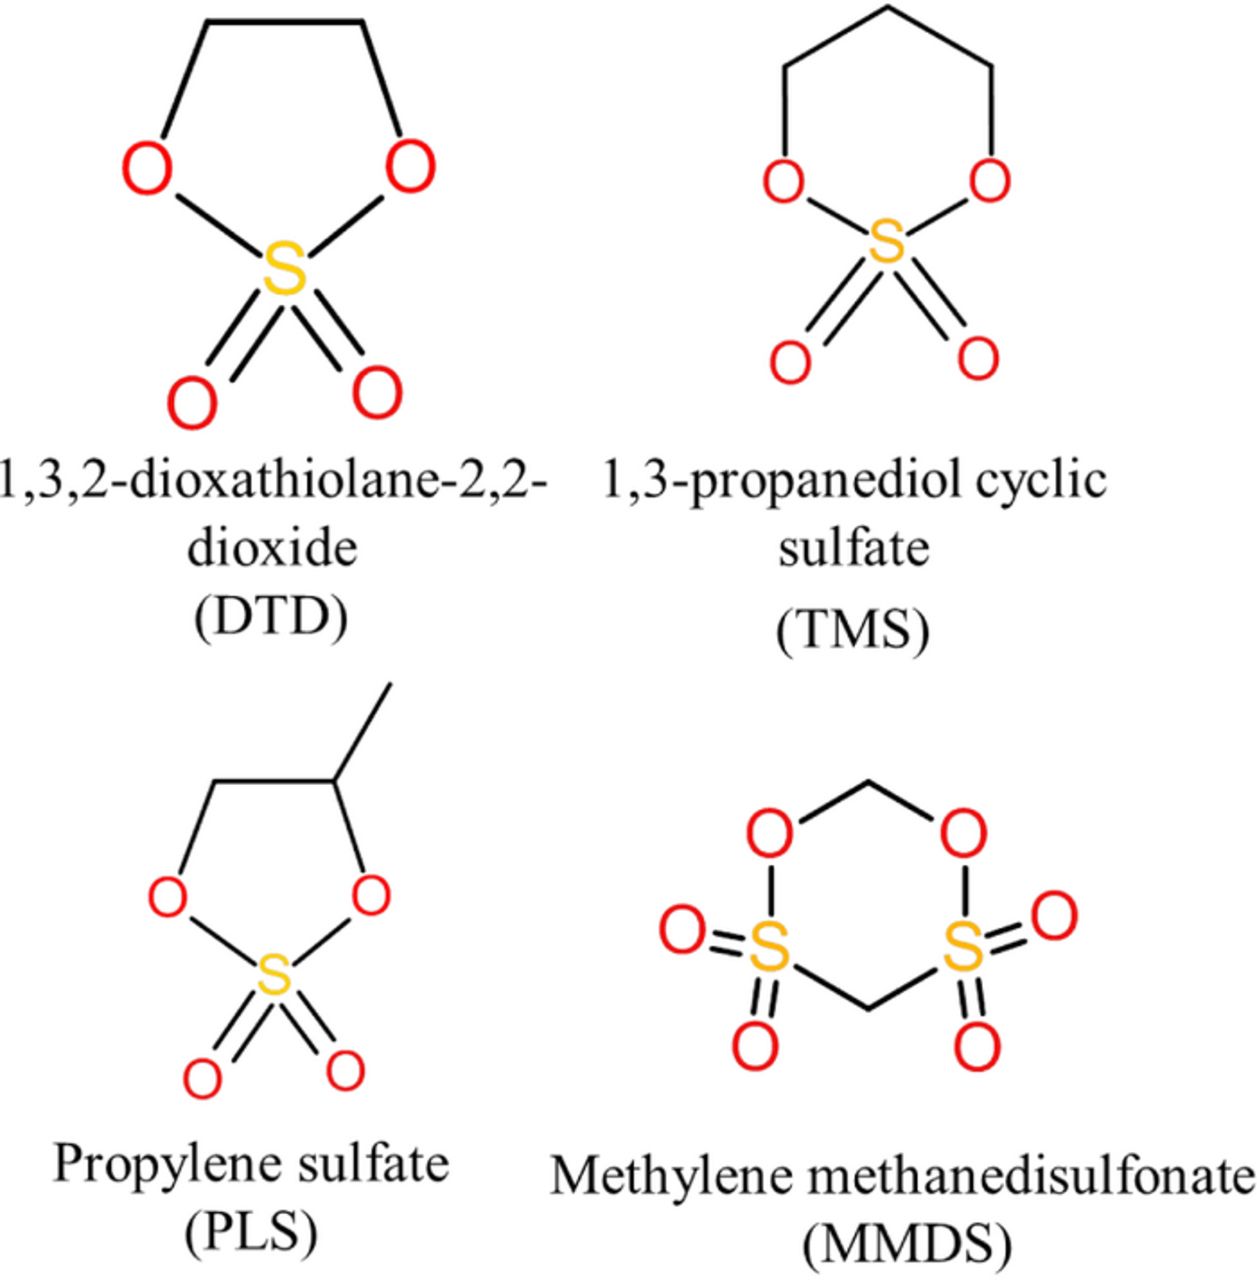
Figure 1. Molecular formula and structural information of DTD, TMS and PLS.
Experimental
1 M LiPF6 EC/EMC (3:7 wt.% ratio, BASF) was used as the control electrolyte in the studies reported here. To this electrolyte, the additives vinylene carbonate (VC, BASF, 99.97%), 1,3,2-dioxathiolane-2,2-dioxide (DTD, Aldrich, 98%), 1,3,2-Dioxathiane 2,2-dioxide (TMS, Aldrich 98%), 4-methyl-1,3,2-dioxathiolane-2,2-dioxide (PLS, Aldrich 99%)) or 1,5,2,4-dioxadithiane-2,2,4,4-tetraoxide (MMDS, Guangzhou Tinci Co. Ltd, 98.70%) were added either singly or in combination with VC. Additive components were added at 1, 2 or 3% level by weight in the electrolyte.
Dry graphite/LCO pouch cells (323036 size, 320 mAh) were obtained from BAK Co. (Shenzhen, China). Figure 2 shows the top surface of the graphite and LCO electrodes so that the reader can appreciate the particles that make up these electrodes. The pouch cells were vacuum sealed without electrolyte in China and then shipped to our laboratory in Canada. Before electrolyte filling, the cells were cut just below the heat seal and dried at 80°C under vacuum for 14 h to remove any residual water. The cells were then transferred immediately to an argon-filled glove box for filling and vacuum sealing. The graphite/LCO pouch cells were filled with 1.05 g of electrolyte (∼ 0.9 mL). After filling, cells were vacuum-sealed with a compact vacuum sealer (MTI Corp.) at a gauge pressure of −85 kPa (relative to atmospheric pressure). Centrifugal wetting under 50 gravity acceleration for 20 minutes was used to speed the wetting process. Cells were then placed in a temperature box at 40°C where they were held at 1.5 V for 24 hours, to allow for the completion of wetting, before charging at 2 mA for 10 hours followed by 15 mA to 4.2 V. Cells were then discharged at 20 mA to 2.8 V and then charged to 3.8 V. After formation, cells were transferred and moved into the glove box, cut open to release gas generated during formation and then vacuum sealed again. After degassing, impedance spectra of the cells were measured at 3.8 V as described later below. Some graphite/NMC cells, procured, wetted and used as described in Ref. 22 were also studied for comparative purposes.
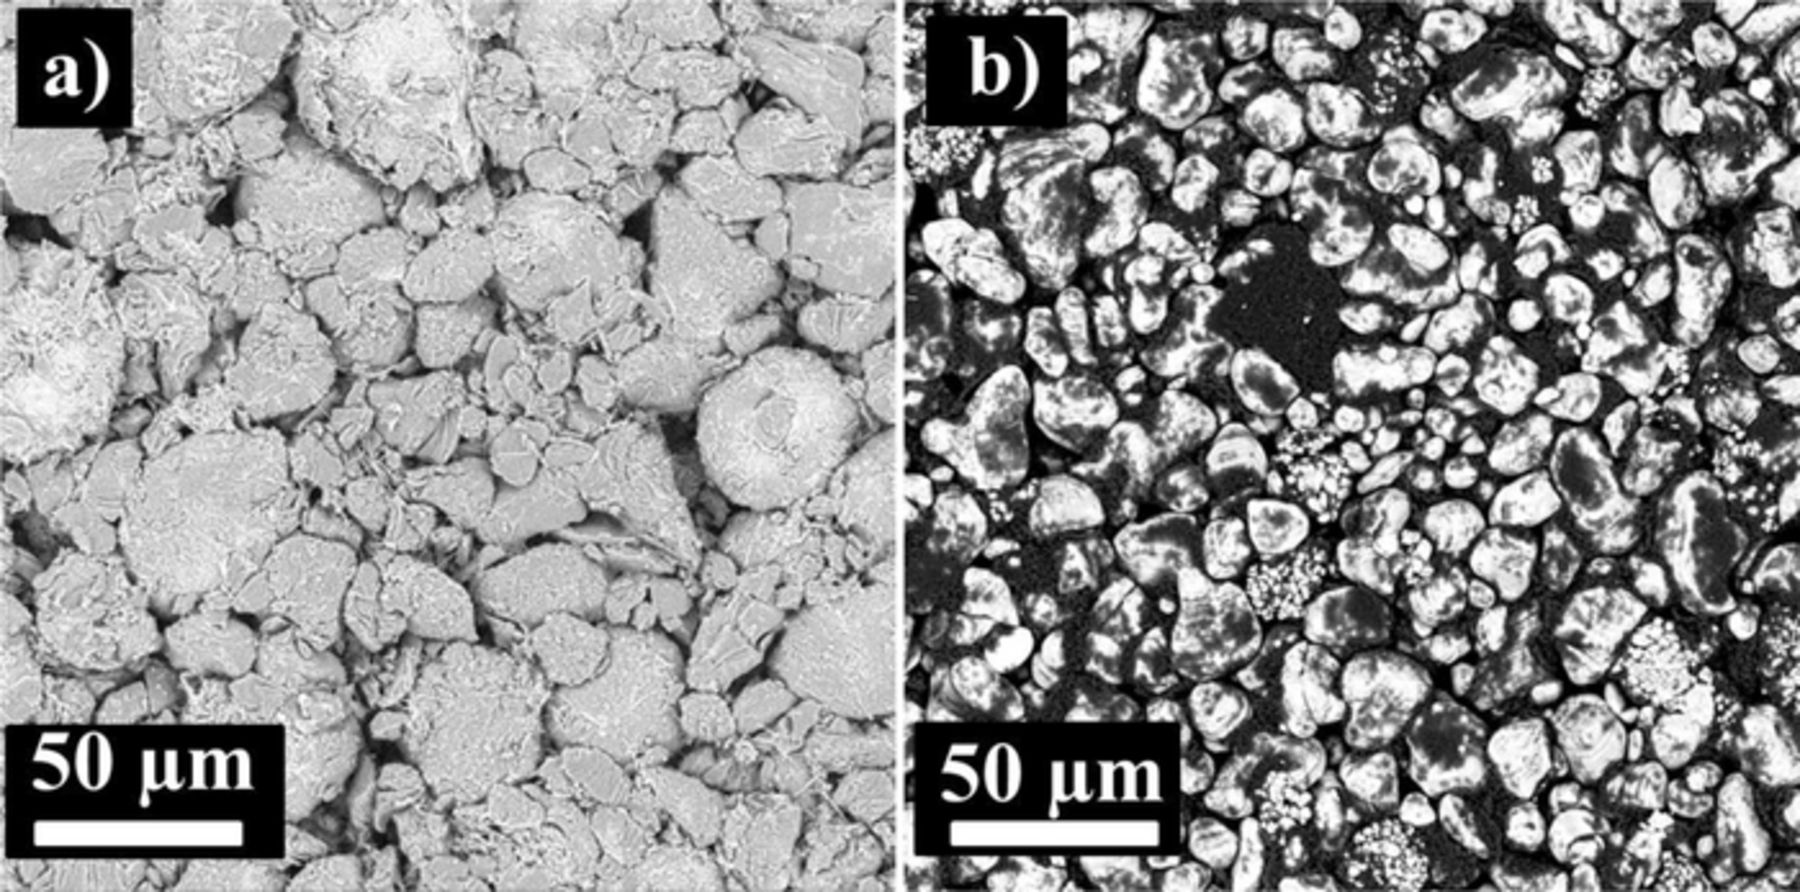
Figure 2. SEM images that show the top surface of the graphite electrode a) and the LCO electrode b) taken from a dry never-used pouch cell.
The cells were cycled using the Ultra High Precision Charger (UHPC) at Dalhousie University between 2.8 and 4.2 V at 40.0 ± 0.1°C using currents corresponding to C/15 for 15 cycles where comparisons were made. For storage, cells were first charged to 4.2 V, discharged to 2.8 V and recharged to 4.2 V at a current of C/15 (20 mA) and then held at 4.2 V until the measured current decreased to 0.0025 C.25 After the pre-cycling process, cells were carefully moved to the storage system which monitored their open circuit voltage every 6 hours for a total storage time of 500 h.
Both in-situ (dynamic) and ex-situ (static) gas measurements were used to measure gas evolution during formation and during cycling.17 Both measurements were made using Archimedes' principle with cells suspended from a balance while submerged in liquid. The changes in the weight of the cell suspended in fluid, before, during and after testing are directly related to the volume changes by the change in the buoyant force. The change in mass of a cell, Δm, suspended in a fluid of density, ρ, is related to the change in cell volume, Δv, by
![Equation ([1])](https://content.cld.iop.org/journals/1945-7111/162/12/A2227/revision1/jes_162_12_A2227eqn1.jpg)
Ex-situ measurements were made by suspending pouch cells from a fine wire "hook" attached under a Shimadzu balance (AUW200D). The pouch cells were immersed in a beaker of de-ionized "nanopure" water (18 MΩ) that was at 20 ± 1°C for measurement. Before weighing, all cells were charged or discharged to 3.80 V. In-situ measurements were made using the apparatus and procedure described in Reference 17. This apparatus can measure the gas evolution in up to five pouch cells simultaneously during operation. During the in-situ measurements, the cells were suspended in silicone vacuum pump oil and their mass was measured using sensitive strain gauges (or load cells) while they were charged and discharged. All in-situ gas volume measurements were made in a temperature box at 40. ± 0.1°C.
Electrochemical impedance spectra were measured using a BioLogic VMP3 equipped with 2 EIS boards.16 In order to automate the process of scanning, the output of one VMP3 EIS board was connected to a Keithley 705 scanner and the output of the other to a Keithley 706 scanner. Each scanner housed two Keithley 7053 10-channel high current scanner cards. In-house software was designed and written so that each scanner could connect up to 16 cells sequentially to have their EIS spectra measured automatically overnight. All impedance spectra were collected at constant temperature by housing the cells in temperature-controlled boxes at 10. ± 0.1°C. All impedance measurements were done using a 10.0 mV input signal from 100. kHz to 100. mHz.
Results and Discussion
Figure 3 shows the differential capacity (dQ/dV) vs. V curves of graphite/LCO pouch cells with different concentrations of VC, DTD, TMS and PLS during the formation cycle. The peaks in (dQ/dV) vs. V curves can help to determine at which potential the additives initially react with the partially lithiated graphite. Figure 3a shows that control cells have a peak at about 2.9 V while cells containing only VC have a pronounced peak at about 2.8 V. Figure 3a shows that cells containing only DTD have a peak at 2.70 V. When VC is added together with DTD, the peak located at 2.70 V, which apparently corresponds to the reduction of DTD, shifts to a slightly higher potential. Figure 3b shows that cells containing only TMS have a peak near a potential of 2.9 V. Figure 3b shows that when VC is added together with TMS, there is a main peak near 2.9 V which appears related to TMS, not to VC. Figure 3c shows that cells containing only PLS have two main peaks at cell potentials of about 2.4 V and about 2.85 V. Figure 3c shows that when VC is added together with PLS, the 2.40 V peak remains while the 2.85 V peak splits into two peaks. Compared to the graphite/NMC pouch cells in Ref. 22, the graphite/LCO pouch cells show similarities in their dQ/dV vs. V features. In both cell types, DTD and PLS are reduced before VC while it appears TMS is reduced after or simultaneously with VC. In both types of pouch cells, PLS has the highest reduction potential vs. Li/Li+, followed by DTD, while TMS shows the lowest reduction potential vs. Li/Li+.
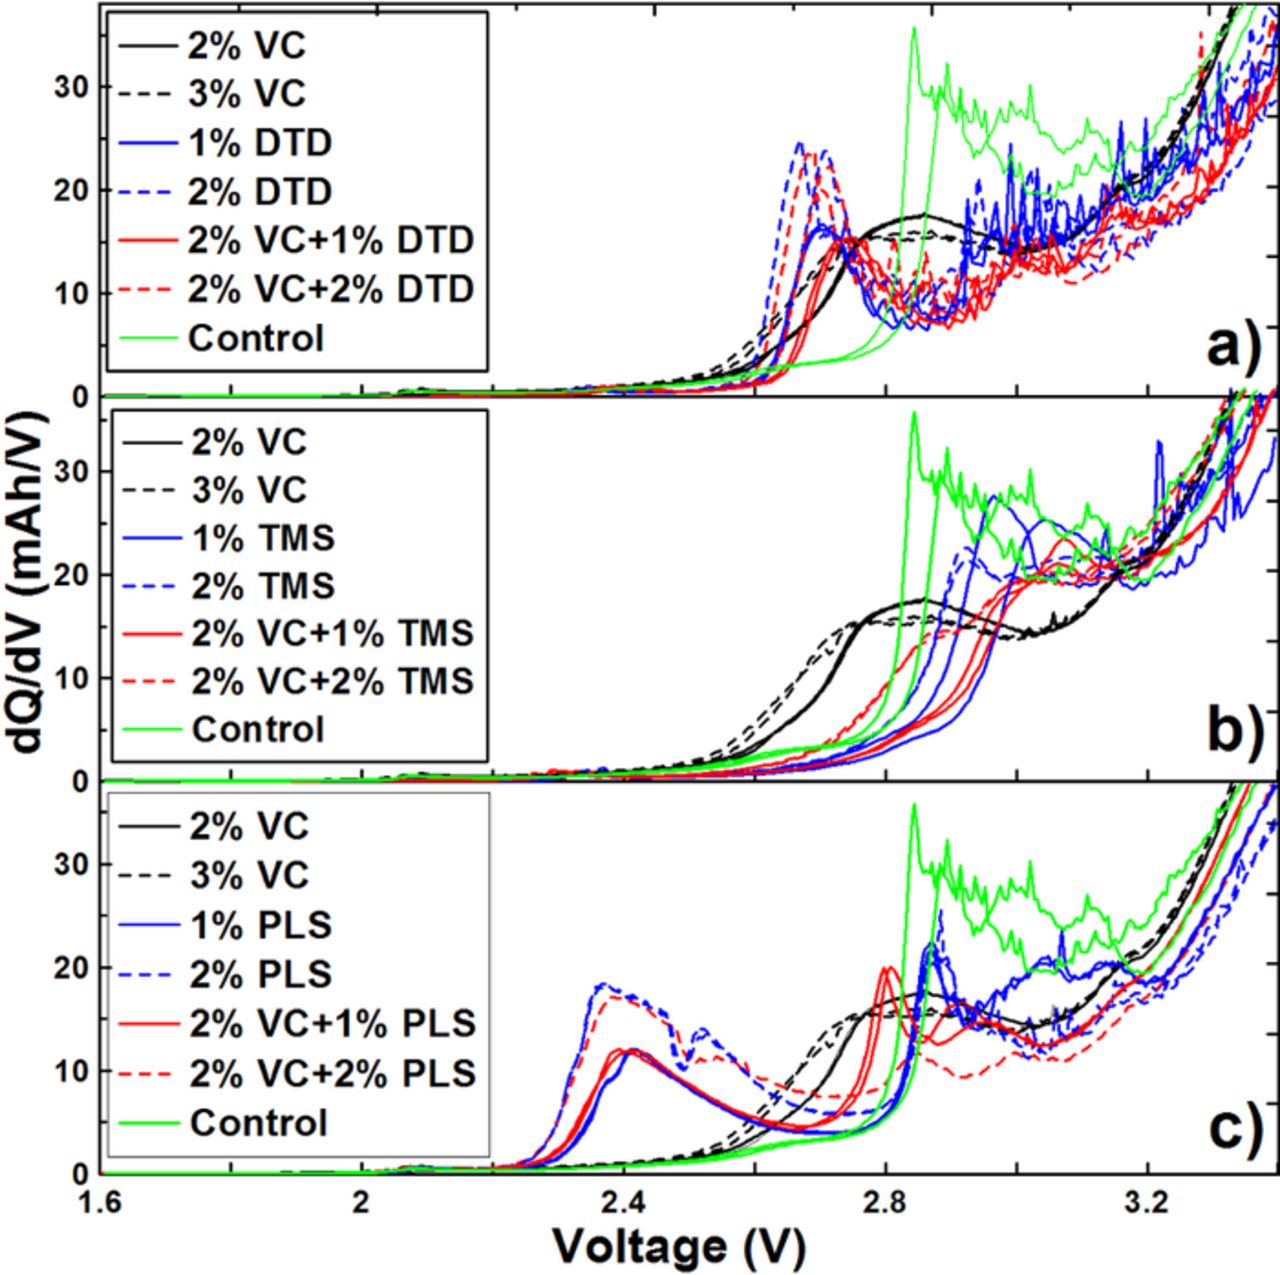
Figure 3. Differential capacity (dQ/dV) versus voltage (V) during the early stages of formation for the graphite/LCO pouch cells with different concentrations of VC, DTD (panel a), TMS (Panel b) and PLS (panel c) as indicated in the legends.
Figure 4a shows the fraction of irreversible capacity (IRC) during the formation cycle of graphite/LCO pouch cells with different concentrations of VC, DTD, TMS or PLS at 40.0 ± 0.1°C. Each data point in Figure 4a represents the average of two cells and the error bars are the standard deviation of the results. Figure 4a shows the addition of DTD or PLS increases the IRC compared to control cells while adding TMS decreases the IRC (Note that TMS did not reduce the IRC in the graphite/NMC cells of Ref. 22). Figure 4b shows the volume of gas produced during the formation process for the same graphite/LCO cells at 40.0 ± 0.1°C using the ex-situ Archimedes method. The gas evolution results in Figure 4b follow the same trend as the IRC results in Figure 4a. That is, DTD or PLS increase the gas evolution while TMS decreases the gas evolution (Note that TMS did not reduce gas evolution in the graphite/NMC cells of Ref. 22). VC acts as a gas reducing agent in TMS or PLS-containing cells during formation. This benefit does not appear in DTD-containing cells, which is different from the results found for graphite/NMC cells in Ref. 22.
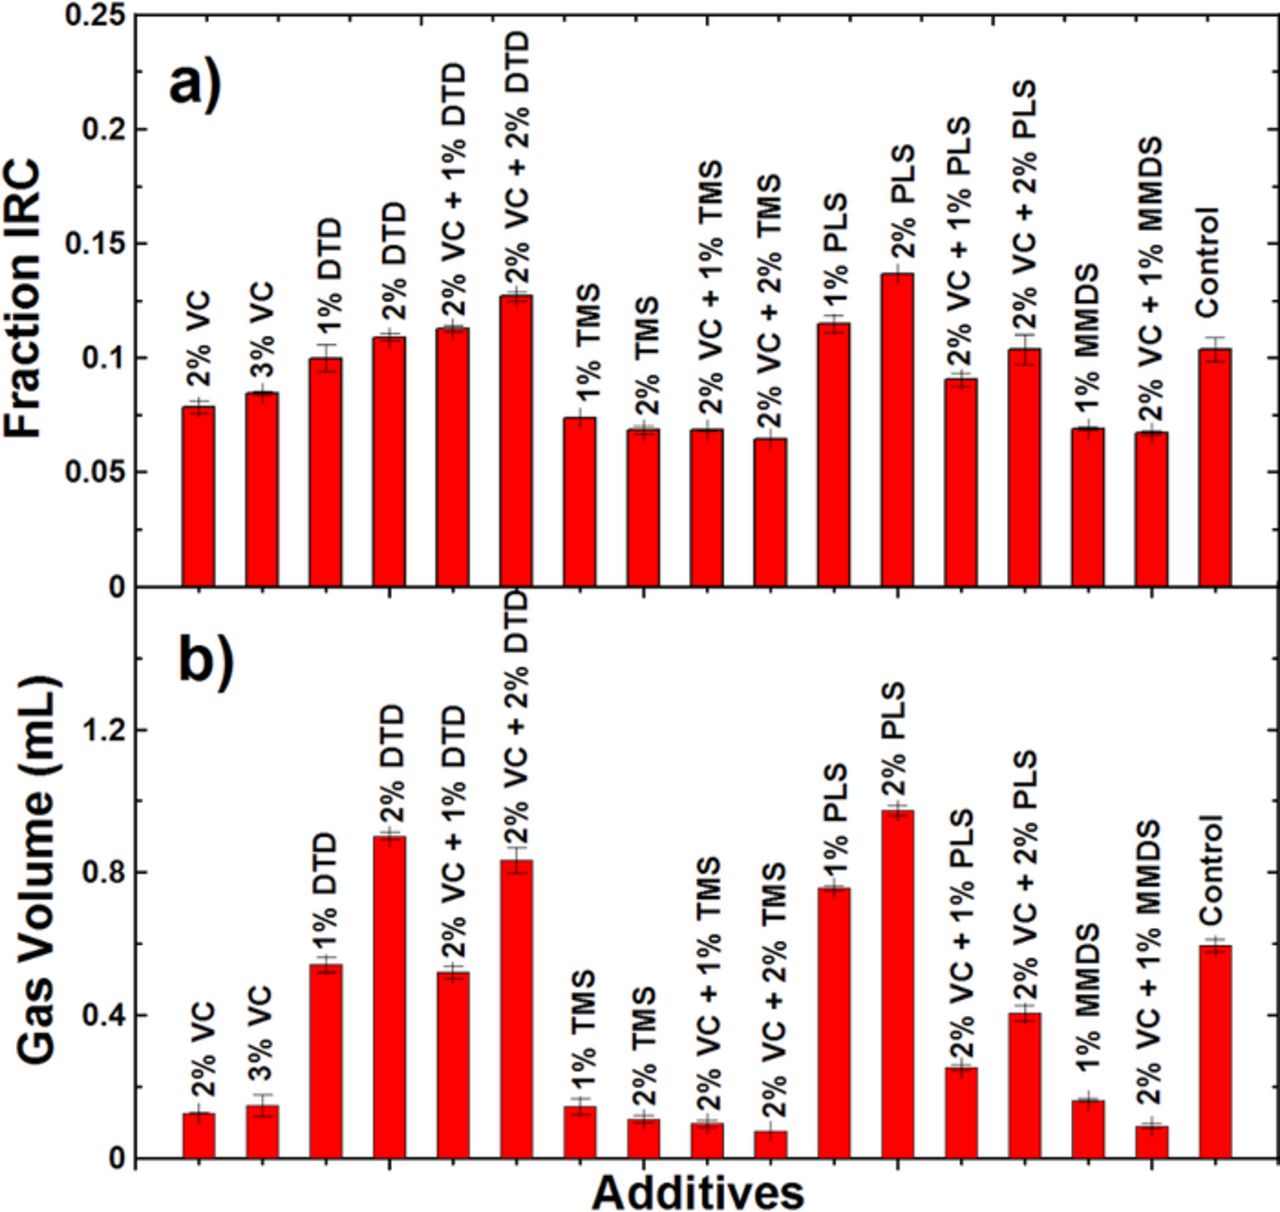
Figure 4. a) Fraction of irreversible capacity for graphite/LCO pouch cells during the formation cycle for the electrolyte additives listed. Each bar represents the average of data collected for 2 cells and the error bars represent the standard deviation of the data.
The impact of TMS on gas evolution during formation was further investigated using the in-situ gas measurements.17 Figures 5a and 5b show the gas evolved during formation in graphite/LCO pouch cells and graphite/NMC pouch cells containing control, 2%VC, 2%TMS or 2% VC + 2%TMS using the in-situ Archimedes method. Figures 5c and 5d show the cell voltage versus time measured during in-situ gas measurements of same cells in Figures 5a and 5b. Figures 5a and 5b show that the gas evolution was mostly produced at the very beginning of the formation cycle below 3.5 V in both graphite/LCO and graphite/NMC pouch cells. The addition of 2% VC to either control cells or cells with 2% TMS led to a large reduction in gas production. When 2% TMS was added to graphite/LCO cells or graphite/NMC cells with or without 2%VC, there was little change to the gas evolution within the error of the measurements. This suggests that TMS is not involved in production of the SEI layer on the graphite electrode in agreement with XPS studies.24 There was consumption of gas that occurred in all cells after gas was generated, which differed between the cell types and the additives used. The reasons for this difference are unknown and are beyond the scope of this paper.
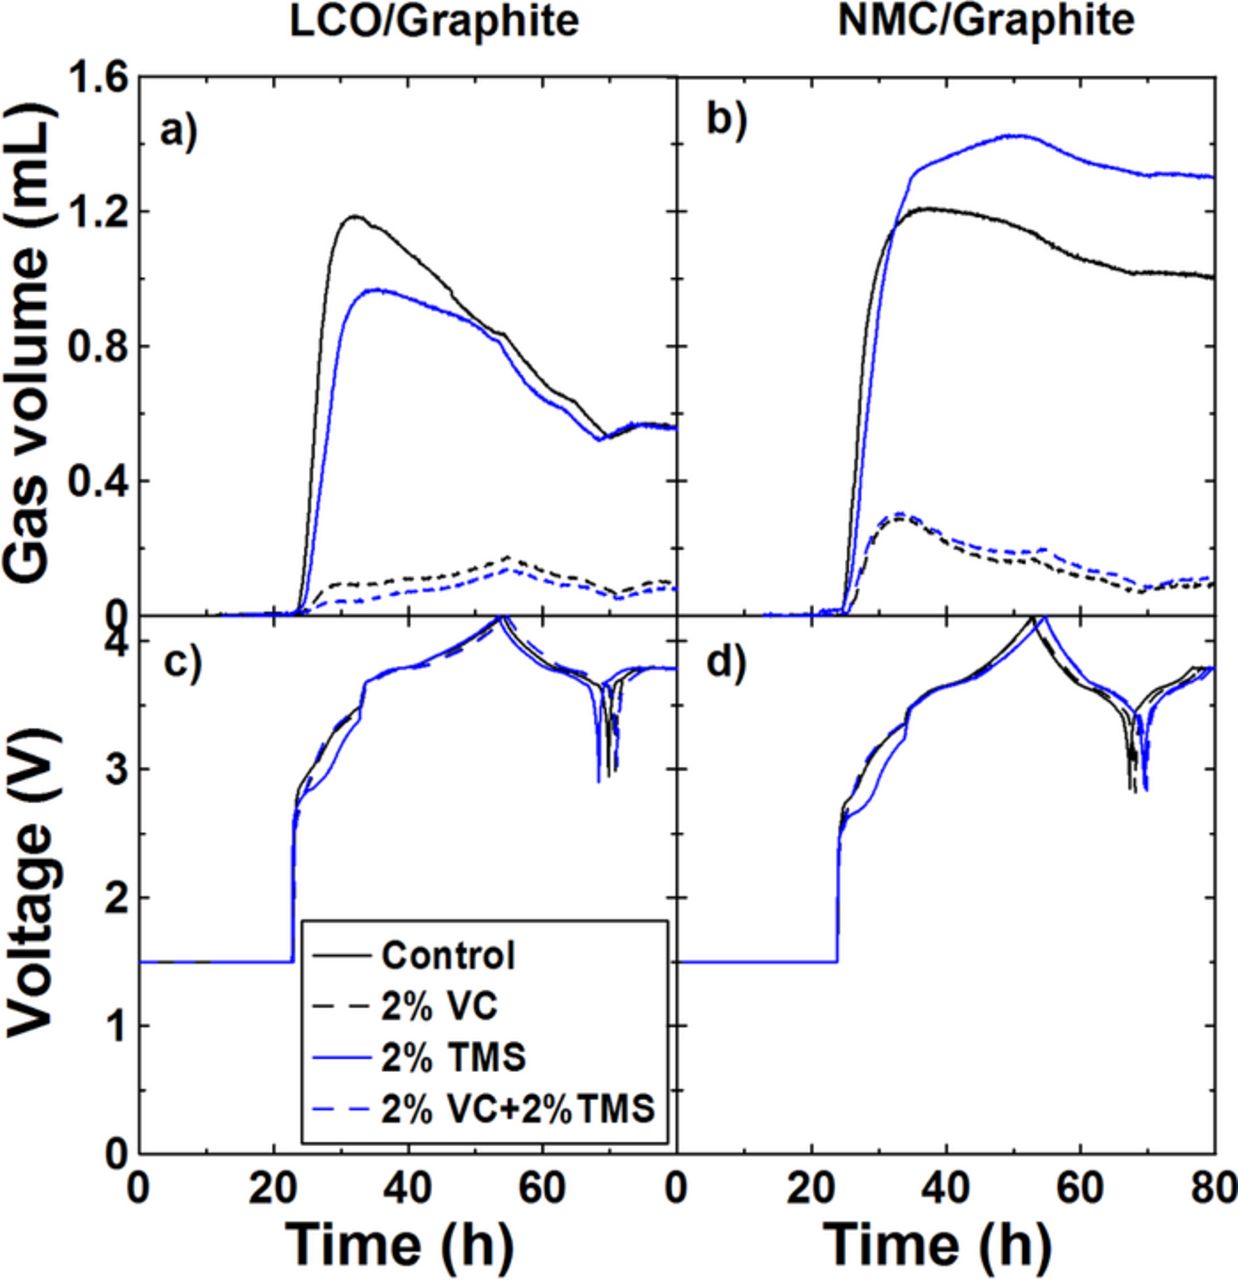
Figure 5. Gas volume and voltage versus time during formation measured using the Archimedes' in-situ gas analyzer (a, c) graphite/LCO pouch cells and (b, d) graphite/NMC pouch cells.
Figure 6 shows the cycling data collected on the UHPC for the graphite/LCO pouch cells with different amounts of DTD at 40. ± 0.1°C. From top to bottom, the 3 panels in Figure 6 show: the charge endpoint capacity; the discharge capacity and the CE, all plotted versus cycle number. A shift of the coulombic efficiency (CE = discharge capacity/charge capacity) closer to 1.0000 and a decrease in charge end point slippage (slope of charge end point capacity versus cycle number) are indications of a reduction in parasitic reactions which normally correlates with longer lifetime.26 The CE increases gradually with the cycle number during the first few cycles as the SEI on the negative electrode thickens and its growth rate slows. The top panel shows that cells containing only DTD give much higher charge end-point capacity slippage rates than those of cells with 2% VC. When DTD was added together with 2% VC, cells showed similar charge end-point capacity slippage rates to those of cells with 2% VC. The middle panel shows that the discharge capacities are gradually decreasing during cycling and it is difficult to tell differences between different additive blends. The bottom panel shows that cells containing 2% VC, 3% VC or 2% VC + 1% DTD show the best CE. Cells that contain 1% DTD or 2% DTD are the worst in CE and also in charge endpoint capacity slippage. Our previous results showed that DTD can compete with VC as a single additive in graphite/NMC(111) cells balanced for operation to 4.2 V.22 However, this benefit does not appear in graphite/LCO pouch cells. This is an interesting behavior which needs further exploration.
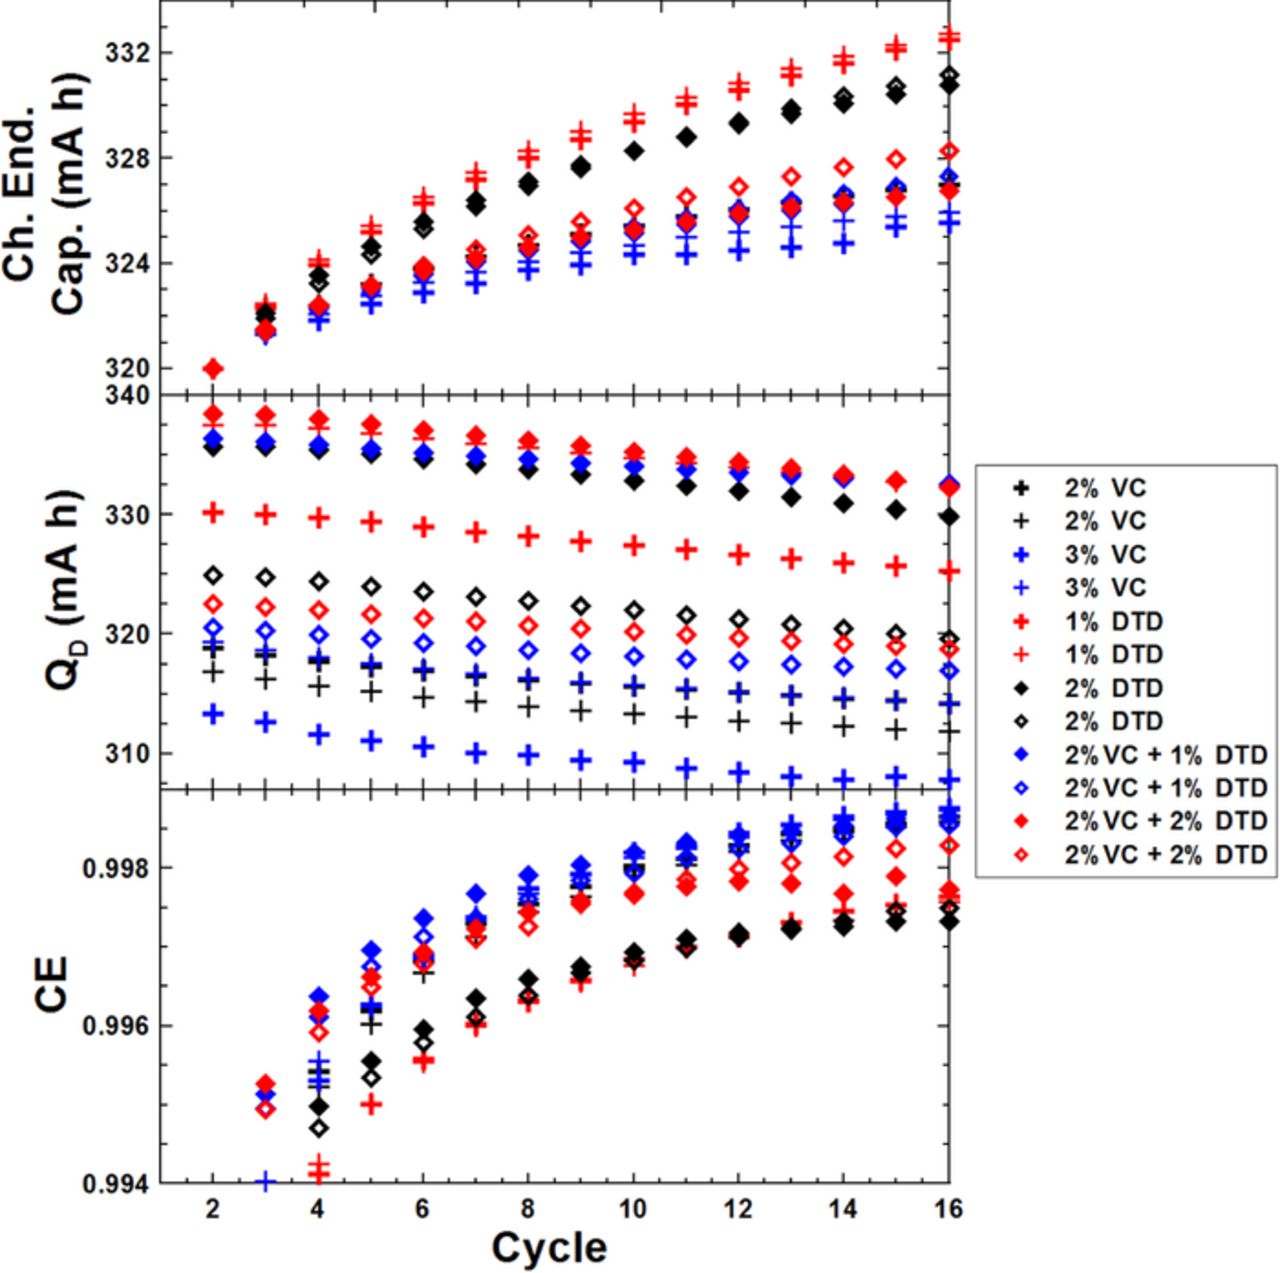
Figure 6. Cycling data collected on the UHPC including: CE, discharge capacity and charge endpoint capacity, all plotted versus cycle number for graphite/LCO pouch cells with different amounts of VC and/or DTD.
Figure 7 shows the cycling data collected on the UHPC in the same presentation format as Figure 6 for the graphite/LCO pouch cells with different amounts of TMS at 40. ± 0.1°C. The top panel of Figure 7 shows cells that contain only TMS have severe charge endpoint capacity slippage while cells with VC+TMS show similar results compared to the cells with only 2% VC. The middle panel of Figure 7 shows that the discharge capacity over the short term is gradually decreasing during cycling. The bottom panel of Figure 7 shows that cells with only TMS have very poor CE. When TMS and VC are added together, the CE is similar to that of the cells with only 2% VC. These results are similar to those found in graphite/NMC pouch cells in Ref. 22.
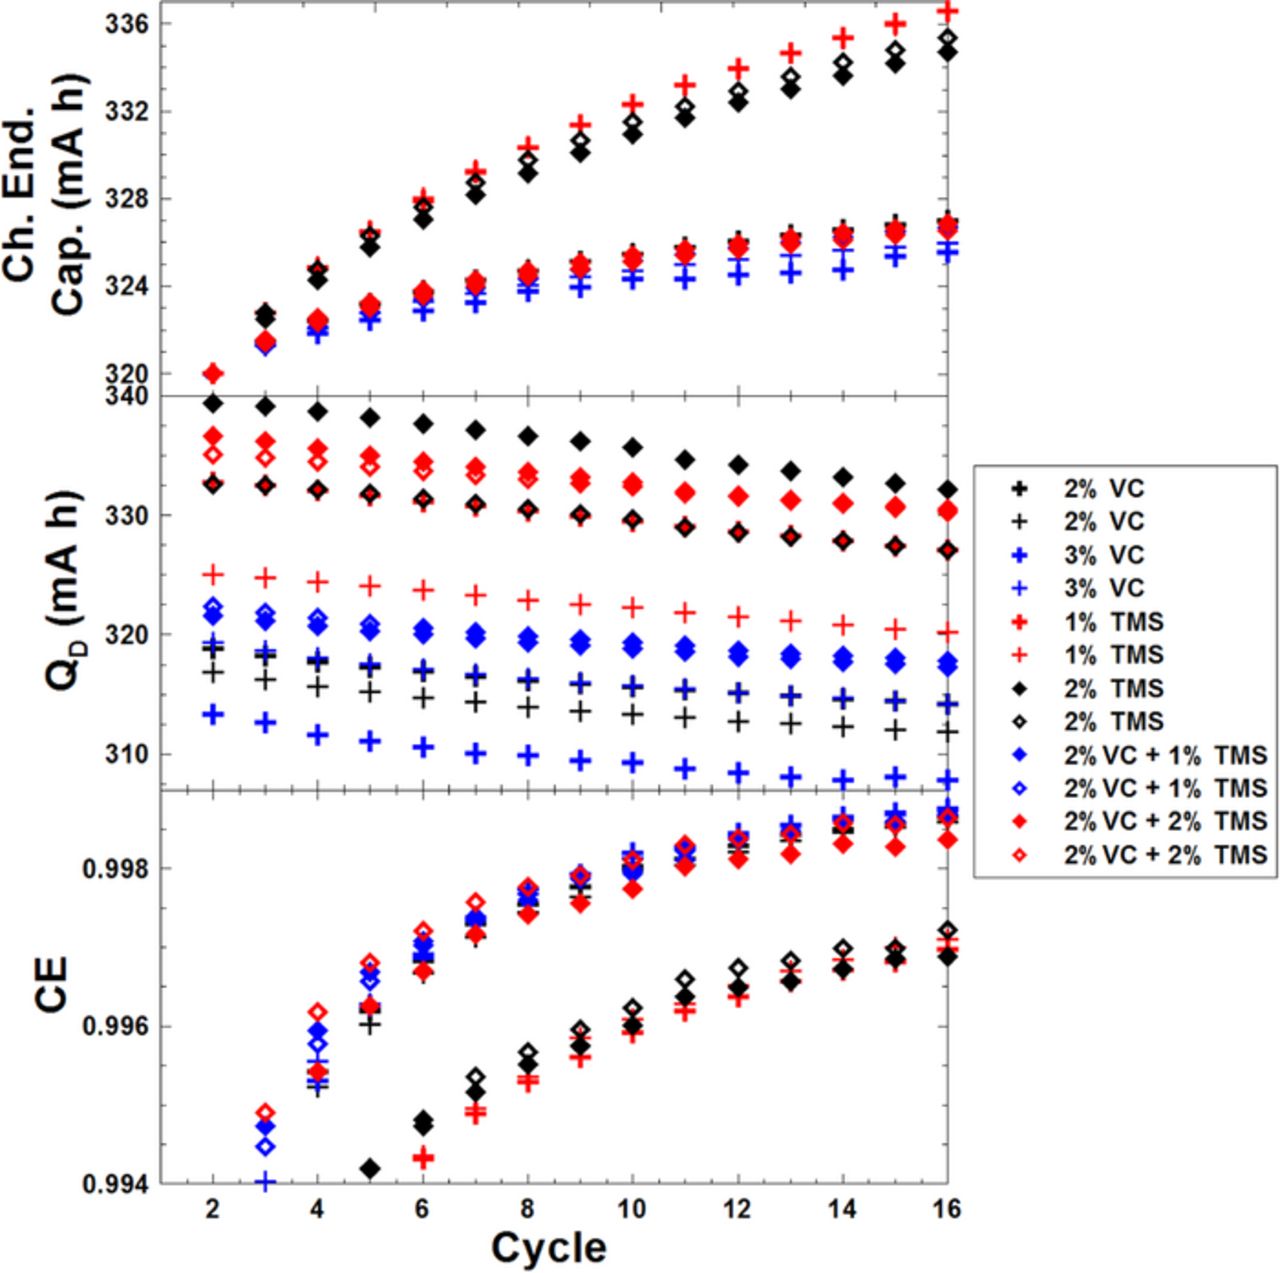
Figure 7. Cycling data collected on the UHPC including: CE, discharge capacity and charge endpoint capacity, all plotted versus cycle number for graphite/LCO pouch cells with different amounts of VC and/or TMS.
Figure 8 shows the cycling data collected on the UHPC in the same presentation format as Figures 6 and 7 for the graphite/LCO pouch cells with different amounts of PLS at 40. ± 0.1°C. The top panel of Figure 8 shows that cells containing only PLS or 2% VC + 2% PLS have larger charge endpoint capacity slippage rate than cells containing 2% VC while cells containing 2% VC + 1% PLS show similar results to cells containing 2% VC. The middle panel of Figure 8 shows that the discharge capacity of cells containing only PLS fades much faster than cells containing only VC or VC+PLS over the 15 cycles tested on the UHPC. The bottom panel of Figure 8 shows that the CE of cells with only PLS is much worse than the cells containing 2% VC. Cells containing 2% VC+ 1% PLS show similar CE to cells containing 2% VC.
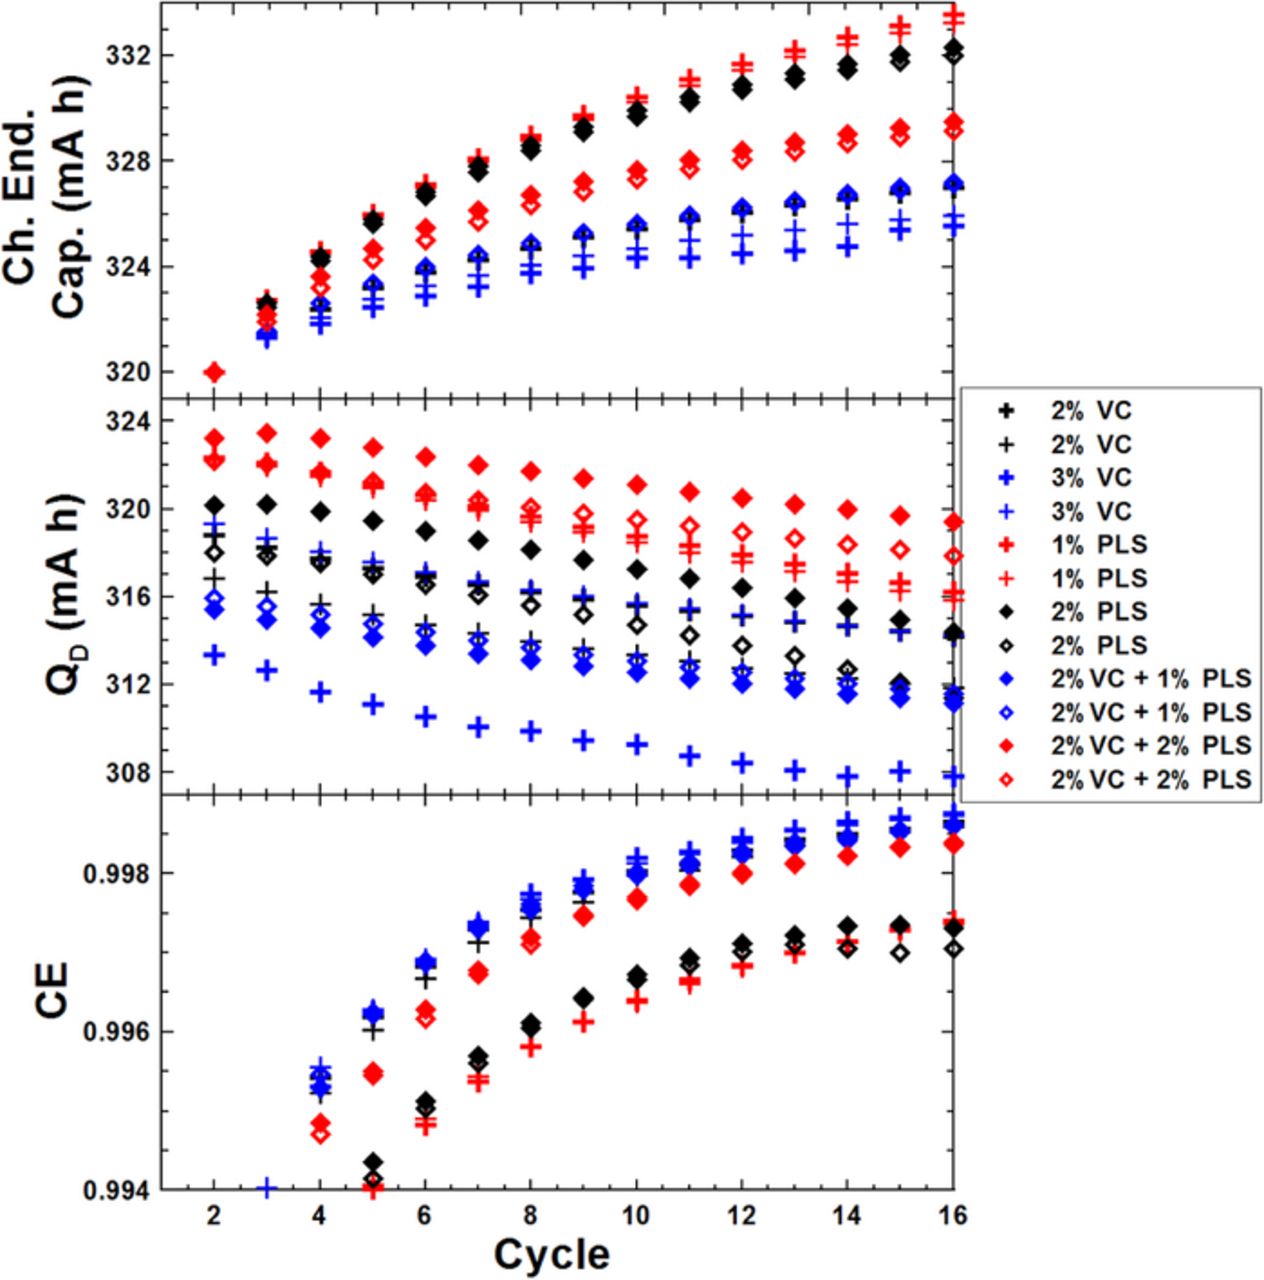
Figure 8. Cycling data collected on the UHPC including: CE, discharge capacity and charge endpoint capacity, all plotted versus cycle number for graphite/LCO pouch cells with different amounts of VC and/or PLS.
Figures 9a, 9b and 9c show typical Nyquist plots after formation for graphite/LCO pouch cells with different amounts of DTD, TMS or PLS, respectively, measured at 3.80 V and 10. ± 0.1°C. Figures 9d, 9e and 9f show the impedance spectra of the same cells measured at 3.80 V and at 10 C after 15 cycles on the UHPC. The charge transfer resistance (Rct) in Figure 9 was calculated as the width of the semi-circle in the Nyquist representation of the electrochemical impedance spectra which includes the active particle-current collector contact resistance of both electrodes (small), the resistance to the transfer of Li+ from the electrolyte to the electrode through the solid electrolyte interface (SEI) of both electrodes, and the electron transfer to the active material of both electrodes.27,16 The impedance of cells containing 2% VC increases slightly after 15 cycles. Cells with 3% VC show much higher Rct than cells with 2% VC after formation and Rct increases significantly after 15 cycles, which agrees well with previous results.28,29 The DTD or PLS-containing cells show obvious impedance growth during cycling while the TMS-containing cells show a small increase in impedance after UHPC cycling. However, all of these combinations show smaller Rct than that of 3% VC both after formation and after cycling.
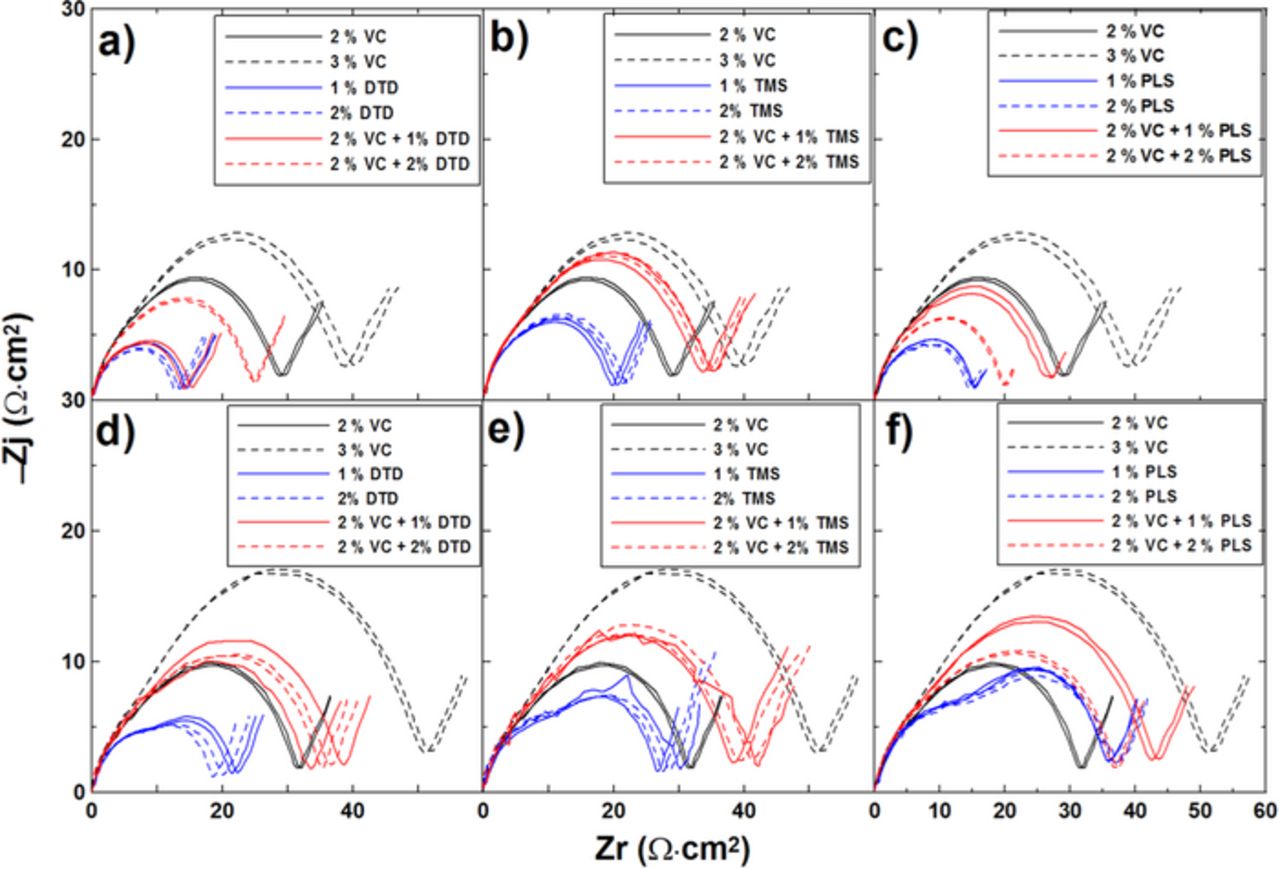
Figure 9. Impedance spectra of graphite/LCO pouch cells with different concentrations of the additives VC, DTD, TMS or PLS: (a-c) before cycling; (d-f) after cycling.
Figure 10 shows the open circuit voltage (OCV) versus time during storage at 40. ± 0.1°C for the graphite/LCO pouch cells with different concentrations of DTD, TMS or PLS as additives. Voltage drop (Vdrop) during storage is due to electrolyte oxidation at the positive electrode and has been shown to correlate well with charge endpoint capacity slippage.22,25 Cells with large charge endpoint capacity slippage during cycling normally have large voltage drops during storage. Figure 10 shows that the single additives DTD, TMS and PLS all perform much worse than 2% VC in graphite/LCO pouch cells. Figure 10a shows cells containing 2% VC + 1% DTD perform a little better than those with 2% VC. However, an increasing amount of DTD worsens the storage performance which agrees well with the charge endpoint capacity data in Figure 6. Figures 10b and 10c show the combination of VC and TMS generally gives the better storage performance while the combination of VC and PLS gives worse storage performance when compared with 2% VC. These results agree well with the charge endpoint capacity slippage results in Figures 6 –8.
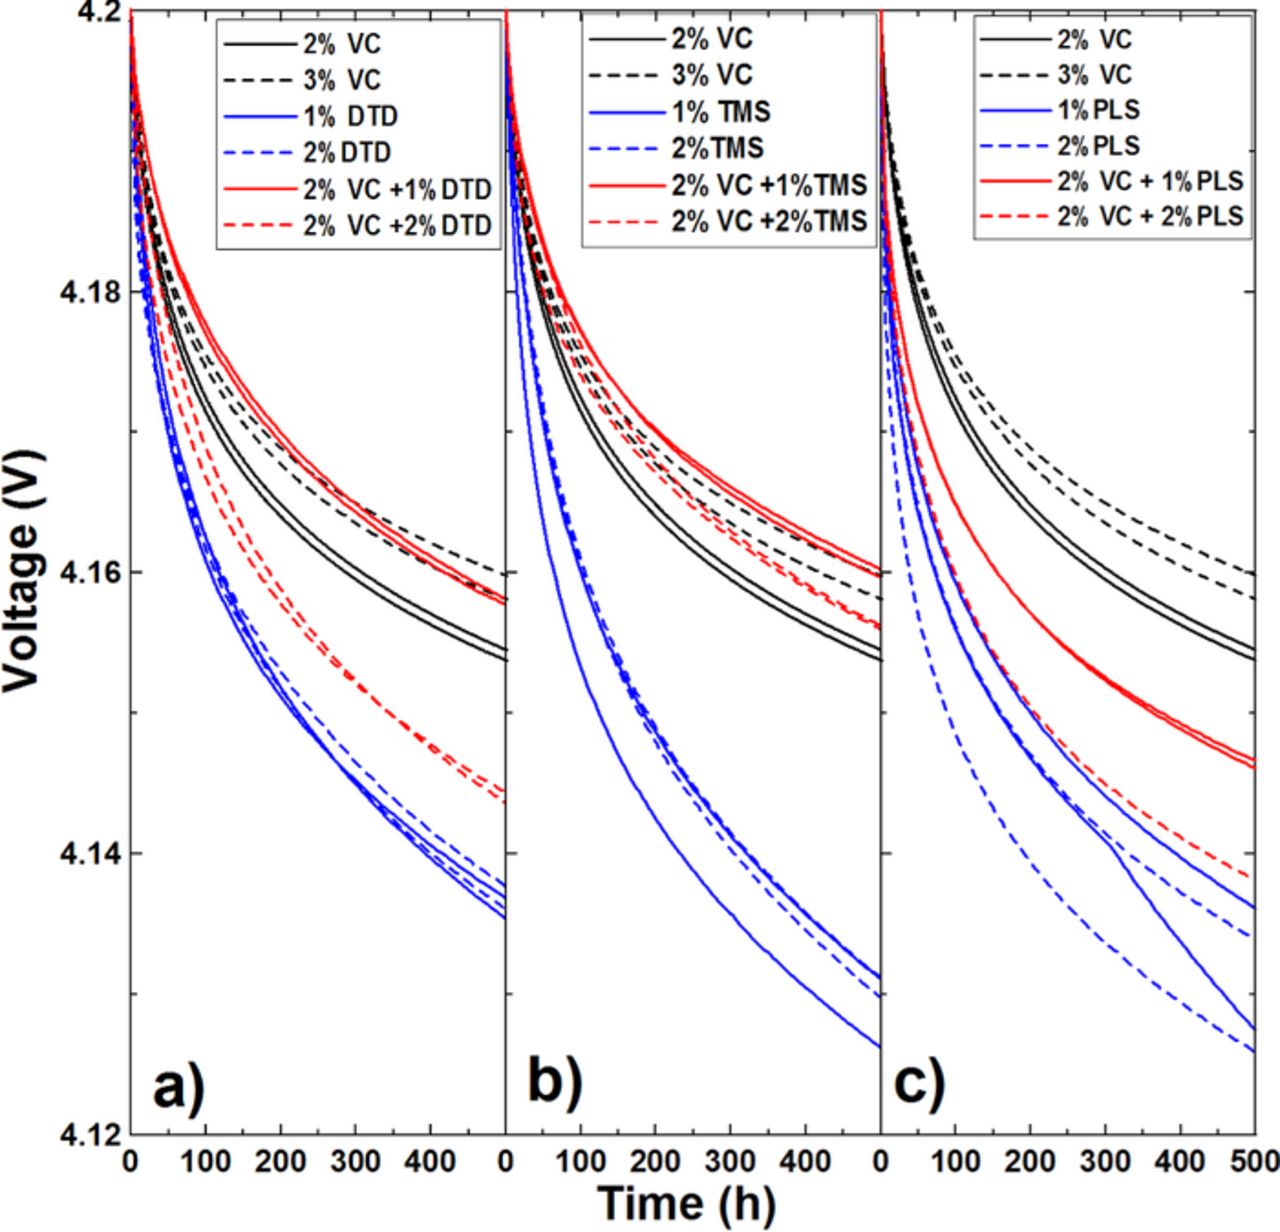
Figure 10. Open circuit voltage versus time of graphite/LCO pouch cells charged to 4.2 V and stored at 40.0°C. The cells have different concentrations of DTD (panel a), TMS (panel b) and PLS (panel c) as indicated.
Figure 11 shows the impedance spectra of graphite/LCO pouch cells with different concentrations of DTD, TMS or PLS measured at 3.8 V and at 10. ± 0.1°C after the 500 h storage period. The results show the same trends as the EIS data after cycling as shown in Figure 9.
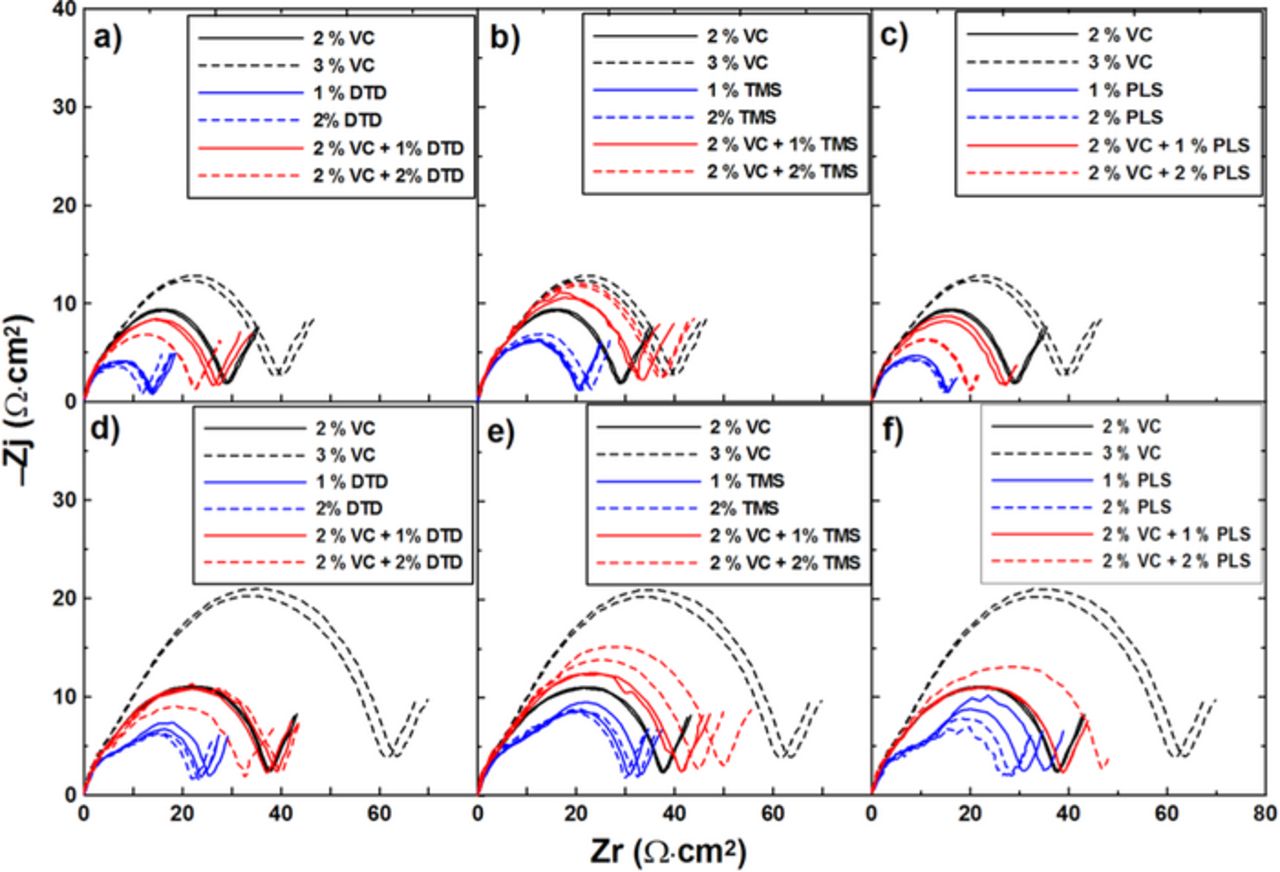
Figure 11. Impedance spectra of graphite/LCO pouch cells with different concentrations of the additives VC, DTD, TMS or PLS: (a-c) before storage; (d-f) after storage.
Figures 12a and 12b summarize the volume of gas produced during 500 h storage and during UHPC cycling for the graphite/LCO pouch cells tested at 40.0°C. The error bars are the standard deviation of data from pair cells. Small negative numbers mean that the cell volume decreased slightly. Figure 12a shows that most of these cells shrank slightly during the 500 h storage period suggesting that no further gas was produced under these conditions, except for cells containing 2% VC, 3% VC, 1% MMDS or 2% VC+1% MMDS. Figure 12b shows that DTD or PLS-containing cells shrank slightly while TMS-containing cells swelled slightly during the 15 cycles tested on the UHPC. The gas data for the MMDS-containing cells after UHPC cycling is not available because these cells were tested before gas measurements were routinely made. The reasons for the volume change during storage or cycling with different additives are not understood at this moment. However, compared with the volume of the graphite/LCO pouch cell, which is initially 3.5 mL, these cells do not have an obvious swelling problem during 40.0°C cycling or storage.
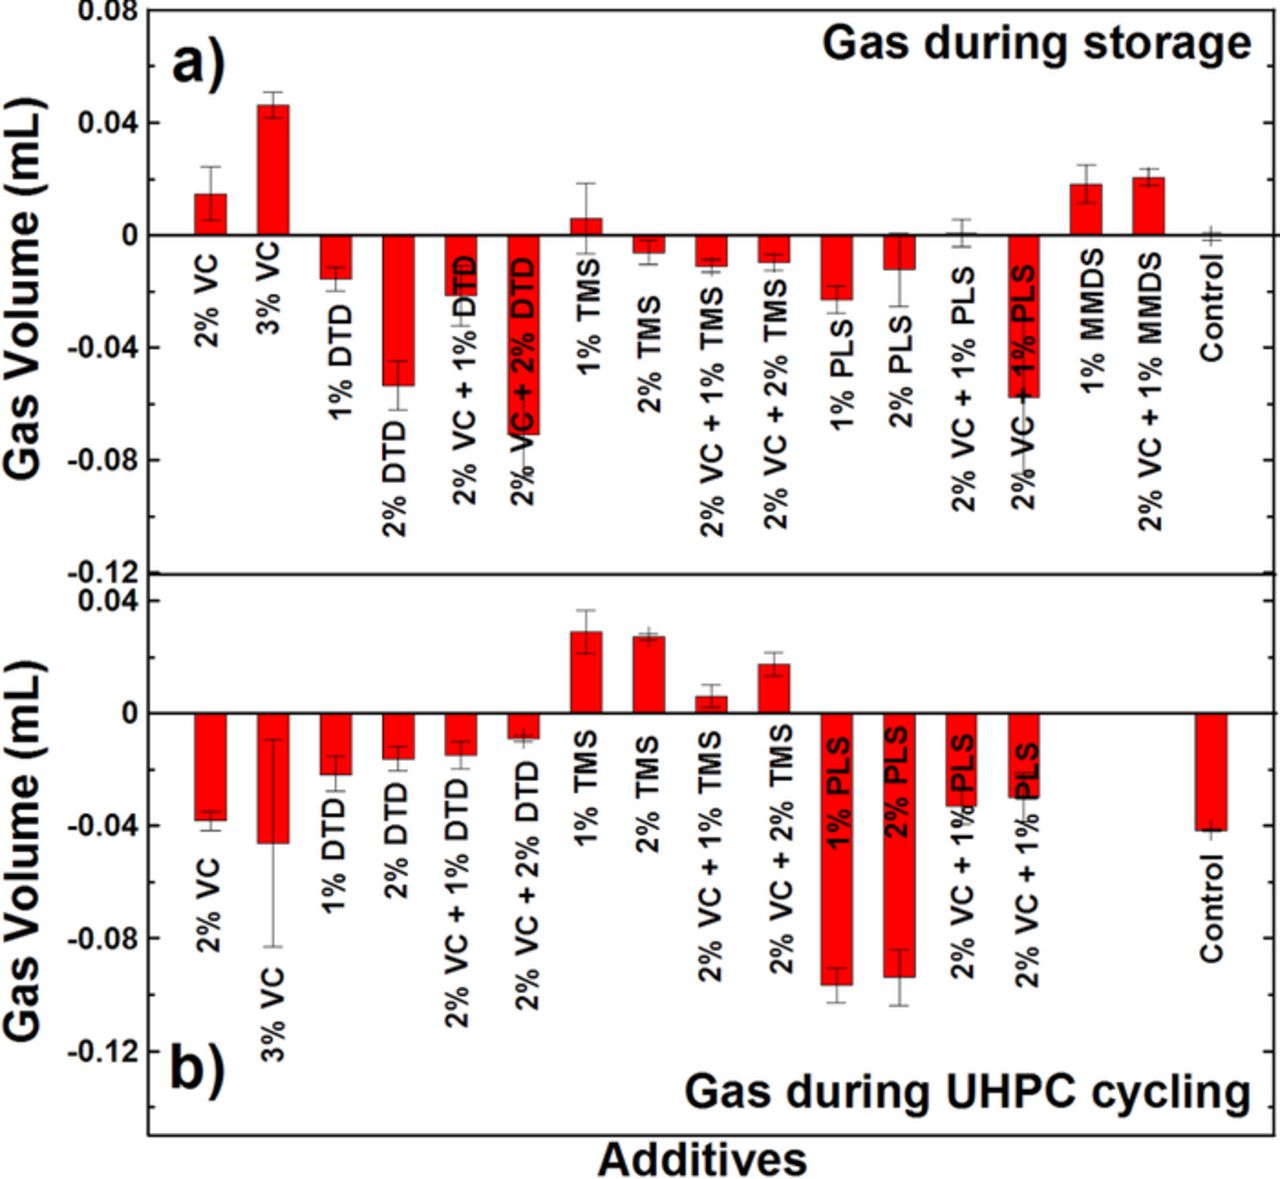
Figure 12. Volume of gas evolved (a) during the 600 h HPC cycling and (b) during the 500 h storage period for the graphite/LCO pouch cells at 40.0 ± 0.1°C.
Figures 13a, 13b and 13c show a summary of coulombic inefficiency (CIE = 1 – CE), charge endpoint capacity slippage rate and voltage drop during storage (Vdrop) of the graphite/LCO pouch cells studied here. The CIE was calculated from the CE taken as an average of the final three data points (cycles 13–15) collected on the UHPC. The charge endpoint capacity slippage rate was calculated from the slope of a best fit line to the final five points (cycles 11–15) of the charge endpoint capacity versus cycle number curve. The error bars are the standard deviation of data from pair cells. Figure 13 shows that the single additives DTD, TMS, PLS or MMDS perform much worse than 2% VC in CIE, charge endpoint capacity slippage and voltage drop during storage. Even compared with control cells, they do not show any improvement, which is unexpected based on the results found in graphite/NMC cells in Ref. 22. Figure 13 shows that the combinations including 2% VC + 1% DTD, 2% VC + 1% PLS and 2% VC + 1% MMDS can provide similar CIE, charge slippage and storage performance to 2% VC alone while 2% VC + 2% DTD and 2% VC + 2% PLS cannot. The combination of VC + TMS generally gives better performance than compared to 2% VC alone. Adding 3% VC improves the slippage and storage properties compared to 2% VC, but at a large cost in impedance as shown in Figures 9 and 11. Coupling 2% VC with TMS or MMDS can improve all properties and lead to lower impedance than 3% VC.
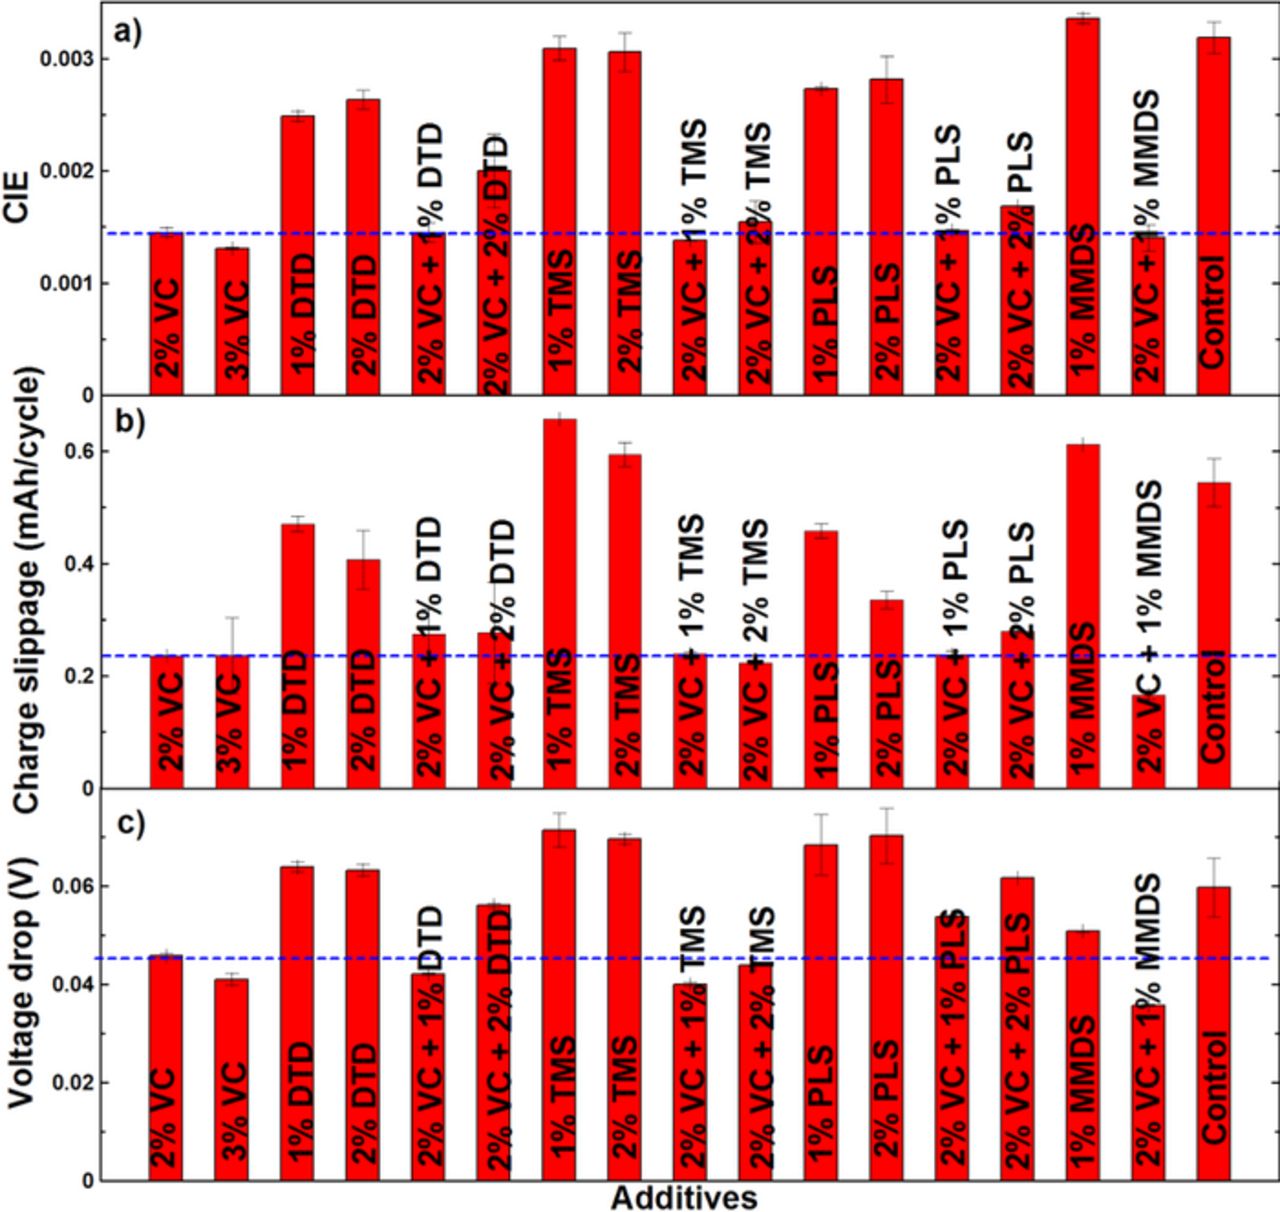
Figure 13. Summary of the high precision cycling and storage data for the graphite/LCO cells studied in this work: (a) coulombic inefficiency (CIE) during cycling; (b) charge endpoint capacity slippage during cycling; and (c) voltage drop during storage.
Figures 14a and 14b show a summary of EIS data collected after formation and after the UHPC cycling respectively. Figure 14c shows the change in charge transfer resistance, ΔRct, during cycling taken as the value in Figure 14a minus the value in Figure 14b. Figures 14a and 14b show that the control cell has severe impedance growth during UHPC cycling. The single additives DTD, TMS, PLS or MMDS give much lower Rct than 2% VC after UHPC cycling, however, they show worse cell cycling performance than 2% VC, which is unwanted. When combined with 2% VC, all of these additive combinations had higher impedance after UHPC cycling than that of 2% VC. Figure 14c shows the impedance of the MMDS-containing cells decreased after UHPC cycling. This does not occur in the DTD, TMS or PLS-containing cells. Based on the results in Figures 13 and 14, the additive combinations VC + TMS and VC + MMDS are worth further consideration in graphite/LCO pouch cells.
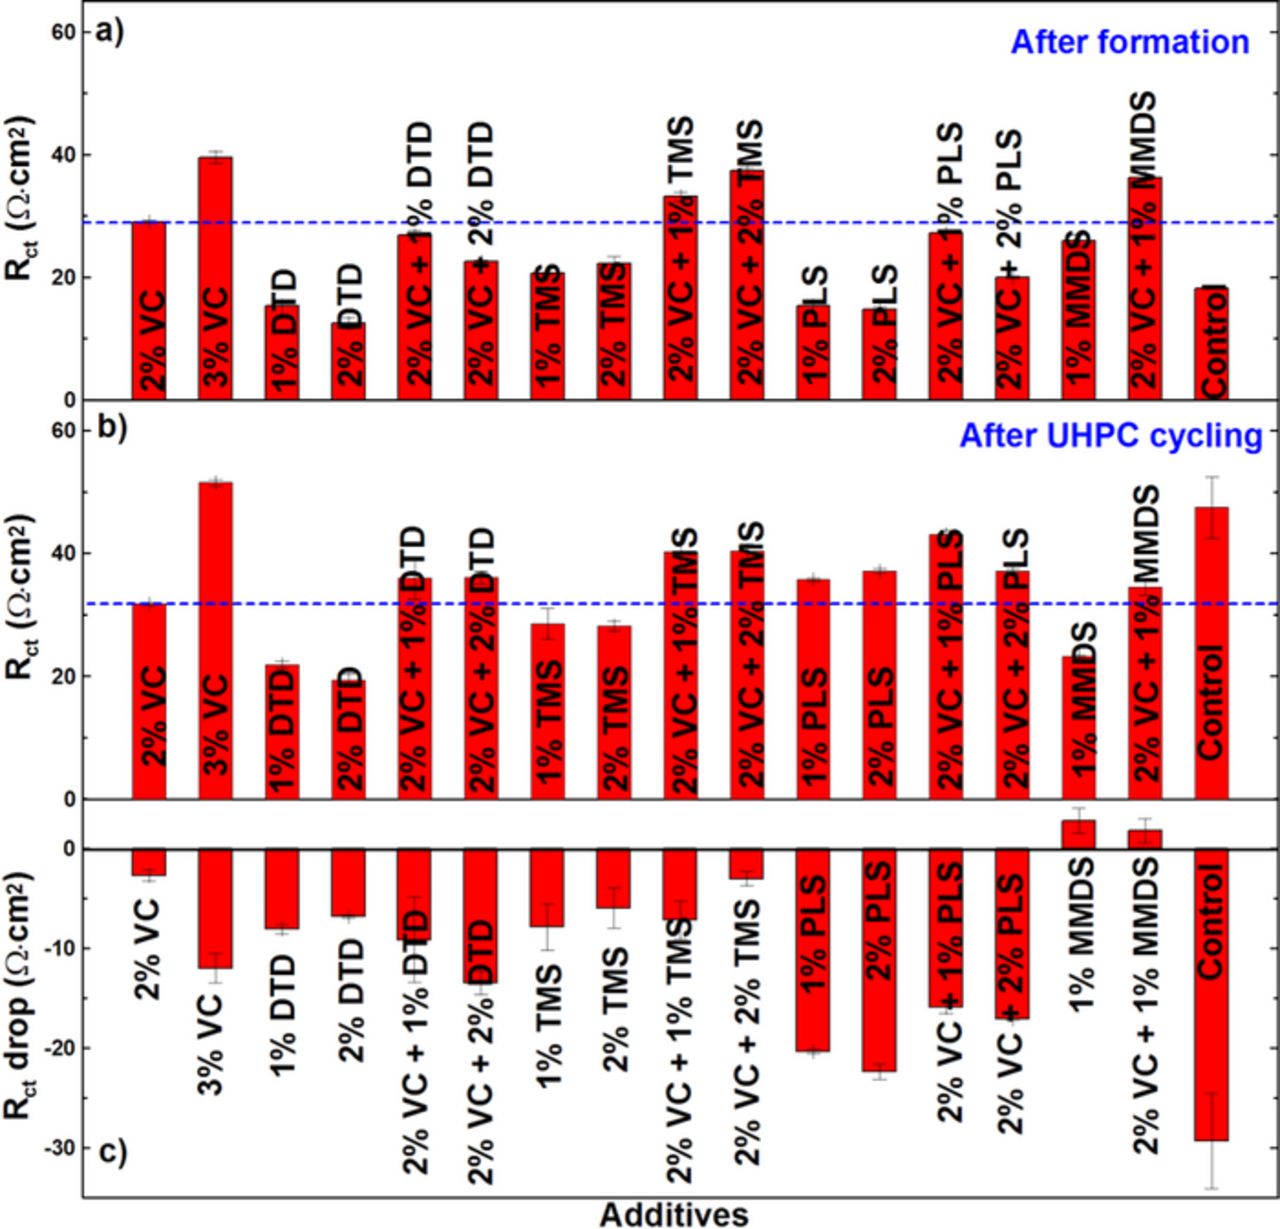
Figure 14. Impedance spectra of graphite/LCO pouch cells with different concentrations of the additives VC, DTD, TMS or PLS at 40.0 ± 0.1°C: (a) after formation, (b) after cycling and (c) after storage.
Figure 15 shows "radar" or "spider" plots which summarize the electrolyte additive combinations studied in the graphite/LCO pouch cells of this paper and in the graphite/NMC pouch cells in Ref. 22. The four axes represent the coulombic inefficiency, the charge endpoint capacity slippage, the charge transfer resistance after UHPC cycling and the voltage drop during storage. The axes have been scaled so that 100% is the value of the additive that has the largest (the worst) value of each parameter. Therefore the best additive blend would have values closest to the center of the plot. Figure 15 shows that there is no clear "winner" in all aspects amongst these additive blends used in both type of pouch cells and tradeoffs between impedance and lifetime would have to be made. However, based on an overall consideration, 2% VC + 1% MMDS appears to be the best combination in both graphite/LCO and graphite/NMC pouch cells.
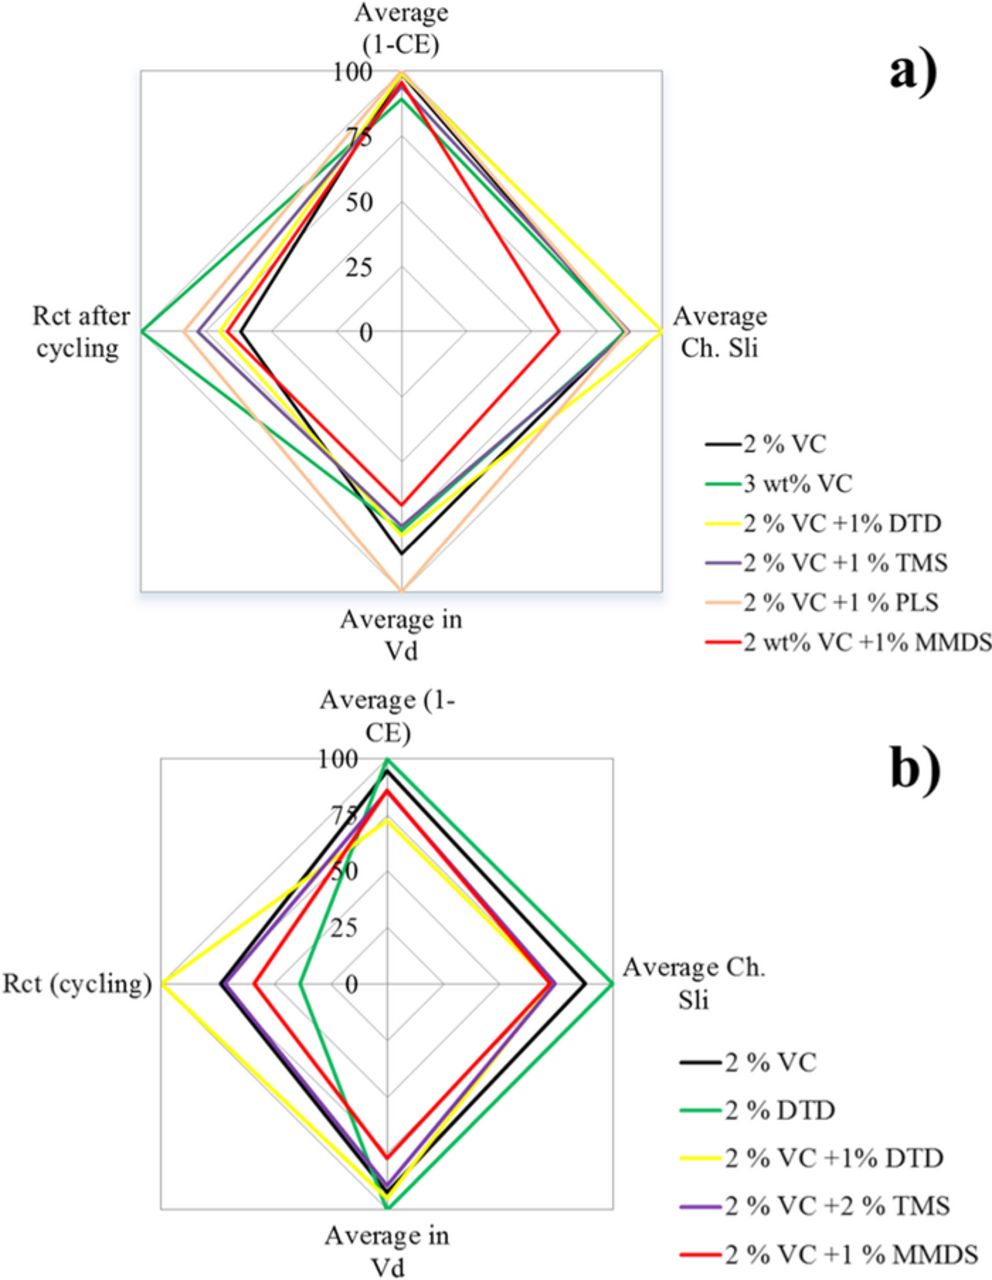
Figure 15. Radar plots summarizing the electrolyte additive combinations studied in (a) graphite/LCO pouch cells of this paper and (b) graphite/NMC pouch cells in Ref. 22. The axes show coulombic inefficiency (CIE = 1 – CE), charge endpoint capacity slippage rate (%/cycle), voltage drop during storage (volts) and the value of the real area specific impedance (Ω·cm2).
Conclusions
The three cyclic sulfate additives DTD, TMS and PLS as well as the sulfonate additive, MMDS, have been studied as electrolyte additives in graphite/LCO pouch-type Li-ion cells using an ex-situ gas apparatus, high precision coulometry, AC impedance spectroscopy and storage experiments. The results were also compared to previous results in graphite/NMC pouch cells in Ref. 22. The conclusions are summarized as follows:
- (1)The additive DTD enhances the cell performance in graphite/NMC cells while it appears less useful in graphite/LCO pouch cells.
- (2)Single additives DTD, TMS, PLS or MMDS perform much worse than 2% VC in CIE, charge endpoint capacity slippage and voltage drop during storage in graphite/LCO cells. Even compared to control cells, they do not show any improvement, which is unexpected based on the results from graphite/NMC cells.
- (3)The additives TMS and MMDS, when used in combination with VC, can provide better cycling and storage performance than cells with 2% VC in both graphite/NMC and graphite/LCO pouch cells.
- (4)Increasing the amount of S-containing additive above 1% generally leads to more gas generation, higher cell impedance, worse cycle performance and worse storage performance in graphite/LCO cells.
- (5)The additives DTD, TMS or PLS, either used singly or in combination with VC, generally lead to impedance growth during cycling and storage in graphite/LCO pouch cells while only PLS lead to obvious impedance growth increase in graphite/NMC cells. Adding MMDS leads to an impedance decrease in both graphite/NMC and graphite/LCO pouch cells.
Acknowledgment
The authors acknowledge the financial support of NSERC and 3M Canada under the auspices of the Industrial Research Chairs program. The authors thank Dr. Jing Li of BASF for providing some of the solvents and salts used in this work. R. Petibon thanks NSERC, and the Walter C. Sumner Foundation for scholarship support.