Abstract
Layered LiNi0.4Mn0.4Co0.18Ti0.02O2 cathode powders were ball-milled for various lengths of time. The structural properties of the pristine and milled powders, which have different particle sizes were examined with X-ray diffraction, soft X-ray absorption spectroscopy, and transmission electron microscopy to determine the effect of milling on structure. Electrochemical testing in half-cells was also carried out and shows that milling plays an important role in the performance of these cathode materials; as milling time increases, there is a decrease in initial discharge capacity. The first cycle irreversible capacity also increases for milled samples, as does capacity loss upon cycling under some regimes.The electrochemical degradation is strongly correlated with damage to the lamellar structure of cathode particles induced by milling, and lithium carbonate formation.
Export citation and abstract BibTeX RIS

This is an open access article distributed under the terms of the Creative Commons Attribution 4.0 License (CC BY, http://creativecommons.org/licenses/by/4.0/), which permits unrestricted reuse of the work in any medium, provided the original work is properly cited.
Layered oxides such as LiNi0.4Mn0.4Co0.2O2 (abbreviated NMC)1,2 are currently the most promising cathode materials for lithium ion batteries intended for vehicular applications, due to the reduced cobalt content, lower cost, and increased safety compared to LiCoO2 (LCO). Other advantages include the significantly higher capacities and better rate capability compared to LCO.3,4 However, improvement of the performance of NMC at high cutoff voltages and at high current densities is still needed. For the latter, the rate capability is limited by the movement of lithium ions in the active material and specifically to the slow lithium diffusion kinetics within the grains and the low intrinsic electronic conductivity.5,6
In theory, rate capability can be improved by utilizing a cathode material with smaller particle size.7 The reduced particle size shortens the diffusion pathways for lithium ions and also creates a large contact area between the active material and conductive additives.8,9 Zheng et al. reported that lithium ion diffusion within the electrode is the rate-determining step for the discharge process at high rates.10 The beneficial effect of smaller particle sizes has been shown using various cathode materials such as LiNi0.50Mn0.50O2, LiNi0.33Mn0.33Co0.33O2, and LiNi0.40Mn0.40Co0.20O2.11,12 However, smaller particle size is usually associated with high surface area, which may cause higher capacity loss due to faster ageing and side reactions within the cell,13 as has been found with nano-sized LiCoO2 used as the cathode material for high power applications.14,15 An optimal particle size in terms of performance is believed to exist in the submicron particle size range for cathode materials. Therefore, methods that can reduce the particle size of NMC to improve the performance are of significant interest.
In general, the electrochemical performance of NMCs depends on details of the preparation and synthesis conditions, which can result in a wide range of powder properties (e.g., particle size, density, and surface area) and electrochemical properties (e.g., rate capability and irreversibility). Ball milling has been shown to be an effective mechanical process to decrease particle size to the sub-micron size domain for a wide range of energy related materials16,17 and is commonly used in preparation of electrode materials. In principle, ball milling is a simple and scalable process, which results in variation of the stoichiometry, degree of intermixing, and crystallite size by controlling milling time. Previous work has shown that ball milling effectively reduced the particle size of NMC cathode materials and related compounds18,19 and improved the performance of LiMnPO420 and LiMn2O421 cathodes. However, the effect of ball milling conditions on the structure and properties of NMC cathodes has not been thoroughly investigated. The effective mechanism of particle size reduction induced by ball milling on the performance of the cathode is still unclear. The conditions used for ball milling processes are particularly important and can significantly affect material structure and surface area, which can in turn affect the electrochemical properties. It has been previously shown that lithium-ion battery electrodes evolve with cycling (for example, in situ surface reconstruction and formation of a surface reaction layer can cause deterioration in electrochemical performance).13–15,22–24 However, ball milling induced formation of secondary phases or defects cannot be completely excluded as a factor affecting performance. It has been reported that formation of rock salt phases or other secondary phases can be related to structural/surface defects caused by ball milling during mechanochemical synthesis of LiCoO2.25
In this study, a comprehensive investigation on the effect of ball milling on LiNi0.4Mn0.4Co0.18Ti0.02O2 (NMC) materials both on particle surfaces and in the bulk was conducted to reveal insights on the effect on electrochemical performance. The structural changes and effect on electrochemistry are discussed herein.
Experimental
Material synthesis
The co-precipitation method was used for the synthesis of composition LiNi0.4Mn0.4Co0.18Ti0.02O2 materials (NMC442-2%Ti, abbreviated NMC hereafter) in this study, as described in a previous study.22 Briefly, 250 ml aqueous solutions consisting of transition metal nitrates 0.16 M Mn(NO3)2, (0.16 M Ni(NO3)2, 0.072 M Co(NO3)2, and 0.008 M TiO(SO4).xH2O (Sigma Aldrich Chemical Company) were fed through a Masterflex C/L peristaltic pump and precipitated out with a 250 mL of 0.8 M LiOH solution while being constantly stirred. Consequently, the precipitated compounds were filtered and washed with deionized water, and then dried overnight at 100°C. The product was then ball-milled (500 rpm, 1 atm, 1 hour) with LiOH, with 5% extra lithium added to compensate for lithium loss during calcination. This mixture was then heated in air at 900°C for 3 h using a ramp rate of 2°C min−1. The resultant NMC materials were ball milled for different lengths of time to reduce the particle size. Powders were planetary ball milled in acetone for 1h and 3h and then dried under flowing nitrogen.
NMC electrode fabrication and half-cell preparation
The composite electrodes consisted of 4 wt% SFG-6 graphite (Timcal, Graphites and Technologies), 4 wt% acetylene carbon black (Denka, 50% compressed), 8 wt% polyvinylidene fluoride (Kureha Chemical Ind. Co. Ltd) and 84 wt% active material. These electrodes were prepared as follows: first, a slurry of these components in N-methyl-2-pyrrolidinone was made and cast onto carbon-coated aluminum current collectors, then dried for 12 hours at 120°C under vacuum. Electrodes were cut to size and had typical active material loadings of 5–7 mg/cm2. The composite electrodes were assembled with lithium metal anodes and Celgard 2400 separators in 2032 coin cells under an inert atmosphere. 1 M LiPF6 electrolyte solution in 1:2 w/w ethylene carbonate/dimethyl carbonate (Kureha Chemical Ind. Co. Limited) was added to wet the separator and cathode prior to sealing the coin cells. A computer controlled VMP3 potentiostat/galvanostat (BioLogic) was used to cycle cells at 0.055mA/cm2 (approximately C/20). 1C corresponds to a current density of 280mA/g; the amount of current needed to fully charge the electrode in 1 hour.
Materials Characterization
A Phillips X'Pert diffractometer with an X'celerator detector using copper Kα radiation was used to obtain powder X-ray diffraction (XRD) patterns. The XRD patterns were typically scanned over an angular range of 10–90° (2θ) with a step size of 0.0167°. Rietveld refinement was carried out using MDI Riqas software. Scanning electron microscopy images (SEM) were collected by a field-emission microscope (JEOL JSM-7500F) equipped with a Thermo Scientific Inc. energy dispersive X-ray spectroscopy (EDS) detector to examine particle size and morphology and to determine sample composition. Transmission electron microscopy (TEM) experiments were carried out at the National Center for Electron Microscopy (NCEM) at LBNL, using JEOL 3010 and JEOL 200CX microscopes operated at 300 kV and 200 kV, respectively. BET measurements were carried out on a Tristar 3000 surface area & porosity analyzer (Micromeritics Instrument Corp).
The XAS absorption spectroscopy analysis for the samples was performed by applying a 31-pole wiggler 10–1 beamline resource from Stanford Synchrotron Radiation Lightsource (SSRL). The ring current was 350 mA and a 1000 mm−1 spherical grating monochromator with 20 um entrance and exit slits was used, resulting in 10−11 phs−1 at 0.2 eV resolution in a 1 mm2 beam spot. The XAS measurements were performed on powder samples deposited on the conductive carbon tape under ultrahigh vacuum (10−9 Torr) in a single load at room temperature in total electron yield (TEY) and fluorescence yield (FY) modes. Fluorescence yield (FY) and total electron yield (TEY) provide information on the chemical environments with approximately depth sensitivities of 50 nm and 2–5 nm, respectively. A silicon diode (IRDAXUV-100) detector, which was positioned near the sample surface was used to collect the fluorescence yield (FY) mode data.
Results and Discussion
Electrochemical properties of NMC
The ball milling treatment has a critical influence on the charge-discharge performance of NMC cathodes in the first cycle. The galvanostatic profiles in the first cycle of lithium half-cells containing the NMC cathodes with different particle sizes are presented in Figure 1 and Figure 2.
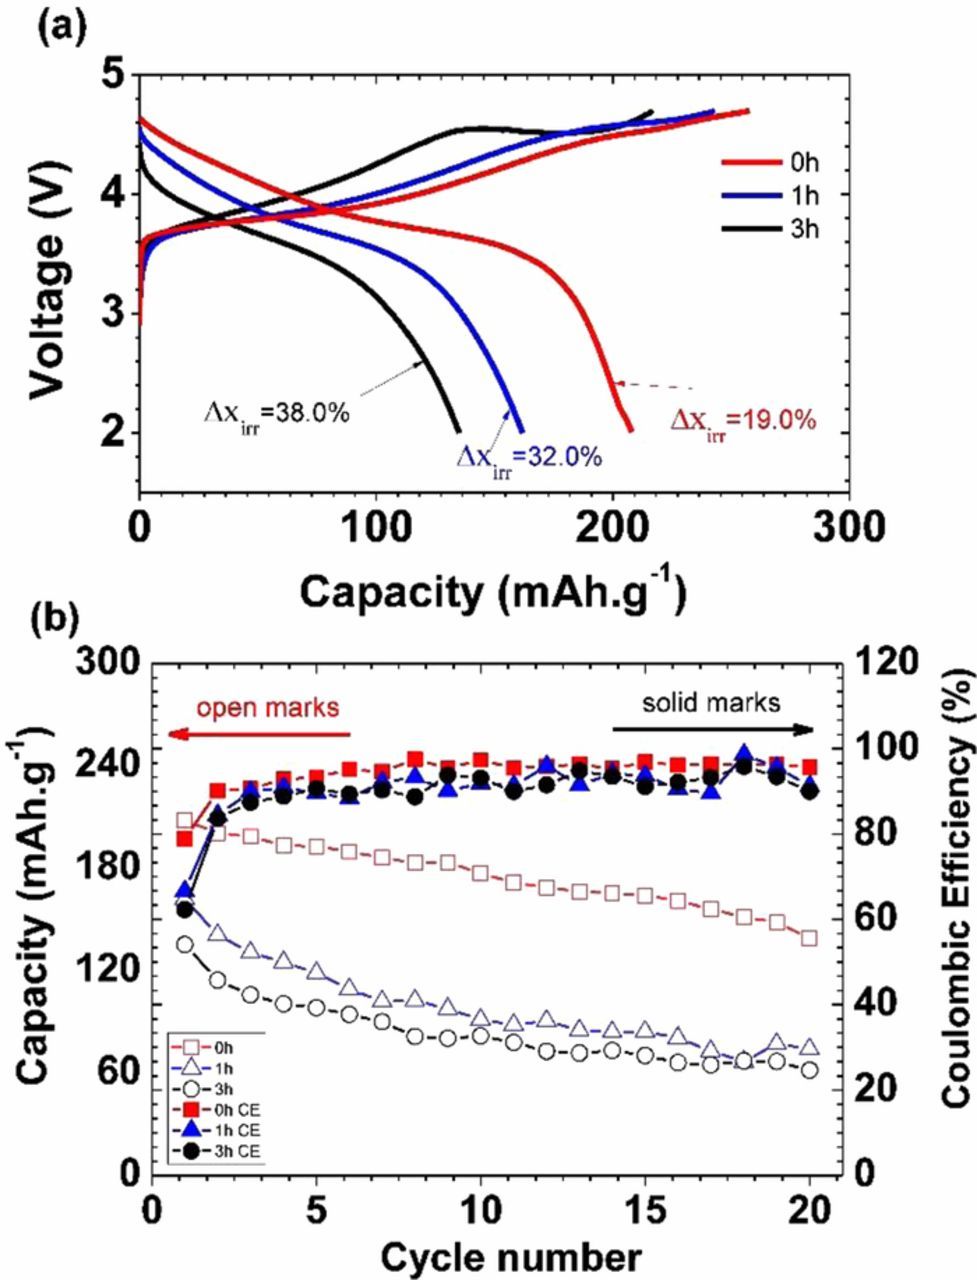
Figure 1. NMC-442 half-cells cycled at 0.055 mA/cm2between 2.0-4.7 V, as a function of ballmilling time. (a) first cycle voltage profiles, and (b) capacity and Coulombic efficiency as a function of cycle number.
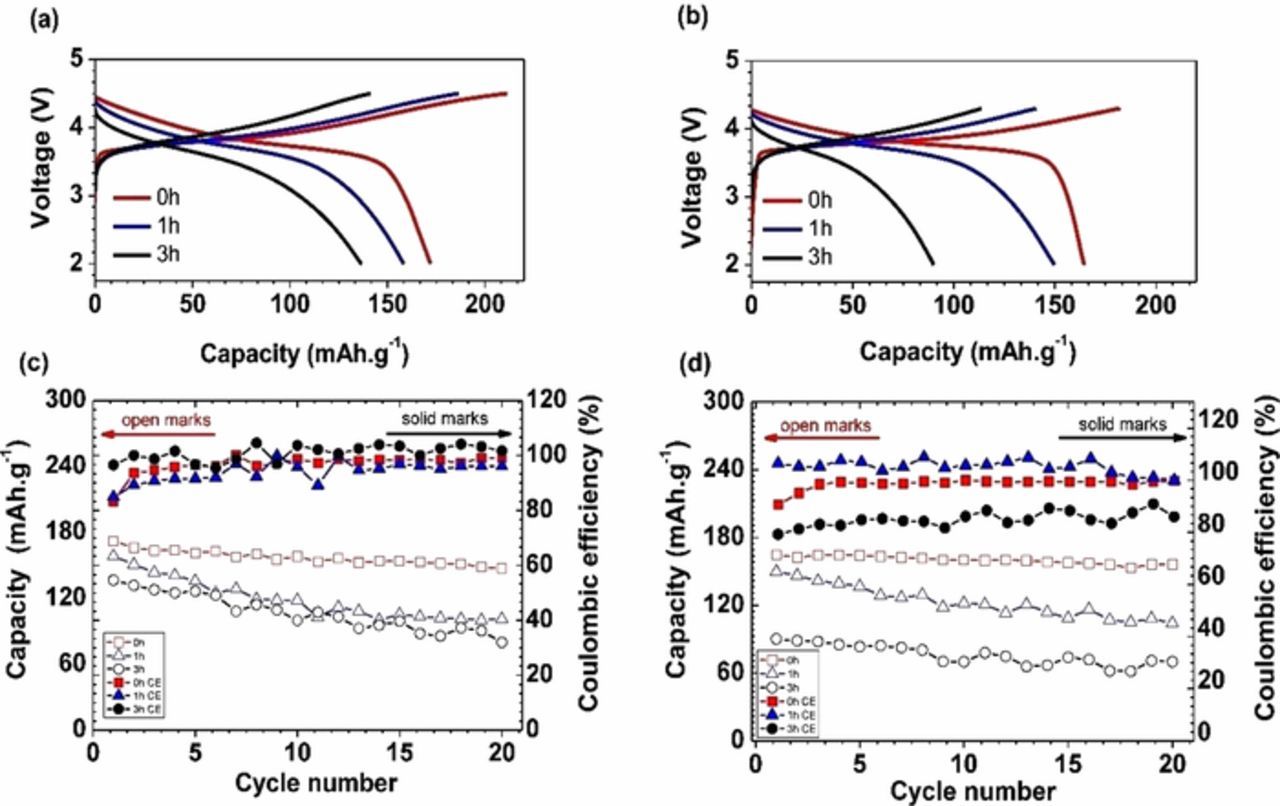
Figure 2. First cycle voltage profiles for lithium cells containing NMC-442 materials milled for one or three hours, discharged and charged at 0.055 mA/cm2 between (a) 2.0-4.5 V and (b) 2.0-4.3 V. (c) the capacity and Coulombic efficiency a function of cycle number when discharged between 2.0-4.5 V. (d) the capacity and Coulombic efficiency as a function of cycle number when discharged between 2.0-4.3 V.
All the cells were charged and discharged between 2.0 and 4.7, 4.5, or 4.3 V at a current density of 0.055 mA/cm2. The differences between the pristine and ball-milled samples are immediately apparent. The discharge profiles after charging to 4.7 V are typical of stoichiometric NMCs, but the pristine sample delivers higher specific capacities than those treated by the ball milling process. The initial charge curve for the cells containing pristine NMC cathodes show a gradually sloping profile even at high voltage ranges. In contrast, the cell with NMC cathode material ball milled for three hours shows an obvious voltage plateau at 4.5 V, when charged to 4.7 V (Figure 1). Since the NMC was ball milled in air with acetone, this suggests that there was lithium carbonate formation, which is known to oxidize at potentials above 3.8V vs. Li+/Li and evolve CO2 with concomitant removal of lithium ions.26–32 This plateau is longer in the cell containing the sample ball milled for 3 hours than in the one milled for only one hour, suggesting more lithium carbonate was produced during the longer milling time. These plateaus are observed only on the first charge (Figure 3), indicating that the process is irreversible.
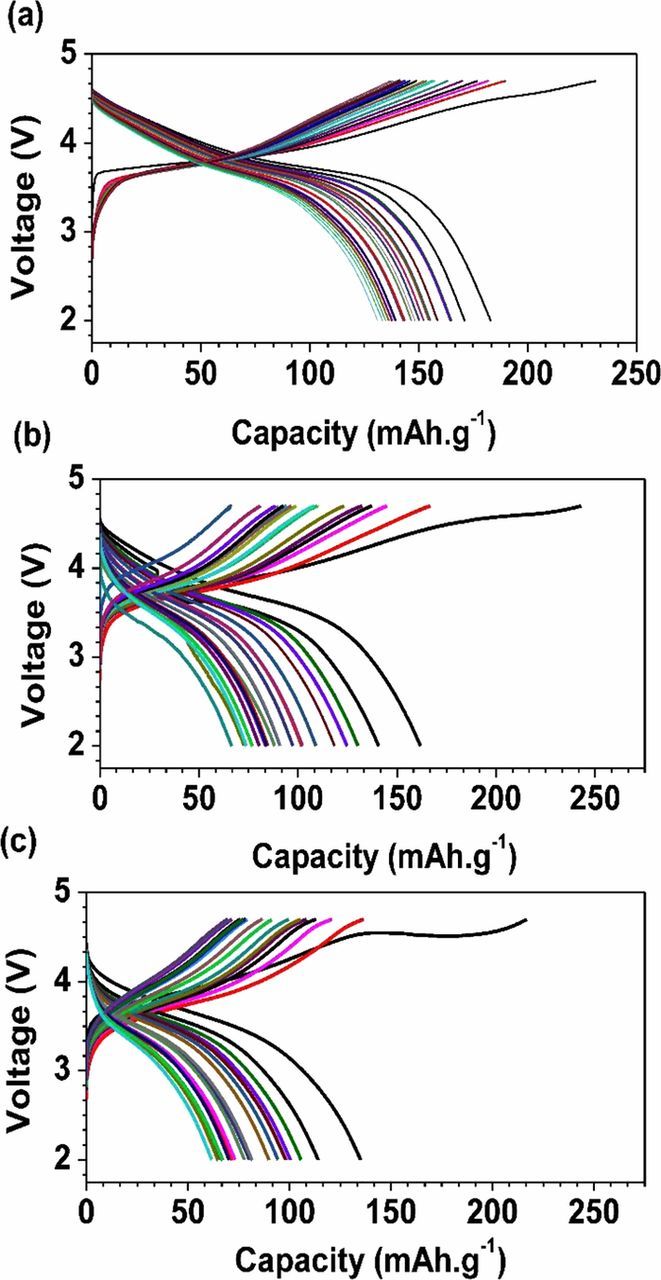
Figure 3. Voltage profiles for lithium cells containing NMC-442 materials milled for different lengths of time (0h, 1h and 3h), discharged and charged at 0.055 mA/cm2 between 2.0-4.7 V.
The plateaus indicating lithium carbonate decomposition are not evident in the voltage profiles of lithium half-cells containing ball-milled NMC cathodes charged and discharged between 2.0-4.3V or 4.5 V, as shown in Figure 2. In practice, the extraction of lithium from lithium carbonate is sluggish, resulting in significant overpotentials for the decomposition reaction.28
Ball milling NMC results in the reduction of both discharge capacities and Coulombic efficiencies (CE) during the first cycle for cells containing these materials. As indicated in Figure 1a, the first charge capacities of all three NMC cathodes exceed 210 mAh/g. However, the first discharge capacities vary considerably between the cells containing the pristine material and those containing ball-milled NMC. More than 220 mAh/g (4.7 V limit) was obtained for the former, while the discharge capacities of the NMC cathodes after one and three hours of ball milling were approximately 170 and 140 mAh/g, respectively. First cycle irreversible capacities are also higher for cells containing milled materials (38% and 32% compared to 19% for the one containing the pristine material, when the charge limit was 4.7 V). The decomposition of lithium carbonate adds to the first cycle Coulombic inefficiency but it should have little effect on the subsequent discharge. This dramatic degradation of performance suggests a possible structural change or a new secondary phase caused by the ball milling process, which can hinder the electrochemical performance and affects CE. Similar effects (lower charge and discharge capacities and higher Coulombic inefficiencies for milled materials) on electrochemical performance were observed when the upper voltage cutoff was limited to 4.5 or 4.3V (Figure 2) but overall capacities were lower in all cases. The deleterious effect of 3 hours of milling was particularly severe when the charge was limited to 4.3V, resulting in a first discharge capacity less than 100 mAh/g.
The effect of the ball milling time on the cycling performance of NMC cathodes is also clear. Figure 1b shows the discharge capacities obtained over 20 cycles at a current density of 0.055 mA/cm2 between 4.7-2.0 V for all three types of NMC cathodes. At these high potentials, electrolyte oxidation can occur, resulting in increased cell impedance, and apparent capacity fading.22 The smaller particle size and higher surface area of the milled NMC samples may exacerbate these processes, although the rate of fading in cells containing these materials is not markedly different than that of cells containing pristine NMC (instead, the milling results in an overall reduction of capacity on every cycle). Exacerbated capacity fading for cells containing milled materials was, however, observed when voltage limits of 4.5-2.0 V or 4.3-2.0 V for the ball-milled NMC cathodes, as seen in Figure 2. These results suggest that the effects of milling on electrochemical performance are not solely due to increased surface area and reactivity with electrolyte, as electrolyte oxidation should be minimal using these voltage cutoffs, particularly for 4.3 V.
NMC materials characterization
Figure 4 shows the XRD patterns of the pristine and ball-milled samples. The XRD results confirm that the NMC pristine material had the expected R m layered structure (red line in XRD pattern) with strong crystalline peaks, particularly the 2θ = 19°(003) peak. However, the ball-milled NMC materials show very obvious differences in the crystallinity as evidenced by peak broadening. There is also an impurity peak at around 2θ = 30°, marked with asterisks, attributable to Li2CO3,33 observable in the pattern of NMC ball-milled 3 hours. The zoomed-in sections in Figure 4b show the peak broadening induced by ball milling, and the merging of the doublet near 2θ = 65°, which suggests a loss of lamellarity. In well-layered structures, the (018) and (110) reflections are clearly separated, but in rock salt or spinel phases, only one peak near 2θ = 65° is observed. Another qualitative indication of how layered a structure is, is to determine the ratios between the integrated intensities of (003) and (104) peaks, which approximate the amount of cation mixing.3,32,34–37 Here, the ratio decreases with extended ball milling time (Table I). Table I also gives lattice parameters determined by Rietveld refinement, and the average crystallite size determined by the Scherrer equation. The a and c lattice parameters decreased with milling time, as did the average crystallite size. These results show that ball milling induced considerable disorder into the NMC material. It has been reported by Obrovac et al.25 that a rock salt phase is formed during mechanochemical synthesis of LiCoO2. Because of peak overlap and the considerable broadening seen in the patterns of the ball-milled materials, it is not possible to detect a rock salt phase using XRD here.
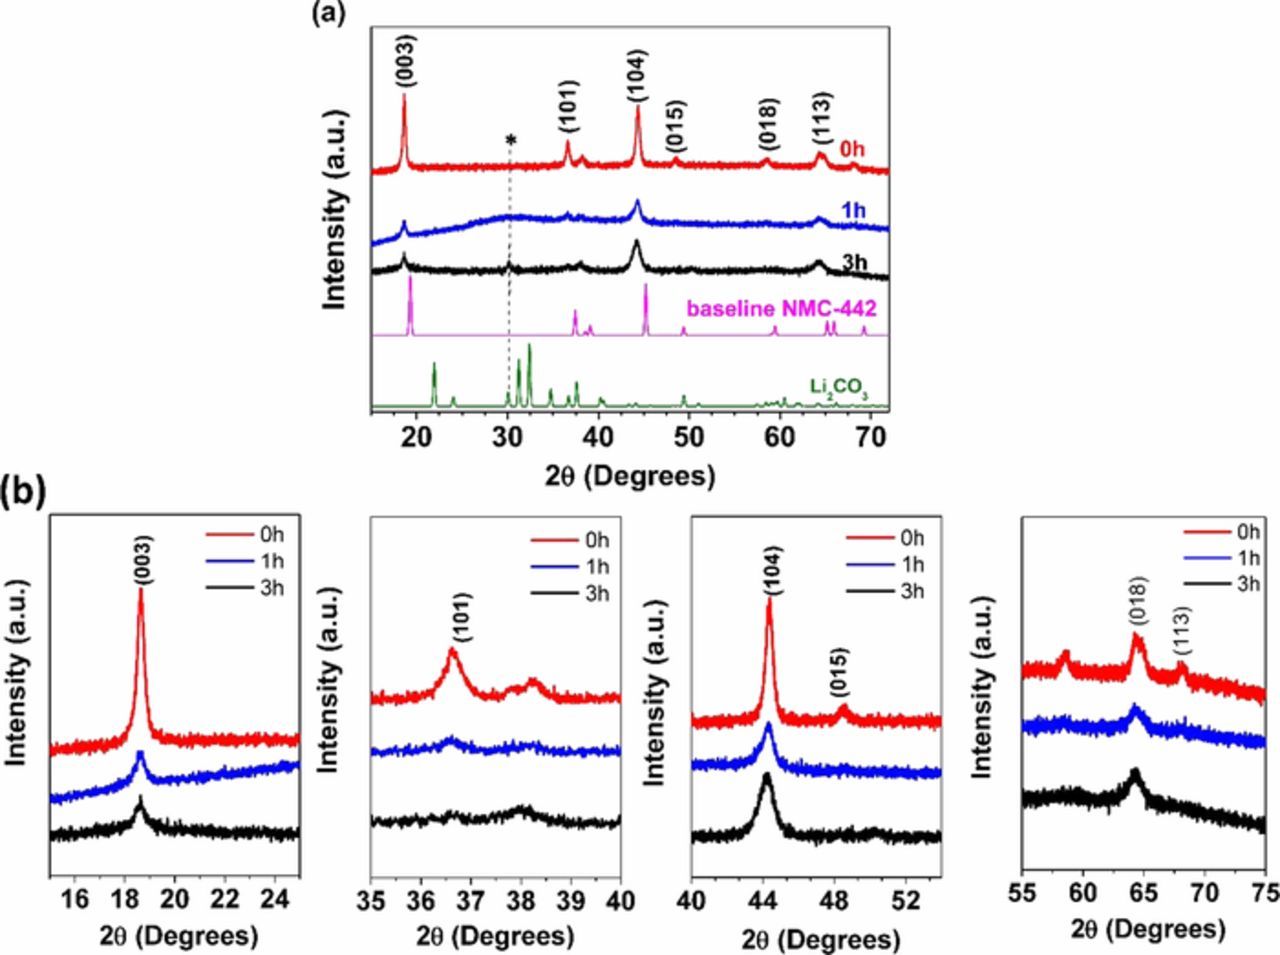
Figure 4. XRD patterns of NMC-442 samples. (a) from top to bottom, pristine NMC, ball-milled one hour, ball-milled 3 hours, theoretical NMC-442 pattern, and Li2CO3 pattern.32 (b) selected zoomed in areas of milled and pristine NMC samples.
Table I. Physical characteristics of NMC-442 samples.
| Unit cell parameters (A)a | |||||
|---|---|---|---|---|---|
| Ball milling time (hour) | a | c | R003/104 | Average crystallite size (nm)b | BET specific surface area (M2g−1) c |
| 0h | 2.876 | 14.28 | 1.24 | 130 | 14.08 |
| 1h | 2.862 | 14.26 | 0.86 | 90 | 34.20 |
| 3h | 2.865 | 14.25 | 0.55 | 50 | 37.11 |
aFull pattern matching using  .
bFrom Scherrer equation.
cMeasured by N2 physisorption using the Brunauer-Emmett-Teller method (BET).
.
bFrom Scherrer equation.
cMeasured by N2 physisorption using the Brunauer-Emmett-Teller method (BET).
SEM and TEM analysis
The chemical compositions and morphologies of the NMC materials were studied by SEM-EDS. The EDS analysis provided an estimate of the chemical composition for the pristine materials of NMC: Ni ∼43.0%, Mn ∼37.8%, Co ∼6.9%, and Ti∼2.4%, somewhat more Ni-rich than the targeted chemical composition, and similar to that reported by Kam et al. using a similar synthetic protocol.32 The micrographs (SEM) of these NMC samples are shown in Figure 5. The pristine NMC sample is made up of large secondary particles, containing primary particles of irregular shapes. These ranged in size from 110–130 nm in diameter, and the boundaries between different particles are clearly distinguishable (Figure 5a). The primary particle size for the sample ball-milled for one hour is only slightly reduced to about 80–100 nm (Figure 5b), in agreement with the XRD data. The NMC particles are still agglomerated into larger secondary particles. After 3 hours of ball milling, there is a further reduction in primary particle size to about 50–60 nm (Figure 5c). The small particles agglomerate to form considerably larger secondary particles compared to the pristine materials after 3 hours ball milling.
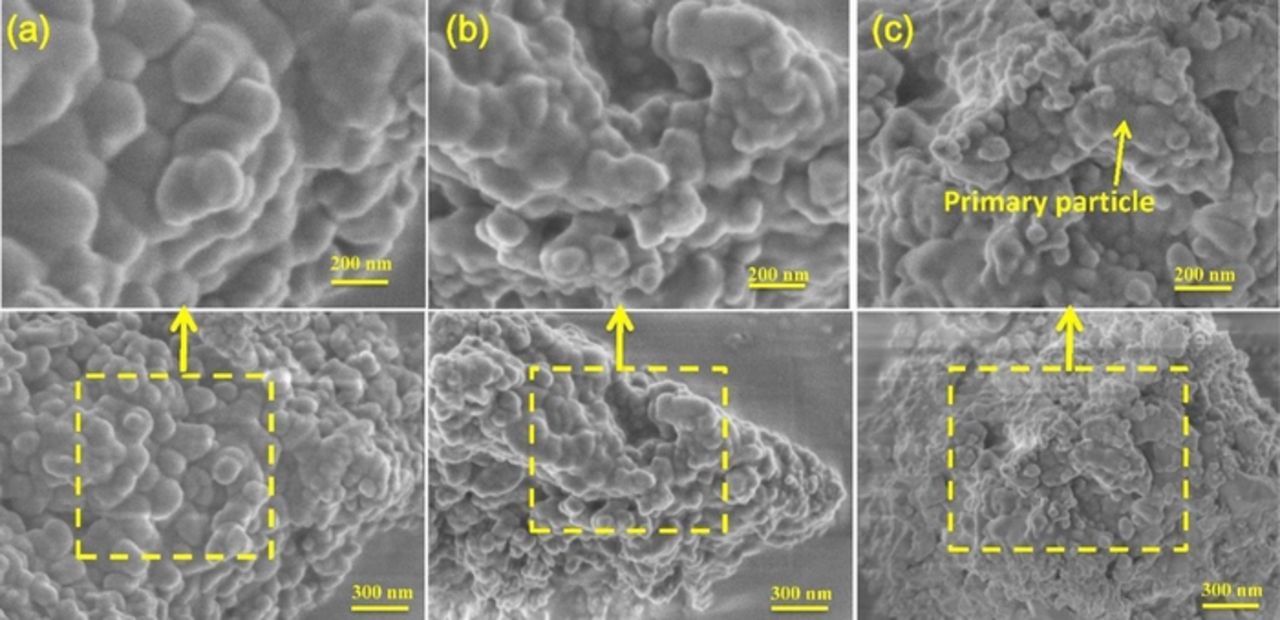
Figure 5. SEM images of NMC-442 particles ball-milled for different durations (a) 0 hours, (b) 1 hour, and (c) 3 hours.
Brunauer-Emmett-Teller (BET) characterization was conducted to obtain the specific surface areas of the pristine and ball-milled samples through N2 physisorption. The surface areas of NMC particles are roughly related to the average particle size and increased with milling time (Table I), with the largest differences seen between the pristine material and the one milled for one hour. The higher surface area of the ball-milled samples may contribute to the increased first cycle Coulombic inefficiency observed for cells containing these materials, charged to 4.7 V and discharged to 2.0 V, due to amplified irreversible electrolyte oxidation.
The XRD and SEM results indicate that structural changes occurred during the ball milling of NMC. To better understand these effects, the sample ball-milled for 3 hours was further studied by high resolution TEM. Previous studies on the pristine material22 show that it has a well-ordered lamellar structure. Figure 6a shows STEM images taken on pristine NMC particles. The pristine NMC materials exhibit the expected
R m layered structure, with well-organized transition metal layers observed in the image. Figure 6b shows a particle of the sample milled for 3 hours. After 3 hours milling, some of the particles converted almost completely into the rock salt structure. One of these NMC particles is shown in Figure 6b. The fast Fourier transform of Figure 6b shows that TEM imaging was performed along the Fm
 m [110] zone axis. The FFT patterns from the region marked by a yellow dashed square in Fig. 6b shows evidence of the conversion of the R
 m structure to the Fm
 m structure. The selected area Fast Fourier transform pattern of the bulk (Figure 6b) also shows considerable streaking consistent with disorder. This adds to the evidence that ball milling induced structural changes in the NMC phase, not only at the surface but also in the bulk.
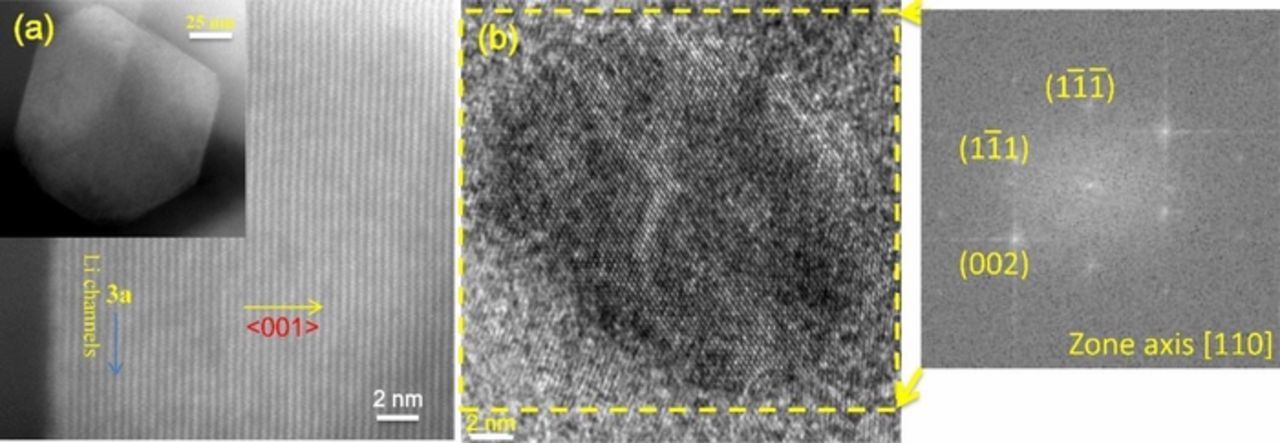
Figure 6. Representative STEM images of pristine NMC-442 materials with arrows indicating the Li channels. (b) Representative HR-TEM images of NMC-442 ball-milled for 3 hours (left), the FFT pattern from yellow dashed square area of image (b) oriented along the [110] direction shown on right.
Materials characterization-soft (XAS)
A limited number of particles can be studied using STEM, making it a challenge to obtain information on the average bulk structure. In contrast, soft X-ray absorption spectroscopy may be used to obtain ensemble-averaged information about the electronic structure of materials;38 the spot size diameter is 1 mm, so that a large number of small particles are probed during the experiment. Another advantage is the capability of doing depth profiling of electrodes by using different detection modes, such as total electron yield (TEY, ∼5 nm) and fluorescence yield (FY, 50–100 nm). The FY probing depth is close to the average primary particle size of the NMC materials, so it can be considered to give information about the electronic structure in the bulk, while TEY mode probes surfaces. Specifically, in soft XAS experiments, the dipole allowed 2p-3d transitions in L-edge transition metal experiments are observed, and give information about valence states, spin states, and symmetry.39 These spectra are spin-orbit split into an L2-edge (2p1/2) at higher energy and an L3-edge (2p3/2) at lower energy. The XAS L3-edge spectra of Co, Mn and Ni (Figure 7) in TEY and FY modes are shown for the pristine and ball-milled samples in Figure 7. For the pristine material, the oxidation states of Ni, Mn, and Co are expected to be +2, +4 and +3, based on previous XAS studies.40,41 The XAS spectra show L3 doublet peaks for Ni2+ and Mn4+ and a single peak for Co3+, as expected. A lower energy shoulder is observed for the Co L3 edge for both ball-milled samples (Figure 7a), consistent with reduction of some trivalent Co3+ to the divalent state. This is observed in both the TEY and FY modes, indicating that reduction happened in the bulk as well as at the surface. A very slight reduction at both sampling depths was also observed for Mn, as evidenced by the marginally increased intensity on the low energy side of the L3 peaks. For Ni, the ratio between the L3high and L3low peaks is a sensitive indicator of the relative oxidation state. Table II lists these values. The lower ratios for the milled samples indicate that reduction of Ni occurred, particularly near the surface. According to the EDS elemental analysis, this sample was slightly Ni-rich, so that the initial average oxidation state of Ni in the pristine state was probably slightly greater than +2. Reduction of transition metals is consistent with the formation of rock salt observed in the microscopy discussed above.
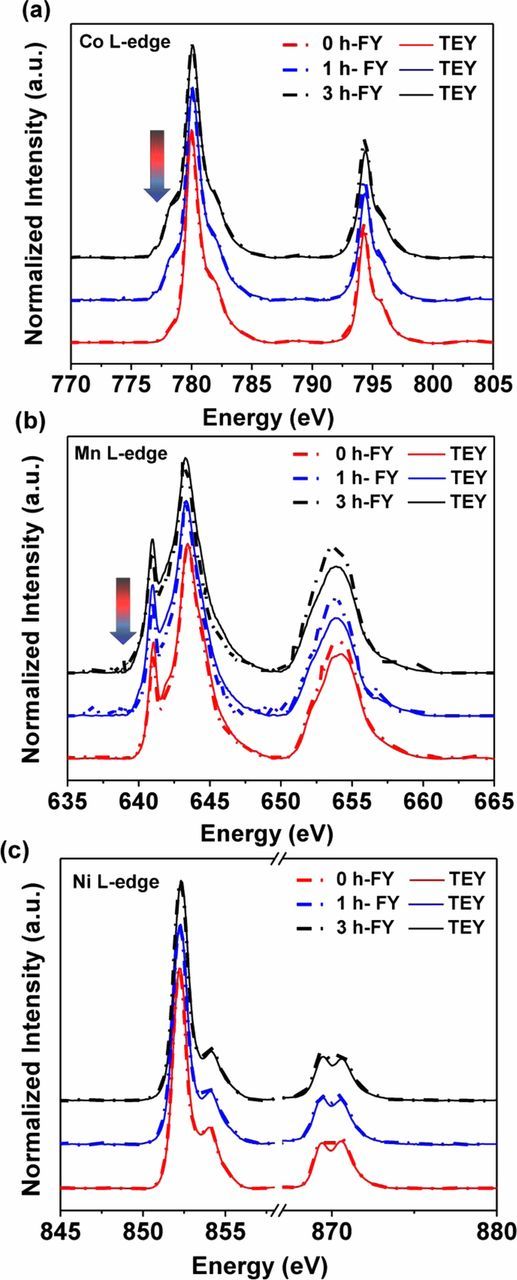
Figure 7. (a) Co L-edge XAS spectra in TEY and FY modes of NMC-442 samples as a function of milling time. Arrow shows area of increased intensity diagnostic of metal reduction. (b) Mn L-edge XAS spectra in TEY and FY modes of NMC-442 samples as a function of milling time. Arrow shows area of increased intensity diagnostic of slight metal reduction. (c) Ni L-edge XAS spectra in TEY and FY modes of NMC-442 samples as a function of milling time.
Table II. Ratios of Ni L3high/L3low peaks for NMC-442 samples.
| Ball milling time (hours) | TEY | FY |
|---|---|---|
| 0h | 0.34 | 0.35 |
| 1h | 0.28 | 0.34 |
| 3h | 0.25 | 0.28 |
The O K-edge data for the NMC materials after different ball milling durations is shown in Figure 8. The O K-edge includes a higher energy region (>535 eV) basically associated with O 1s transitions to hybridized TM4sp-O2p states and a lower energy region (<535 eV) mainly originating from O1s transitions to TM3d-O2p hybridized states.42 The lower energy region of O K-edge is of most interest here. Three peaks or shoulders (labeled 1, 2, and 3 in Figs. 8a and 8b) can be assigned by comparison to standard samples. Peak 1 around 530 eV can be attributed to Mn4+3d-O2p, Ni3+3d-O2p, or Co3+3d-O2p hybridization. Peak 2 (532 eV) mainly arises from the contribution of Mn4+3d-O2p or Ni2+3d-O2p bonds. Peak 3 (534 eV) corresponds to the presence of Li2CO3. In all regions, there is some overlap of TM-O signals, making definitive assignment difficult, as discussed in Reference 43. The peak at 534 eV in the TEY spectra for the ball-milled NMC materials is much more prominent than for the pristine material, and also appears in the FY spectra, while it is absent for the pristine material. Thus, it is reasonable to assign this to the presence of lithium carbonate in the ball-milled materials, as also evidenced by the XRD data. The lithium carbonate compound is frequently detected as a stable by-product on the particle surfaces of nickel-rich lithium-host materials.44–46 The XAS data suggests that a small amount of Li2CO3 may have already been present on surfaces of the pristine material, to a depth of about 5 nm, but the amount greatly increased after ballmilling, judging from the signal seen in FY mode, probing the bulk.
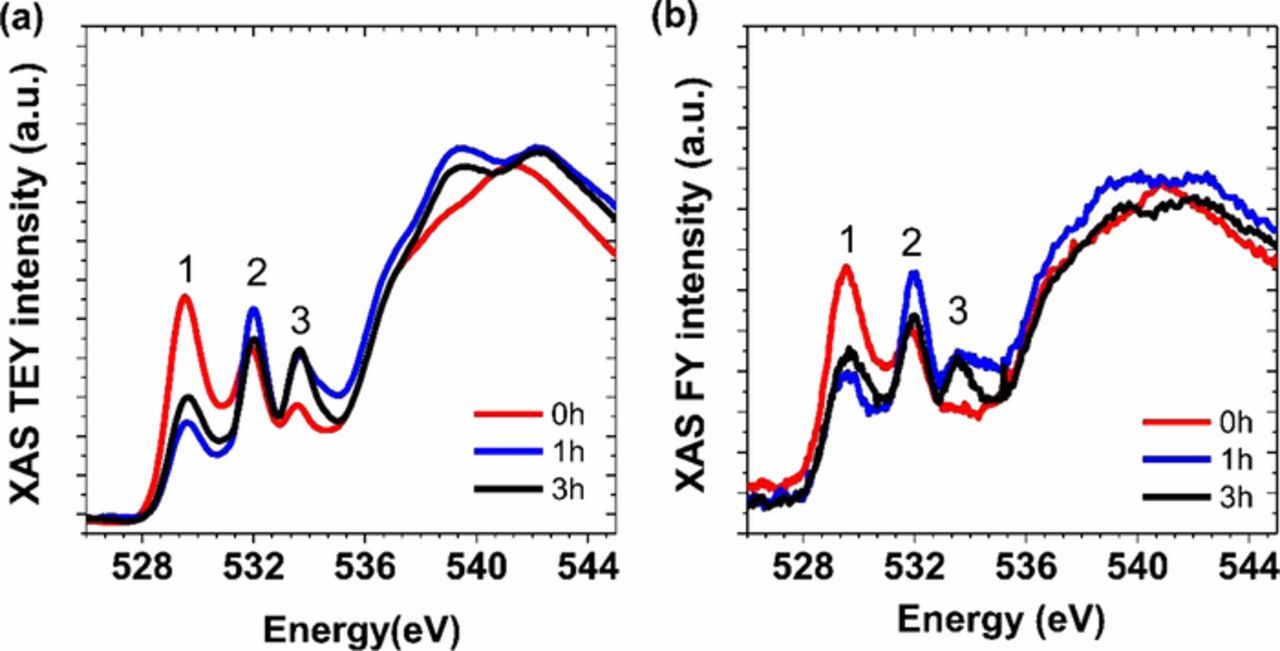
Figure 8. O K-edge XAS spectra in TEY (a) and FY (b) modes of NMC-442 samples as a function of milling time.
The integrated intensities of the TM3d-O2p hybridization peaks in FY and TEY mode appear to be somewhat lower for the milled NMC than for the pristine material, indicating that the bulk in the NMC-442 particles has fewer TM3d-O2p unoccupied states, consistent with metal reduction. This is particularly true for peak 1, which has some contributions from Ni3+.
These results, taken together, indicate that ball milling induces severe degradation in NMC materials. Disordering of the material induced by the milling process results in reduction of transition metals both in the bulk and at the surface. The reduction occurs in conjunction with lithium and oxygen loss. Reaction of lithia with carbon dioxide in air results in the formation of lithium carbonate. These changes have severe consequences for electrochemical performance, resulting in lower initial discharge capacities, higher first cycle Coulombic inefficiencies and poorer capacity retention upon cycling, particularly when upper voltage cutoffs of 4.3 or 4.5 V are used. The milling also results in a reduction in average primary particle size and an increase in surface area, but this, somewhat surprisingly, has little effect on capacity retention when a 4.7 V charging limit is used, suggesting that the structural changes and formation of lithium carbonate have the largest negative effects on the electrochemistry.
Conclusions
In summary, we have shown that the effects of structural changes caused by ball milling have deleterious effects on the performance of NMC-442 cathode materials during electrochemical cycling. Along with a reduction in particle size, ball milling causes disordering of the layered structure, reduction of transition metals, and the formation of rock salt phases and lithium carbonate, as evidenced by XRD, soft XAS, and TEM results. These changes are correlated with higher Coulombic inefficiencies, lower initial capacities, and capacity fading during cycling to high voltage, but harmful effects were also observed even when upper voltage limits of 4.5 or 4.3 V were used.
Acknowledgments
This work was supported by the Assistant Secretary for Energy Efficiency and Renewable Energy, Office of Vehicle Technologies of the U.S. Department of Energy under Contract No. DE-AC02-05CH11231. The synchrotron X-ray characterization of this work was performed at the Stanford Synchrotron Radiation Lightsource (SSRL), a Directorate of SLAC National Accelerator Laboratory and an Office of Science User Facility operated for the U.S. Department of Energy Office of Science by Stanford University. TP is grateful for the financial support of the National Natural Science Foundation of China under grant No. 51101023. The research was partially funded by the Jiangsu Province Science and Technology Project (BY2016029-07). TP also thanks the China Scholarship Council and the Six Talent Peaks Project of Jiangsu, and the Priority Academic Program Development of Jiangsu Higher Education Institutions (PAPD). This author also acknowledges the contribution of Hua Guo from Rice University for help constructing Figure 6 and the contribution of Xiangyun Song from Lawrence Berkeley National Laboratory for the BET measurement.
This document was prepared as an account of work sponsored by the United States Government. While this document is believed to contain correct information, neither the United States Government nor any agency thereof, nor the Regents of the University of California, nor any of their employees, makes any warranty, express or implied, or assumes any legal responsibility for the accuracy, completeness, or usefulness of any information, apparatus, product, or process disclosed, or represents that its use would not infringe privately owned rights. Reference herein to any specific commercial product, process, or service by its trade name, trademark, manufacturer, or otherwise, does not necessarily constitute or imply its endorsement, recommendation, or favoring by the United States Government or any agency thereof, or the Regents of the University of California. The views and opinions of authors expressed herein do not necessarily state or reflect those of the United States Government or any agency thereof or the Regents of the University of California.