Abstract
In the pursuit of surpassing the energy density of conventional lithium ion cells, significant efforts have been made to develop lithium metal cells. However, many reports in the literature utilize Li-metal cells with significant excess lithium, resulting in a dramatically reduced practical energy density. In contrast, anode-free cells do not utilize excess lithium; instead, a lithium metal anode is formed in-situ from the stored lithium within the positive electrode during the first charge. Here, we evaluate anode-free lithium metal pouch cells (NMC532||Cu) with operando pressure measurements constrained to different stack pressures between 75–2205 kPa with two different electrolytes, 1M LiPF6 FEC:DEC (1:2) and 1M LiPF6 FEC:TFEC (1:2). Increasing the initial average pressure from 75–2200 kPa was found to generally improve cycle life, with the most significant benefits achieved up to 1200 kPa. Cells containing FEC:TFEC electrolyte exhibited a superior initial performance compared to FEC:DEC cells, as evidenced by cycling data and SEM analysis of the lithium morphology. Although generally beneficial, we found that the effect of increased pressure on the performance of cells with different solvent systems was not equal, indicating that the physical properties of electrolyte play an important roll in cells constrained to higher pressures between 1200–2200 kPa.
Export citation and abstract BibTeX RIS

This is an open access article distributed under the terms of the Creative Commons Attribution 4.0 License (CC BY, http://creativecommons.org/licenses/by/4.0/), which permits unrestricted reuse of the work in any medium, provided the original work is properly cited.
Lithium metal cells are highly desirable due to the large theoretical volumetric capacity of lithium metal (2060 mAh/L) compared to that of graphite (719 mAh/L), the most common negative electrode currently used in conventional lithium ion (Li-ion) cells.1,2 However, much of the research focused on lithium metal cells employs significant excess lithium.3–8 Often little regard is given to the practical consequence of utilizing excess lithium: at 200% excess, the theoretical volumetric capacity of lithium metal is reduced to 687 mAh/L, lower than that of graphite.9 This does not make for a practical cell since the desired energy density boost is not achieved while the other pitfalls that plague lithium metal cells, namely poor cycling efficiency and safety concerns, remain.2,10 Furthermore, producing Li-metal cells with excess lithium requires the manufacturing and handling of thin lithium metal foil for cell construction which will increase cost.11 Reports which utilize significant excess lithium can exhibit cells with phenomenal cycle life, generally exceeding hundreds of cycles with little capacity fade. However, such cells exhibit a coulometric efficiency artificially inflated by the significant Li excess—any loss of lithium inventory can be replaced from the vast reservoir.12 Therefore, cells that employ significant excess lithium do not accurately portray the cycle life of practical Li-metal cells. For these reasons, Li-metal cells with significant excess lithium are not a commercially viable successor to conventional Li-ion cells.13,14
In contrast, so-called "lithium-free" or "anode-free" cells are Li-metal cells which do not employ excess lithium.15,16 Anode-free cells are constructed in the discharged state, analogous to conventional Li-ion cells, wherein all lithium is initially stored within the positive electrode. During first charge, lithium ions from the positive electrode are plated on a bare current collector, thus forming a lithium metal negative electrode in-situ. As such, the drawbacks of Li-metal cells with excess lithium previously described are minimized: the full theoretical capacity of Li metal is possible; manufacturing cells with lithium metal is not required; safety may be improved by using the minimum amount of active lithium. However, achieving long cycle life for anode-free cells remains a difficult challenge. Indeed, the cycle life of anode-free cells will undoubtably appear worse than cells with excess lithium, but one must realize that this is the true cycling efficiency of lithium metal unexaggerated by a vast lithium reservoir.12
The poor cycling efficiency of lithium metal cells can be attributed to the high reactivity of lithium metal, its massive volume change during cycling, and its tendency to deposit dendritically.1,2,10 The low redox potential of lithium (−3.04 V vs the standard hydrogen electrode (SHE)) is ideal for constructing high energy cells; however, this puts lithium metal outside the electrochemical stability window of virtually any conventional electrolyte.5,17,18 This results in Li-electrolyte reactions which irreversibly consume lithium inventory and form a solid electrolyte interphase (SEI) on the anode. In conventional Li-ion cells, the SEI successfully passivates the graphite anode, which exhibits minimal (<10%) volume change during cycling. However, in Li-metal cells the anode exhibits infinite relative volume change as a result of the hostless-formation and dissolution during charge and discharge, practically resulting in a thickness change of ∼15 μm when plating an areal capacity of 3 mAh/cm2 of lithium.2 Such massive volume changes cause significant mechanical stress which generally cannot be accommodated by an inflexible SEI, causing damage to the SEI thus exposing lithium metal again to electrolyte precipitating further Li-electrolyte reactions.19 As such, SEI is continually formed with each cycle, continually consuming lithium inventory and decreasing cell capacity.
Dendritic deposition of lithium metal during electroplating is another threat to the stability of Li-metal cells.20 Instead of forming a planar, smooth morphology, lithium metal tends to plate non-uniformly. This results in the formation of lithium protrusions which experience higher current densities during charging, preferentially attracting further deposition atop these non-uniformities increasing their size.2,21,22 This causes a self-accelerating positive feedback deposition process resulting in a porous, mossy or needle-like morphology generally referred to as dendritic.1 Such non-uniform deposition generates large surface areas, increasing the amount of Li-electrolyte reactions and thus lithium inventory loss to SEI growth. Furthermore, dendritic depositions are susceptible to electrical disconnection. This occurs when the base of dendrites are stripped away during discharge, disconnecting the remainder of the lithium growth from the bulk rendering it electrochemically inaccessible.23 This is known as lithium loss via the formation of dead-lithium, another major mode of capacity loss for Li-metal cells. A recent report by Fang et al. has identified lithium loss by the formation of dead-lithium as the primary mode of capacity loss for Li-metal cells, not SEI formation.24 In either case, forming a uniform, low surface area lithium morphology is critical for stable cycling and enhanced safety of Li-metal cells.19,25 To this end, researchers have deployed many electrochemical and mechanical solutions.
Electrolyte development has played a large role in increasing the cycling stability of lithium metal. The choice of electrolyte solvents,5,6,26,27 salts6–8,27,28 and additives3,7,22,29–32 affect the Li-electrolyte reactions and modify the resulting SEI.19 This has been shown to help create a more uniform lithium morphology.5,30 The introduction of fluorinated solvents such as fluoroethylene carbonate (FEC) has been shown to improve the cycle life of Li-metal cells.5,27 Additionally, bis(2,2,2-trifluoroethyl) carbonate (TFEC) has been shown to further increasing the cycling efficiency of Li-metal.33 Applications of mechanical solutions to maintain a stable lithium morphology generally focus on the creation of an artificial SEI34,35 or other interfacial layers36,37 to discourage dendrite formation and minimize Li-electrolyte reactions. Although such strategies to protect lithium may be successful, they will undoubtedly lead to technological challenges and manufacturing complexity thus increasing cell cost compared to utilizing a liquid electrolyte. It is also important to consider the substrate upon which lithium is deposited, whether it is bare copper, lithium, or another specially treated surface, as this will also affect lithium morphology. Previous reports have shown how the faceted structure and surface roughness of the initial substrate impacts lithium plating, and that it is generally preferred to plate on a uniform substrate to avoid variations in current density which can spawn dendrites.38,39 Furthermore, it has been shown that the application of mechanical pressure is beneficial to the cycle life of and plating morphology Li-metal cells.40,41 Force-displacement measurements performed at increasing pressures up to 200 PSI (∼1400 kPa) revealed that the electrode stack thickness of Li-metal cells increased with cycling concomitant with capacity loss, likely as a result of porous dendritic lithium growth, accumulation of dead-lithium and SEI growth.42 The benefit of applied pressure is thus to confine lithium growth and plastically deform dendrites to maintain a more planar, low surface area morphology.43
In this present work, we study the performance of anode-free (NMC532||Cu) Li-metal pouch cells with lean liquid electrolyte (∼3 g/Ah) using two different fluorinated solvent chemistries while constrained to increasing mechanical pressures. Instead of the conventional carbonate solvent blend ethylene carbonate:dimethyl carbonate (EC:DEC) used in Li-ion electrolytes, we employ modified fluorinated analogs of to increase the cycling stability of anode-free cells. Fluoroethylene carbonate (FEC) and bis(2,2,2-trifluoroethyl) carbonate (TFEC), the fluorinated analogs of EC and DEC, respectively, were tested in two electrolyte blends, FEC:DEC (1:2) and FEC:TFEC (1:2) with 1.0 M lithium hexafluorophosphate (LiPF6) salt. Cells were tested while physically constrained to pressures between 75–2200 kPa, and operando pressure measurements were performed to monitor the irreversible expansion of the lithium metal anode during cycling. The performance of anode-free cells as a function of applied pressure were evaluated by capacity retention, polarization growth and operando pressure measurements, and the lithium morphology was evaluated with scanning electron microscopy. We show here how the performance of anode-free cells depends strongly on the applied pressure and choice of electrolyte, and how these parameters are coupled.
Experimental
Cell preparation
Machine-made anode-free pouch cells with NMC532 positive electrodes (i.e. NMC532 vs bare copper foil) with a rolled electrode design were used in this work. Figure 1a shows an anode-free pouch cell (left) compared to a typical Li-ion cell (NMC532/graphite, right). The NMC532/graphite Li-ion cell is a 402035-size (40 mm long, 20 mm wide x 3.5 mm thick) pouch cell. The anode-free cell utilizes the exact same positive electrode and thus has the same capacity as the Li-ion cell of 230 mAh. The absence of negative electrode coating in the anode-free cell results in a total stack thickness of 2.0 mm, and therefore a 402020-size cell. Figure 1b shows single cell stack schematics for an anode-free cell in the discharged state (left), an anode-free cell in the charged state with plated lithium (middle), and a Li-ion cell (right). The stacks are built up of two layers of separator (13.5 μm each, white), an aluminum current collector (15 μm, gray), a double sided positive electrode coating (60 μm each side, black), and a copper current collector (8 μm, orange). Additionally, the anode-free cell in the charged state has lithium plated (18 μm each side, silver) on copper foil, and the Li-ion cell has a graphite negative electrode (80 μm each side, dark gray) coated on the copper foil. Summing up the components of each stack results in stack thicknesses of 170 μm for the discharged anode-free cell, 205 μm for the charged anode-free cell, and 330 μm for the Li-ion cell. The anode-free cell stack is significantly thinner than the Li-ion cell stack, even in the charged state when most voluminous. This, along with the 0.1 V increased average voltage during operation of an anode-free cell results in a theoretical energy density approximately 60% larger than a comparable Li-ion cell (1220 vs 725 Wh/L) as shown in Figure 1b.
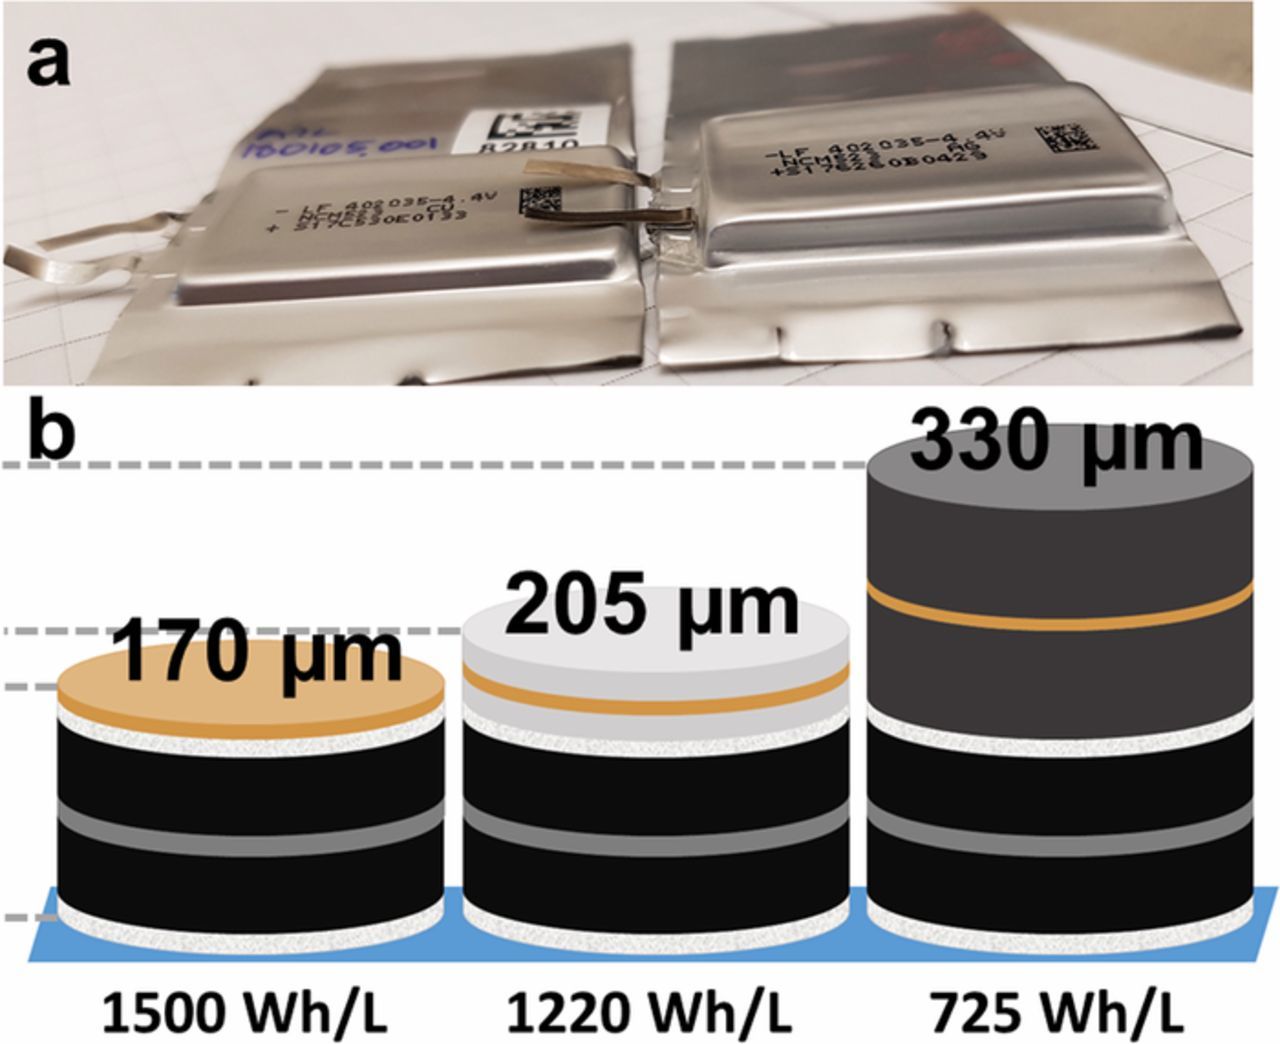
Figure 1. (a) Anode-free pouch cell (NMC532/Cu) used in this work (left) compared to a typical Li-ion cell (NMC532/graphite, right) with the same capacity. (b) Schematic of single cell stacks for an anode-free cell in the discharged state (left), an anode-free cell in the charged state with plated lithium (middle), and a Li-ion cell with a graphite negative electrode (right). The cell stacks comprise of separators (13.5 μm, white), positive electrode coatings (60 μm, black), an aluminum current collector (15 μm, gray), a copper current collector (8 μm, orange), plated lithium (18 μm, silver), and negative electrode coatings (80 μm, dark gray). The theoretical stack energy density for each cell configuration is given.
Pouch cells were received from a reputable manufacturer (Li-Fun Technology Co.) sealed without electrolyte. Cells were opened, dried under vacuum at 100°C for 14 hours, and transferred into an argon-filled glove box for electrolyte filling and resealing. Reagents used for electrolytes include fluoroethylene carbonate (FEC, BASF, purity 99.4%), diethyl carbonate (DEC, BASF, purity >99%), and bis(2,2,2-trifluoroethyl) carbonate (TFEC, HSC Corporation (China), >99%). Two electrolyte solvent systems were used in this work, FEC:DEC 1:2 v:v and FEC:TFEC 1:2 v:v. All electrolyte contained 1.0 M lithium hexafluorophosphate (LiPF6, BASF, purity >99.9%). Cells were filled with 0.5 mL of electrolyte, corresponding to ca. 0.65 g for the FEC:DEC electrolyte and 0.75 g for the FEC:TFEC electrolyte, resulting in practical electrolyte loadings of ∼3 g/Ah. After filling, cells were held at 1.5 V for 24 hours to allow the electrolyte to fully wet the positive electrode and separator before testing.
Cycling conditions
To maintain a uniform lithium morphology for stable cycling, it is known that plating (charging) slow and stripping (discharging) fast is beneficial.16,44 Additionally, cycling with a low areal capacity further aids in maintaining a uniform morphology. However, current densities and areal loadings must still be rationally chosen to yield a useful cell. In this work, we cycle at a charging current density of 0.6 mA/cm2 and a discharging current density of 1.5 mA/cm2, corresponding to C/5 and D/2 (charge and discharge in 5 and 2 hours, respectively), and operate at an areal capacity of ∼3 mAh/cm2. Cells were cycled between 3.6−4.5 V. The NMC532 positive electrode has a ca. 30 mAh first cycle irreversible capacity loss only recoverable below 1.5 V. Therefore, by operating with a 3.6 V lower cut off voltage, a 30 mAh lithium reservoir is formed.12 This is analogous to operating with a limited lithium metal excess, without the drawbacks of constructing cells with lithium metal since the excess is formed in-situ. Additionally, 30 mAh corresponds to only 15% excess and a ∼2 μm thick lithium excess layer, thus not appreciably reducing the energy density like cell designs with significant excess lithium. As a result, only during the first charge is lithium plating on to bare copper; all subsequent charges begin plating on the ∼2 μm lithium layer formed on the copper current collector due to the irreversible capacity of the positive electrode. Therefore, out of the total 18 μm plated from the positive electrode, 16 μm are cycled reversibly. All tests were performed at 40°C.
Pressure measurements
Figure 2 shows the apparatus used to constrain pouch cells to different pressures as well as to record operando pressure data, as first described by Louli et al.45 Cells were constrained in a rigid enclosure, colloquially referred to as a "superboat" (SB), with a load cell (model LCKD, Omega Engineering), a disc spring, and two force distributing plates dividing the pouch cell, spring, and load cell, as pictured in Figure 2a and schematically shown in Figure 2b. The superboat enclosure has one adjustable wall which can be tightened with screws to exert different uniaxial pressures to the cell stack. Pouch cells were fastened within this enclosure such that any change of volume of the cell stack caused a change of force within the enclosure measured by the load cell. The pressure on the pouch cell was thus calculated as the force recorded by the load cell divided by the area of the pouch cell electrode stack, 6.0 cm2 (0.93 in2). The springs were inserted to dampen the change in pressure during cycling. Any gas evolved in the pouch cell during cycling is pushed in to the gas bag of the pouch cell and will not result in a change in pressure measured by the load cell; only uniaxial expansion of the cell stack is probed with this method.
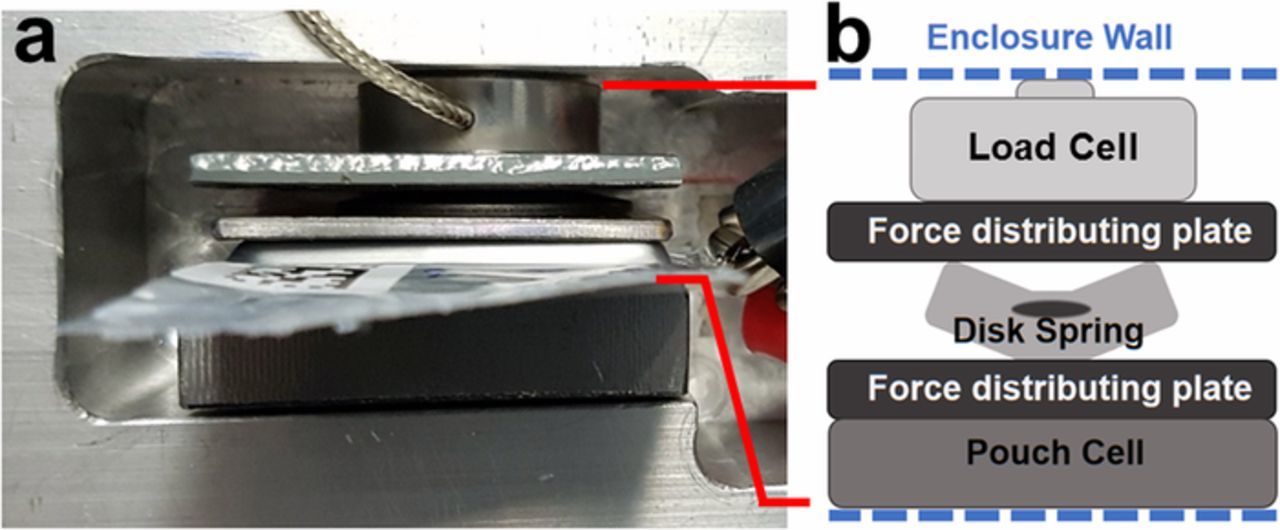
Figure 2. (a) Top view of the apparatus used for operando pressure measurements. The gas bag of the pouch cell is extending upward toward the reader. The load cell is the disc-shaped object with the braided wire attached. (b) Schematic of the operando pressure measurement apparatus. Pouch cells are fastened in rigid enclosures known as "superboats" (SB) with a disc spring, load cell, and two force distributing plates.
The load cells were connected to DP25B-S-A panel meters (Omega Engineering). Operando measurements were performed using an E-One Moli Energy Canada battery testing system. Pouch cells were cycled on Moli channels and the analog 0–10 V output of the panel meter was connected to an adjacent Moli "slave" channel, allowing for simultaneous electrochemical and pressure measurements.
Cells were constrained at the bottom of the first discharge (BOD) with different initial pressures. Tests were performed in the superboat (SB) enclosures shown in Figure 2 at initial pressure loadings of 75 kPa, 375 kPa, 745 kPa, 1260 kPa and 1855 kPa. It is important to note that during cycling this pressure does not remain fixed; as lithium is plated and the cell stack expands, the pressure within the superboat increases until some maximum pressure is reached at the top of charge (TOC). Therefore, an average pressure can be calculated for each pressure loading, listed in Table I. Additionally, the average pressure will evolve as a function of cycle number due to irreversible cell stack expansion concomitant with cycling.46 Control tests were also performed at a low pressure loading in plastic enclosures referred to as "normal boats" (NB), in which cells were clamped with rubber blocks. Load cells were not used for these low pressure tests, so operando pressure data was not collected. The pressure within a normal boat is known to be <75 kPa and remains relatively constant throughout testing due to the compliancy of the rubber blocks and plastic enclosure. In total, experiments were performed with initial average pressures of <75 kPa, 485 kPa, 795 kPa, 1205 kPa, 1725 kPa, and 2205 kPa. Hereafter, each pressure experiment will be referred to by these initial average pressures.
Table I. Force loading and average initial pressures for each testing condition. Cells were constrained in normal boats (NB) for low pressure tests, and superboats (SB) for high pressure tests. The force at the bottom of the initial discharge (BOD), top of the initial charge (TOC) and the initial average pressures are listed.
| Force at BOD | |||||
|---|---|---|---|---|---|
| Enclosure | (N) | (lbs) | Pressure at BOD (kPa) | Pressure at TOC (kPa) | Average Pressure (kPa) |
| NB | <45 | <10 | <75 | <75 | <75 |
| SB | 45 | 10 | 76 | 890 | 485 |
| SB | 222 | 50 | 372 | 1170 | 795 |
| SB | 445 | 100 | 744 | 1585 | 1205 |
| SB | 756 | 170 | 1260 | 2075 | 1725 |
| SB | 1112 | 250 | 1853 | 2720 | 2205 |
In-situ volume measurements
In-situ volume measurements were made to validate that operando pressure measurements correlate to the volume expansion of the electrode stack. These measurements were made using the apparatus developed by Aiken et al.47 Archimedes' principle was used to infer the change of volume of a pouch cell submerged in fluid by measuring the change in weight of the cell with a thin film load cell. The measured weight changes as the buoyant force acting on the cell changes concomitant with volume expansion. For in-situ measurements, the thin film load cell output was connected to a Keithley 2700 scanning voltmeter and the pouch cells were connected to a Neware BTS 5V-0.1A battery test system (Neware, Neware Technology Limited, 207 Meihua Road, Xiameilin, Shenzhen, China). A minimal pressure of <75 kPa was applied to the pouch cells during in-situ volume experiments by way of constraining clip.
To deconvolute the effect of gas evolution and irreversible electrode expansion on in-situ volume measurements, 0.2 cm3 open-ended tubes were inserted into the gas bag of the tested pouch cells, analogous to the procedure outlined by Krause et al.48 With the inserted tubes, gas generation will not result in a measured volume expansion until ca. 0.2 cm3 has been produced and the tube is filled. This was verified with measurements performed with and without an inserted tube, shown in SI Figure S1. Figure S1 shows that gas evolution begins to effect in-situ volume measurements of pouch cells with a 0.2 cm3 inserted tube after 3 cycles.
Scanning electron microscopy
SEM images were taken to investigate lithium plating morphology. Samples were retrieved from cells at the top of charge (4.5 V) after one charge and after 50 cycles. Cells were cut open inside an argon filled glove box and the negative electrode copper current collector with plated lithium was carefully removed from the cell stack. Samples of ca. 0.75 cm2 were cut and prepared on SEM stubs. Samples were then sealed in plastic bags and transferred out of the glove box to a Nano Science Phenom Pro G2 Desktop Scanning Electron Microscope with a backscattered electron detector. During this process, samples were exposed to air for <30 seconds when transferred from the plastic bag in to the SEM. The images of samples were taken with accelerating voltage of 5 kV and current of 0.6 nA.
Results
Volume expansion
Figure 3 shows the reversible volume expansion of anode-free cells with FEC:DEC electrolyte due to lithium plating and stripping during charge and discharge. Figure 3a shows voltage vs time for cells that underwent in-situ volume (red) and operando pressure experiments (blue). Figure 3b shows the corresponding in-situ volume data (red, left axis) and operando pressure data (blue, right axis). Cycles two and three are shown here. During charge, lithium ions are de-intercalated from the positive electrode and plated on the copper current collector, thickening the electrode stack resulting in a volume expansion and increase of pressure in these experiments. Cells were cycled with a constant current, thus the thickness of the plated lithium increased linearly. The volume expansion due to lithium plating after one charge is shown to be ca. 0.15 cm3. These cells have a cross sectional area of ca. 6 cm2, therefore this volume expansion corresponds to a thickness increase of ∼250 μm. The expected thickness change can be calculated by determining the amount of lithium stored in the positive electrode that is plated during charge. The NMC532 positive electrode has a loading of 21.1 mg/cm2 at 96% active loading. The positive electrode capacity is 180 mAh/g over the voltage range cycled here, and the irreversible capacity of the positive electrode is ca. 10%. Thus, the areal capacity of the positive electrode can be calculated:
- (1) 21.1 mg/cm2 * 0.96 * 180 mAh/g * (1-0.1) = 3.28 mAh/cm2.
Using Faraday's number, the molar mass and density of Li, the thickness of 1 mAh of plated lithium can be calculated:
- (2) 26801 mAh/mol/6.941 g/mol * 0.534 g/cm3 * 1 cm2 = 2062 mAh/cm
- (3) 1 mAh/2062 mAh/cm = 4.85 μm.
One layer of lithium plated from the positive electrode is thus:
- (4) 3.28 mAh * 4.85 um = 15.9 μm.
These cells feature a rolled electrode design and have 16 layers of positive electrode. Therefore, the corresponding thickness of 16 layers of plated lithium is:
- (5) 15.9 μm * 16 = 254.4 μm
which in good agreement with the in-situ volume results.
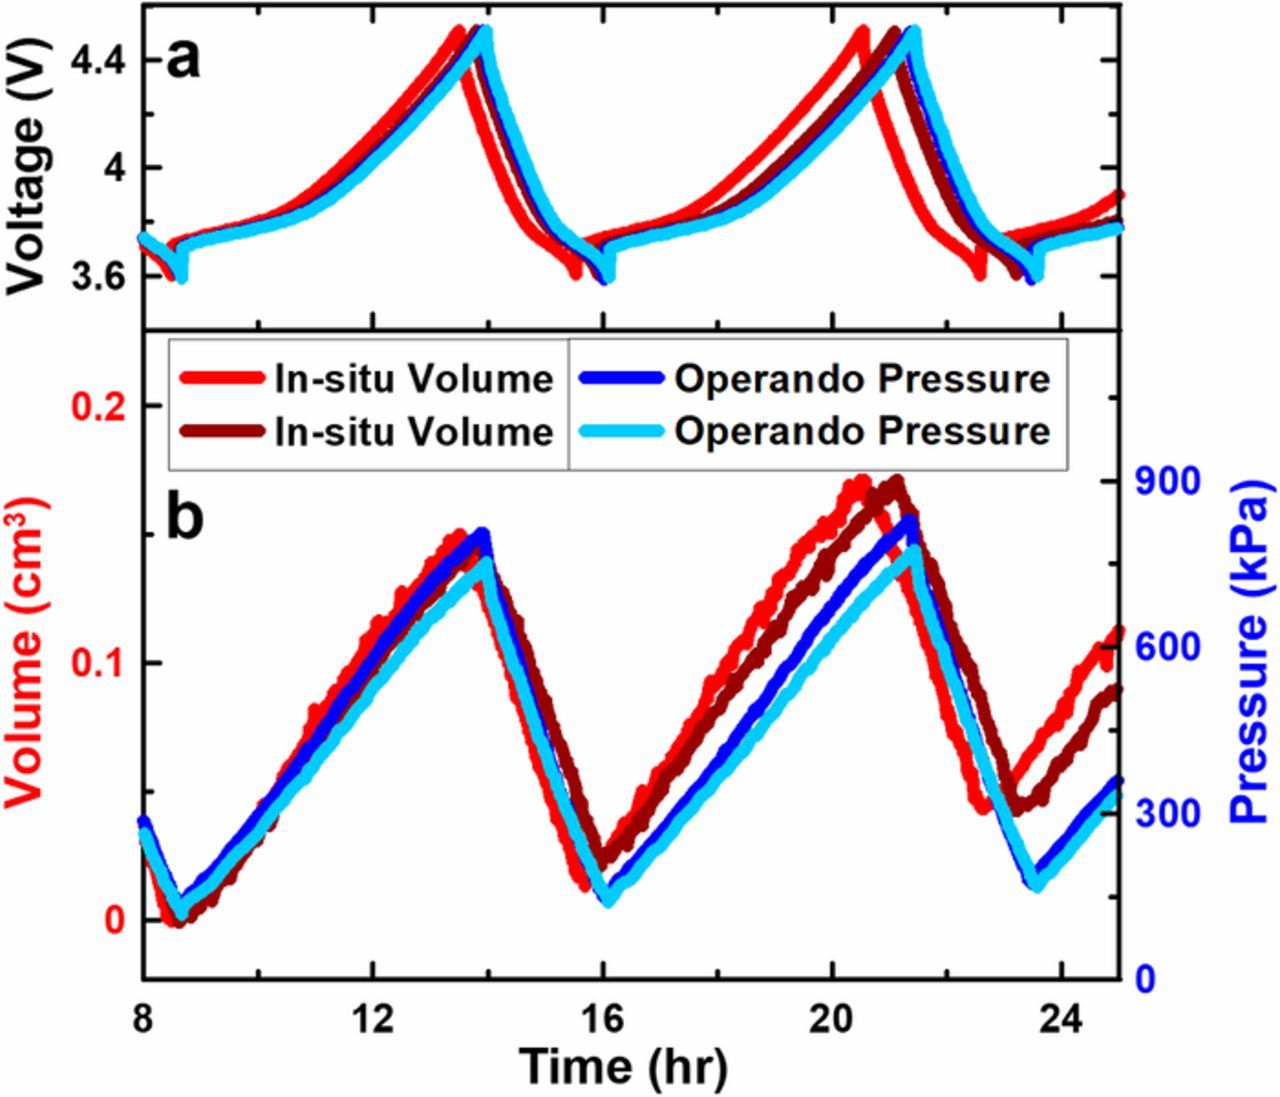
Figure 3. In-situ volume (shown in red) and operando pressure measurements (shown in blue) for cells containing FEC:DEC electrolyte. (a) Voltage vs time and (b) volume vs time (left axis) and pressure vs time (right axis) shown for cycle 2 and 3. Repeat tests are shown in different shades. The in-situ volume data shows a 0.15 cm3 volume expansion during charge, corresponding to a 250 μm increase in thickness of the 6 cm2 stack.
The first plating/stripping cycle shown in Figure 3b exhibits excellent agreement between the in-situ volume and operando pressure results. Negligible irreversible expansion is observed with either measurement. The second cycle shown in Figure 3b also exhibits no irreversible expansion for the operando pressure measurements; however, there is an irreversible expansion observed by the in-situ volume measurements. This is caused by gas evolution which is detected with the in-situ volume method but not with the operando pressure method. SI Figure S1 demonstrates the significant gassing these cells experience during extended cycling. The agreement of in-situ volume and operando pressure measurements during the first cycle shown in Figure 3 is attributed to reversible volume expansion caused by lithium plating and stripping during charge and discharge. Figure 3 demonstrates that operando pressure measurements correlate well to the cell stack volume and thus electrode thickness evolution.
Figure 4 shows the pressure evolution and capacity retention of FEC:DEC (a,b) and FEC:TFEC cells (c,d) constrained with initial average pressures of 485 kPa (a,c) and 795 kPa (b,d). The operando pressure vs time data (red, left axes) over 100 cycles is shown for each testing condition. The pressure at the top of charge (TOC) is shown with open triangles, the pressure at the bottom of discharge (BOD) is shown with upside-down triangles, and the average pressure is shown with diamonds. The capacity and pressure swing (the difference between the pressure at the top of charge and the pressure at the bottom of discharge) normalized to the third cycle are shown in dark and light blue, respectively (right axes). Figure 4 shows that there is an irreversible cell stack expansion that evolves over extended cycling. Previous works which have measured irreversible expansion in Li-metal cells40,42 and Li-ion cells46,49 have attributed this to SEI growth, and in the case of Li-metal cells, dendritic, porous lithium morphology evolution and the formation of dead-lithium. Therefore, increased irreversible expansion is an indicator of poorer cell health. The reversible volume expansion caused by lithium plating and stripping is quantified by the pressure swing. As lithium inventory is lost, less lithium will be plated and thus the pressure swing will decrease concomitant to capacity loss. Figure 4 shows a good correlation between the normalized pressure swing and normalized capacity. Worse performance and cell health, indicated by pressure growth, capacity loss and decreasing pressure swing, is shown to occur at lower pressure (left panels); furthermore, cells with FEC:DEC electrolyte (top panels) exhibit worse performance compared to FEC:TFEC electrolyte (bottom panels).
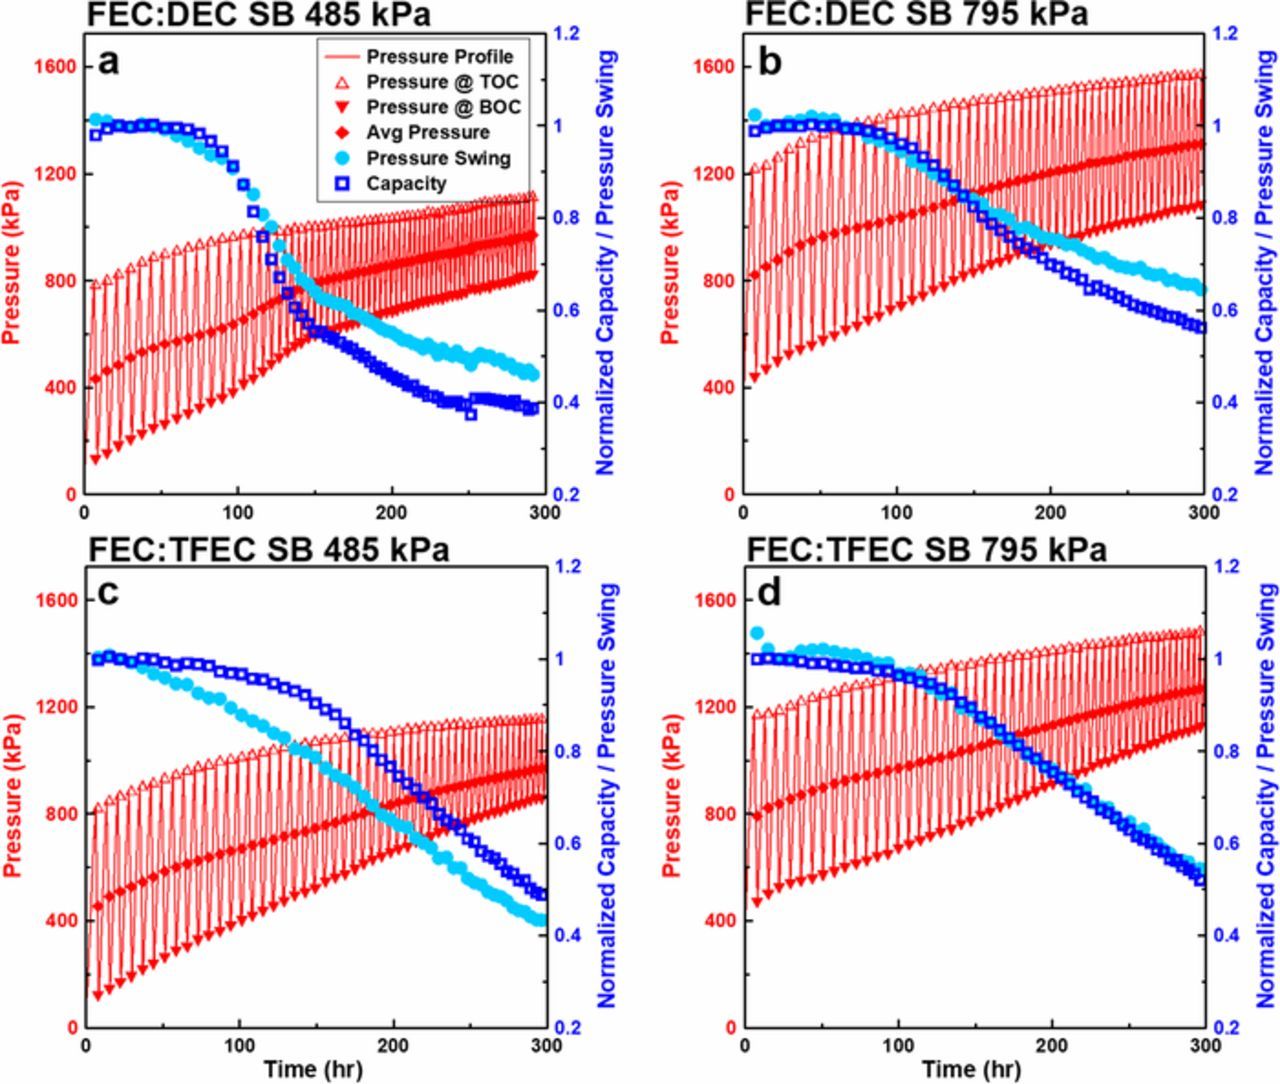
Figure 4. Operando pressure data for cells containing FEC:DEC (a,b) and FEC:TFEC electrolyte (c,d) constrained at initial average pressures of 485 kPa (a,c) and 795 kPa (b,d). The pressure profile, pressure at top of charge, pressure at bottom of charge and average pressure are shown in red (left axes), and the normalized capacity and normalized pressure swing are shown in dark and light blue, respectively (right axes).
Effect of pressure on cycling performance
Figure 5 shows cycling data for cells containing FEC:DEC electrolyte (a,c) and FEC:TFEC electrolyte (b,d). Normalized capacity vs cycle no. is shown in the top panels (a,b) and polarization growth (ΔV—defined to be the difference between the average charge voltage and the average discharge voltage) is shown in the bottom panels (c,d). Tests at different pressures are denoted by the symbols as indicated by the legend; repeat tests are plotted with open symbols. Figures 5a and 5b demonstrate the impact of applied pressure between 75–2205 kPa on capacity retention. The most significant gain is achieved by constraining cells in superboats at an average pressure of 485 kPa compared to the low pressure tests in normal boats constrained at <75 kPa. Further increasing the initial average pressure >485 kPa benefits FEC:DEC cells more significantly than cells containing FEC:TFEC electrolyte. Capacity retention over 100 cycles is improved for FEC:DEC cells by increasing the initial average pressure up to 1725 kPa, whereas the benefit for FEC:TFEC cells saturates at a lower pressure of 795 kPa. Some high pressure tests were stopped prematurely due to shunting, e.g. the FEC:DEC 2205 kPa test. Additionally, some of the high pressure repeat tests, not shown in Figure 5, exhibited sudden capacity drops during cycling. This behavior is shown in SI Figure S2. We believe this occurs due to current collector tearing and positive electrode delamination as a result of the high stress exerted on the electrodes at high pressure. The large volume change of lithium metal during charge and discharge results in a large pressure swing exerted on the cell components which can be physically harmful. Such adverse effects must be considered when implementing Li-metal cells.
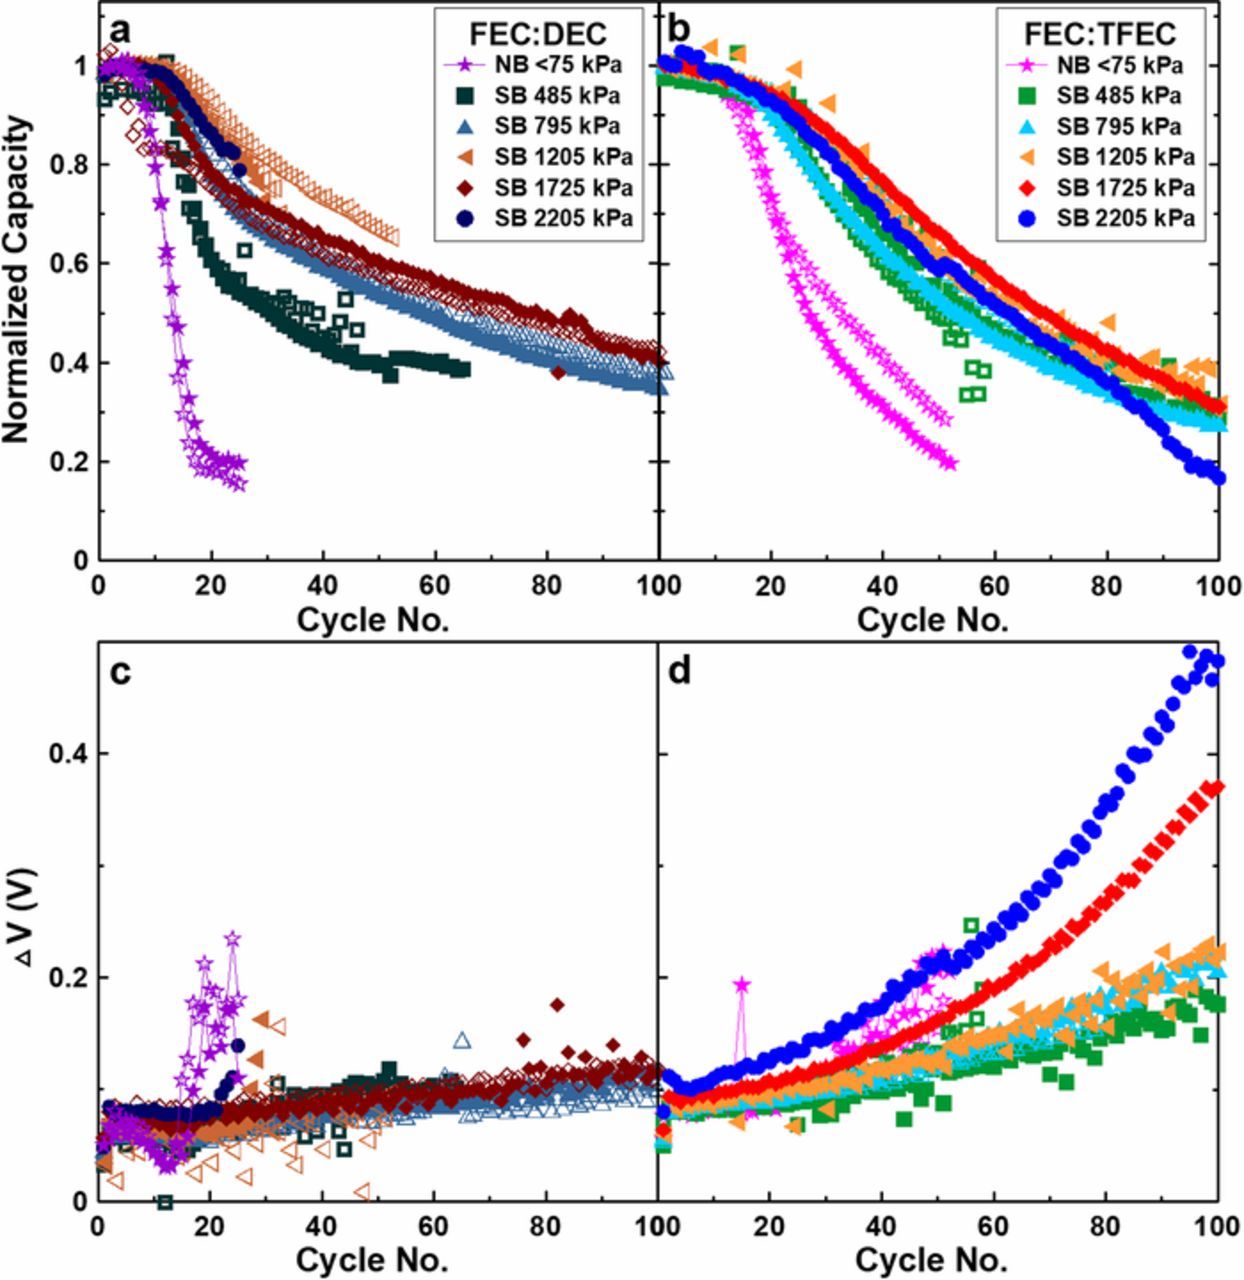
Figure 5. Cycling data for cells containing 1M LiPF6 FEC:DEC (1:2 v:v) (a,c) and 1M LiPF6 FEC:TFEC (1:2 v:v) electrolyte (b,d) constrained under different pressures between 75–2205 kPa. Normalized capacity vs cycle no. is shown in the top panels and polarization growth (ΔV) vs cycle no. shown in the bottom panels.
Figures 5a and 5b show that cells initially cycle with little capacity loss and then subsequently begin to lose capacity at an increased rate. The number of cycles achieved before this rapid capacity loss is affected by the initial average pressure as well as the electrolyte. This behavior was identified by Genovese et al.12 to be caused by the irreversible capacity of the NMC532 positive electrode. Under normal cycling conditions between 3.6−4.5 V, there is a first cycle irreversible capacity of approximately 30 mAh. As such, 30 mAh corresponding to a ca. 2 μm layer of plated lithium remains on the copper current collector when the cell is discharged to 3.6 V, effectively creating a lithium reservoir. Therefore, significant capacity loss is not observed until this lithium reservoir is depleted; 30 mAh of lithium inventory must be depleted to processes such as to SEI formation and accumulation of dead-lithium before the cells begin to exhibit failure. Extended periods of initial minimal capacity loss thus implies a better coulombic efficiency. This effect is somewhat analogous to using limited excess lithium but is without the drawbacks of requiring the manufacturing and handling of lithium metal during cell construction. Instead, excess lithium is achieved in-situ.
Figures 5c and 5d show the effect of pressure on polarization (ΔV) growth. Increasing the average pressure has negligible effect on cells containing FEC:DEC electrolyte; for each pressure, the polarization growth was ca. 50 mV over 100 cycles, except in the low pressure normal boat test which experienced rapid failure over 20 cycles. In contrast, applied pressure had a significant impact on the polarization growth for FEC:TFEC cells. The initial ΔV of FEC:TFEC cells was ca. 30 mV higher than FEC:DEC cells. In addition, the polarization growth appears non-linear for FEC:TFEC cells. For cells constrained up to an initial average pressure of 1205 kPa, the polarization growth was ca. 110 mV over 100 cycles. The polarization growth was more significantly affected at higher pressures, with a 270 mV and 380 mV growth for cells constrained at 1725 kPa and 2205 kPa, respectively. It is also observed that the initial ΔV for FEC:TFEC cells increases as a function of pressure. This contrast of polarization response to applied pressure suggests both an electrochemical and a physical difference exists between these two solvent systems. This was investigated by measuring the ionic conductivity of each electrolyte as a function of temperature, shown in SI Figure S3. At 40°C, the temperature at which the cells were cycled in this work, 1M LiPF6 in FEC:TFEC has a conductivity of 3.9 mS/cm compared to 1M LiPF6 in FEC:DEC which has a conductivity of 9.2 mS/cm. The particularly low conductivity of FEC:TFEC coupled with high applied pressure is possibly a contributor to the large polarization growth observed here. This may be due to impeded ionic transport through the separator at high pressure, however, this hypothesis must be investigated in future work.
Figure 6 shows direct comparisons of capacity retention between cells with FEC:DEC and FEC:TFEC electrolyte initially constrained in normal boats at <75 kPa (a), and in superboats constrained at initial average pressures of 485 kPa (b), 795 kPa (c) and 1725 kPa (d). In each case, the cells with FEC:DEC electrolyte begin suffer from severe capacity loss before FEC:TFEC cells; FEC:DEC cells fall below 80% capacity earlier than FEC:TFEC cells as shown in Figure 6e with hatched bars. This indicates that cells with FEC:TFEC electrolyte have a higher initial coulombic efficiency, consistent with previous reports.33 However, after the depletion of in-situ excess lithium and resulting initial rapid capacity loss, the rate of capacity loss for FEC:DEC cells constrained >75 kPa is not as severe as FEC:TFEC cells. Although FEC:TFEC cells initially cycle with higher capacity retention, the final rate of capacity loss of FEC:TFEC cells result in poorer capacity retention than FEC:DEC cells after approximately 50 cycles. Figure 6e shows the number of cycles to 50% capacity in solid bars. At low (<75 kPa) and moderate (485 kPa) initial pressures FEC:TFEC electrolyte remains superior. Beyond 485 kPa, FEC:DEC electrolyte has matched or surpassed the number of cycles reached to 50% capacity due to the larger final rate of capacity loss of FEC:TFEC cells. This is likely a result of the low ionic conductivity of FEC:TFEC electrolyte possibly contributing to large polarization growth, particularly at pressures >485 kPa.
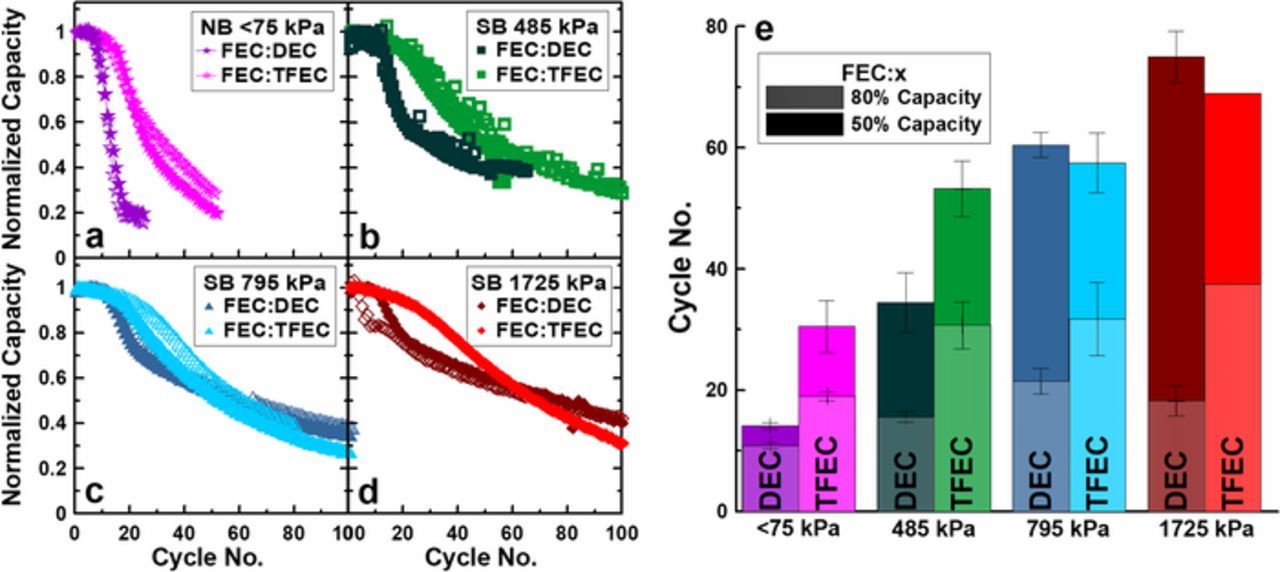
Figure 6. (a) Normalized capacity vs cycle no. for cells containing FEC:DEC and FEC:TFEC electrolyte constrained in normal boats (<75 kPa), and constrained in superboats at 485 kPa (b), 795 kPa (c), and 1725 kPa (d). (e) The cycle number at which cells reached 80% capacity (hatched bars) and 50% capacity (solid bars) for cells containing FEC:DEC and FEC:TFEC electrolyte constrained at different pressures.
Figures 5 and 6 demonstrate that increasing the initial average stack pressure between 75–2205 kPa is generally beneficial, and that cells with FEC:TFEC electrolyte are superior to cells with FEC:DEC electrolyte up to 50 cycles. However, it is shown here that individual benefits achieved with applied pressure and the choice of electrolyte, when used in unison, are not necessarily synergistic. The performance of cells constrained to different pressures is coupled to the choice of electrolyte, and thus the physical properties of the electrolyte are important to consider in cells with lithium metal in which higher pressures generally increases lithium plating efficiency.
Plating morphology
To investigate the effect of applied pressure and choice of electrolyte on lithium plating morphology, samples of plated lithium were retrieved from cycled cells at the top of charge (4.5 V) for SEM. Figure 7 shows SEM images at 5000x magnification of plated lithium after one charge (a-d) and after 50 cycles (A-D) for FEC:DEC cells constrained in normal boats at <75 kPa (a, A) and in superboats at 485 kPa (b,B); and for FEC:TFEC cells constrained in normal boats at <75 kPa (c, C) and in superboats at 485 kPa (d,D). Figure S4 shows the complimentary low magnification (1000x) SEM images. After one charge in a normal boat, the plated lithium for the FEC:DEC cell (a) exhibits larger grain sizes than those for the FEC:TFEC cell (c). In addition, more void space is observed in the FEC:DEC sample—the plated lithium in the FEC:TFEC sample appears more close packed and nodular. In the superboat constrained at 485 kPa, a significant difference is observed as the plated lithium becomes more close packed for both FEC:DEC (b) and FEC:TFEC (d) samples. The FEC:TFEC sample appears to have less void space and thus the smallest surface area. A low surface area is ideal since this results in less contact with the electrolyte thereby reducing the lithium inventory that is lost to SEI formation. Therefore, Figures 7a–7d show that cells constrained at higher pressure and cells containing FEC:TFEC electrolyte exhibit superior plating morphology after one charge. This is consistent with the cycling results which show cells constrained in superboats exhibit superior capacity retention and indicated that FEC:TFEC cells have a higher initial coulombic efficiency.
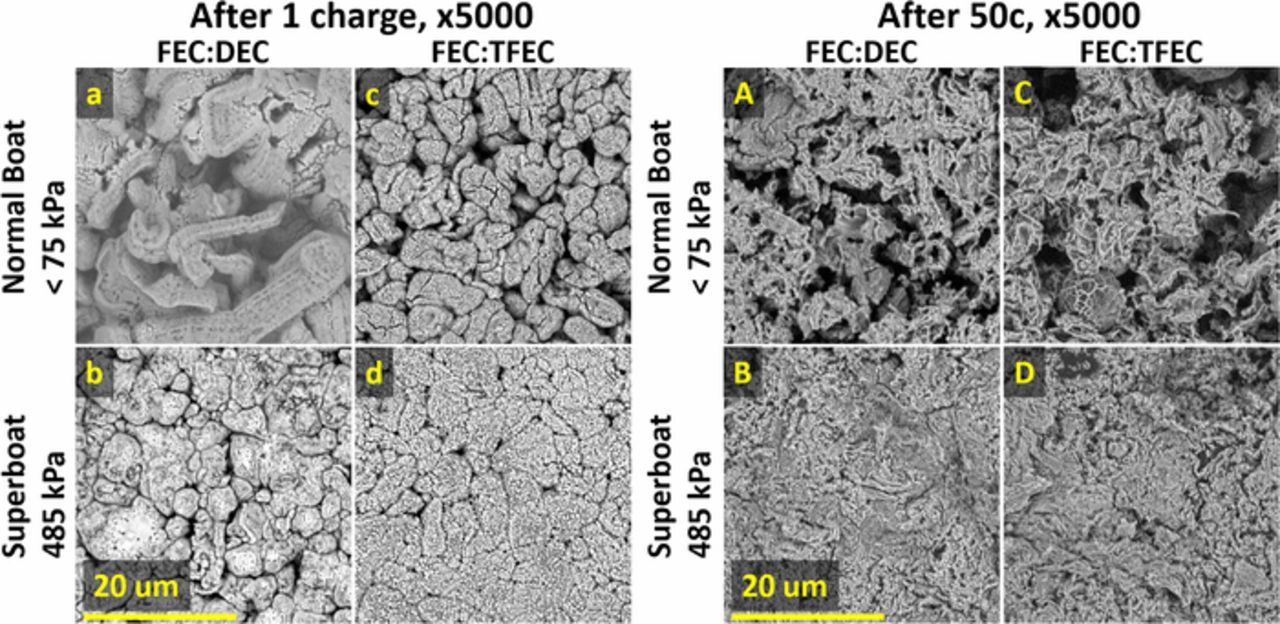
Figure 7. SEM images of plated lithium after one charge (a-d) and after 50 cycles (A-D) for cells containing FEC:DEC electrolyte constrained in normal boats at <75 kPa (a,A) and in surperboats at 485 kPa (b,B); for cells containing FEC:TFEC electrolyte constrained in normal boats at <75 kPa (c,C) and in superboats at 485 kPa (d,D).
After 50 cycles constrained at low pressure <75 kPa in normal boats, the FEC:DEC (A) and FEC:TFEC (C) samples exhibit a significantly more dendritic, mossy structure; the feature size is dramatically reduced and the morphology is very porous with high surface area. This is a poor morphology for efficient lithium plating, and this is reflected in the cycling results which show that cells constrained in normal boats have lost approximately 80% capacity up to 50 cycles. The samples constrained at 485 kPa (B,D) exhibit a morphology that is much less porous, consistent with results which show that higher pressure improves lithium plating efficiency. Constrained at 485 kPa, the morphology of the FEC:DEC and FEC:TFEC samples appear qualitatively similar, consistent with the cycling data presented in Figure 6b which shows that after 50 cycles, both chemistries have lost approximately the same amount of capacity. The initial benefit of FEC:TFEC electrolyte on plating efficiency, observed in the morphology shown in Figures 7b and 7d and the initial cycling data in Figure 6, is lost by cycle 50.
These results show that fully fluorinating the electrolyte solvent with FEC:TFEC electrolyte improves lithium plating morphology and thus cell performance. This is consistent with previous works which have shown that fully fluorinating the electrolyte alters the nanostructure of the SEI resulting in more uniform lithium deposition and improving electrochemical performance.5,50 Clearly, the SEI composition and structure, which in large part dictates the lithium morphology, is intimately bound to electrolyte composition, and thus electrolyte development will continue to play a large role in the development of lithium metal cells. Additionally, the role of mechanical pressure to physically thwart the formation of dendrites and to flatten out otherwise high surface area mossy morphology is again demonstrated here.
Energy density
To put our results in to a broader context, Figure 8 compares the energy density vs cycle no. for the 402020-size anode-free NMC532/Cu cells described in this work with a 402035 Li-ion NMC532/graphite Li-ion cell optimized for capacity retention.51 The Li-ion cell, shown with black circles, contains 1.2 M LiPF6 EC:EMC (3:7) electrolyte with the optimized additive blend + 2% vinylene carbonate (VC, BASF 99.97%) + 1% 1,3,2-Dioxathiolane-2,2-dioxide (DTD, Sigma Aldrich, 98%). Anode-free cells with FEC:DEC electrolyte constrained in a normal boat at <75 kPA and in a superboat at 795 kPa are shown with light and dark green squares; FEC:TFEC electrolyte cells constrained in a normal boat at <75 kPa and in a superboat at 795 kPa are shown with light and dark red triangles, respectively. For further comparison, the calculated initial energy density for Li-metal cells using the same cell geometry as presented in this work but with additional excess lithium layers of 15, 80 and 150 μm corresponding to 1x, 5x and 10x Li excess are shown with light, medium and dark blue stars, respectively.
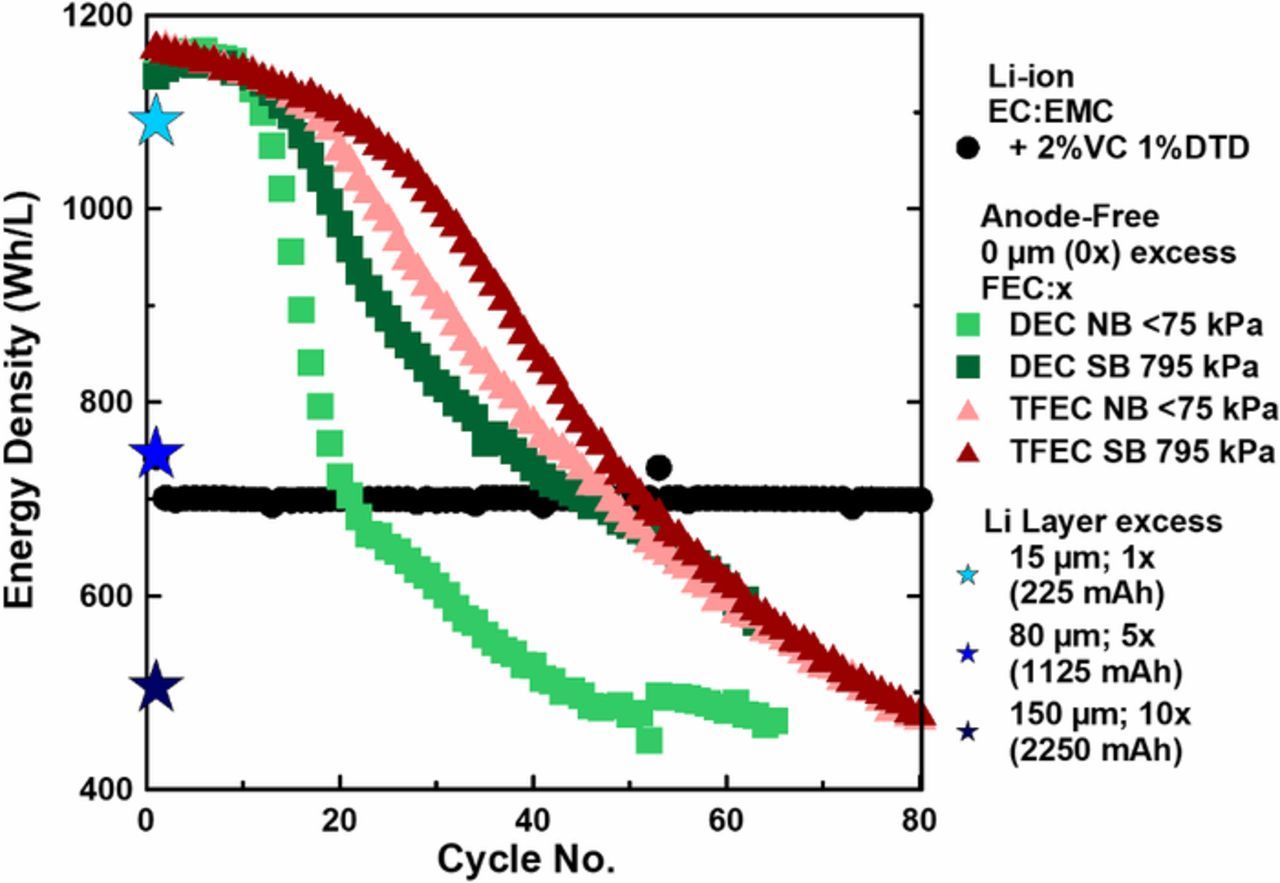
Figure 8. Energy density vs cycle no. for a 402035 Li-ion pouch cell with an optimized electrolyte (black circles); anode-free 402020 pouch cells with FEC:DEC electrolyte constrained in a normal boat (<75 kPa) and in a superboat (795 kPa) (light and dark green squares) and FEC:TFEC electrolyte constrained in a normal boat (<75 kPa) and in a superboat (795 kPa) (light and dark red triangles); calculated initial energy densities for Li-metal cells containing 1x, 5x and 10x excess lithium, corresponding to lithium layers of 15 μm, 80 μm and 150 μm (light, medium and dark blue stars).
The Li-ion cell begins with an energy density of ca. 700 Wh/L, approximately 60% of the energy density of anode-free cells. The Li-ion cell experiences virtually no loss of energy over the course of the 80 cycles shown in Figure 8 (by cycle 2500, this cell had only lost 10% energy). The anode-free cells begin with an energy density of ca. 1150 Wh/L. Although anode-free cells suffer from severe capacity loss, this massive boost to energy density allows them to deliver superior energy density compared to Li-ion cells for some time. The anode-free cells tested in this work with moderate initial average pressures of 795 kPa deliver more energy than the gold standard Li-ion cell for approximately 50 cycles. Although this is still a relatively short cycle life, we believe electrolyte optimization will yield significant improvements, allowing anode-free cells with liquid electrolytes to deliver more energy than Li-ion cells for over 100 cycles in the near future—and hopefully much more as research in this field develops—increasing their commercial viability.
The calculated energy density for lithium metal cells with excess lithium shown with blue stars in Figure 8 demonstrate why lithium metal cells with significant excess lithium are not useful for improving energy density. The lithium excess layer we refer to here corresponds to the single sided lithium layer as shown in Figure 1 since this is how an excess layer would have to be introduced—as such there would be two of these layers per stack. A 15 μm lithium excess, corresponding to 1x excess lithium for this cell design, results in an energy density of ca. 1100 Wh/L, a modest decrease from the anode-free configuration. However, once significant excess lithium is introduced, an 80 μm layer corresponding to x5 excess results in a paltry 10% increase in energy density compared to the Li-ion cell. A 150 μm layer, still less than many standard lithium foils used in lithium metal cells, which corresponds to 10x lithium excess in this cell design results in an energy density of 500 Wh/L—30% lower energy density than the Li-ion cell. Some lithium metal cells reported in the literature utilize this much excess lithium and more, and as a result exhibit artificially prolonged cycle life as there is a vast reservoir of excess lithium which can be depleted before the cathode can no longer be fully lithiated; however, such cells with significant excess result in a cell chemistry that is less safe, more difficult to manufacture and without significant, if any, benefit to energy density compared to conventional Li-ion cells. We believe that to make a useful lithium metal cell, an anode-free or limited excess lithium (<30 μm) configuration, as outlined by Albertus et al.,13 must be adopted.
Conclusions
Anode-free pouch cells constrained at different pressures between 75–2200 kPa utilizing two different solvent systems, FEC:DEC and FEC:TFEC, were investigated in this work. Operando pressure measurements revealed the reversible cell stack expansion due to lithium plating and stripping during cycling, and the irreversible expansion caused by processes detrimental to cell health such as SEI growth and accumulation of dead-lithium. We found that increasing the initial average pressure from 75–2200 kPa is generally beneficial to the cycling performance and lithium plating efficiency of anode-free cells. Additionally, cells with FEC:TFEC electrolyte showed improved initial plating efficiency compared to cells with FEC:DEC electrolyte. However, increasing the applied pressure did not affect the two solvent systems equally, and the performance of FEC:TFEC cells was actually hindered at high pressures of 1725–2205 kPa due to significant polarization growth. This work demonstrates that not all factors which individually benefit the cycling performance of anode-free cells will synergize, and that the physical properties of electrolyte used in cells constrained to high pressure must be considered. The best anode-free cells reported here deliver a larger energy density than conventional Li-ion cells for 50 cycles. We believe that further electrolyte optimization will yield cycling improvements which will allow anode-free cells to surpass the energy density of Li-ion cells for over 100 cycles, beginning to pave the way toward useful, commercially viable, high energy density anode-free lithium metal cells.
Acknowledgments
The authors thank NSERC and Tesla Motors for the funding of this work under the auspices of the Industrial Research Chairs program. AJL thanks the Nova Scotia Graduate Scholarship program and the Walter C. Sumner Memorial fellowship for support. MG thanks the NSERC PDF program. ERL thanks NSERC and the Nova Scotia Graduate Scholarship program. The authors thank Laurent Molino and Cameron Martin for their contributions, as well as Simon Trussler for expert fabrication of the parts used in this work.
ORCID
A. J. Louli 0000-0001-9819-1324
J. R. Dahn 0000-0002-6997-2436