
Abstract
A first review of hard carbon materials as negative electrodes for sodium ion batteries is presented, covering not only the electrochemical performance but also the synthetic methods and microstructures. The relation between the reversible and irreversible capacities achieved and microstructural features is described and illustrated with specific experiments while discussing also the effect of the electrolyte. A summary of the current knowledge is given while emphasizing the possibility of further performance improvements by thoroughly mastering structure-property relationships and also discussing the main current bottleneck to maximize energy density in real applications: the first cycle irreversible capacity. Finally, a short conclusion and perspectives session is provided highlighting necessary developments in the field to turn the present optimistic research prospects into tangible practical products.
Export citation and abstract BibTeX RIS

This is an open access article distributed under the terms of the Creative Commons Attribution 4.0 License (CC BY, http://creativecommons.org/licenses/by/4.0/), which permits unrestricted reuse of the work in any medium, provided the original work is properly cited.
Intensive efforts aiming at the development of a sodium-ion battery (SIB) technology operating at room temperature and based on a concept analogy with the ubiquitous lithium-ion (LIB) have emerged in the last few years.1–6 Such technology would base on the use of organic solvent based electrolytes (commonly mixtures of alkylcarbonates with a dissolved sodium salt, typically NaPF6) and two high and low potential operation electrodes which would exhibit reversible redox reactions involving sodium ions.
In contrast to the large spectrum of suitable positive electrode materials identified, the choice is more restricted for the negative side, as is also the case for LIB. Indeed, sodium titanium oxides operating through intercalation reactions exhibit poor capacity retention7,8 and alloy based electrodes5 though promising at the laboratory scale, might suffer from practical bottlenecks derived from the large volumetric changes associated to their redox operation as is the case in LIB.9,10 To date thus, only carbonaceous materials have practically proved viability.
Most types of carbon react with lithium ions to a certain extent at low potential (∼0.1–1 V vs. Li+/Li) and are thus suitable for use as negative electrode materials. Hard carbons can deliver high capacity since the random alignment of small-dimensional graphene layers provides significant porosity able to accommodate lithium,11 yet the rate capability (power performance) is usually limited and the irreversible capacity (mostly consumed in the formation of the Solid Electrolyte Interphase (SEI)) is higher than that of graphite. This fact coupled to its higher density which results in higher volumetric capacity has contributed to graphite being the most widely used commercial negative electrode material in LIB. Since graphite is not able to insert sodium ions12,13 unless solvated to form ternary intercalation compounds,14 non-graphitic carbons were already investigated a few years ago.15,16 These were found to exhibit first cycle reversible capacities in the range of 100–300 mAh/g with substantial fading upon cycling but still enabled the realization of a full 3.7 V sodium ion cell using NaVPO4F as positive electrode material.17 The renaissance of the sodium-ion concept has prompted intensive recent research efforts which have resulted in the achievement of significant performance improvements. The aim of this paper is to present an overview of such advances highlighting existing bottlenecks in the topic with the aim to inspire future research to overcome existing challenges.
Experimental
Original results presented in this paper were achieved for hard carbon samples prepared by pyrolysis of sugar at 1100°C for 6 h under argon flow18 (200–1000 cm3/min). Brunauer-Emmett-Teller (BET) surface area was measured using an ASAP 2000 Micromeritics instrument. Composite electrodes for electrochemical testing were prepared from slurries (90 wt% hard carbon, 5 wt% of Polyvinylidene fluoride binder (Arkema) and 5 wt% of Super P carbon (Timcal) in N-Methylpyrrolidone (Aldrich)).19 Electrochemical tests were performed using a Bio-Logic VMP3 potentiostat in two-electrode Swagelok cells in galvanostatic mode with potential limitation (GCPL) at C/10 and C/20 (1C being one Na+ inserted in one hour) to monitor capacity evolution upon cycling. The electrolytes consist of 1 M NaPF6 solution in ethylene carbonate (EC, Aldrich anhydrous 99.0%), propylene carbonate (PC, Aldrich anhydrous 99.7%) and dimethyl carbonate (DMC, Aldrich anhydrous 99.0%) mixture (0.45:0.45:0.1 in weight).20,21 The water content in all electrolytes was measured by Karl-fisher titration and found to be lower than 25 ppm in all cases.
Synthesis and Microstructure
Most non-graphitic carbons are prepared by pyrolysis of different precursors (typically organic polymers or hydrocarbons) at T < 1500°C and exhibit a structure in which most of the carbon atoms are also arranged in a planar hexagonal network but long range ordering in the c direction is lacking. This structure is characterized by amorphous areas embedding and partially crosslinking (by sp3 hybridized carbon atoms) more graphitic (layered) structure segments consisting of aligned small-dimensionality sp2 (graphene) layers (see Figure 1a). If crosslinking between the layers is weak (soft carbons), these layers may be mobile enough upon further heat-treatment at temperatures from 1500°C to 3000°C to form graphite-like crystallites. In contrast, strong cross linking (hard carbons) will immobilize carbon layers and prevent true development of graphite structure even by treatment at high temperature.22 The degree of crosslinking depends on the state of aggregation of the intermediate phase during pyrolysis. Hard carbons are commonly products of solid-phase pyrolysis whereas soft carbons are usually produced by liquid- or gas-phase pyrolysis.23 The ability to graphitize is also related to the ordering and texture of the respective precursor and is enhanced for highly condensed aromatic hydrocarbon precursors. Hard carbons are typically prepared from polymers such as phenol-formaldehyde resins, cellulose, charcoal, coconut shells or sugar, with the yields depending on precursor composition and pyrolysis conditions. Raman spectra of these materials carbon exhibit two characteristic bands at ca. 1350 (D-band) and 1580 (G-band) cm−1 (see Figure 1b) corresponding respectively to the E2g graphitic mode and the defect-induced mode. Therefore, the ID/IG ratio is a good indication of the graphitization degree of the sample and decreases when the pyrolysis temperature increases due to an enhanced relative ordering.28 The lateral extent of graphene sheets and the number of sheets stacked can be deduced from the width of the (100) /(110) and (002) diffraction peaks and are typically of the order of 10–40 Å and 1–3 respectively.24 The position of the (002) peak (and thus the d002 spacing) has been found to shift to higher angles (i.e. d002 spacing decreases) when the pyrolysis temperature increases.29,38 This complex structure can be qualitatively understood through a simplified "falling cards model".25 Gases evolved during the pyrolysis process induce the development of a porous structure in the carbonaceous material. The size (macro > 50 nm, meso between 50 and 2 nm and micro < 2 nm) and type of pores between the organized regions depend on the kind of volatile substance and the conditions of pyrolysis, with the proportion of micropores increasing with the cross-linking density in the precursor36 and being modified by thermal treatment.26 Small angle X-ray scattering (SAXS) is typically used to provide information about the macro and micropore structure, as it is also sensitive to the closed pores not accessible for N2 adsorption. When sugar is used as a precursor, the micropore surface area has been found to experience a steep decrease when the pyrolysis temperature is raised to 900–1000°C and smoothly decrease above 1200°C.26 A specific surface area of hundreds of m2/g is typically achieved when the pyrolysis takes place below 1000°C while higher temperatures result in an abrupt drop in the BET values to < 10 m2/g,27–31 which can be understood by considering micropore closure at high temperature.32 Interestingly, the specific surface area can also be tuned by pre-treatments of the precursor27,33–35 or post pyrolysis treatment.30 When the pyrolysis takes place under gas flow (typically Ar), the flow rate has also been found to have an effect in the specific surface area. Indeed, high flow rates allow flushing away the released gas (mostly CO2) which would otherwise react with carbon (burnoff) creating porosity and enhancing the surface area.27 Our own experiments carrying out pyrolysis of sugar at 1100°C do confirm this trend (see Table II). Moreover, the increase in the Ar flow rate does also induce a significant increase in the pyrolysis total yield which is enhanced from 15 to 30% when the flow rate is enhanced from 200 to 1000 cm3/min, in agreement with reduction of burnoff. Last but not least, the surface of hard carbons typically contains numerous chemical complexes that are formed during the pyrolysis process (typically chemisorbed oxygen containing species) which exhibit different thermal stabilities and are desorbed at different temperatures. Carbon-hydrogen bonds can also be present, especially if pyrolized at temperatures below 1000°C.36 Surface oxide groups on carbon play a major role in its surface properties, including wettability, which is the reason why the physico-chemical properties of carbonaceous materials can be tuned by post-synthesis treatments.
Table II. Evolution of the BET surface area and reaction yield for hard carbon obtained from sugar pyrolysis at 1100°C under various Ar flow rates.
| Sample | Ar flow rate (cc/min) | Reaction yield (%) | BET (m2/g) |
|---|---|---|---|
| A | 200 | 15 | 670 |
| B | 600 | 27 | 120 |
| C | 1000 | 30 | 11 |
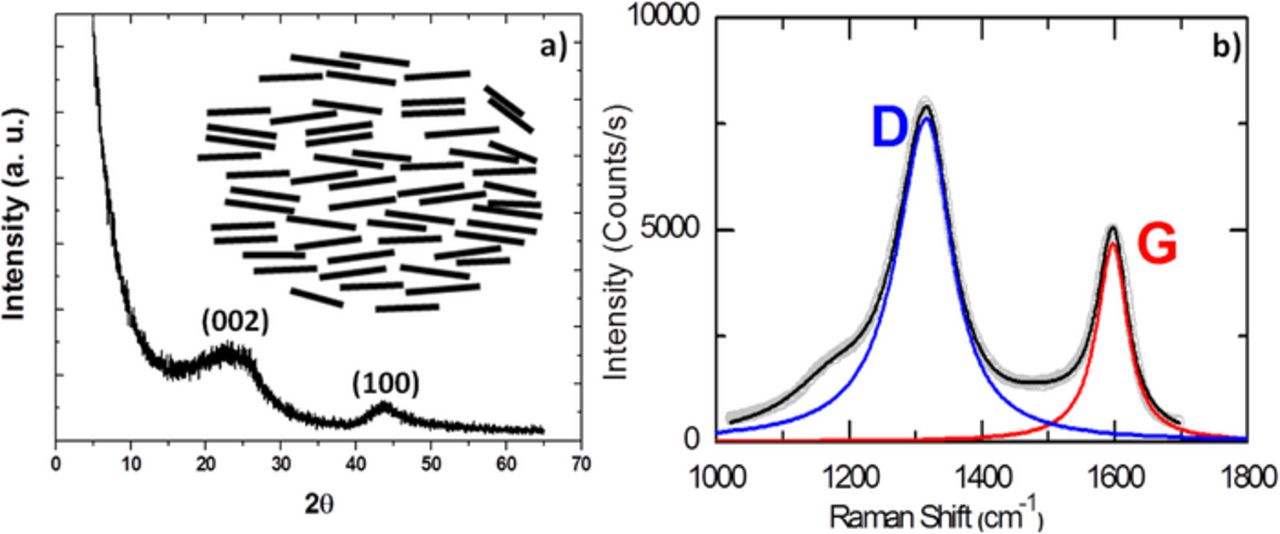
Figure 1. Typical X-ray powder diffraction pattern (Cu Kα) (right) and Raman spectrum (left) for hard carbon. A scheme depicting its structure is given as an inset.
Electrochemical Performance
Hérold and co-workers did already propose in 1970 that sodium vapor was retained by non graphitic carbons through adsorption and insertion, with their relative amounts depending on their origin and treatment temperature.37 Later on the commercialization of Li-ion batteries in 1991 (with the first generation using hard carbon anodes), prompted a more thorough study on the relationship with the degree of lithium uptake (and its reversibility) and the carbon microstructure, the conclusion being that higher lithium storage capabilities were related to a high proportion of single-layer sheets and micropores.38,39 The mechanisms for lithium and sodium insertion were found to be similar40–42 and to involve two distinct steps: a sloping potential region extending to ca. 0.2V and a low potential plateau (see Figure 2). The first was assigned to the insertion of alkaline ions between the layers, with the turbostratic disorder producing sites with a distribution of chemical environments which results in a sloping profile while the second would be related to the adsorption of ions in the micropores, in full agreement with the results of recent DFT calculations.43 The first step induces an expansion of the interlayer distance between graphene sheets from 3.8 Å to ca. 4.15 Å44 while the second causes a reduction of the scattering intensity around 0.03–0.07 Å−1 in the SAXS spectra, which is in agreement with filling of micropores.44,45 In agreement with that, two peaks at 9.9 and 5.2 ppm are observed in NMR spectra of sodiated hard carbon,42 which are ascribed to sodium intercalation between graphene layers, and a broader resonance between −20 and 30 ppm attributed to sodium insertion into the nano-cavities/micropores.
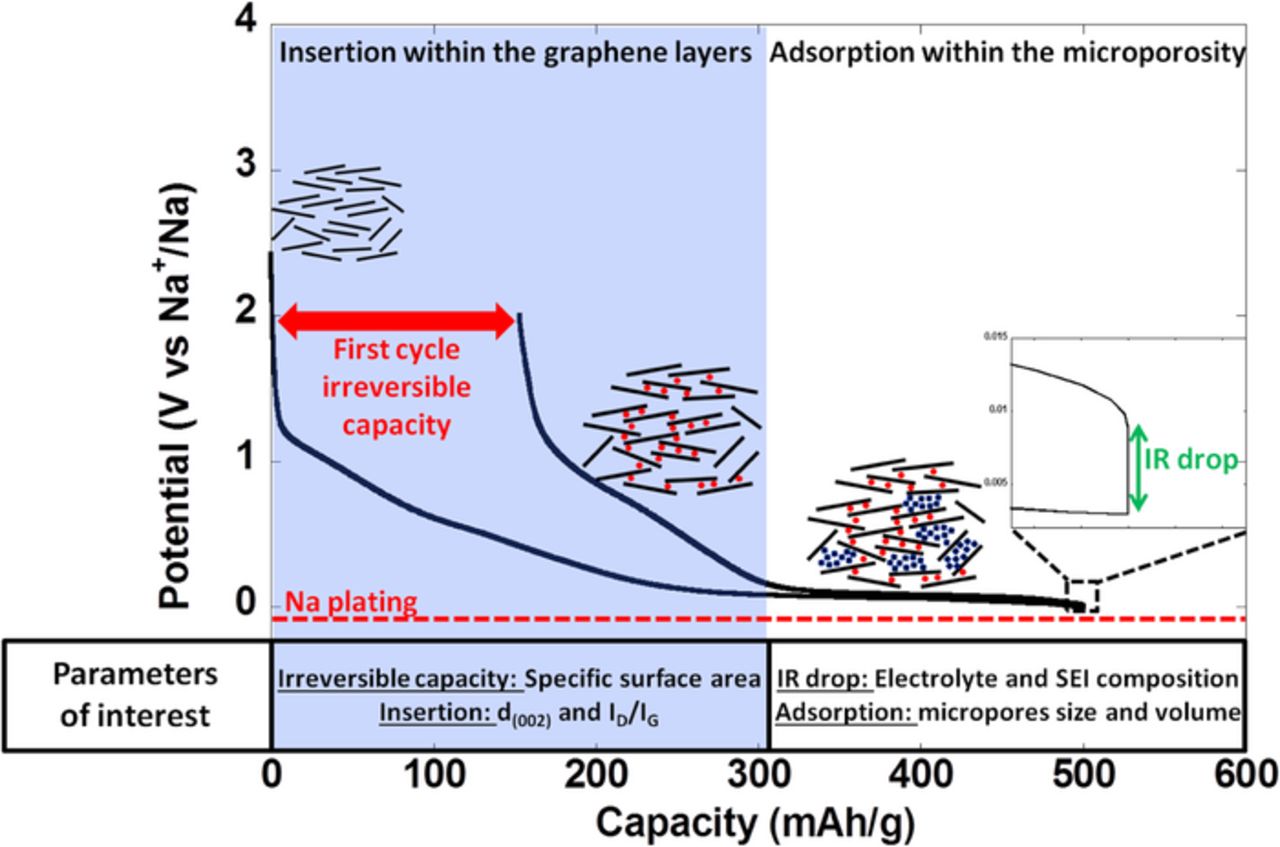
Figure 2. Typical potential vs. capacity profile for hard carbon when tested against sodium metal counter electrodes. The different steps of the mechanism are also labeled and depicted (see text for details).
The first hard carbon reduction in both lithium and sodium cells enlists significant irreversible capacity which can mostly be related to the formation of the SEI though the possibility of some ions being trapped in the material cannot be disregarded.36 This has important practical implications in the assembly of full cells in which the cyclable sodium is provided by the positive electrode. Indeed, this irreversible capacity translates in loss of such cyclable sodium and thus in a lower total battery capacity hence penalizing the maximum achievable energy density. Unfortunately this cannot be overcome by enhancing the mass loading of the positive electrode in cell balancing as cells would most likely have to be built with an excess of negative active material to avoid sodium deposition upon overcharge or low temperature operation and avoid safety hazards, as happens for LIB. Thus, a large irreversible capacity for the negative electrode material translates into a severe penalty in energy density in practical batteries. While this was an issue for the first generations of Li-ion batteries using hard carbon anodes, it did lose some relevance when EC-based electrolytes were developed that enabled the use of graphite negative electrodes which exhibit much lower irreversible capacity.36 Yet, the problem has re-emerged in parallel with the development prospects for the SIB technology. In the case of LIB, early results did correlate the extent of SEI formation (and thus the irreversible capacity) to the electrode surface area accessible for the electrolyte and was often correlated with the BET specific surface area.27 Similar trend was observed in Na cells.18,28,29 The highest coulombic efficiency upon the first cycle reported to date is ca. 85% for samples either commercial44,46 or prepared at laboratory scale at temperatures higher than 1100°C with low specific surface areas (<10 m2/g, see Table It2), which compare very well with the state of the art hard carbon electrodes in LIB.27 In our case, the irreversible capacity of samples prepared from sugar pyrolysis at 1100°C under different argon flows does indeed seem to be correlated to the surface area, as samples A, B and C exhibiting BET surface areas of 670, 120 and 11 m2/g yield 67 and 44 and 32 % irreversible capacities respectively on the first cycle (see Figure 3a). Yet, in spite of a linear relationship between BET specific surface area and irreversible capacity being in some cases observed within the same series of samples, other parameters have been shown to be relevant such as the concentration of surface functional groups which can also react with lithium atoms.47 In this sense, it is worth to recall that irreversible capacity in LIB had been shown to reduce by a soft carbon deposit on the surface of hard carbon carried out by CVD48 and that similar results have recently been achieved in SIB56 although with alternative carbon deposition methods.49 The BET specific surface area deduced from the amount of nitrogen physisorbed on the carbon surface gives an indication of the surface area accessible for the electrolyte. However, it has been suggested that a more relevant parameter to consider is the so-called active surface area (ASA) which is related to the number of active sites on the carbon surface and also sensitive to the influence of heteroatoms involved in surface functional groups or adsorbed species, which can have a significant influence on the electrolyte reactivity.50 The ASA is determined through oxygen chemisorption to form surface oxygenated complexes which are further quantified by mass spectroscopy during outgassing at high temperature51 and is related to the cumulated surface area of the different types of defects present on the carbon surface (stacking faults, vacancies, dislocations etc) which are responsible for interactions with the adsorbent species. While this has been shown to allow more meaningful correlations with irreversible capacity in LIB,52 the application of the same concept to SIB has not been reported to date.
Table I. Relevant overview of literature data on hard carbon electrochemical performance against sodium metal counter electrode. Available details on testing conditions, synthesis and surface area are also given.
| PRECURSOR | T pyrolysis (°C) | BET (m2/g) | Binder | Electrolyte | C1 Coulombic efficiency (%) | C1 rev (mAh/g)* | Cn rev (mAh/g)** | Cycle n | Ref |
|---|---|---|---|---|---|---|---|---|---|
| Unknown (commercial hard carbon) | 5 | 10%PVDF | 1M NaClO4 in EC, PC, BC, EC:DMC (1:1), EC:EMC (1:1), EC:DEC (1:1) | 72–80 | 210–238 | 95–230 | 20–100 | 44 | |
| Glucose | 1000–1150 | 1M NaClO4 in EC:DEC (70:30) | 67–79 | 210–280 | 15 | ||||
| Sucrose | 800–1100 | 25–266 | 10% PVDF | 1M NaClO4 in EC:PC (1:1) | 77–96*** | 221–335 | 234 | 500 | 30 |
| Unknown (commercial hard carbon) | 5 | 10% PVDF, 10%CMC | 1M NaPF6 in PC with or without 2%FEC | 84–86 | 230–250 | 90–240 | 100 | 53 | |
| Pomelo peels with or without H3PO4 treatment | 700 | 1272 or 0.9 | 10% PVDF | 1M NaClO4 in EC:PC (1:1) | 27 or 54 | 315 or 215 | 181 or 100 | 220 | 35 |
| Polyacrylonitrile (Mw = 80000.) | 800–1500 | 187–12 | 1M NaClO4 in EC:DMC (1:1) | 41–72 | 150–275 | 100–210 | 100 | 28 | |
| Polyacrylonitrile (Mw = 80000) | 800–1300 | 30–14 | 1M NaClO4 in EC:DMC (1:1) | 45–71 | 180–292 | 140–247 | 200 | 29 | |
| Sucrose | 1000–1600 | 5% PVDF | 1M NaClO4 in EC:DEC (1:1) | 77–83 | 297–320 | 222–290 | 100 | 56 | |
| Sucrose powder with or without graphene oxide | 1100 | 5–137 | PVDF | 1M NaPF6 in EC:DEC (1:1) | 83–76 | 280–185 | 270 (with graphene oxide) | 200 (with graphene oxide) | 33 |
| Sugar | 1100 | 24 | 5%PVDF | 1M NaClO4 or NaPF6 in EC:PC (1:1) | 70 | 235 | 200 | 180 | 20 |
| Sugar | 1100 | 24 | 5%PVDF | 1M NaClO4 in EC:PC (1:1) with or without 2%FEC | 50–70 | 185–325 | 160–300 | 20–120 | 18 |
| Sugar | 1100 | 24 | 5%PVDF | 1M NaClO4 in EC:PC:DMC (0.45:0.45:0.1) | 65 | 330 | 310 | 100 | 21 |
| Sugar | 1100 | 70 (carbon coated) | 5%PVDF | 1M NaPF6 in EC:PC:DMC (0.45:0.45:0.1) cycled at –15°C or 75°C | 70 | 265 or 420 | 265 or 415 | 40 | 54 |
| Sucrose with or without NaHCO3 | 1200 | 10%PVDF | 1M NaClO4 in EC:DEC (1:1) | 41–44 | 240–315 | 213–288 | 100 | 34 | |
| Unknown (commercial hard carbon) | 1600 | 10 | 5%PVDF | 1M NaClO4 or NaPF6 in PC or EC:DMC (1:1) | 69–81 | 180–321 | 80–289 | 50 | 46 |
*C1 rev: Reversible capacity during the 1st cycle. **Cn rev: Reversible capacity during the nth cycle. ***Indicated for a half cell with an initial voltage below 1 V vs Na+/Na.
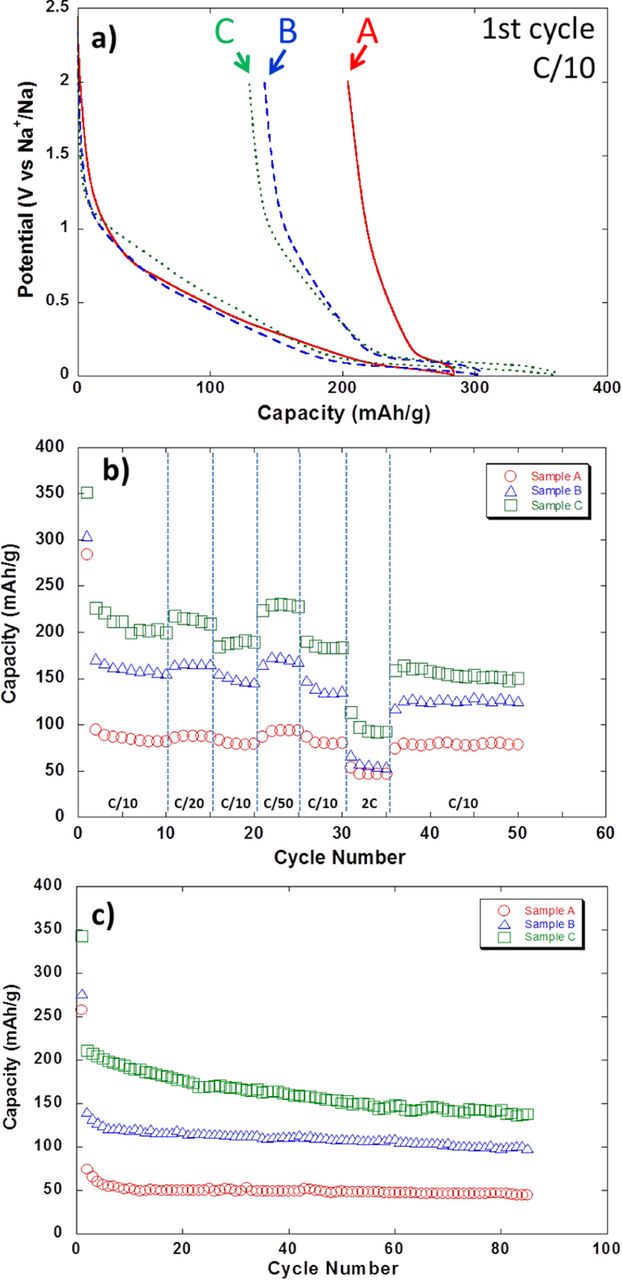
Figure 3. (a) Potential vs. capacity profile and capacity upon reduction vs. cycle number when tested at different rates (b) or at C/5 (c) for hard carbon samples prepared by pyrolysis of sugar at 1100°C under various Ar flow rates (see Table II) when tested in 1M NaPF6 in EC:PC:DMC (0.45:0.45:0.1 in weight) against sodium metal counter electrode.
While the first reports dealing with sodium intercalation in hard carbons showed, at its best, moderate performance upon cycling, Komaba and co-workers focusing on the screening of several electrolytes, succeeded in achieving a stable capacity of ∼230 mAh/g for 100 cycles with 1 M NaClO4 in PC or EC:DEC based electrolytes.44 Their study showed the existence of a non-uniform SEI deposited on hard carbon which seemed to mostly consist of inorganic compounds, as deduced from mass spectroscopy. The same group also investigated the effect on the negative electrode of using fluoroethylene carbonate (FEC, polymerizing agent) as electrolyte additive, but with some contradictory effects on capacity retention depending on whether PVDF or CMC was used as binder.53 In the case of EC:PC based electrolytes FEC addition was found to significantly lower the conductivity of the SEI layer (see Figure 4) and to decrease the reversible capacity associated to the low potential plateau.18 In parallel, our systematic studies on the electrolyte formulation allowed to conclude that electrolytes based on a mixture of EC and PC solvents, with either 1 M NaClO4 or NaPF6, allowed much better capacity retention for hard carbon due to the beneficial effect of EC inducing the formation of a stable SEI layer.20 An addition of 10% DMC to the solvent mixture was found to decrease its viscosity and hence enhance the ionic conductivity, still keeping the electrode polarization low upon cycling and allowing access to the full capacity of the low potential plateau (300 mAh/g at C/10 for more than 120 cycles).21 In agreement with the correlation between irreversibility and surface area discussed above, large reversible capacities are linked to low specific surface areas. Reversible capacities increase from 45 to 100 and 140 mAh/g respectively (C/5, 85 cycles) when decreasing surface areas from 670 to 120 or 11 m2/g (samples A, B, and C respectively).
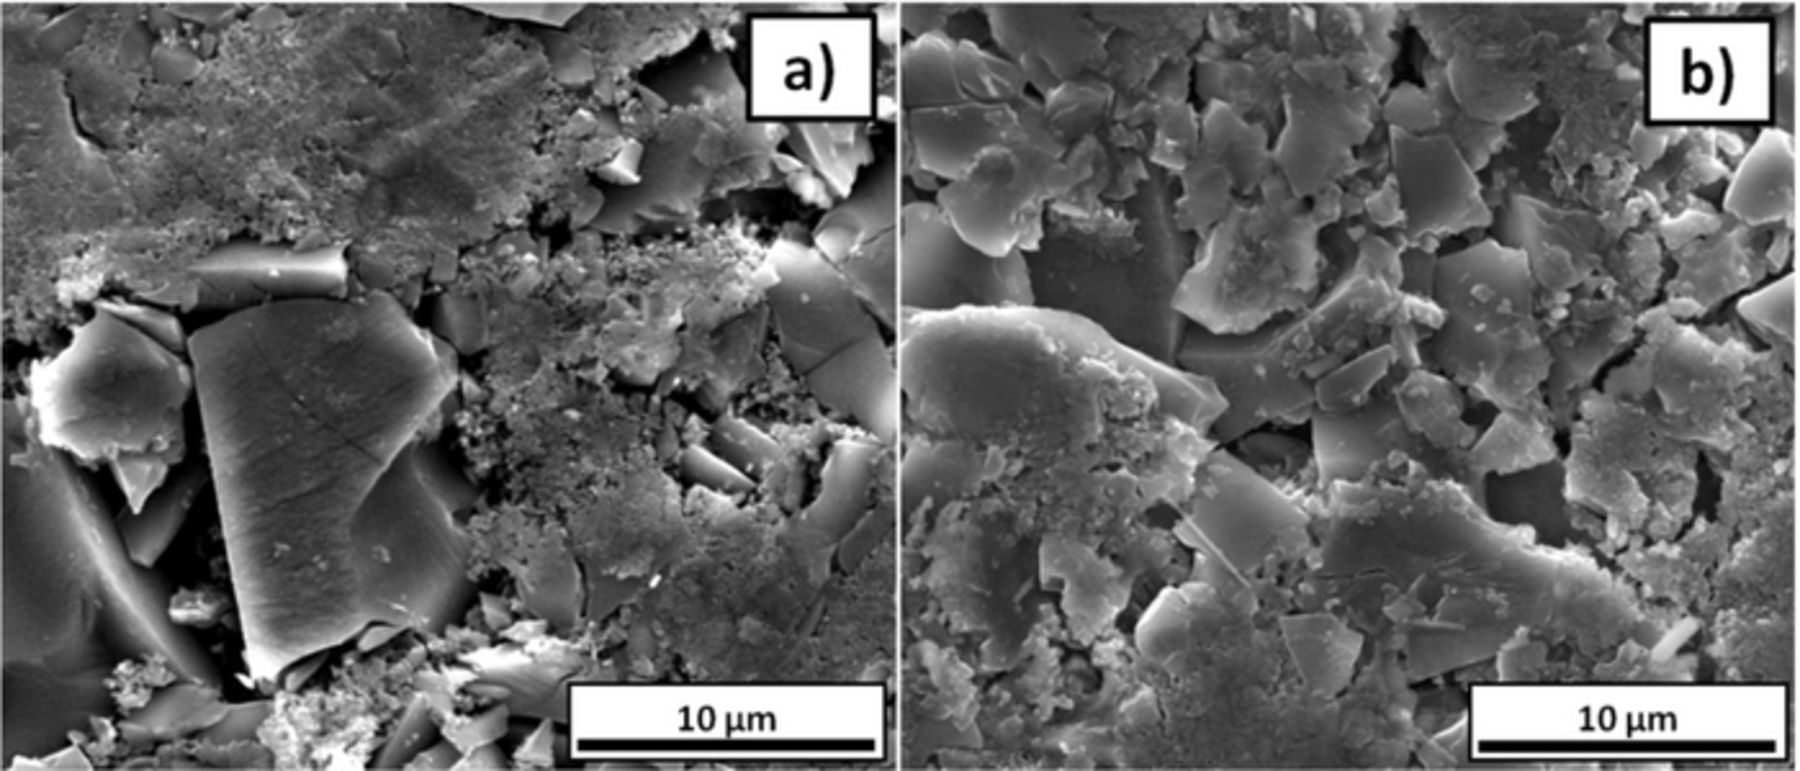
Figure 4. SEM micrographs of tape casted electrodes prepared with carbon coated hard carbon a) before and b) after cycling in 1 M NaPF6 in EC0.5:PC0.5 at 75°C. Reprinted from Ref. 54 with permission.
This electrolyte formulation has also recently shown to enable good capacity retention upon low (−15°C) and high (75°C) temperature operation.54 This study did also stress the critical influence of the total cell resistivity (IR drop, see Figure 2 inset) on the total measured capacity values. Indeed, as a significant part of the electrochemical capacity delivered by hard carbon is achieved at very low potential, large cell polarizations related to a non optimized electrolyte composition may result in the loss of a significant amount of capacity (note that the lower cut off potential for most tests reported in the literature is 0.02 V vs. Na+/Na). Moreover, non-optimized electrolytes may result in the continuous growth of the SEI layer and hence result in significant capacity fading upon cycling.20 Indeed, the electrolyte formulation55 determines the SEI composition and stability which has implications on the charge transfer resistance and cell polarization. It is worth mentioning that SEM micrographs of HC electrodes cycled at 75°C in EC:PC are similar to those of fresh electrodes (see Figure 5).54 Such findings coupled to the 99.9% coulombic efficiency achieved after few cycles indicate that no significant further decomposition of the electrolyte on the surface of the electrodes takes place even at 75°C, which is highly encouraging for applications involving long term performance.
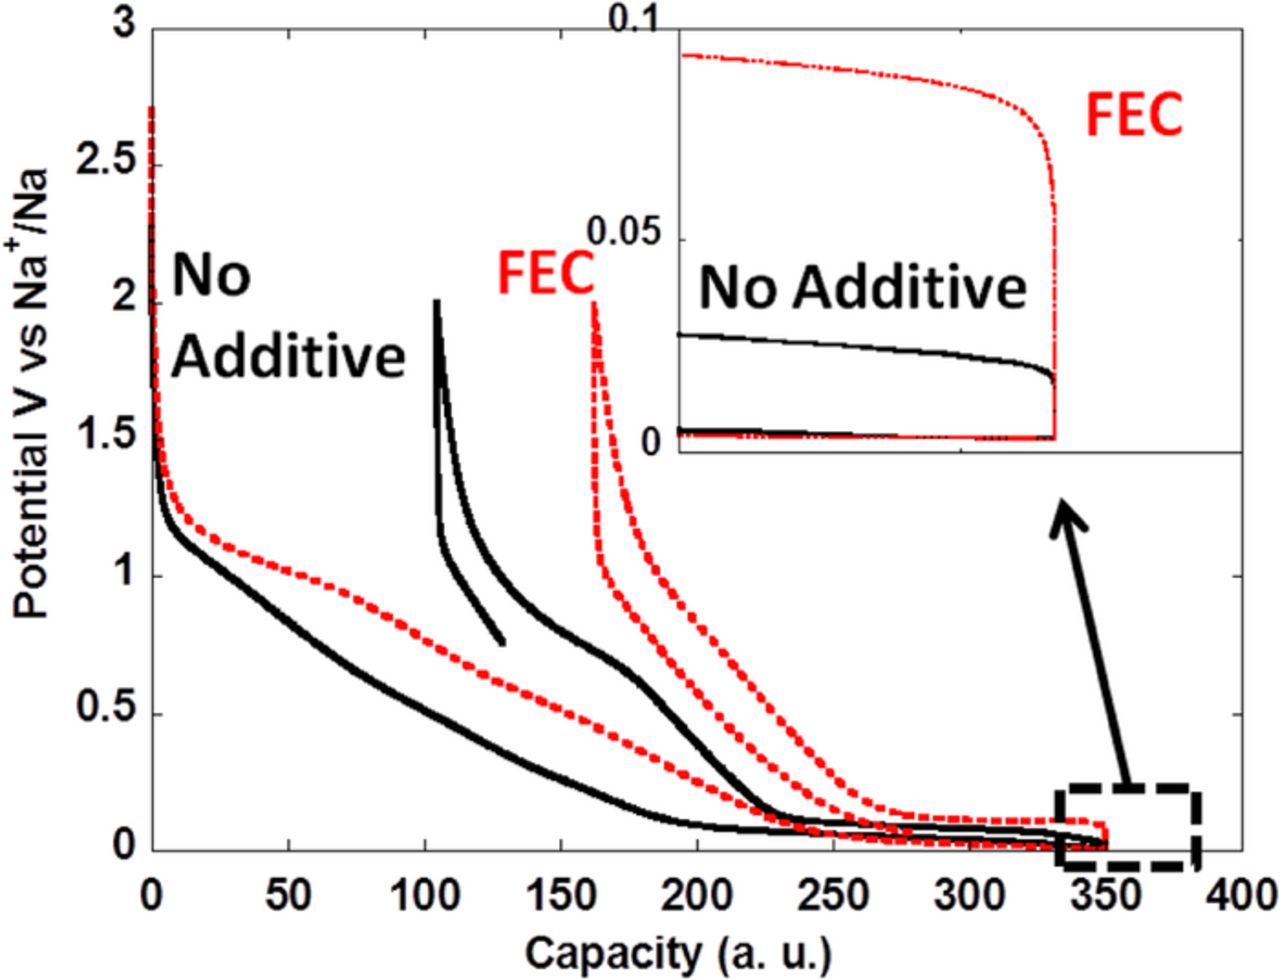
Figure 5. Potential vs. capacity profile for the first cycle of hard carbon prepared by pyrolysis of sugar when tested against sodium metal counter electrodes at C/10 in 1M NaClO4 in EC:PC with (dotted curve) or without (continuous curve) fluoroethylene carbonate (FEC) additive (2% vol). The inset shows a zoom of the low potential region from which the differences in cell polarization can be inferred. Reprinted from Ref. 18 with permission.
Several reports on the preparation (mostly between 1000 and 1200°C) of hard carbon with very diverse morphologies, microstructures and graphitization degrees have recently appeared, which exhibit also differences in electrochemical performance (see Table I). The large differences in reversible capacities for materials prepared under relatively similar conditions and exhibiting similar BET surface areas are most likely due to the cycling conditions, in agreement with the above discussed influence of the cell polarization in the amount of capacity recovered on the low potential plateau. Interesting results are deduced from the systematic study of the relation between the HC microstructure (d002 interlayer spacing, graphitization degree and micropore size and total pore volume) and the reversible capacity. Interestingly, the reversible capacity associated with Na+ insertion between the graphene layers has been found to reduce with decreasing d002 spacing (by increasing the pyrolysis temperature as mentioned above).28,56 Note that in this case the decrease in the interlayer spacing was concomitant to a decrease of the ID/IG ratio in Raman spectra. In contrast, the reversible capacity associated with Na+ adsorption within the micropores and resulting in the low potential pseudo plateau (see Figure 2) was found to increase with pyrolysis temperature (i.e. decrease in micropore size)15,28,29,56 even for samples prepared above 1200°C.28,56 Since the pores are known to close at such temperatures32 this indicates that closed pores are still accessible for Na+ adsorption and that the average pore size is the main parameter controlling the capacity recorded for the low potential pseudo plateau.
Finally, it is worth to mention the highest reversible capacity (ca. 430 mAh/g, C/10) and rate capability (ca. 340 mAh/g, 2C) for hard carbon in SIB has been recorded at 75°C (see Figure 6).54 The fact that the ratio between the Na+ insertion and adsorption capacities (ratio between the capacities delivered on the sloping region above ca. 0.12 V vs Na+/Na and the low potential plateau) is similar at room temperature and at 75°C (ca. 47% and 53% of the total capacity being associated with insertion and adsorption, respectively) together with the significant increase in the total capacity at 75°C do suggest that either the Na+ diffusion within the hard carbon particles is improved with temperature and/or the molar density of Na is increased. Indeed, the smaller reversible capacity recorded in cells using sodium metal counter electrodes when compared to those using lithium metal counter electrodes was in early studies ascribed to the lower molar density of Na (0.042 mol/cm3) than Li (0.077 mol/cm3).15 It is also clearly influenced by the different standard potentials of reduction for both metals and by the much higher impedance recorded for passivated Na when compared with Li metal counter electrodes which induces a significant additional IR drop when test are performed in half cell configuration.57 Overall, such results demonstrate the possibility for further improvements in performance for hard carbon electrodes in SIB not only by decreasing the irreversible capacity but also by enhancing the reversible capacities through mastering microstructure-performance relationships.
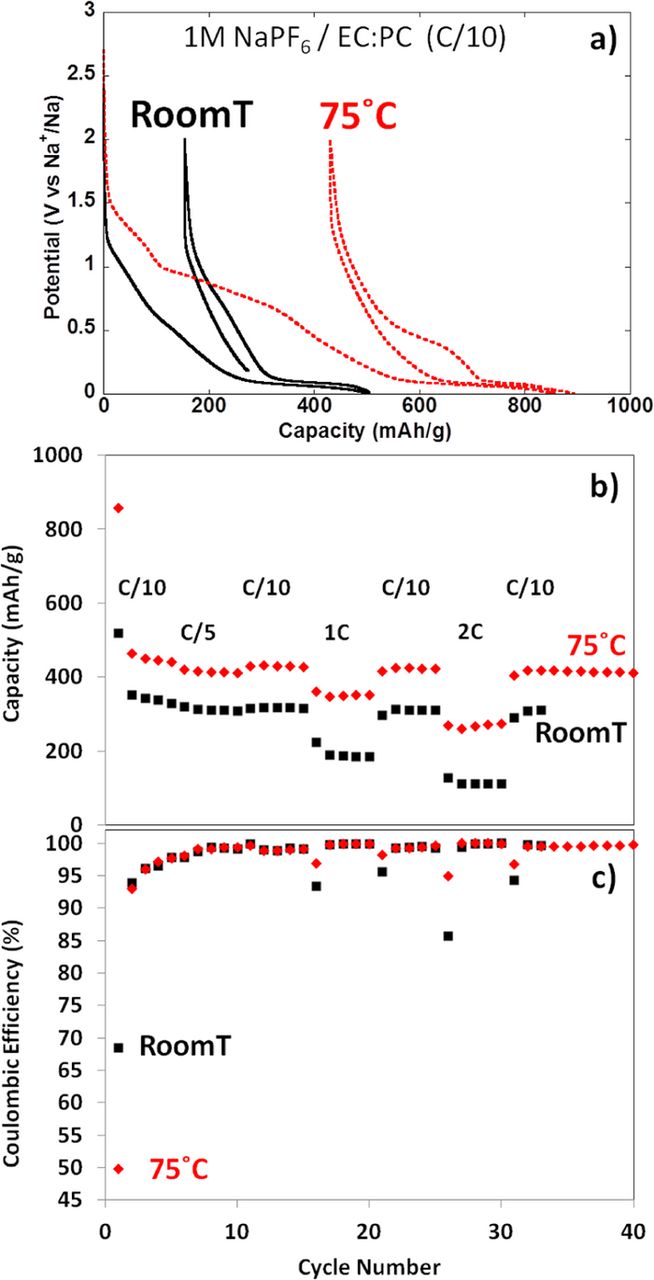
Figure 6. (a) Potential vs. capacity profile for the first cycle (b) capacity vs. cycle number and (c) coulombic efficiency for hard carbon prepared by pyrolysis of sugar when tested at the different indicated rates in 1M NaPF6 in EC:PC against sodium metal counter electrodes at 25°C (squares) and 75°C (diamonds). Reprinted from54 with permission.
Conclusions
Growing sustainability concerns coupled to emerging interest in large scale energy storage applications have boosted the interest in the SIB field. Progresses in the field are achieved at a quick pace, as they are catalyzed by the chemical analogies between lithium and sodium and the wide cumulated know-how for LIBs over the years. Yet, some points are crucial in order to assess the practical viability of the SIB technology. While several positive electrode materials are available with either layered or polyanionic structural frameworks, the choice on the negative side is much more restricted with only hard carbon currently exhibiting realistic application prospects. While the feasibility of SIB using hard carbon negative electrode materials is beyond any doubt (note that the first LIB generation was also hard carbon based), the ability to compete in performance toward alternative battery technologies relies in overcoming practical bottlenecks.
It is worth mentioning here that impact of the synthesis conditions on the tap density is also a crucial parameter determining the volumetric energy density of the cells and thus very important application wise which has unfortunately not deserved much attention to date. Within the present state of the art, the gravimetric reversible capacity of hard carbon appears to be strongly linked to microstructural features. On one hand large d002 spacing and low graphitization degree enhancing the degree of sodium insertion (capacity achieved in the sloping potential region) while porosity largely influences the adsorption ability (capacity associated to the low potential plateau). Thus, careful systematic studies of parameters involved in the pyrolysis process should enable mastering and tailoring the porosity while keeping a low graphitization degree and further improve the currently maximum reversible capacity values. The irreversible capacity upon the first cycle is the most current critical issue as it severely penalizes the practical cell energy density achievable. While this has been one of the factors behind the gradual decrease in the use of hard carbon for LIB in favor of graphitic materials, it is to be expected that this value can be diminished through suitable post annealing treatments once the surface chemistry is well understood and mastered. Thus, research must be pursued to fully understand microstrocture/property correlations to develop materials engineering strategies while taking also advantage of available knowledge in electrolytes and existing characterization tools to unravel all the reaction mechanisms involved. Indeed, hard carbon operating at such a low potential, the resistivity of the SEI, which is affected by electrolyte composition, can greatly determine the results of simple galvanostatic testing to a certain low cut off potential value. Nonetheless, once the electrolyte formulation optimized, it seems realistic to expect optimum performance even at relatively high rates. Overall, despite the undeniable difficulties ahead, the already achieved results promps to optimism. Intensive research efforts are needed to fully assess the observed trends and implement them at a larger scale to confirm attractive figures of merit in terms of cell energy density. This, coupled to the promise of improvements in sustainability and cost certainly justify the expectations of a bright future for the hard carbon based SIB technology.
Acknowledgments
Authors acknowledge Ministerio de Economía y Competititivad (Spain) and EC for funding through grants MAT2014-53500R and H2020 NAIADES project (LCE10-2014, Contract number 646433) respectively and ALISTORE-ERI members for fruitful discussions. AP is further grateful to MINECO (Spain) for grant FPDI-2013-17716.