Abstract
The electrode reactions during the initial stages of Fe electrodeposition on GaAs from a sulfate-based aqueous electrolyte, were investigated. Electrochemical quartz microbalance measurements were carried out to distinguish hydrogen evolution from Fe deposition. For conditions with a lower hydrogen evolution rate, hemispherical Fe nanoparticles with negligible in-plane magnetic anisotropy are obtained. In contrast, when hydrogen evolution dominates over Fe electrodeposition, the deposited nanoparticles exhibit a defined faceted shape, crystallographic alignment and magnetic in-plane anisotropy. This beneficial impact of hydrogen evolution on the epitaxy is discussed with regard to the role of hydrogen adsorption during Fe/GaAs interface formation.
Export citation and abstract BibTeX RIS

This is an open access article distributed under the terms of the Creative Commons Attribution 4.0 License (CC BY, http://creativecommons.org/licenses/by/4.0/), which permits unrestricted reuse of the work in any medium, provided the original work is properly cited.
High quality epitaxial growth of nanoscale magnetic materials on semiconductors is crucial for modern spintronic, magnetoelectronic, and data storage devices.1 For ferromagnetic bcc Fe, GaAs is a suitable substrate to achieve epitaxy because of the small lattice-misfit (1.4%). The research on epitaxial Fe/GaAs structures is of ongoing interest for injection and detection of spin polarized electrons,2–4 and the study of magnetism in reduced dimensions and at interfaces.5,6 For a long time, molecular beam epitaxy (MBE), was the preferred method for the fabrication of Fe/GaAs structures. The influence of MBE deposition parameters on growth mode, interface formation, and the resulting properties of Fe/GaAs structures were studied and reviewed.7 Interfacial compound formation and interdiffusion processes are critical factors determining the epitaxial quality and the resulting magnetic and transport properties.
Electrodeposition of epitaxial Fe films on GaAs has been proposed as an efficient alternative to physical deposition methods.8–14 The low-energy character of the electrodeposition technique means that interface intermixing15 is largely avoided. In general, Fe deposition on GaAs proceeds via island nucleation, coalescence, and subsequent film growth, which for electrodeposition is typically at rates of 2–6 nm/s, perhaps 100 times faster than MBE. Furthermore, at the point of coalescence, the thickness lies above 20 nm for electrodeposition,10 in stark contrast to about 3 atomic layers for MBE.16 Therefore, most studies on electrodeposited Fe on GaAs8–13 have focused on the fabrication of films of several 100 nm, and the structural, magnetic12 and spin transport characterization13 of these. Recently, we demonstrated that epitaxial Fe nanocuboids can be achieved when the deposition is stopped prior to coalesce of the nuclei in a lower-concentration electrolyte with reduced deposition rate.17
The identification of the factors affecting the epitaxial alignment requires a study of the initial processes of film deposition. Additional processes occurring at the polarized solid electrode/liquid electrolyte interface must be considered, in contrast to preparation in vacuum. It is known that the hydrogen evolution reaction proceeds simultaneously with the reduction to Fe on GaAs,8,11,14 but the influence of this side reaction on the initial Fe deposition and epitaxial growth has not been discussed up to now. One difficulty for the study of this nucleation stage is the high deposition rates encountered in electrolytes typically composed of 0.1 mol/l of Fe salt.9–11
In the present study, a lower Fe ion concentration of 0.01 mol/l was utilized to achieve lower deposition rates. The electrode processes in this electrolyte were characterized by electrochemical quartz microbalance measurements to distinguish Fe electrodeposition from hydrogen evolution. The morphology and magnetic anisotropy of Fe nuclei deposited on GaAs was investigated as a function of the current density, j, to elucidate relationships between electrochemical mechanisms and epitaxial alignment.
Experimental
The electrolyte was freshly prepared and composed of 0.01 mol/l FeSO4, 0.03 mol/l (NH4)2SO4 and 0.3 mol/l Na2SO4, the pH was 5.1. Three-electrode electrochemical cells with a Pt sheet as a counter electrode and a saturated calomel electrode (SCE) as a reference electrode were utilized. All potentials, E, are reported versus SCE in the following. Measurements using an electrochemical quartz crystal microbalance (EQCM, QCA 922 Seiko EG&G Co), combined with potentiostat (Biologic SP 50) using a Au-coated quartz crystal were carried out to characterize the electrode processes. The calibration of the quartz microbalance was performed using Cu electrodeposition and yielded a weight sensitivity factor, cf of 2.2 × 108 cm2 Hz/g. Cyclic voltammetry (CV) was performed with a starting potential of 0.09 V and a switching potential of −1.50 V. The mass change, Δm, is calculated from the measured frequency shift, Δf, via the Sauerbrey equation:18
![Equation ([1])](https://content.cld.iop.org/journals/1945-7111/165/4/H3076/revision1/d0001.gif)
where A is the electrode area. For comparison with the total measured current density, j, the partial current density of Fe electrodeposition, jFe, is calculated via the Faraday law:
![Equation ([2])](https://content.cld.iop.org/journals/1945-7111/165/4/H3076/revision1/d0002.gif)
where M is the molar mass of Fe, n = 2 (number of electrons involved), F is the Faraday constant, and t is the time.
Galvanostatic Fe electrodeposition was carried out at room temperature in ambient light, on single crystalline, (001) oriented n-type GaAs wafer (Si doping concentration 1018 cm−3) cleaved into rectangular pieces of typical area 1 × 2 cm2. The back side and {110} sides of each substrate piece were masked by photoresist to define the window for deposition on the front side. An electrical contact was made on the back side of the substrate using InGa alloy paste. Just prior to deposition, the substrate was etched in an aqueous ammonium hydroxide (10 %) solution for 10 s and then rinsed with deionized water for 10 s. The substrate was then transferred into the electrolyte and galvanostatic electrodeposition was initiated quickly. The deposition time was 10 s.
Surface images of the deposits were captured using helium ion microscopy (HIM, Zeiss Nanofab) with a scanning He ion beam (30 kV, 0.53 pA) and detection of the emitted secondary electrons (SE). Atomic force microscopy (AFM, Brucker) in tapping mode (scan rate 0.5 Hz) was performed to gain height and root mean square (RMS) roughness values.
For magnetic characterization, ferromagnetic resonance (FMR) measurements were performed with an X-band spectrometer (EMX, Bruker, H102 cavity, modulation amplitude 30 Gauss, microwave frequency 9 GHz) at room temperature. The spectra were recorded with the magnetic field, B, applied along defined in-plane directions after turning a pre-magnetized sample by 180°. In the FMR spectra, the derivative of the absorptive part of the high frequency susceptibility, dX''/dB, is evaluated. The spectra were baseline corrected, calculated by fitting a straight line to the derivative curves at high fields where the microwave absorption of the iron is negligible.
Results
The measured j(E) and Δf(E) from EQCM on Au during CV, are displayed in Figure 1a. For the cathodic direction, jFe(E) as calculated from Δf(E), is plotted in comparison to j(E) in Figure 1b. Considering both plots, the cathodic j recorded beginning at −0.96 V, is predominantly caused by Fe electrodeposition, since a frequency change is recorded simultaneously. The j-peak at −1.00 V shows that Fe electrodeposition becomes transport limited. For −0.96 V < E < −1.10 V, where |j| < 1.6 mA/cm2, jFe is almost identical to j. This signifies that in this potential region, hydrogen evolution is still negligible and Fe electrodeposition is the main electrode process with a current efficiency jFe/j close to 100%. For a more negative potential than −1.12 V, the cathodic j increases again, while the slope of Δf continuously decreases. This second j increase is thus due to hydrogen evolution and is not associated with a mass deposit increase. Due to the abundance of water molecules in front of the electrode, hydrogen evolution does not become transport limited. The increasing discrepancy between jFe and j shows that hydrogen evolution quickly dominates. This is reflected in the strongly decreasing ratio of jFe/j when polarizing further negative of −1.12 V, from 14, 10, and 4% for cathodic |j| = 2, 3, and 5 mA/cm2, respectively.
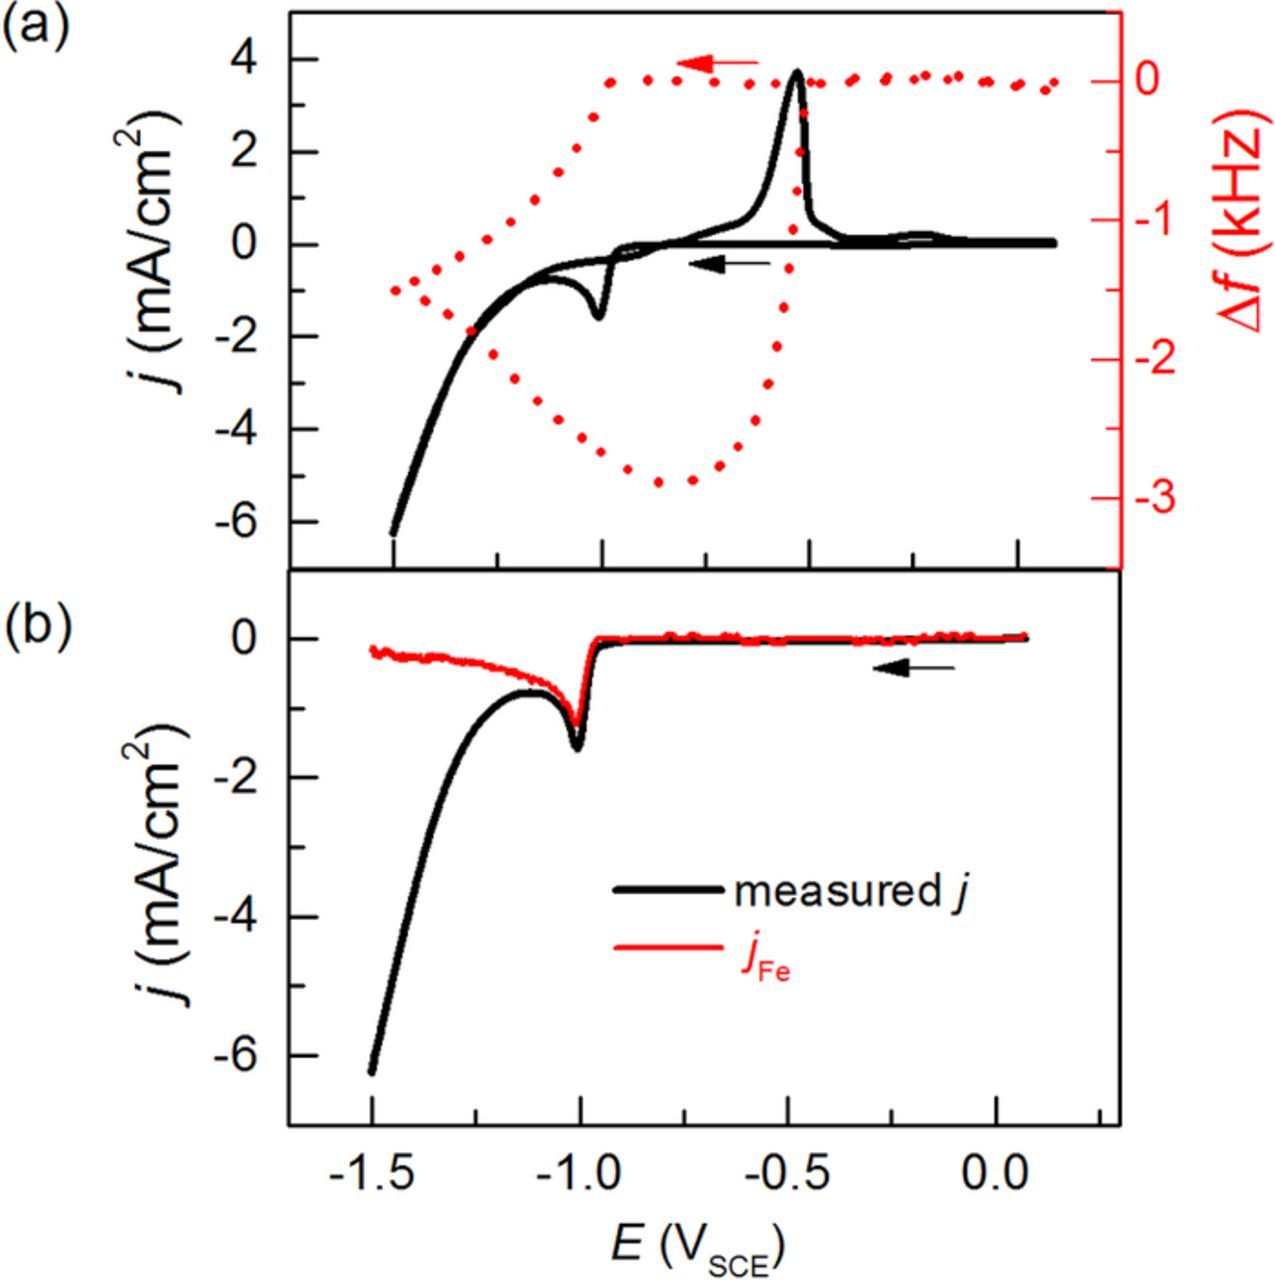
Figure 1. EQCM data during CV (a) j(E) (solid black line) and Δf (E) (dashed red line) for a full cycle scan and (b) j(E) and jFe(E) (red line, derived from Δf) for the cathodic scan. The measurements were conducted at a scan rate of 10 mV/s.
Cathodic curves j(E) obtained on Au and GaAs with and without Fe ions in the electrolyte are compared in Figure 2. In the absence of Fe2+ ions in the electrolyte, the hydrogen evolution is strongly suppressed on GaAs in comparison to Au metal as electrode. For the complete electrolyte, the peak indicating Fe ion reduction is shifted by 0.2 V to a more negative E on GaAs compared to on Au. At more negative E, the j(E) curves are comparable, which indicates that the hydrogen evolution starts and proceeds approximately the same way for Fe nuclei on GaAs as for Fe nuclei on Au. This allows us to use the EQCM data on Au to estimate the evolution of jFe/j on GaAs. It can be inferred that similar to the behavior on Au, jFe/j will drastically decrease on GaAs due to the enhancement of hydrogen evolution when increasing the cathodic |j| above 1.9 mA/cm2. The enhanced hydrogen evolution during Fe electrodeposition is understandable since metal Fe is known to catalyze the hydrogen evolution19 and Fe nuclei will act as additional active sites. It is expected that the majority of the electrochemical charge transfer occurs at the Fe metal/electrolyte interface, instead of the semiconductor/electrolyte interface.20
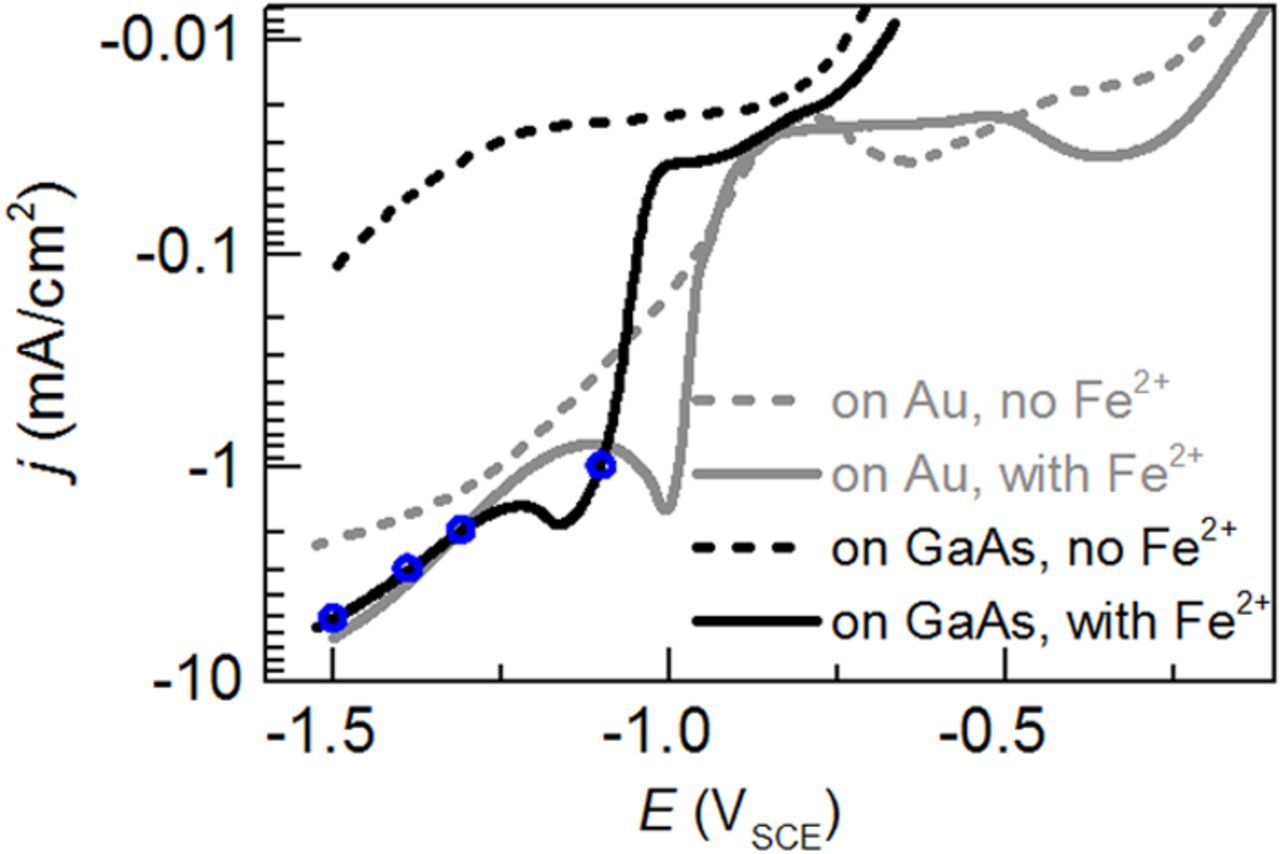
Figure 2. j(E) curves obtained at 10 mV/s for the complete electrolyte (solid lines) and an Fe-ion free electrolyte composed of 0.03 M (NH2)4SO4 and 0.3 M Na2SO4 (dashed lines). The blue rings mark the j-values used for galvanostatic deposition.
To study the impact of hydrogen evolution on nucleation and epitaxial growth, Fe deposition was carried out at |j| = 1, 2, 3, and 5 mA/cm2. The morphology of the resulting Fe nuclei is presented in Figure 3, which shows SE images from HIM. At all j, a nanoparticulate morphology is obtained. For |j| = 1 mA/cm2, the nuclei are well separated, exhibit a round shape, and are clearly formed by a 3D island growth mode. Up to 3 mA/cm2, the increase in |j| leads to an increase in the number of the nuclei. For 3 and 5 mA/cm2, the nuclei exhibit more edged and aligned features, consistent with improved epitaxial growth.

Figure 3. Secondary electron images via He ion microscopy of the surface of Fe nuclei deposited at |j| of (a) 1, (b) 2, (c) 3, and (d) 5 mA/cm2 for 10 s on GaAs (100).
Figure 4 shows that a decrease in average height and RMS roughness occurs when increasing |j| from 1 to 3 mA/cm2. Exemplary AFM line profiles are depicted in Figure 4b. An enhanced lateral growth of the nuclei is obvious at 3 mA/cm2, in comparison to 1 mA/cm2. This is consistent with the greater coalescence of the Fe seen in the HIM images of Figure 2. The growth mode does not change further between 3 and 5 mA/cm2.
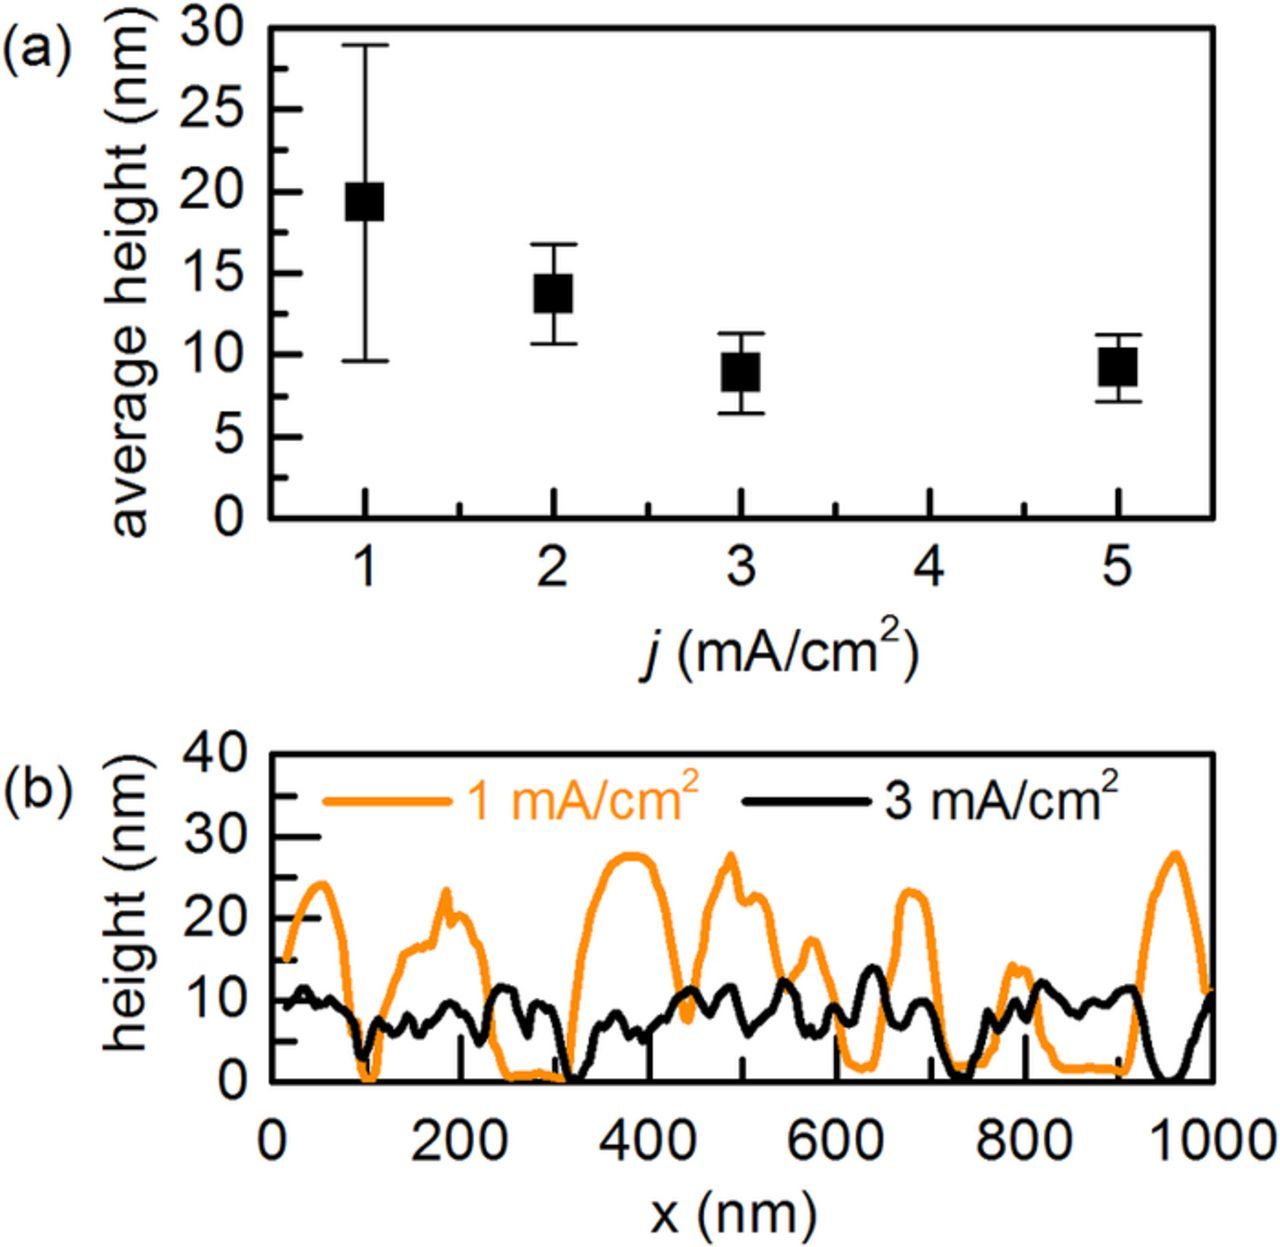
Figure 4. (a) Average height obtained from 2.5 μm x 2.5 μm area AFM images of iron nanoparticles on GaAs, as a function of cathodic j. The error bars are RMS values. (b) AFM line profiles for |j| of 1 and 3 mA/cm2. The deposition time was 10 s in all cases.
Epitaxial growth of bcc Fe results in a magnetic anisotropy in the substrate plane that is measurable by comparing the FMR spectra along the <100> and <110> directions.17 Calculations21 and experiments17 show that the resonance spectrum shifts to higher B values when the external B-field is applied along a <110> direction, in comparison to the case where B is applied along a <100> direction. The reason is the magnetocrystalline anisotropy of bcc Fe, which causes the <110> direction to be the magnetically harder axis in bcc iron. Previous discussion17 revealed that other possible contributions to the in-plane magnetic anisotropy, based on, e.g., shape anisotropy, dipolar interaction between the islands, and/or edge effects are expected to be negligible in comparison to the magnetocrystalline anisotropy. This makes FMR a valuable tool to detect epitaxial alignment, especially for cases like the present one where direct structural investigation by X-ray diffraction is hampered by low material volume and overlapping peaks with the substrate. In Figure 5, the evolution of the FMR spectra for the deposited Fe nuclei with increasing |j| is depicted. For 1 mA/cm2, only a small shift of the FMR curve between the two directions is recorded, revealing that the majority of the Fe nuclei are not epitaxial. The difference between the two directions becomes more pronounced upon increasing |j| up to 3 mA/cm2, pointing to an improvement in epitaxial growth. In agreement with the results of the HIM and AFM analysis, no further relevant change occurs between 3 and 5 mA/cm2.
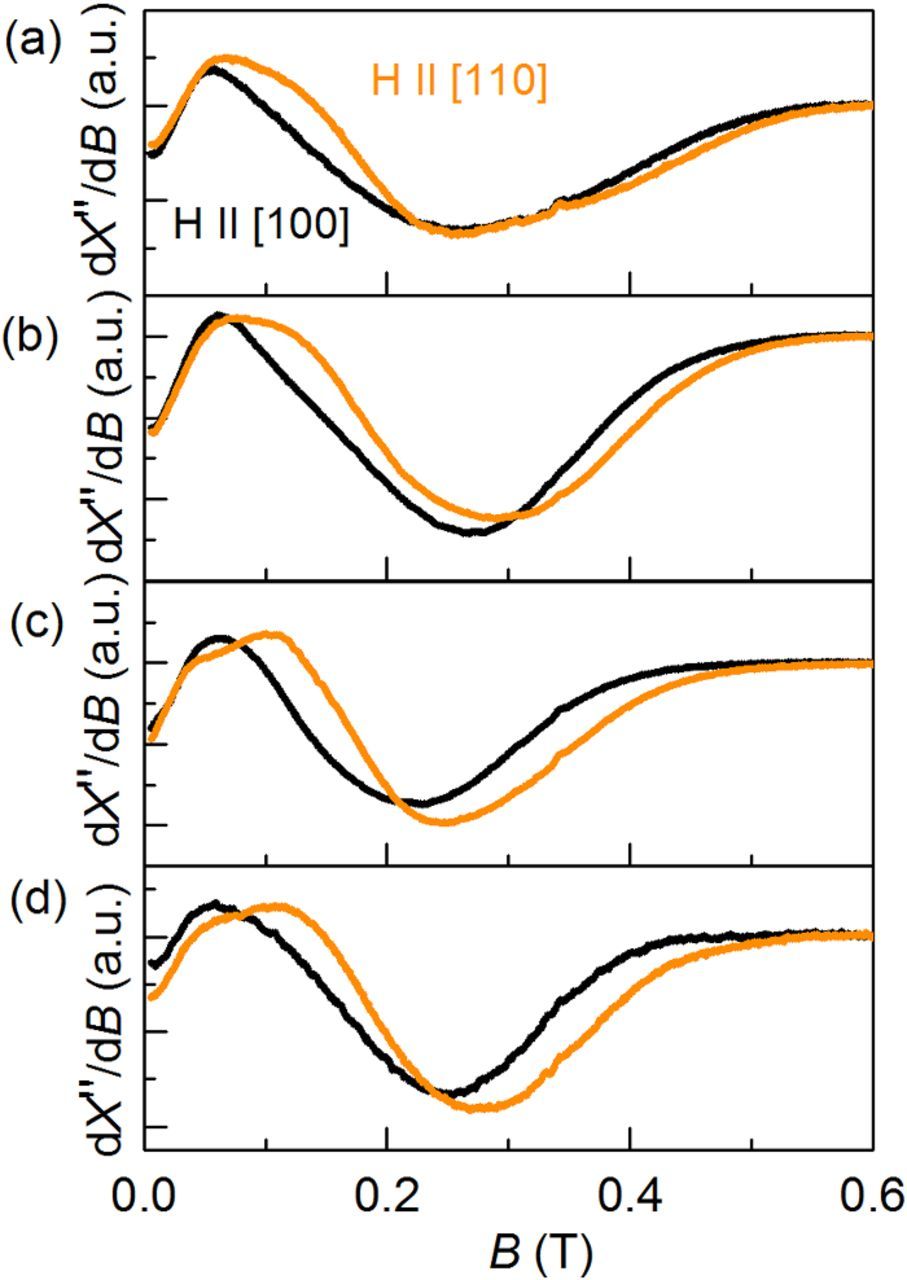
Figure 5. FMR spectra plotting the derivative of the absorptive part of the high frequency susceptibility, dX''/dB versus applied magnetic field, B, of iron nanoparticles electrodeposited on GaAs (001) at |j| of (a) 1 (b) 2, (c) 3, and (d) 5 mA/cm2 for 10 s.
Discussion
It can be concluded from the combined results from electrochemical, morphological and magnetic anisotropy studies, that better epitaxial growth is obtained when the Fe deposition takes place at higher |j|, where hydrogen evolution strongly accompanies the reduction to Fe. At first glance, this is unexpected, since the opposite, namely lowering |j|, and thereby the growth rate, was suggested as a route for better epitaxy of Fe on GaAs.9 However, this route has not been experimentally confirmed. In contrast, in experiments in the systems Au/Si22 and Bi/GaAs,23 an improved epitaxial growth and crystallinity of contacts is achieved when electrodeposition takes place at or after application of more cathodic E, and thus higher |j|. In both cases,22,23 the improved film growth has been ascribed to the role of hydrogen evolution. This is in agreement with the present observations and suggests that also for Fe/GaAs the interplay between hydrogen evolution and Fe nuclei during the first stages of electrodeposition is decisive for epitaxial interface formation.
Our GaAs substrate preparation included an etching procedure involving aqueous ammonium hydroxide and therefore, it is probable that the surface is initially OH-covered.24 After immersion into the acidic electrolyte at the open circuit potential, an As-H adsorption layer is expected to form due to electron transfer from the n-GaAs to the electrolyte to reach electrochemical equilibrium.25 In situ spectroscopic studies reveal that on GaAs in acidic electrolytes, the adsorption of hydrogen only occurs at As-sites.27 In the present case of deposition at 1 mA/cm2, where hydrogen evolution is negligible, this adsorbate layer is expected to remain intact, and thus no specific favorable sites for the deposition of Fe adatoms exist. Analogous to Au on Si-H,22 the adsorption layer may even remain intact below the Fe nuclei and thereby hinder epitaxial interface formation. In this case, the observed pronounced 3D growth can be explained by the preferred Fe deposition on top of the early formed Fe nuclei. This is considered the typical growth mode for metals on semiconductors and related to the faster electron transfer on the metal nuclei than on the semiconductor.26
Upon increasing |j| to 2 mA/cm2 and higher values, the hydrogen evolution becomes a second reaction that accompanies the Fe ion reduction. The hydrogen evolution reaction requires adsorbed hydrogen, Hads, as an intermediate species.28 Since the mobility of Hads is negligible due to the covalent character of the As-H bond, the hydrogen molecule is produced by a second electron transfer at the same As-site.27 In contrast to hydrogen evolution on pure GaAs, the presence of Fe nuclei obviously has a strong impact on hydrogen evolution (Figure 2). The boundary between early-formed nuclei and GaAs will be a favorable site for hydrogen evolution, because of the higher density of states in metal Fe compared to GaAs. The most reactive As sites are thus created next to the Fe nuclei, which then promotes preferential Fe adatom deposition at these As-sites and results in the enhanced lateral growth of the Fe nuclei. This explains how hydrogen evolution in parallel to Fe deposition can lead to improved interface formation and epitaxy of Fe on GaAs. It is analogous to the mechanism postulated for the potential-dependent transition from 3D to pseudo 2D growth of Au on Si.22
The chemisorption of hydrogen on the growing Fe nuclei must be considered as well.29 When the hydrogen reduction reaction is strong, a monolayer of Hads is expected at the Fe surface which may enhance self-surface mobility.30 In this respect, the increased H adsorption on the Fe nuclei at high |j| could be another factor promoting lateral rather than 3D growth by facilitating diffusion of Fe adatoms toward step edges. It should be noted that the situation may be more complex because of possible ammonia and sulfate adsorption that can influence the surface energies and thereby affect the island shape.
At strong hydrogen evolution, a pH change in front of the electrode occurs31 which may lead to self-termination phenomena during metal deposition.32 In a simple chloride bath, self-termination of ultrathin Fe films has been observed near −1.5 VSCE and attributed to the formation of a passivating Fe(OH)2 layer.32 In the present case, however, for all |j| studied, self-termination is not observed. For example, after prolonged deposition times of 300 s at |j| = 5 mA/cm2 a 70 nm thick continuous film is obtained. The absence of self-termination is attributed to the presence of NH4+, since this ion inhibits Fe(OH)2 precipitation by forming ferrous amine species.33
The considerations of the importance of Hads and hydrogen evolution on the interface formation and growth of the Fe nuclei, point to the crucial importance of the initiation procedure. For epitaxial electrodeposition of Fe on GaAs, most often the substrate is immersed electrically "hot", but the underlying mechanism for an improvement has not been conclusively identified.9,13,17 For the same electrolyte as used in the present study, we recently showed that the electrically "hot" immersion with a potential applied before and during immersion, gives better epitaxial properties according to the FMR results.17 The role of the hydrogen evolution proposed in the present study can explain this favorable effect: in the case of "hot" immersion, a strong hydrogen evolution and Fe deposition are initiated immediately, and the As-H adsorption layer cannot form during immersion prior to Fe deposition. We expect that also the use of a high |j| or E initiation pulse that removes the As-H adsorption layer on GaAs formed during immersion prior to Fe deposition is beneficial for the epitaxial interface formation.
Summary
A combination of electrochemical, morphological and magnetic analysis allowed us to uncover the crucial role of hydrogen evolution reactions during the nucleation of Fe on GaAs. A strong dependence of the morphology and epitaxy on j is evident and this can be explained, at the atomic scale, by the interplay between hydrogen evolution and growth of the Fe nuclei. At higher |j| the hydrogen evolution takes place in parallel with Fe deposition. In this case, an improved epitaxy is observed that can be connected to the preferential hydrogen evolution occurring at the boundary of the nuclei and thereby creating active Fe metal growth sites next to the nuclei. The detection of the beneficial role of hydrogen evolution is an important step toward disentangling the complex situation at the electrode/electrolyte interface during metal electrodeposition on GaAs.
Acknowledgments
We acknowledge M. Henschel, S. Röher, and W. Abdel-Haq for carrying out additional AFM, electrochemical measurements, and quantitative image analysis, respectively. This work is partially supported by the DFG (project No. LE2558/1-1), NSERC, CFI and BCKDF, 4D Labs, and the excellence program initiative of the IFW Dresden.
ORCID
Karin Leistner 0000-0002-8049-4877