Abstract
The energy density of lithium-ion batteries can be enhanced by using thicker and denser electrodes, which leads to transport limitations in the electrolyte within the porous structures. A pore morphology modification of the electrodes can counteract this limitation mechanism and provide higher rate capabilities of the cells. In this work, graphite anodes are structured with a picosecond laser in order to create transport pathways for the lithium-ions and allow for enhanced penetration of the electrodes. Experimental data from graphite/NMC-111 coin cells with varying areal capacities are used for the development and parameterization of an electrochemical model. The modified pore morphology of the structured electrodes is represented in the model by an adapted tortuosity, which results in lower lithium-ion concentration gradients and reduced diffusion polarization in the electrolyte. The effect of electrode thickness and tortuosity on limiting mechanisms is analyzed via simulation studies in order to derive the impact of structured electrodes. As a result, improved discharge as well as charge rate capability appears beside enhanced safety features such as increased tolerance versus hazardous lithium-plating during fast charging scenarios.
Export citation and abstract BibTeX RIS

This is an open access article distributed under the terms of the Creative Commons Attribution 4.0 License (CC BY, http://creativecommons.org/licenses/by/4.0/), which permits unrestricted reuse of the work in any medium, provided the original work is properly cited.
Lithium-ion batteries are the prevailing energy storage system for electric vehicles, stationary energy devices, mobile applications and power tools.1 Especially electric vehicles require increasing energy densities to offer a satisfactory driving range for customers.2,3 While solid state technologies are under ongoing development, they face a lot of challenges and cannot provide the required energy density, current capability and cycling stability.4 Therefore, lithium-ion batteries comprising porous electrodes filled with liquid electrolyte are still the state-of-the-art technology.
One way to increase the energy density is the use of new active materials,2,3,5 e.g. combining a nickel-rich lithium nickel manganese cobalt oxide (NMC-811) cathode with a silicon/graphite anode.6 The performance of an existing active material can also be enhanced by nanostructuring methods7–10 or by changing the electrode formulation, composed of active material, binder and carbon black.11–16 Another option lies in an optimized cell design in order to increase the share of active material and reduce the share of passive parts like current collectors, tab connectors or the housing.17 Thicker and denser electrodes offer an opportunity to increase the required energy density independently of the used active material, but face issues when they are stressed with higher currents.13,18–21 One major contributor are mass transport limitations in the electrolyte.21–25
Electrode pore morphology modifications provide a potential to overcome limitations arising from thicker and denser electrodes.13,26–28 The path length, the lithium-ions have to travel in the electrolyte through the porous electrode, is defined by the thickness, the porosity and the tortuosity.17,29 Primarily, high charge/discharge currents lead to a poor battery performance, as the overpotentials increase and the full capacity cannot be utilized.28 Depending on the application and the desired requirements, current research focuses on improving the properties of anode30–32 and cathode33–37 composites by a modification of their structure. Besides an increased battery performance, an introduction of macro channels or pores into the electrode can lead to a reduced wetting time during the cell manufacturing process.13,38
The focus in this work lies on modified graphite anodes using a laser-structuring process.31 It will be demonstrated, that lithium-ion cells comprising structured graphite anodes not only provide a higher discharge rate capability,39 but also exhibit an opportunity to tackle issues concerning fast charging.40 While the discharge performance, determined by the maximum discharge current, of state-of-the-art lithium-ion batteries is at a practical level for most applications, fast charging capability of energy storage systems is becoming more and more important. If the energy density of lithium-ion batteries cannot be increased to a satisfactory level, especially electric vehicles rely on fast charging capability to overcome range anxiety of potential customers.
Experimental data gained from measurements on graphite/NMC-111 coin cells comprising unstructured and structured graphite anodes with varying thicknesses are used for the development of an electrochemical pseudo two-dimensional (p2D) model. With the aid of simulation studies, the influence of the electrode pore morphology on the charging and discharging behavior is analyzed and design criteria of electrodes are provided.
Experimental
Electrode fabrication
A rotation-revolution mixer (Speedmixer DAC 3000, Hauschild Engineering, Germany) was used to mix the components for the electrode inks with N-methyl-2-pyrrolidone (NMP, Sigma-Aldrich, USA) at ambient pressure and temperature. The cathode ink contained 96 wt% LiNi1/3Co1/3Mn1/3O2 (NMC-111) (BASF, Germany), 2 wt% polyvinylidene fluoride (PVDF, Kynar, Arkema, France) and 2 wt% conductive carbon (C65, Timcal, Switzerland). In terms of the anode, 95 wt% graphite (SGL Carbon, Germany) and 5 wt% PVDF were used. Doctor blade coating was performed in an industrial roll-to-roll coating machine (Coatema, Germany) equipped with an infrared dryer at a coating speed of 0.5 m min− 1. Four different anode and cathode coating thicknesses were prepared and subsequently calendered in order to achieve a final porosity of approximately 35%. The anode and cathode composition remained constant for each coating. The resulting electrode thicknesses accounted for 71 μm, 79 μm, 90 μm and 116 μm for coatings 1 to 4, respectively.
Laser-structuring of anodes
For the electrode pore morphology modification, picosecond laser pulses from an Ytterbium fiber laser (YLPP-1-150V-30, IPG Photonics, USA) at infrared wavelengths were locally employed to ablate small fractions of the composite material and induce hole-like structures into the anode coatings. The cathode coatings as well as the current collectors of both electrodes remained pristine. The structuring process parameters were adjusted so that the holes reached down to the copper current collector, which resulted in an ablated fraction of around 5 to 10 wt% of the composite electrode material, depending on the electrode thickness, determined by weighing the electrode sheets before and after structuring. The structures were spatially distributed in a hexagonal pattern with a lateral length of 100 μm. As more particles are removed in the structuring process close to the surface of the coating, the structures are not perfectly cylindrical. On the surface, the hole diameter was around 25 to 35 μm, but the structures narrowed toward the deeper parts of the electrode. The structuring process was performed with an average laser power of 10 W, a pulse repetition frequency of 1.2 MHz, a pulse energy of 8.33 μJ and an irradiation time of 0.6 ms per structure. The focal diameter of the laser beam was approximately 25 μm, measured with a high-precision beam diagnostics device (MicroSpotMonitor, PRIMES, Germany). For the deflection of the laser beam, scanning optics (Racoon 21, ARGES, Germany) were used. A scanning electron microscope (SEM) image of a laser-structured graphite anode is displayed in Fig. 1. For a more detailed description of the experimental setup for laser-structuring as well as process analyses, the reader is referred to our previous work.31,38
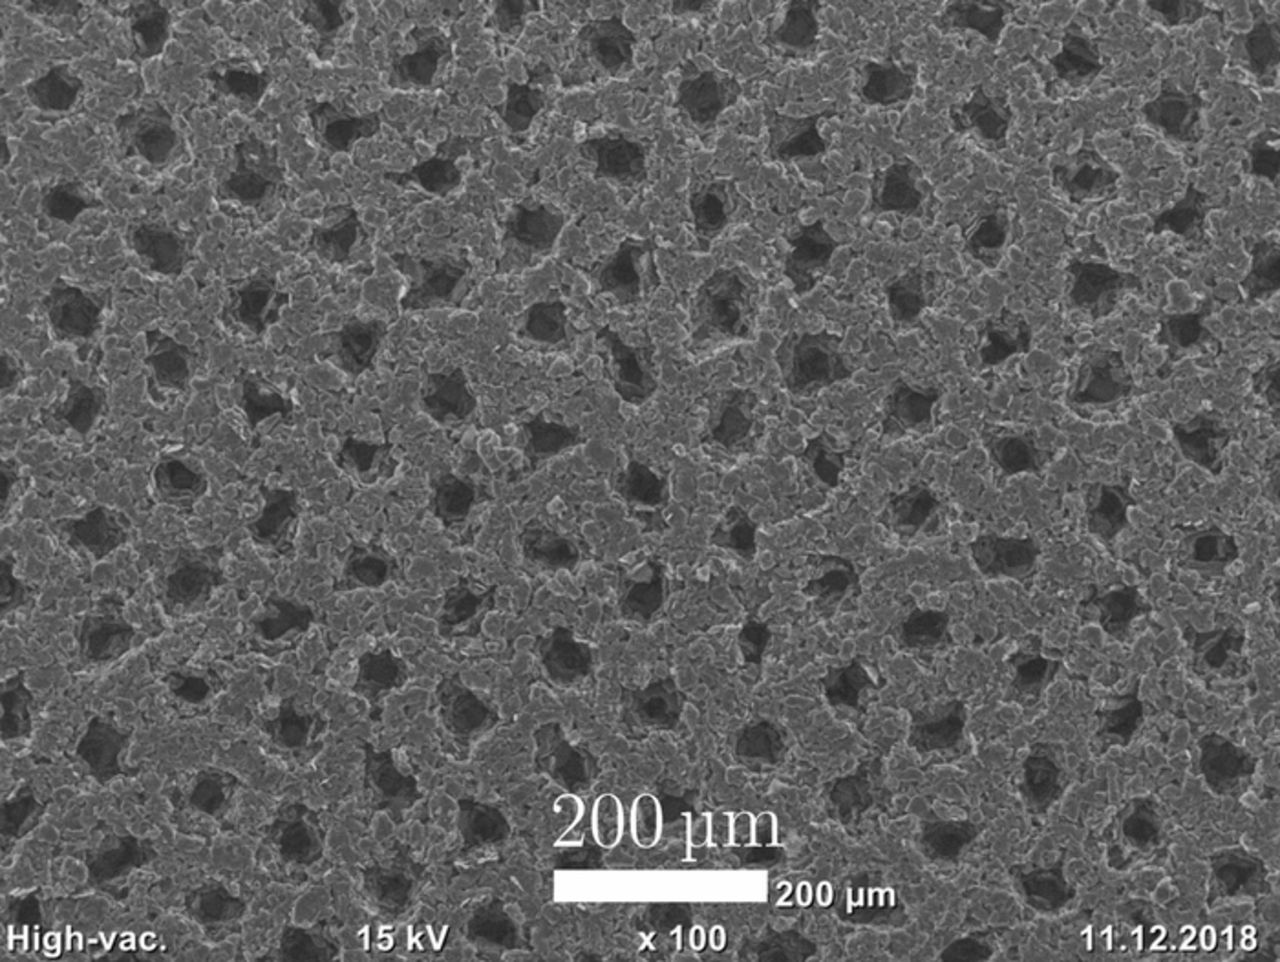
Figure 1. SEM image of a laser-structured graphite anode.
Coin cell assembly
Coin cells of the type 2032 were assembled in an argon filled glove box (M. Braun Inertgas-Systeme, Germany) at purity (H2O < 0.1 ppm, O2 < 0.1 ppm). The cathode coins were punched at a diameter of 14 mm, the anode coins at a diameter of 15 mm. A glass microfiber sheet (Type 691, VWR, USA) with a diameter of 16 mm was used as separator. In its uncompressed state, the separator has a thickness of 260 μm. Due to the compression during cell assembly, the separator thickness is estimated to be around 200 μm.41 The used glass fiber separator shows a high porosity and low tortuosity, compare Table AI, resulting in a MacMullin number of approximately 1.7. Separators used in commercial lithium-ion cells are thinner (15–30 μm) but exhibit a higher MacMullin number (5–15), which in turn results in a comparable effective path-length for the lithium-ions.42 Particularly for the assembling of laboratory cells, these glass fiber separators provide a better ease of handling and serve as an electrolyte reservoir that prevents the cell from drying out during cycling.43,44 Each cell was filled with 100 μl of electrolyte (LP57, BASF, Germany), containing ethylene carbonate (EC) and ethyl-methyl-carbonate (EMC) in a ratio of 3:7 (by weight) with 1 M lithium-hexaflourophosphate (LiPF6). The assembly included two aluminum spacers, each with a thickness of 1 mm in order to fill the housing caps, a wave spring and an insulation ring.
Table AI. Model parameters used within this work; numeric values and magnitudes of parameters chosen in this study were referenced to literature where applicable.
| Parameter | Anode | Separator | Cathode |
|---|---|---|---|
| Geometry | |||
| Thickness l | Table I | 200 μm41 | Table I |
| Particle radius rp | 5 μm I | 5.5 μm I | |
| Solid phase fraction εs | 0.53 II | 0.5 II | |
| Liquid phase fraction εl | 0.35 m | 0.7 e | 0.35 m |
| Tortuosity τ | Table I | 1.2 e | 1.855 |
| Thermodynamics | |||
| Equilibrium voltage Eeq | Ref. 31 | Ref. 31 | |
| Maximum lithium concentration cs, max | 32000 mol m− 373 | 50000 mol m− 373 | |
Lithiation at 100% SOC  |
0.71 e | 0.43 e | |
Lithiation at 0% SOC  |
0.003 e | 0.91 e | |
| Kinetics | |||
| Anodic reaction rate ka | 6 × 10− 11 m s− 1 e | 6 × 10− 11 m s− 1 e | |
| Cathodic reaction rate kc | 6 × 10− 11m s− 1 e | 6 × 10− 11m s− 1 e | |
| Anodic charge-transfer coefficient αa | 0.567 | 0.567 | |
| Cathodic charge-transfer coefficient αc | 0.567 | 0.567 | |
| Transport | |||
| Solid diffusivity Ds | 1 × 10− 14 m2 s− 176 | 1.8 × 10− 13 m2 s− 173 | |
| Solid conductivity σ | 100 S m− 168 | 10 S m− 168 | |
| Parameter | Electrolyte | ||
| Electrolyte diffusivity Dl |  76 in m2 s−1 76 in m2 s−1 |
||
| Electrolyte conductivity κ |  71 in S m−1 71 in S m−1 |
||
Activity dependence  |
 77 77 |
||
| Transport number t+ | 0.3877 | ||
| Parameter | Global | ||
| Temperature T | 298.15 K m | ||
| Ohmic contact resistance Rcontact | 9.75 × 10− 4 Ωm2 e |
m measured value, e estimated value. I derived from D50 mass-median-diameter from datasheet. IIderived from weight ratio of electrode composition.
Six coin cells – three cells with unstructured anodes and three with structured anodes – were assembled for each of the four loadings as shown in Table I. The cell capacities used for the formation procedure were calculated by determining the coating mass and assuming mass specific capacities of 150 mAh g− 1 for NMC-111 and 360 mAh g− 1 for graphite. The areal capacity of the anode coatings was overbalanced by approximately 20% compared to the capacity of the cathode coatings in order to have a N/P ratio greater than unity and to avoid lithium-plating during charging. The structured anodes still remained overbalanced since the loss of material during the ablation process only accounts for approximately 5–10 wt% of the coating. For a more even balancing, the anodes with more active material due to manufacturing tolerances were used for the structuring process. Additionally, cathodes with less active material, determined by weighing, were paired with anodes with less active material, i.e. the structured ones.
Table I. Characterization of the four loadings comprising unstructured and structured anodes.
| Measured | Electrode | Modeled areal | Anode | |||
|---|---|---|---|---|---|---|
| Loading | Anode type | Abbreviation | capacityI | thicknessII | capacityIII | tortuosity |
| 1 | unstructured | L1U | 3.54 mAh | 71 μm | 2.26 mAh cm− 2 | 5.5 |
| structured | L1S | 3.42 mAh | 71 μm | 2.26 mAh cm− 2 | 3.5 | |
| 2 | unstructured | L2U | 3.90 mAh | 79 μm | 2.50 mAh cm− 2 | 5.5 |
| structured | L2S | 3.80 mAh | 79 μm | 2.50 mAh cm− 2 | 3.5 | |
| 3 | unstructured | L3U | 4.57 mAh | 90 μm | 2.90 mAh cm− 2 | 8.5 |
| structured | L3S | 4.33 mAh | 90 μm | 2.90 mAh cm− 2 | 5.5 | |
| 4 | unstructured | L4U | 6.00 mAh | 116 μm | 3.82 mAh cm− 2 | 8.5 |
| structured | L4S | 5.77 mAh | 116 μm | 3.82 mAh cm− 2 | 6.5 |
Iaverage cell capacity determined by the C/20 discharge cycle. IIaccounts for both, anode (lneg) and cathode thickness (lpos). IIIderived from the averaged measured capacities and normalized to the cathode area of 1.54 cm2.
Formation procedure and rate capability test
After assembly, all cells went through a formation procedure of three charge and discharge cycles at a constant current (CC) of C/10 related to their calculated capacity within a voltage window between 4.2 V and 3.0 V after the first charge. A detailed overview of the measurement procedures is given in Table II. All measurements were performed with a CTS battery test system (BaSyTec, Germany) in a custom-built climate chamber with a controlled ambient temperature of 25°C . The insulated climate chamber uses peltier devices for thermoelectric cooling to control the temperature, similar to the test chamber described by Rheinfeld et al.45 After formation, a C/20 charge/discharge cycle was used to determine the nominal capacity of each coin cell, listed as average values of a set of three cells in Table I.
Table II. Measurement procedures applied to the coin cells.
| Procedure | Charge | Discharge | Cycles |
|---|---|---|---|
| Formation | CC @ C/10 until U ≥ 4.2 V | CC @ C/10 until U ⩽ 3.0 V | 3 |
| Capacity check | CC @ C/20 until U ≥ 4.2 V | CC @ C/20 until U ⩽ 3.0 V | 1 |
| CV @ 4.2 V until I ⩽ C/100 | |||
| Rate capability test | CC @ C/2 until U ≥ 4.2 V | CC @ IL* until U ⩽ 2.7 V | 3 |
| CV @ 4.2 V until I ⩽ C/100 | (for each IL) |
CC - constant current, CV - constant voltage. *IL1, L2 = C/5, C/2, 1C, 2C, 3C, 4C, 5C, 10C for loading 1 and 2. IL3, L4 = C/5, C/2, 1C, 1.5C, 2C, 2.5C, 3C, 3.5C, 4C, 4.5C, 5C, 6C, 10C for loading 3 and 4.
In the rate capability test, the cells were charged with a CC phase followed by a constant voltage (CV) phase, which remained unaltered, independent of the applied discharge current. Between each charge and discharge cycle a pause of 1 h was kept to allow for relaxation of the cells. In the discharge procedure, the cells with loading 1 and 2 were discharged with C/5, C/2, 1C, 2C, 3C, 4C, 5C and 10C. To have a better resolution, discharge currents of 1.5C, 2.5C, 3.5C, 4.5C and 6C were added for loading 3 and 4. The results of the rate capability test are shown in Fig. 2. The discharge capacities were referenced to the area of the cathode coins of 1.54 cm2. Marginal deviations in the final coating thicknesses appeared in the range of manufacturing tolerances and led to slight deviances in the measured coin cell capacities.
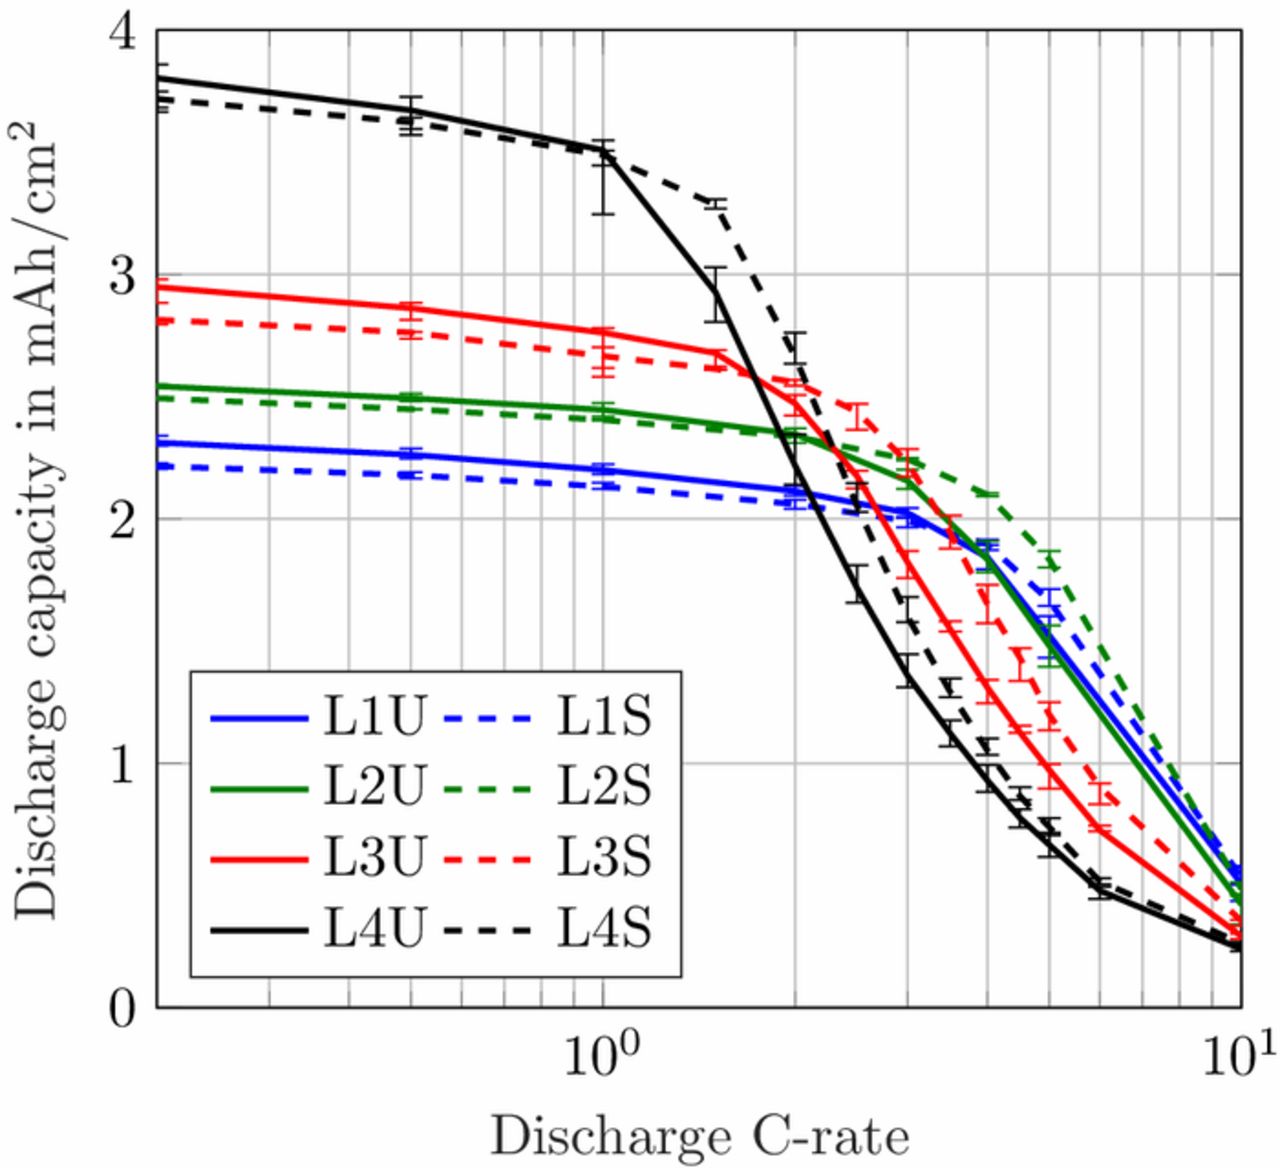
Figure 2. Measured area-specific discharge capacity of coin cells comprising unstructured and structured anodes for C-rates from C/5 to 10C.
Modeling
In our previous work, a homogenized 3D model of a representative hole structure was used to describe a structured anode.39 Simulation results of lithium-ion concentrations in both the electrolyte and the active material helped to understand and clarify occurring inhomogeneities due to the structuring. Among the main findings were the reduced concentration gradients in the liquid electrolyte in the through-plane direction of the cell, which in turn led to the increased discharge rate capability. Moreover, it is difficult to represent the geometric shape of the induced holes in a 3D model. Each hole has a slightly different shape depending on the particles that were removed by the laser ablation process, compare to Fig. 1. In this work, a p2D model according to Doyle, Fuller and Newman46,47 is used, which consists of the three 1D domains anode, separator and cathode, defined by their thickness lneg, lsep and lpos, respectively. The governing equations are listed in the appendix in Table AII and the parameterization is shown in Table AI. Note, that reducing the spatial dimensions of the electrode to the through-plane dimension holds a simplification of the complex electrode structure. However, the 1D model comes with faster computational speed and is able to adequately describe the processes and limitations in the through-plane direction, which are the main contributors to the determinant cell performance.39
Table AII. Differential algebraic equations of the p2D model according to Doyle, Fuller and Newman46 including an adaption for the Butler-Volmer equation from Mao et al.76
| Type | Equations |
|---|---|
| Mass balance |  |
 |
|
| Potentials |  |
 |
|
| Charge balance |  |
| Electrode kinetics |  |
| η = Φs − Φl − Eeq | |
 |
In 1D models the geometry does not account for porous structures, as is the case for the electrodes and the separators in a state-of-the-art lithium-ion battery with liquid electrolyte. Hence, an adaption is needed to appropriately represent the prolonged transport pathways in porous structures. This plays an important role, especially when high currents are applied to the cell and the limitation mechanisms in the electrolyte have a major contribution. To account for the morphology of porous structures in 1D models, the electrolyte transport parameters are modified by using a correction term to express the effective diffusivity Dl, eff and conductivity κeff as shown in Eq. 1. An often used term in modeling is the Bruggeman correction,5,48–52 where the factor αBrugg was calculated to be 1.5 for materials with ideal spherical particles of identical size.53 Since the electrode particles are not ideally spherical, e.g. natural graphite is platelet-shaped, and are not of the same size, a Bruggeman correction of αBrugg = 1.5 just states a lower limit for the correction factor.17,29,54,55 The MacMullin number NM, which can be defined as the ratio of the tortuosity τ and the porosity εl (Eq. 2) is another possible correction factor.56
![Equation ([1])](https://content.cld.iop.org/journals/1945-7111/167/1/013506/revision1/d0001.gif)
![Equation ([2])](https://content.cld.iop.org/journals/1945-7111/167/1/013506/revision1/d0002.gif)
No matter which correction term is used, a change in the factor will significantly influence the transport properties and thereby the cell behavior. The structuring process modifies the electrode pore morphology and enhances the lithium-ion transport in the electrolyte which has a positive effect on the capacity retention in a certain range of discharge currents.39 Based on the parameter set of the cells comprising unstructured anodes, a reduction of the MacMullin number is utilized to describe the behavior of the cells comprising structured anodes. Thus, either a reduction in the electrode's tortuosity or an increase in the porosity will improve the local transport properties. However, an increase in the porosity has a higher influence because it directly affects the mass balance
![Equation ([3])](https://content.cld.iop.org/journals/1945-7111/167/1/013506/revision1/d0003.gif)
Regarding the discharge of the cell, i.e. the delithiation of the anode, a higher anode porosity means that there is more space for the lithium-ions in the pore volume and the absolute lithium-ion concentration in the electrolyte cl is lowered. The lithium-ion concentration in turn has a crucial effect on the electrolyte transport properties, see Table AI.
In this work, the tortuosity was adapted in the model to represent the pore morphology change by the structuring process of the graphite anode. In order to maintain comparability between the different loadings, the sensitivity analysis in this work investigates varying tortuosities only and neglects the alternation of porosity, which may be correlated with a change in tortuosity. The discharge rate behavior of the loadings was adjusted via the electrode thickness and the anode tortuosity, all other modeling parameters remained unaltered. Tortuosity measurements via impedance spectroscopy or 3D tomography offer information about the electrode morphology.21,29,55,57,58 The tortuosities used in this work are based on values found in the literature, where platelet-shaped natural graphite exhibits comparatively high through-plane values.29,55 The parameters for the characterization of the different loadings are listed in Table I, whereas the general model parameters are listed in Table AI. The electrode thickness is the same for the anode (lneg) and the cathode (lpos).
The temperature was set constant to 25°C in the model, owing to the low cell capacities compared to the high heat capacity of the coin cell setup. All measurements were performed at the same ambient temperature, so even for the highest cell capacity of 6 mAh and a discharge current of 10C, no temperature rise was detected. All C-rates used in the simulation studies are referenced to the modeled areal capacities in Table I, which were averaged and remained constant for each loading to allow a better comparison between unstructured and structured anodes.
Overpotential analysis
The p2D model was implemented in the commercial FEM solver COMSOL Multiphysics 5.3a. According to Nyman et al.,22 the total cell polarization can be ascribed to local potentials and concentrations solved in the p2D model and is composed of the following six sub-processes, the equations are listed in Table AIII:
- Diffusion polarization in the liquid phase
- Diffusion polarization in the solid phase
- Ohmic potential drop in the liquid phase
- Ohmic potential drop in the solid phase
- Activation overpotential
- Contact resistance
Table AIII. Polarization analysis by Nyman et al.22
| Polarization source | Equation |
|---|---|
| Diffusion polarization liquid phase |  |
| Diffusion polarization solid phase |  |
| Ohmic potential drop liquid phase |  |
| Ohmic potential drop solid phase |  |
| Activation overpotential |  |
| Contact resistance | iapp · Rcontact |
The limitation mechanisms in the simulation studies are analyzed via using this implicit characterization method based on the actually solved concentrations and potentials in time and over the electrode thickness. In the separator domain, only diffusion polarization and ohmic potential drop in the electrolyte occur, as there is no active material and no reaction takes place. The contact resistance Rcontact cannot be ascribed to a single domain and is therefore listed separately in the later analysis. In the model, the cell voltage is corrected by the voltage drop resulting from the contact resistance (Rcontact · iapp).
Lithium-plating indication
Charging a lithium-ion cell can induce lithium-plating on the surface of the graphite anode particles, particularly at low temperatures and high charging currents.59 Up to a certain extent, this reaction is reversible and the plated metallic lithium gets oxidized either by intercalating into the graphite particles during relaxation or by stripping/dissolution in an subsequent discharge cycle.60,61 However, part of this reaction remains irreversible and plated lithium tends to form dendrites that can penetrate the separator and cause severe safety problems.62
With an equilibrium potential of 0 V vs. Li0/Li+, the necessary condition of the lithium-plating reaction is an overpotential of ηLi ⩽ 0 V.52,63–65 The lateral electrode dimensions and the tab positions can cause an inhomogeneous distribution of the current density and therefore result in different local potentials.6 Besides, both the anode and the cathode properties and the balancing of the two electrodes play an important role for the likelihood of lithium-plating.64 Regarding the used 1D model, the lithium-plating reaction is presumably most pronounced at the anode/separator interface and the local potential criterion Φs − Φl ⩽ 0 V can be interpreted as an indicator for lithium-plating during a charging procedure.6 Based on this criterion, various fast charging scenarios were evaluated in the later simulations.
Results and Discussion
Model validation and simulation
For validation of the developed model, the data from Fig. 2 is normalized to the C/5 discharge capacity of each loading and compared to the simulation results, which is shown in Fig. 3a. By normalization of the the discharge capacity, it is more obvious that the lower loadings can withstand higher C-rates. The curves shift from the highest loading L4U to the lowest loading L1U on the very right side. The curves of the cells comprising structured anodes (dashed lines) all bend at higher C-rates so that these lie right of their unstructured counterparts of the same loading (solid lines). The simulation results represented by the dash-dotted lines for the unstructured electrodes and the dotted lines for the structured electrodes are in good agreement with the measurement data.
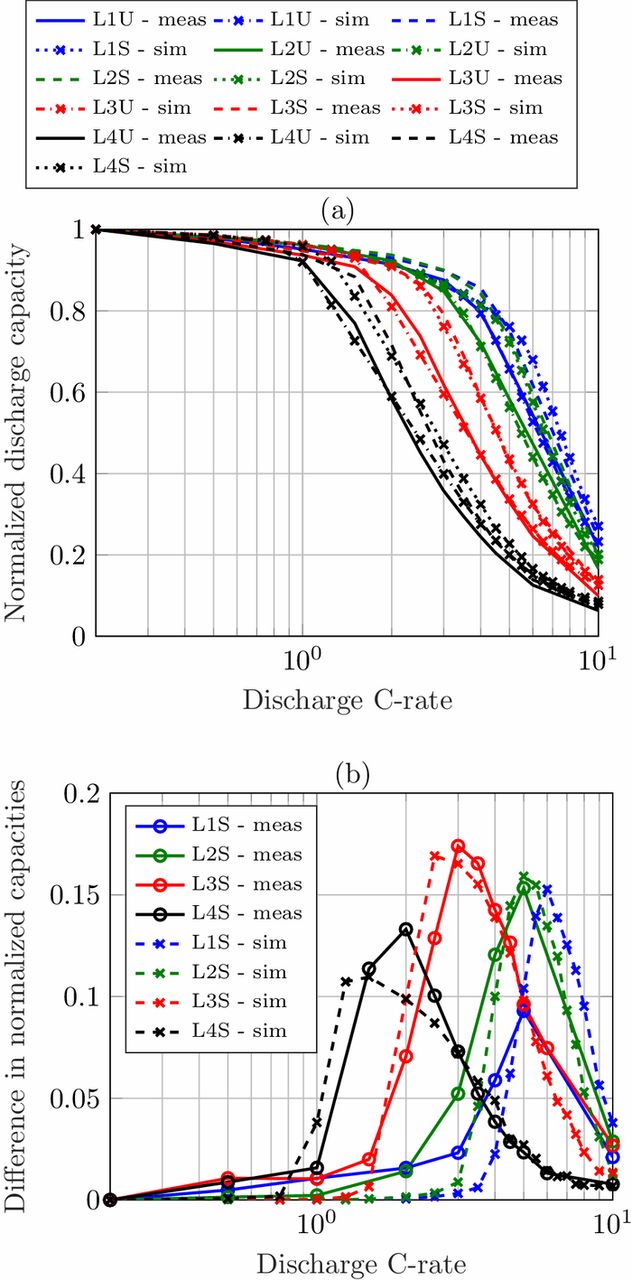
Figure 3. (a) Comparison of measured and simulated C/5-normalized discharge rate capability of coin cells comprising unstructured and structured anodes and (b) observed difference in normalized discharge rate capability.
The validation of the measured and simulated discharge voltage curves is shown in the appendix in Fig. A1. The gray shaded areas represent the margin of the measured discharge voltages of each set of coin cells for the specified loading. The experimental and simulated rate capability tests covered a wide span of discharge C-rates, for validation of the voltage profiles, the C-rates C/5, 2C, 5C and 10C were selected. In the simulations, only the electrode thickness, the applied current density and the anode tortuosity were adapted to the different loadings and the measurement data is in very good agreement with the simulation results.

Figure A1. Comparison of measured (gray shaded areas) and simulated discharge voltage curves, normalized to their C/5 capacity for C-rates C/5, 2C, 5C and 10C. The cells comprising unstructured anodes are depicted in (a), (c), (e) and (g) for loadings L1U, L2U, L3U and L4U and the cells comprising structured anodes are depicted in (b), (d), (f) and (h) for loadings L1S, L2S, L3S and L4S, respectively.
The benefit of the structuring process appears in the difference in normalized capacities of the cells comprising structured and unstructured anodes, see Fig. 3b. A categorization in three different stages is visible: for low applied C-rates there is no improvement induced by the structuring process, for medium C-rates the improvement increases and reaches a maximum and for higher C-rates it diminishes when other limitations become more pronounced. A detailed explanation of the three stages can also be found in our previous work.39 The location of the maximum determines the range of C-rates where the structuring process has a positive impact. The pore morphology change of the graphite anode leads to an enhanced transport of lithium-ions and a reduction of concentration gradients in the electrolyte. Thereby, the cutoff voltage for the discharge process is reached at a later moment and more capacity can be discharged from the cell. For higher loadings the maximum shifts toward lower C-rates, for lower loadings it shifts toward higher C-rates. Even for the low loading L1 with 2.26 mAh cm− 2 there is a 15% increase in capacity retention for a discharge rate of 6C. Note, that for loading L1 and L2 the cells were discharged with 5C and then 10C with no further steps in between, so the maximum of L1 was most likely not reached precisely. Modeling and simulation is often used to extend and refine the fundamental data of use case scenarios, such as the variation of discharge C-rates to determine the location of the maximum improvement in capacity retention in this work. The shape of the capacity difference, given by the location and the value of the maximum, will be analyzed with a simulation study next.
The influence of the structuring process as a function of electrode thickness is studied based on the parameter set of loading L1. In this study, an increase in electrode thickness increases the loading, so the discharge current is adapted to the changed loading. Choosing moderate values, the tortuosity of the unstructured anodes is set to 5.5 and the tortuosity of the structured anodes to 3.5. The thickness of the electrodes is increased by 25% in each step ranging from 71 μm to 173 μm. The results are displayed in Fig. 4a. As expected, an increase in the electrode loading causes the maximum to shift toward lower C-rates. The maximum improvement is just slightly affected by the electrode thickness. For thin electrodes with 71 μm thickness there is a 15% capacity enhancement compared to 18% for thick electrodes with 173 μm thickness.
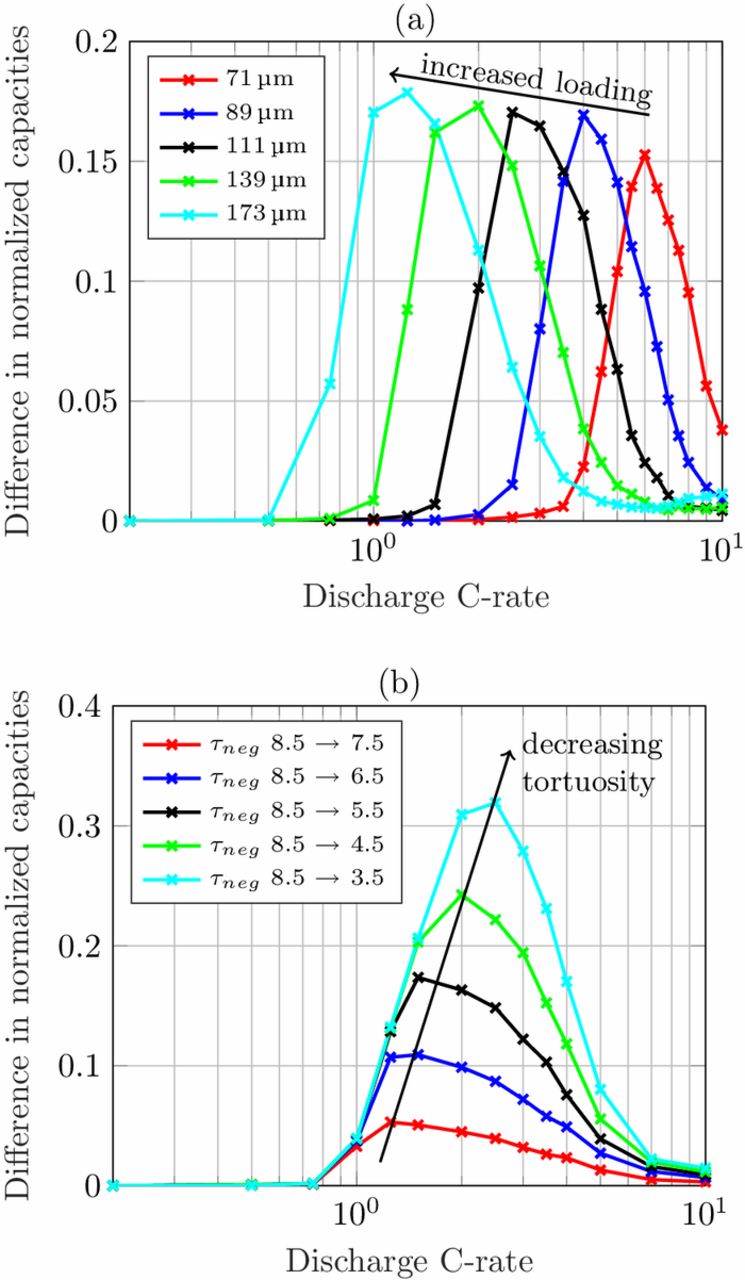
Figure 4. Simulated difference in normalized discharge rate capability of (a) cells with increased loading by increasing the electrode thickness based on parameter set of L1 and (b) cells with decreasing anode tortuosity and constant electrode thickness based on parameter set L4.
On the other hand, the tortuosity improvement by a pore morphology modification highly affects the maximum enhancement in capacity retention as can be seen in Fig. 4b. This simulation study is based on parameter set L4 that features high tortuosity values. Starting from a tortuosity of 8.5 for the unstructured anode, the tortuosity of the structured anode is reduced by steps of 1 down to 3.5. The electrode thickness and the resulting discharge currents remained constant. The lower the tortuosity of the porous anode, the higher the improvement in capacity retention. The C-rate where the maximum is reached slightly shifts toward higher discharge currents, in this case from around 1.25C up to 2.5C. Note, an electrode porosity of 0.35 results in a tortuosity of 1.7 by using the Bruggeman correlation with αBrugg = 1.5. This in turn would lead to an increased discharge capacity of around 45% in this use case scenario. So the morphology of a composite electrode has to be carefully assessed when deriving correction terms for modeling purposes.
Overpotential analysis
Regarding local polarization within the electrode stack, such as the anode, separator and cathode domain, the overall cell polarization is derived based on the aforementioned implicit overpotential analysis (as described in the modeling section) and outlined in the following to investigate the limiting mechanisms during discharge processes with increasing C-rates.
Based on the parameter set L2U, the initial conditions of the simulation were set to a fully charged state at a cell voltage of 4.2 V. Similar to the rate capability test listed in Table II, the cells were discharged with a CC procedure with C-rates ranging from C/5 to 10C until a cutoff voltage of 2.7 V was reached. The individual overpotentials were temporally averaged over each discharge cycle and then ascribed to one domain based on their occurrence. In Fig. 5a the relative contribution to the cell polarization is shown (they sum up to 1). While the anode contribution is declining for increasing discharge C-rates, it constitutes the major contribution to the total cell polarization up to 7C. This can be explained by the high tortuosity on the one hand and the fact that the anode is the limiting electrode for the discharge process on the other hand. This will be explained in detail in the upcoming part. The cathode and contact contribution overtake the anode at 8C. Since the contact resistance is purely ohmic, the overpotential increases linearly with the applied discharge current. The separator only plays a minor role as only the diffusion polarization and ohmic potential drop in the liquid phase contribute in this domain. To get a better understanding of the impact of the overpotential, the absolute values are plotted in Fig. 5b for selected C-rates. For low discharge currents, e.g. C/5, the absolute cell overpotential is very low, hence its origin is less important. For 1C the total cell overpotential rises to around 100 mV and almost reaches 800 mV for a 10C discharge with the given parameterization set of the p2D model. With medium currents, the dominating anode contribution shows an opportunity to improve the cell design. Therefore, the anode overpotentials are investigated in detail depending on their driving force.
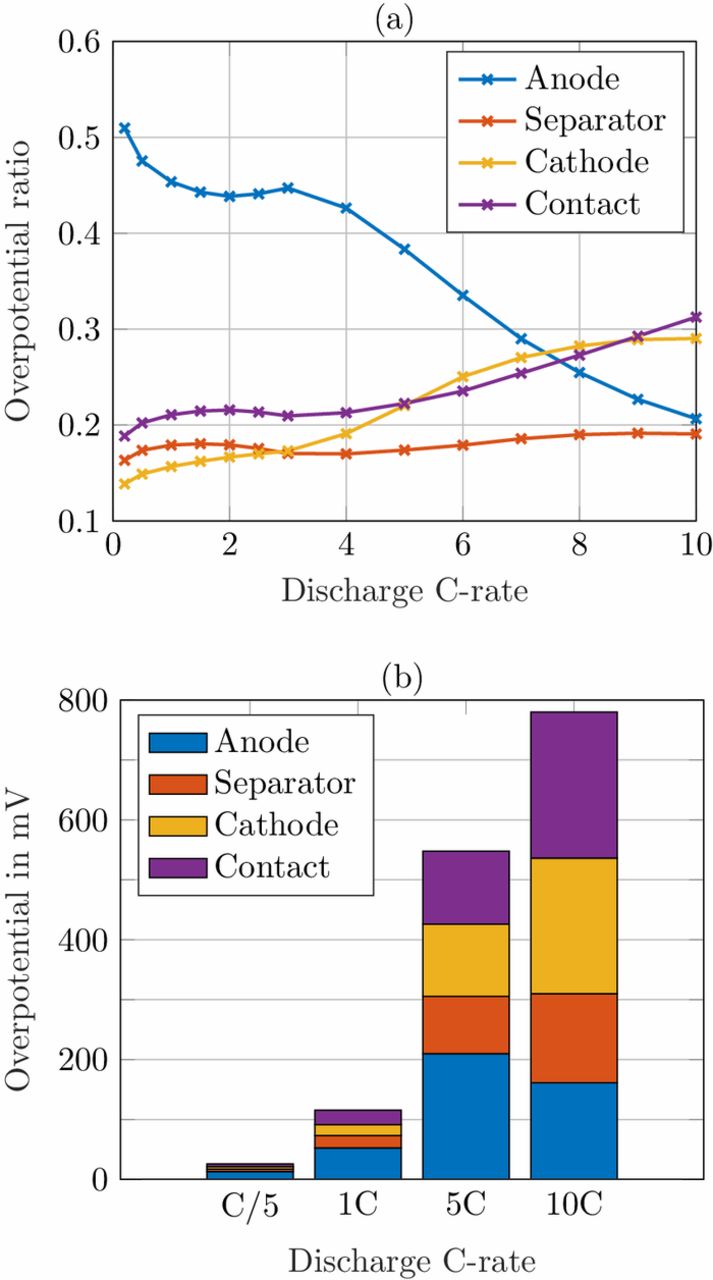
Figure 5. (a) Relative and (b) absolute distribution of cycle-averaged overpotentials of parameter set L2U assigned to the domains anode, separator and cathode and the contact resistance for discharge C-rates from C/5 to 10C.
By excluding the contact resistance, the polarization in the anode can be categorized into five groups, namely the diffusion polarization and the ohmic potential drop in the solid and liquid phase and the activation overpotential. In order to investigate the influence of the change in anode pore morphology on the arising overpotentials, the parameter sets L2U and L2S were compared in the simulations. An overview of the absolute anode overpotentials for discharge currents ranging from C/5 to 10C is shown in Fig. 6. For the depicted pair of bars at each simulated discharge C-rate, the left one represents the results for the unstructured and the right one for the structured anode comprising the L2U and L2S parameterization, respectively.
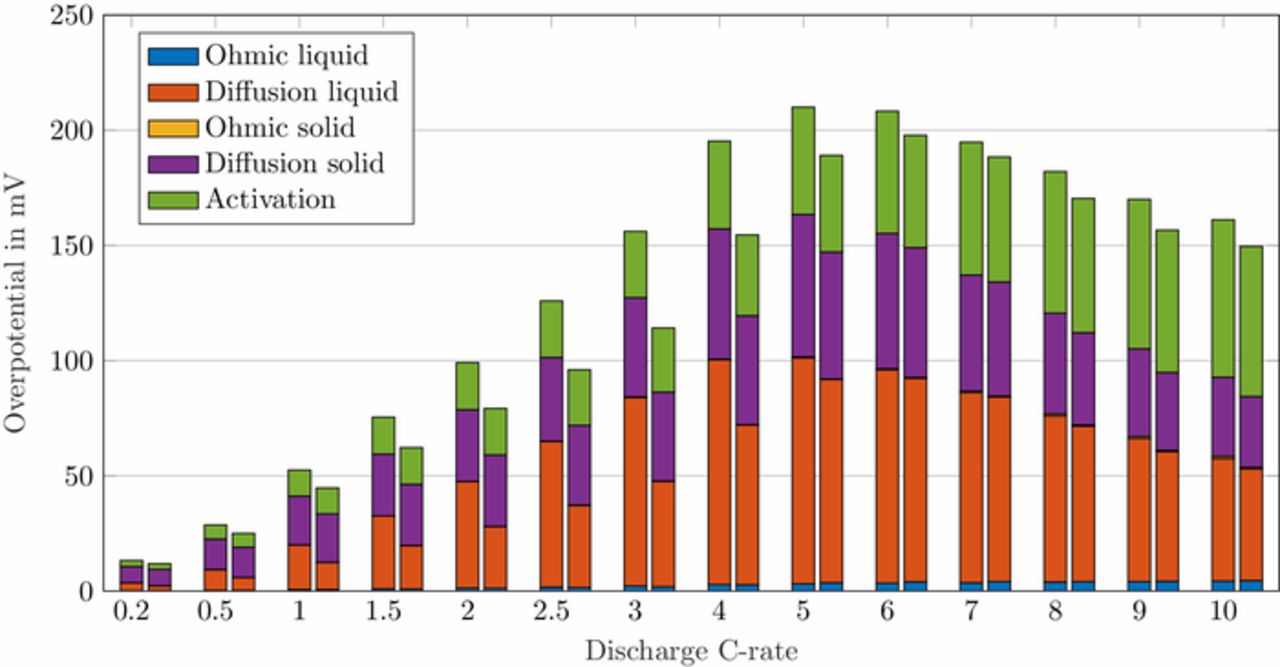
Figure 6. Cycle-averaged anode overpotentials for discharge C-rates from C/5 to 10C. For each pair of bars at a given C-rate the left bar corresponds to the overpotentials of the unstructured anode (L2U) and the right bar of the structured anode (L2S).
The ohmic potential drop in the solid phase is barely visible which is referred to a high electrical conductivity in natural graphite of around 100 S m− 1.66–70
The ohmic potential drop in the electrolyte is also very low, with a minor contribution at very high C-rates. With the given parameter set of this work, the electrolyte conductivity κ lies around 1 S m− 1 for moderate lithium-ion concentrations of 1000 mol m− 3, see also electrolyte transport parameters in Table AI. The conductivity of the bulk electrolyte can be measured with a turn-key conductivity sensor29 and is therefore a well determined electrolyte property. A detailed overview of different electrolyte properties used for modeling purposes, including the conductivity, is given by Rheinfeld et al.71 In their work the conductivity of five different electrolytes ranges from 0.8 to 1.2 S m− 1 (at 1000 mol m− 3 and 25°C ). Even with the calculation of the effective conductivity κeff (see Eq. 1), in our case, the liquid current density il is too low to cause a high potential drop in the electrolyte.
The major contributors to the cell overpotential, as can be seen in Fig. 6, are the diffusion polarization in the solid and liquid phase and the activation overpotential. The diffusion polarization in the solid phase is calculated by the difference of the equilibrium potential on the surface of the particles and the average equilibrium potential (equations listed in Table AIII). During the end of discharge, the anode lithiation level x in LixC6 tends toward zero and the corresponding equilibrium voltage Eeq, neg reveals increasing potential gradients the more lithium is extracted, which in turn causes the reach of the cell discharge cutoff voltage of 2.7 V. Hence, a low lithium-ion concentration on the particle surface generates a high polarization in the solid phase, especially at the end of discharge.
The activation overpotential is affected by the kinetics as described by the Butler-Volmer equation, e.g. a higher exchange current density i0 would result in lower overpotentials η (and vice versa) to reach the same surficial molar flux, as defined by the boundary conditions (see electrode kinetics in Table AII). Due to the nonlinear characteristics of the Butler-Volmer equation, a rise in the discharge current does not result in a proportional rise in the activation overpotential. It slightly increases with increasing discharge C-rates. The exchange current density is calculated by the anodic and cathodic reaction rates and the local lithium-ion concentrations. The lithiation process of the active material is either limited by the liquid phase concentration cl tending toward zero (electrolyte depletion) or the surface concentration of the particles cs, surf reaching the maximum concentration cs, max. The delithiation process is limited if the surface concentration of the particles reaches zero. In either case the exchange current density is diminished and the activation overpotential rises. The determination of the kinetic reaction rates is not trivial and not many values can be found in literature. A lot of publications use the reaction rates as fitting parameters51,72–74 or set the exchange current density to a constant value,67,68 which makes the reaction rates unnecessary. Generally, high reaction rates result in low activation overpotentials and low reaction rates in high activation overpotentials. Lin et al.75 list a range of 10− 12 to 10− 9m s− 1 for the reaction rates of anodes and cathodes. Based on a sensitivity analysis conducted in this work, the reaction rates were estimated to 6 × 10− 11 m s− 1, which is within the given range by Lin et al.75
The diffusion polarization in the liquid phase is the biggest contributor in the anode domain. Its driving force are the lithium-ion concentration gradients in the electrolyte. As explained in the modeling section, the effective electrolyte diffusivity is strongly affected by the porous electrode structure and calculated with the tortuosity and porosity. The high anode tortuosity lowers the effective diffusivity and increases the concentration gradients. Spatially resolved concentration gradients can be found in our previous work.31 The resulting overpotential of the diffusion in the liquid phase of the unstructured anode reaches a maximum of around 100 mV at 5C and amounts to almost half the overpotential arising in the anode. By structuring the graphite anode, the modeled tortuosity is lowered from 5.5 for loading L2U to 3.5 for L2S. The maximum in capacity retention for this structuring process also occurs at a discharge C-rate of 5C, which corresponds to a peak in the liquid diffusion polarization. The structuring process enhances the transport in the electrolyte and mainly reduces the overpotentials caused by the diffusion polarization. A maximum reduction in anode overpotential of 42 mV is reached at 3C with 36 mV from liquid diffusion polarization.
Fast charging scenario
In the previous sections, it was demonstrated that lithium-ion cells comprising structured graphite electrodes provide an increased discharge rate capability in a certain range of C-rates by reducing electrolyte concentration gradients and overpotentials. Based on the parameterization that was validated against discharge rate capability tests, a fast charging scenario was simulated.
Therefore, the initial lithium-ion concentrations in both the anode and the cathode were adapted (compare Table AI) in order to represent a fully discharged cell with an initial cell voltage of 2.7 V. The simulations were carried out with a CC charge of 1C, 2C and 3C until a cutoff voltage of 4.2 V was reached, no CV phase was added to the charging procedure. In Fig. 7 the cell voltage and the potential difference at the anode/separator interface are plotted for loading L3. The charged capacities and the lithium-plating indication for all loadings are listed in Table III.
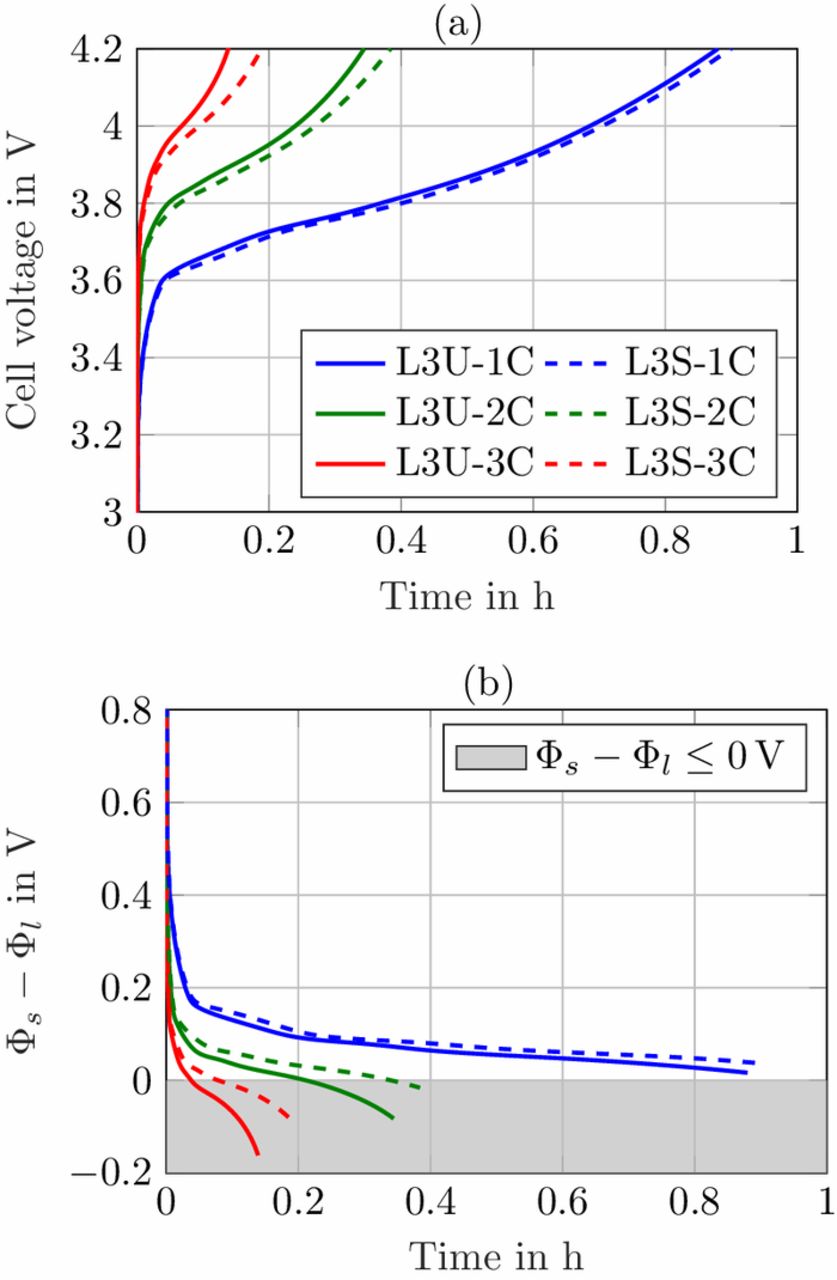
Figure 7. (a) Simulated cell voltage and (b) potential difference Φs − Φl at anode/separator interface for charging currents 1C, 2C and 3C based on parameter set L3.
Table III. Charged capacity and lithium-plating indication during fast charging scenarios.
| ΔCapacityI | ΔSOCII | ΔSOC Li-platingIII | ||||||||
|---|---|---|---|---|---|---|---|---|---|---|
| Loading | 1C | 2C | 3C | 1C | 2C | 3C | 1C | 2C | 3C | Maximum C-rateIV |
| L1U | 3.27 mAh | 2.97 mAh | 2.60 mAh | 94.0% | 85.2% | 74.5% | - | - | 59.8% | 2.5C |
| L1S | 3.29 mAh | 3.02 mAh | 2.71 mAh | 94.6% | 86.7% | 78.0% | - | - | - | 3.3C |
| L2U | 3.60 mAh | 3.21 mAh | 2.68 mAh | 93.5% | 83.4% | 69.5% | - | - | 44.0% | 2.1C |
| L2S | 3.63 mAh | 3.29 mAh | 2.88 mAh | 94.4% | 85.6% | 74.9% | - | - | 74.3% | 2.9C |
| L3U | 3.93 mAh | 3.07 mAh | 1.86 mAh | 88.0% | 69.0% | 41.6% | - | 42.2% | 11.2% | 1.2C |
| L3S | 4.02 mAh | 3.43 mAh | 2.53 mAh | 89.9% | 76.9% | 56.9% | - | 68.0% | 23.5% | 1.7C |
| L4U | 4.61 mAh | 2.46 mAh | 1.06 mAh | 77.9% | 41.7% | 18.0% | 64.3% | 14.7% | 6.1% | 0.7C |
| L4S | 4.80 mAh | 3.03 mAh | 1.35 mAh | 81.7% | 51.5% | 23.0% | 79.8% | 23.8% | 7.6% | 0.9C |
ICC charging from 2.7 V to a cutoff voltage of 4.2 V. IIreferenced to the nominal capacities determined by the corresponding loading in Table I. IIIΔSOC when Li-plating is provoked, determined by Φs − Φl at anode/separator interface. IVmaximum charging C-rate without Li-plating.
Note, that the gray shaded area for the potential drop in Fig. 7b just gives an indication of possible lithium-plating at the anode. The simulations were carried out under isothermal conditions (T = 25°C), which might hold true for a coin cell with low power losses. A heating of the cell would result in enhanced electrolyte transport properties, reduced lithium-ion concentration gradients and lower overpotentials that counteract lithium-plating. The simulation study just provides a hint for possible lithium-plating and the effects of the electrode pore morphology modification on charging procedures.
In the simulation in Fig. 7a during the 1C charge of both L3U and L3S, almost 90% of the cell capacity can be charged, the benefit of the structuring is marginal. In the cell voltage there is no option to assess the anode potential and it looks like the structured anodes just give a small benefit in the charged capacity in the end. For a 2C charge however, the reduction in overpotentials can be clearly seen in Fig. 7b, where the potential drop for the structured anodes lies well above the the one for unstructured anodes. After 12 min of charging, the unstructured anode reaches a potential that could invoke lithium-plating, while the structured anode reaches the critical potential only shortly before the end of charge (compare SOC in Table III). This effect is even more pronounced for a 3C charge, where both potential curves lie well below 0 V shortly after applying the charging current. This is a clear indication of possible lithium-plating and the charging current is too high for this cell setup. Regarding the charged capacity for a 3C charging rate, the cells comprising structured anodes reach a 15% higher SOC until the cutoff voltage is exceeded. So not only for discharging, but also for charging procedures the modified electrode pore morphology shows distinct advantages in an overpotential reduction.
An assessment of the other three loadings, as listed in Table III, reveals that for loading L1 with an electrode thickness of 71 μm the structuring shows little benefits regarding the charged capacity. Just at the end of a 3C charge, the potential drop of L1S is a little less and the lithium-plating criterion is not fulfilled. For loading L2 with thicker electrodes, more capacity can be charged and the advantages of structured anodes increase. Especially for a 3C charge, with structured anodes there is almost no lithium-plating provoked compared to the unstructured ones. A comparison of the charged capacities of loading L4 and Fig. 3b reveals, that there is also a range for charging currents with a maximum benefit. The 1C charge adds 3.3% in capacity, the 2C charge 9.8% and the 3C charge 5.0%. At lower charging currents, the concentration gradients are reduced and the pore morphology change has little or no influence. With increasing charging currents, a maximum benefit arises and diminishes again when other limitations come into place. However, for the thick electrodes in the case of L4 (116 μm), all three charging currents would possibly provoke lithium-plating and the current should be reduced for both the cells with unstructured and structured anodes. Just the amount of plated lithium could be less with structured anodes.
In order to assess the maximum charging C-rate for each loading, a simulation study with incremental C-rates with a step size of 0.1C was carried out. The results are listed in the last column in Table III. In each case, the potential difference Φs − Φl at the anode/separator interface would stay slightly above 0 V at the end of charge. The cells comprising structured anodes can withstand higher C-rates for all loadings. With increasing electrode thickness, the maximum charging C-rate has to be reduced. The C-rates are derived from the modeled areal capacities in Table I, a conversion of the C-rates to current densities, due to the changed loading, leads to the same trend. Based on the charged capacities with the maximum C-rate of the cells with unstructured anodes, the C-rates with structured anodes that lead to the same charged capacity can be calculated. The simulated pore morphology modification would allow higher charging currents so that the charged capacity stays the same in the end for the cells comprising unstructured and structured anodes of each loading. This leads to a reduced charging time of around 10% for loadings L1 and L2, 17% for L3 and 13% for L4, respectively. On top of the shorter charging time, the distance to the lithium-plating threshold is higher for the structured anodes and thereby the cell safety enhanced.
Conclusions
An electrochemical model was developed and validated against experimental data gained from lithium-ion cells comprising unstructured and structured graphite anodes. The areal capacities of the cells were varied by changing the electrode thickness, the electrode composition and the porosity remained constant within the manufacturing tolerances. The simulation results are well in line with the discharge rate capability measurements.
The loading of the cell, defined by the electrode thickness, determines the C-rates where the structuring process provides a benefit in capacity retention, which was around 10–18% for the measured cells. The location and shape of this benefit is given by the electrode thickness and the tortuosity reduction. With increasing electrode thickness, the maximum benefit shifts to lower C-rates (and vice versa) and the tortuosity reduction specifies the maximum itself, i.e. a lower tortuosity yields a higher rate capability.
In order to understand the limiting mechanisms, an overpotential analysis was conducted that revealed the anode as a major contributor. Especially the diffusion polarization in the electrolyte limits the performance for medium C-rates. Through modification of the pore morphology, a reduction in the anode tortuosity can be achieved, which results in a reduction of concentration gradients and the accompanying overpotentials and more capacity can be discharged from the cell.
A fast charging scenario for the different loadings revealed that the reduced overpotentials through electrode structuring provide an approach for preventing lithium-plating at the anode. In the fast charging simulation studies, a reduction of the charging time of 10–17% was achieved while keeping the anode potential in a safe area above the lithium-plating threshold.
In this work, laser-structuring was used to modify the electrode pore morphology of graphite anodes and the generated effects were investigated. In conclusion, the tortuosity should be well considered regarding electrode and cell design and simulation studies can support the overall process. Future work will focus on the optimization of the electrode structure, defined by the geometrical dimensions of the induced holes and the amount of structures, i.e. the structure pattern. Tortuosity measurements are necessary in order to identify the change in electrode pore morphology generated by the structuring process. Furthermore, simulations could be used to provide a guideline for an optimal structure for a given set of electrodes, adjusted to the desired performance improvement within the physical bounds of tortuosity reduction.
Acknowledgment
This work was financially supported by the German Federal Ministry of Education and Research (BMBF) under grant number 03XP0081 (ExZellTUM II). The authors thank Johannes Sturm for his critical feedback.
ORCID
Ludwig Kraft 0000-0003-4324-426X
Jan B. Habedank 0000-0003-2057-7037
Alexander Frank 0000-0001-8069-2948
Alexander Rheinfeld 0000-0003-0995-7266
Andreas Jossen 0000-0003-0964-1405
: Appendix
The comparison of the measured and simulated discharge voltage curves for all loadings comprising unstructured and structured anodes is displayed in Fig. A1. The representative voltage curves for the discharge C-rates of C/5, 2C, 5C and 10C were selected for validation.
An overview of the most relevant model parameters is shown in Table AI. The electrolyte diffusivity Dl and conductivity κ were taken from Mao et al.76 However, Mao et al. used a polynomial fitting function for the electrolyte conductivity which is only valid for concentrations below 3000 mol m− 3. At higher concentration levels, the conductivity starts to increase, so a correction for extrapolation at highly saturated electrolytes from Rheinfeld et al.71 was used instead. The electrolyte activity dependence was extracted from Valøen and Reimers.77 All three functions describing the electrolyte expect the concentration to be in mol m− 3.
The differential algebraic equations of the p2D model are listed in Table AII. In order to prevent local lithium-ion concentrations from becoming zero or even negative and thus cause instability, a modification of the Butler-Volmer equation introduced by Mao et al.76 was implemented.
The equations for calculating the polarization of the different sub-processes are stated in Table AIII. The total current per cross-sectional area itot is calculated via an integration of the local current density on the particle surface iloc – as given by the Butler-Volmer equation – multiplied with the specific interfacial area a (ratio of active material surface to volume)
![Equation ([A1])](https://content.cld.iop.org/journals/1945-7111/167/1/013506/revision1/d0004.gif)
In order to calculate the average cell polarization, the integration boundaries x1 and x2 are chosen to 0 and L = lneg + lsep + lpos, respectively. Polarization based on spatial integral values refers to the relevant domains of anode, separator and cathode and the corresponding boundary values in the x-dimension. For a profound explanation of the method and the set of equations, the reader is referred to the original publication of Nyman et al.22