
Abstract
A bi-domain transient 1D PEFC model is developed which, while retaining the low computational cost of 1D models, takes into account the different pathways for multiphase transport under the rib and channel domains. This concept allows setting different boundary conditions for liquid transport at the channel-GDL and the rib-GDL interfaces. The model is thus suitable for studying the temporal cell behavior more accurately than 1D models, but still with comparable computation times.
Export citation and abstract BibTeX RIS
In PEFC technology, low dimensional models are used for investigating complex processes such as the effects of various operating conditions1 and material properties2 on performance and for system control.3 1D (through-the-MEA) models constitute also the core of multidimensional models which include the along-the-channel transport processes.4 While in the early days of PEFC modeling steady-state approaches have been mainly pursued, even for 1D models, the interest for transient investigations has progressively increased.5
Most of the published models have been validated with polarization curves, which do not provide any information on the transient cell behavior. In our previous work,6 experimental cell potential responses to a stepwise load increase at different operating conditions were used for validating a 1D model. A good agreement for times larger than 1s was found. However, the prediction was poor at short times (<1 s). 1D models cannot directly account for the channel/rib structure of the cell, which highly affects the gas transport at short times.7 To address this issue, the channel/rib behavior was modeled by introducing analytically parameterized GDL transport properties8,9 or by using multidimensional approaches,10 with results often contradictory to experimental findings.11 Furthermore, a main drawback of multidimensional models is the large computational cost, limiting their use for sensitivity analysis and optimization procedures.
To retain the low computational cost of 1D models along with the variation in the transport of mass, charge, and heat under the channel and under the rib domains, a different approach was pursued here: two parallel 1D domains are implemented describing the channel and the rib areas separately. This approach retains the low computational effort but can describe the different temporal behavior in the channel and rib domains. Here the concept, the determination of sensitive parameters and the experimental validation are described.
Experimental
A 1 cm2 (10 mm × 10 mm) differential cell as described in11 was used to measure transient cell potentials. Channels and ribs have a width of 2 mm each. Nafion 212 (dry thickness 51 μm) and ELAT V.2.1 gas diffusion electrodes (thickness 240 μm, from E-Tek, Sommerset, USA) hot-pressed to the membrane were the electrochemical components.
For the current step experiments an electronic load (Höcherl und Hackl ZS 506-4) with rise times of typically 40 μs and for or data acquisition a National Instruments PCI6250M card with a 1 kHz recording frequency were used.
Concept
Figure 1 shows the concept of two parallel 1D-domains conserving the 1D nature of the model, which is termed in the following as 1D2. Figure 1 (left) illustrates a section of the cell with realistic aspect ratios, while its representation into the two parallel domains is shown on the right. The model includes anode and cathode bipolar plates (BPP), gas diffusion layers (GDL), and the Nafion membrane. The reactive domains are treated as interfaces. Gas species are transported by diffusion and convection, as described in.6 At the GDL-channel interface, the mixture composition is determined by the inlet conditions. The gas diffusion lengths through the GDL for the two domains are different. Under the channel, the thickness of the GDL has its physical value dGDL. Under the ribs gas and liquid transport are assumed to occur along different paths: drib = (dGDL2 + Xrib2)0.5 for the gas, representing the effective transport path from the channel to the reacting interface under the rib, and dGDL for the liquid, which can accumulate under the rib. Xrib is a fraction of the rib width, see Figure 2 (left), and its maximum value can be half of it. This key parameter is fitted to the experimental potential responses.

Figure 1. (left) the 2D section of a PEFC; z- is the through-the-MEA direction, x- the channel-rib direction; (right) the actual structure is abstracted into the two domains composing the 1D2 model.

Figure 2. (a) calculated and experimental cell potential responses for the three different cases. The current density is changed from 0.3 Acm−2 to 0.8 Acm−2. Initial steady-states at 0.3 Acm−2 are 0.69 V (measured) −0.67 V (1D and 1D2) for RHa/c = 0.8/0.8, 0.63 V (measured, 1D and 1D2)) for RHa/c = 0.3 / 0.8, 0.58 V (measured) −0.56 V (1D) – 0.61 V (1D2) for RHa/c = 0.3/0.3; For the driest case (RHa/c = 0.3/0.3) these parameters are shown: (b) concentration overpotentials; (c) ohmic overpotentials; (d) current density distribution.
The local parameter distributions determine different overpotentials under the channels and the ribs. Assuming equipotential flow field plates, the current densities at the channel and the rib are adjusted at each iteration to meet an equal potential in both domains. Further, the current profile is leveled to match the total current. The new current densities are used in the next iteration to calculate the mass, momentum, energy, and charge sink/source terms and the properties distribution at the next time step.
A main asset of the 1D2 concept is the implementation of different GDL boundary conditions for the channel and the rib domains, which is particularly important for the liquid saturation (s) of the GDL wherein experiments have shown considerable differences.12 Often s = 0 at the channel interface is chosen, an option we have also adopted. However, liquid water is believed to accumulate at the GDL-rib interface with a certain rate, and a liquid water flux Nliq is set, depending on the liquid saturation srib‑GDL at the interface:

with C a parameter determining the flux.
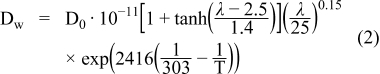
The comprehensive set of equations used here for mass, charge and energy transport has been described in.6 Being of high importance for the water management and current density distribution, the material parameters related to the membrane are also reported here (see equations (2)–(5)).
Diffusion (diffusion coefficient Dw, Eq. (2)) and electro-osmotic drag (χ, Eq. (3)) describe the water transport through the membrane. The ionic conductivity (σ) of the membrane is linearly increasing over a large part of the membrane water content (Eq. (4)) and the water content (λ) of the membrane at the boundaries is set by sorption equilibria (Eq. (5)), with a the water activity. Capital Latin letters are coefficients in the equations and T is the temperature. Equations (2)–(5) are based on literature data as explained in.6


Numerical Implementation
Grid-independent solution is obtained using 30 nodes for the membrane, 20 nodes for the GDLs and 15 nodes for the BPPs. The code is implemented in Matlab. Convergence time is about 1 min on an Intel Core2 CPU 6600@2.4 GHz work station with 1.0 GB RAM.
Results
Experiments and calculations are compared for three cases with different relative humidity of the feeds at the anode and at the cathode: (1) rHa/c = 0.8/0.8; (2) rHa/c = 0.3/0.8; (3) rHa/c = 0.3/0.3. The cell temperature at the outer surface is 70°C, gas pressure is 1.5 bar, and the load is stepwise increased from 0.3 to 0.8 Acm−2.
Figure 2a shows the measured and calculated voltages between 0.01 s and 50 s after the current step. The following characteristics are observed: (i) initial drop of the cell voltage due to the cell ohmic resistance; (ii) slanting cell voltage with a minimum in the range 0.1 s – 1 s; (iii) partial recovery of the undershoot in the range 1 s – 20 s. The undershoot is hardly noticeable for condition 1, the well humidified case, but is more pronounced at lower humidifications. It is known that the undershoot is mainly due to the increasing membrane hydration at the higher currents7 which is retarded at lower humidifications due to the slower diffusional water back transport to the anode in the dryer ionomer.
The model is parameterized to predict the PEFC dynamic performance in a wide range of operating conditions. A multiparameter optimization procedure based on an evolutionary algorithm6 is performed to determine sensitive membrane and GDLs material parameters influencing the mass and charge transport.
Literature data define the solution seeking field. Nine sensitive material parameters6 have been parameterized, five related to the transport processes in the GDLs (porosity ɛ, tortuosity τ, contact angle θ, absolute permeability K, and evaporation rate kevap) and four related to the ionomer membrane (water diffusion coefficient, electro-osmotic drag, ionic conductivity, and water uptake isotherm).
Using the 1D model with s = 0 at d = dGDL, the optimized values are within the expected physical boundaries.6 However, a significant deviation with the experiments remains at times below 1 s (see Figure 2a).
The optimization procedure is repeated with the 1D2 model, including Xrib and C. Comparing the two sets of parameters, major differences are found for τ (3.9 instead of 7), Kevap (0.5 instead of 1.06) and D0 (10.5·10−11 instead of 1.0·10−11). The high tortuosity determined with the 1D model was found to compensate the neglected long transport path under the rib. This path also determines a higher accumulation of water vapor at the membrane-GDL interface, and consistently a lower evaporation rate is calculated with the 1D2 model. The different humidification level at this interface leads also to a higher back diffusion of water from the cathode to the anode side, closer to the experimental values presented in the literature.13 A much better agreement is found with the 1D2 model for the short time domain (see Figure 2a). At longer times, the good correlation is retained. When the undershoot is stronger (case 3), Figure 2b shows that the gas transport is mainly responsible for the cell dynamics immediately after the current step, and that the longer path under the rib along with the liquid water accumulation increase the concentration overpotentials. The membrane humidification is higher at the cathode GDL-rib interface and a lower ohmic overpotential is calculated as compared to the channel domain (Figure 2c). The temporal distribution of the local overpotentials sets the current density distribution under the channel and under the rib, which reverses at about 5 s due to the increasing concentration losses under the rib (Figure 2d).
Conclusion
A 1D modeling concept combining two parallel, equipotential sub-domains for the channel and the rib is presented, simulating the major effects of the channel‑rib structure in PEFCs. This allows for studying the temporal cell behavior with higher accuracy, while retaining affordable computation times.
The two main characteristics of the model are that: i) different saturation boundary conditions of the GDL can be implemented under channel and rib, which is a very realistic description of the actual physics; and ii) different gas diffusion lengths can be implemented for the two different domains.
Under the rib, the longer path for gas transport and the liquid water accumulation influence the effective diffusion coefficient under the rib and thus the cell potential response at times shorter than 1 s. The short-term potential dynamics are much better reproduced by the 1D2 model, making this new approach a valuable alternative to using analytically parameterized GDL properties for channel and rib domain for 1D models.