Abstract
Mass transport losses (ηmtx) play a significant role at high current densities in polymer electrolyte water electrolyzers (PEWEs). Previous work has shown that ηmtx depends on the porous transport layer (PTL) structure, although a clear correlation between the material morphology and ηmtx has not been established. In this work, we experimentally determine the overpotential ηH +CLa associated with the proton transport in the anodic catalyst layer by measuring the ionic resistance in the catalyst layer using electrochemical impedance spectroscopy (EIS) and the transmission-line model. We found that overpotentials, including ηH +CLa, depend on the PTL morphologic surface properties.
Export citation and abstract BibTeX RIS

This is an open access article distributed under the terms of the Creative Commons Attribution 4.0 License (CC BY, http://creativecommons.org/licenses/by/4.0/), which permits unrestricted reuse of the work in any medium, provided the original work is properly cited.
It is necessary to identify voltage losses in PEWE on the cell level in order to optimize the design for higher efficiency. The ohmic overpotential is associated with the charge transport (ionic, electronic) in cell components and contact resistances.1–3 Kinetic losses (ηact) are related to the electrochemical reactions, mainly the sluggish oxygen evolution reaction (OER).4 The mass-transport overpotential (ηmtx) is still not well understood. Previous work has shown that ηmtx occurs on the anode side, and was hypothesized to stem from the two-phase flow through the anodic PTL (PTLa),5 and the removal of O2 bubbles that hinder the water supply to the electrode.6 In this work we experimentally determine the overpotential ηH +CLa related to the proton transport resistance in the anode catalyst layer (RH +CLa). This overpotential is often unaccounted for in PEWE and has so far been lumped together with general 'mass transport' losses.5–7 Recently, Bernt and Gasteiger12 calculated the effective proton transport resistance in the CLa from the electrode sheet resistance for proton conduction to be in a range from 6 to 171 mΩ cm2, depending on CLa ionomer content. The study presented here is the first to report experimentally determined RH +CLa values and its dependence on the PTLa/CLa interface.
Experimental
Electrolysis cell and test-bench
Experiments were performed using an in-house developed test-bench equipped with a SP-150 potentiostat and a HCP-803 80A booster from Biologic. Water was circulated at 400 mL min−1 only in the anode cell compartment, while the electro-osmotically dragged water was discarded periodically from the cathodic gas-water separator. The PEWE cell with an active area of 25 cm2 was assembled using a Nafion 117 based E400 catalyst coated membrane (CCM) from Greenerity, with an Ir-based catalyst for the anode and the Pt-based catalyst for the cathode. Sintered-Ti PTLs T5, T10 and T20 from GKN were varied on the anode and cathode side. Data describing the cells with different PTLs will be designated with T5/T10/T20. The previous study from Suermann et al.5 included X-ray tomography characterization of dry samples, showing that the samples had similar porosity between 30–35%. T5 and T10 have dparticle50 of 68 μm, with T5 having smaller pores, and the "smoothest" surface. The T20 sample had both the largest particles (dparticle50 = 128 μm) and a higher fraction of larger pores. For details we refer to Ref. 3.
Operating conditions – electrolysis regime
CCMs were conditioned for 12 hours prior to measurements by cycling the current density between 1 and 2 A cm−2 in 5 min intervals at 60°C. The polarization curves were recorded galvanostatically at 60°C, and the high frequency resistance (HFR) was measured at 10 kHz for the iR-correction.
Operating conditions – H2/N2 regime
For the determination of RH +CLa, a N2-stream of 500 Nml min−1 was injected into the working electrode (WE) water loop, while the reference/counter electrode (RE/CE) was supplied with humidified H2 at 400 Nml min−1. At the applied DC-bias of the cell, hydrogen evolution takes place at the RE/CE, and oxidation of hydrogen that has permeated through the membrane from the H2 to the N2 side at the WE. The DC current in this case is the limiting hydrogen crossover current. The PEWE cell was operated potentiostatically at 1.0, 1.2 and 1.4 V, and the impedance was measured from 10 kHz to 100 mHz. The measurements were performed in the potential region with higher capacitance to eliminate the effects of the inductive elements.8 No contribution of the faradaic current was observed at these potentials in the H2/N2 regime (cf. Supplementary Material, Figure S3). In this study, we analyze the WE AC response using a one-dimensional transmission-line model consisting of differential elements describing charge transfer and proton transport in the CL. The general model is widely used in fuel cell CL characterization8–10 and the governing equations are given in detail in the Supplementary Material. The proton transport losses in the CLa appear as RH +CLa/3 in the polarization curve, under the assumption of uniform potential distribution in the CL.8–10 Due to a good agreement between the measured and the modeled impedance response (cf. Supplementary Material, Figure S2), we extrapolated the low frequency, capacitive response to the real axis obtaining the RH +CLa/3 projections. This procedure was repeated for different PTLs to determine the impact of the CL/PTL interface on RH +CLa. The RH +CLc contribution is assumed to be negligible as a result of the low charge transfer resistance of the hydrogen evolution reaction (HER).11 Furthermore, the fast HER takes place at the catalyst/membrane interface, resulting in a negligible effective RH +CLc.
Results and Discussion
Proton transport resistance in the anode catalyst layer
So far, there have not been any attempts to experimentally determine the RH +CLa contribution to ηmtx. The values of RH +CLa/3 are extrapolated from the impedance spectra from the H2/N2 operation (Figure 1) (8.1 ± 0.9/11.2 ± 1.8/20.6 ± 2.1 mΩcm2 for T5/T10/T20, respectively). The RH +CLa appears to strongly depend on the interface between the PTL and the CLa, as the PTL with the coarsest and finest surfaces result in highest and lowest RH +CLa, respectively. To better comprehend the effect of the PTL/CLa interface on the cell characteristics, we have conducted an overpotential analysis on the polarization curves.
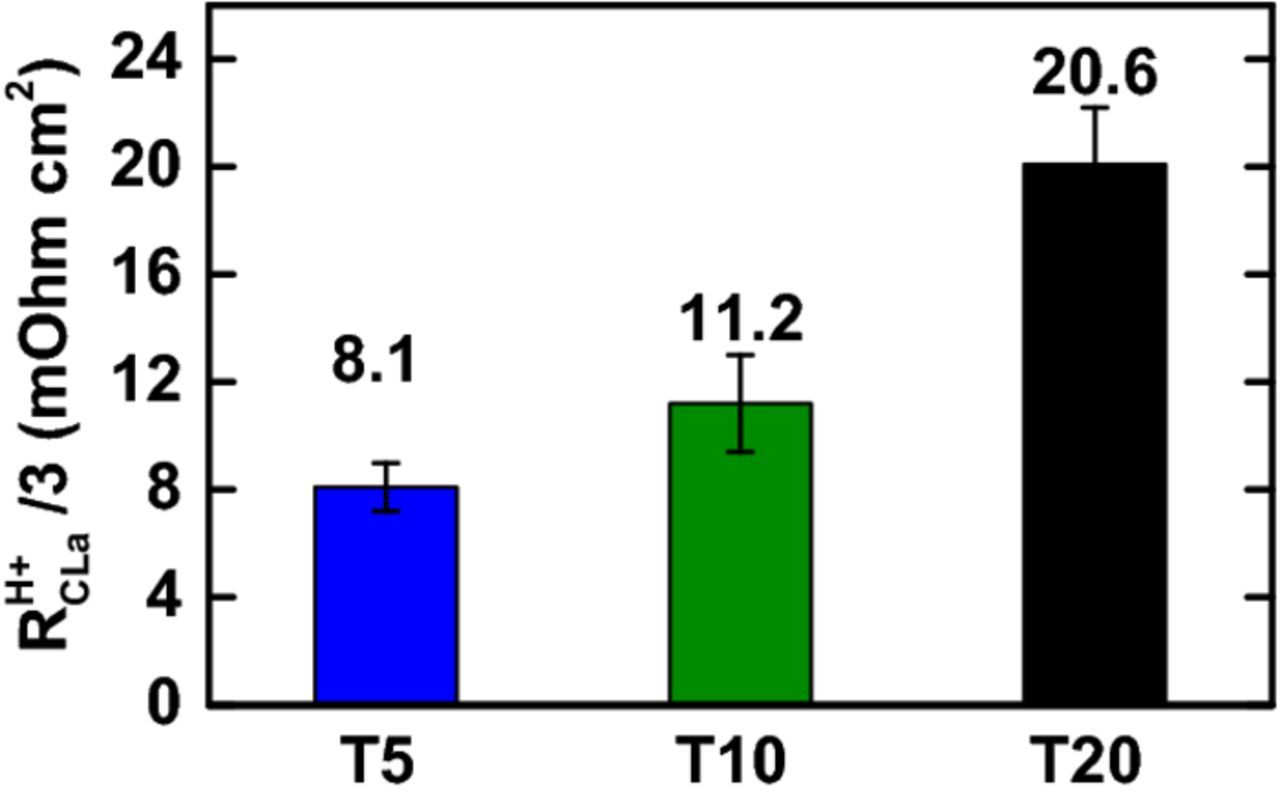
Figure 1. Proton transport resistance in the anode catalyst layer (RH +CLa), extrapolated from the PEWE cell impedance in H2/N2 mode at 60°C.
Overpotential analysis
The PEWE polarization curves were analyzed according to the Tafel model, with the procedure and equations given in detail in References 5–7. PEWE cell voltage is a sum of the thermodynamic, reversible cell voltage Erev(p, T), given by the Nernst equation, and the overpotentials, which can be broken down to kinetic ηact, ohmic ηohm, and mass-transport ηmtx contributions.7 Correcting the cell voltage, Ecell, using the HFR yields the iR-free cell voltage (EIR − free) and ηohm. The Tafel slope was fitted in the low current density region (0.01–0.08 A cm−2) and subsequent subtraction of Erev(p, T) yielded ηact. The difference between EIR − free and the extrapolated Tafel line yields residual losses, considered to be the results of mass transport losses.5–7
![Equation ([1])](https://content.cld.iop.org/journals/1945-7111/165/15/J3016/revision1/d0001.gif)
Polarization curves and the impedance spectra (Figure 2) reveal significant differences in cell performance with different PTLs. Although cells with T5 showed the lowest HFR, they are outperformed by the cells with T10 PTL. The cells with T20 exhibited both the highest HFR and different impedance response at low frequencies (Figure 2b), indicating higher mass transport losses. The difference in HFR most likely stems from a higher ohmic interfacial contact resistance in the cell when using coarser T20 compared to T5. Interestingly, Tafel slopes are somewhat different for the three cells; 71 ± 1, 68 ± 1, 78 ± 2 mV/dec for T5, T10, T20, respectively. PTL-induced structural inhomogeneity in the CLa might result in the different apparent Tafel slopes. Overall, calculated overpotentials with different commercial PTLs are in line with the previous study from Suermann et al.5
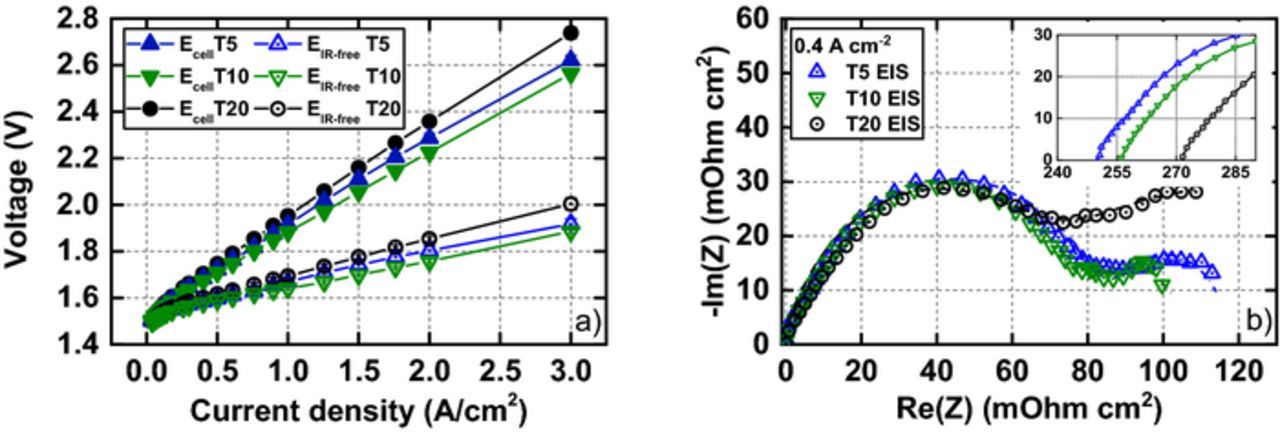
Figure 2. a) Polarization curves showing cell voltage Ecell and the IR-free cell voltage EIR − free for T5/T10/T20 cell configurations at 60°C. b) iR-free impedance response (subtracted high frequency intercept) (10 kHz → 0.1 Hz) for three cell configurations measured at 0.4 A cm−2, with the inset showing the uncompensated HFR intercept.
Since RH +CLa/3 appear as part of ηmtx, ηmtx was corrected for the RH +CLa contribution from the H2/N2 measurements to extract ηmtx − rest. RH +CLa contributes 11, 18 and 21% to ηmtx at 3 A cm−2 for the cells with T5, T10 and T20 PTLs, respectively. The ηmtx − rest still accounts for the major contribution to ηmtx at high current densities and differs between the three configurations, being highest for T20 and lowest for T10 (Figure 3). A coarse PTLa surface appears to be detrimental to the cell performance indicators. We offer the following tentative explanation: as the CCM deforms between the rigid Ti-PTLs, the CLa area under the solid PTL particles is compressed and its porosity is thereby reduced. The surface of T20 consists of larger particles, leading to more pronounced local reductions in porosity. We assume that proton transport takes place in the compacted CLa structure, as it is the area under the PTL particle in contact with the CLa that contributes to the OER.12,13 The water reaches the CLa through the voids on the PTL surface and relies on lateral diffusion through the ionomer binder to reach the active sites under the PTL solid particles (Figure 4). The T20 PTL surface consists of larger particles and pores,5 and would in turn result in larger diffusion distances for the water in the CLa ionomer, and thus higher ηmtx − rest. The different ηmtx − rest for the T5 and T10 might stem from the more constrained T5 structure, with a higher fraction of small, potentially bottlenecking pores.5 The compaction of the CLa under the PTL particle leads to higher degree of ionomer binder confinement and inhomogeneous wetting of the CLa active sites, resulting in increased RH +CLa.14,15 SEM images of the CLa surface and CCM cross-sections are presented in the Supplementary Material to give more insight into the impact of the interface morphology on the CCM physical properties.
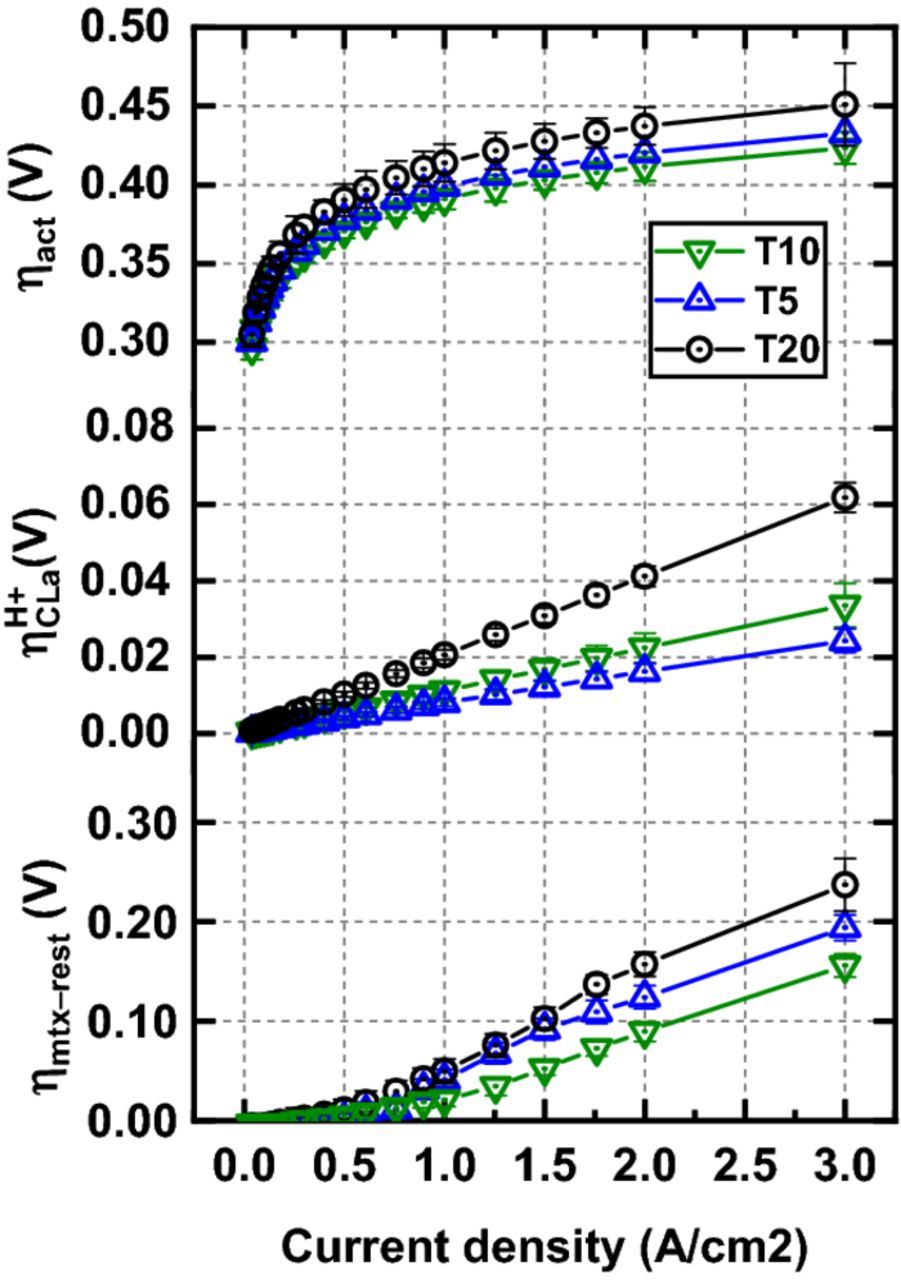
Figure 3. Activation (ηact), CLa proton transport (ηH +CLa) and the rest of the mass transport overpotential (ηmtx − rest) for T5/T10/T20 cell configurations.
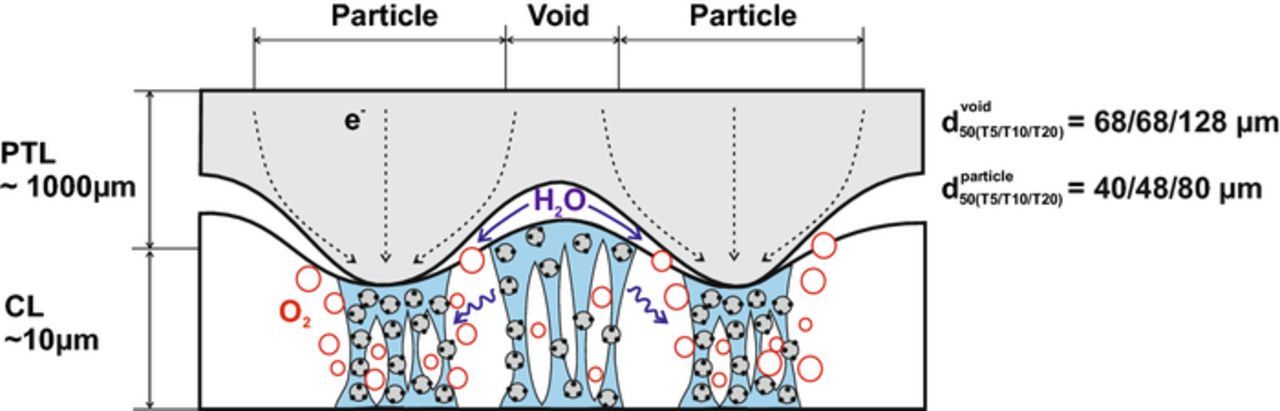
Figure 4. Schematic of the CLa/PTLa interface. Macroporous sintered-Ti PTLs are thought to result in local porosity variations in the CLa, causing increased RH +CLa. Water needs to diffuse laterally through the ionomer to reach active sites under the Ti-particles. PTL pore and particle size are obtained from Reference 5.
Conclusions
We have analyzed the impact of the PTL properties on the cell characteristics in a PEWE cell by conducting a detailed overpotential analysis. Experimentally determined RH +CLa vary based on the PTL surface morphology, with the highest and lowest values measured in the case of cells with coarsest and finest PTL surfaces, respectively. The variations in RH +CLa are most likely caused by confinement effects in the CLa, resulting in inhomogeneous water distribution along the CLa. Overall the RH +CLa accounts for 11, 18 and 21% of ηmtxat 3 A cm−2 for the cells with T5, T10, and T20 sinters, respectively. The residual mass transport loss, ηmtx − rest, varies between the cells with different PTLs, and is assumed to be influenced the PTL/CL interface. The coarse PTL/CLa interface results in longer water diffusion paths in the CLa.
Acknowledgment
Funding by the Swiss Federal Office of Energy (grant-no. 501198-01) is gratefully acknowledged.
ORCID
Ugljesa Babic 0000-0002-6774-1001
Thomas J. Schmidt 0000-0002-1636-367X
Lorenz Gubler 0000-0002-8338-6994