Abstract
The quality of metal oxide-based battery active materials is compromised by surface contamination from storage and handling at ambient conditions. We present a detailed analysis of the true nature and the quantity of the surface contaminants on two different cathode active materials, the widely used LiNi1/3Co1/3Mn1/3O2 (NCM111) and the Ni-rich LiNi0.8Co0.1Mn0.1O2 (NCM811). We process these materials in three distinct conditions "wet" (excessive exposure to moisture), "dry" (standard drying of as-received materials), and "calcined" (heat-treatment of cathode powders). Surface contaminants are then quantified by thermogravimetric analysis coupled with mass spectrometry (TGA-MS), and their reactivity with an ethylene carbonate-based electrolyte is evaluated using on-line mass spectrometry (OMS). We demonstrate that not only the commonly assumed LiOH and Li2CO3 residues account for NCM performance deterioration upon storage in moisture and CO2 containing atmosphere, but also basic transition metal hydroxides/carbonates formed on the material surface. Eventually, we showcase a thermal treatment that removes these transition metal based surface contaminants and leads to superior cycling stability.
Export citation and abstract BibTeX RIS

This is an open access article distributed under the terms of the Creative Commons Attribution 4.0 License (CC BY, http://creativecommons.org/licenses/by/4.0/), which permits unrestricted reuse of the work in any medium, provided the original work is properly cited.
State-of-the-art cathode active materials (CAMs) for lithium-ion batteries range from the classic LiCoO2 (LCO) and LiMn2O4 (LMO), which are still at the heart of nearly all portable electronic devices, to mixed metal oxides, such as LiNiaMnbCocO2 (a+b+c = 1) with various compositions, where the most widespread representative is LiNi1/3Mn1/3Co1/3O2 (NCM111).1 For NCM111, the general understanding is that Ni provides high capacity but poor thermal stability, that Mn maintains good cycle life and safety, and that Co offers structural stability and high electronic conductivity resulting in a better rate capability.2,3 To boost the energy density and minimize the dependence on Co, current development focuses on Ni-rich compositions, e.g., NCM523, which is already a commercial commodity and expected to be replaced by NCM622 soon. Nowadays, considerable research effort is devoted to the Li- and Mn-rich version of NCM, viz., (1-x) Li2MnO3·xLi[NiaMnbCoc]O2 (HE-NCM), and the Ni-rich material NCM811, which are being envisaged as potential CAMs for high-energy battery packs in the next generation of electric cars,4,5 and which are considered to be competitive alternatives to Ni-rich NCA (LiNi0.80Co0.15Al0.05O2).1,5
In the synthesis of these materials (see Figure 1 for a simple scheme), transition metal precursors are obtained from precipitation of aqueous transition metal sulfate or nitrate solutions by increasing the pH.6,7 The obtained transition metal hydroxides are then mixed with the lithium precursor, viz., Li2CO3 or a technical grade LiOH·H2O containing typically 1 wt% of Li2CO3.7,8 The mixture is subsequently calcined under O2-rich atmosphere, e.g., in a pusher kiln (step 1 in Figure 1) to form the desired layered transition metal oxide cathode active material. In the case of Ni-rich materials ((e.g., NCM811), the calcination step can only be done at rather moderate temperatures (<700°C), since the thermal stability of the product is inversely proportional to the Ni content;3 in this case, LiOH·H2O is preferred due to its lower decomposition temperature,9 but the Li2CO3 impurities remain in the resulting CAM powder, especially on its surface.6,7 Additionally, any residual LiOH after calcination can react with CO2 in air to form Li2CO3. This could already happen during the cooldown (step 2 in Figure 1), if CO2 and H2O released from the precursors during calcination are not entirely removed. Both, LiOH and Li2CO3 were reported to trigger electrolyte decomposition and thus deteriorate the cell cycling performance.10–13
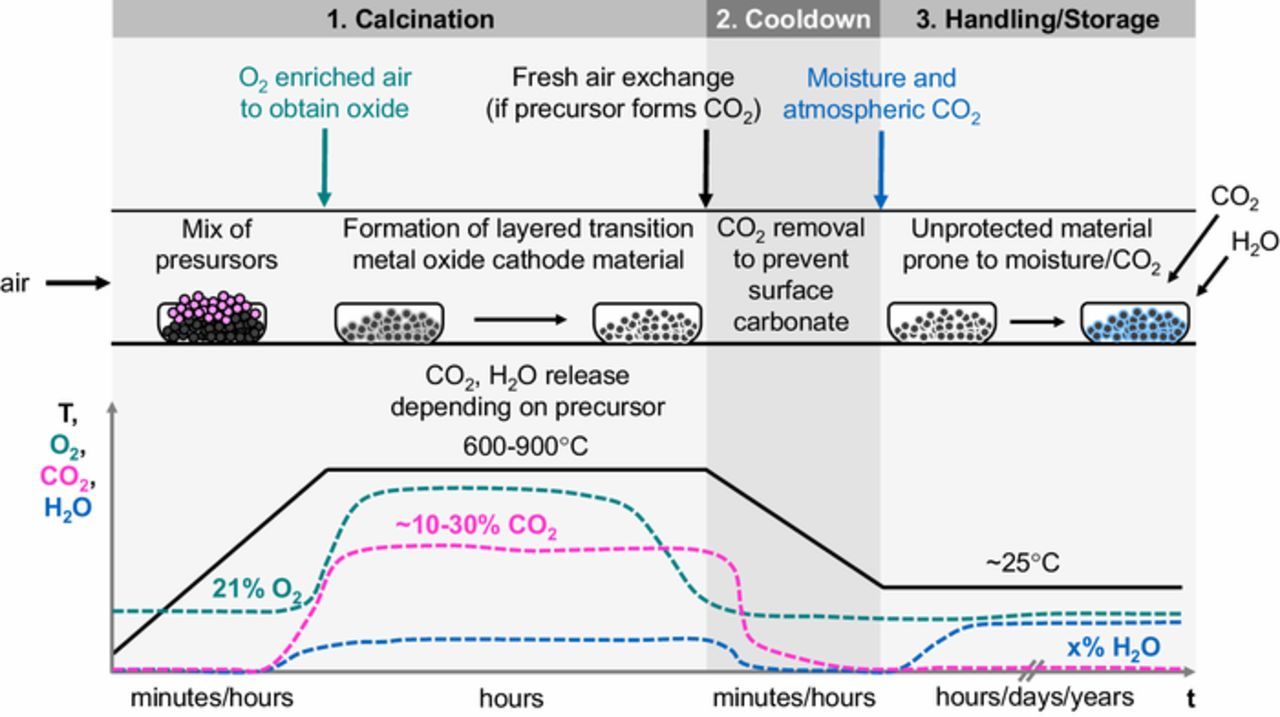
Figure 1. Scheme of the synthesis process to obtain a metal oxide-based cathode active material (CAM), exemplarily shown for a pusher kiln setup where a saggar moves through various furnace compartments (upper panel) at different temperatures, and showing also the approximate variation in the surrounding gas environment (lower panel). Transition metal precursors and lithium precursor are mixed and heated to 600–900°C during calcination in O2 enriched air (step 1). During the subsequent cooldown (step 2), fresh air is supplied to remove H2O and CO2 released from the precursors, which would otherwise lead to the formation of surface hydroxides and carbonates. During improper storage and handling (step 3), the metal oxide surface is prone to contamination in moisture and CO2 containing atmosphere.
In addition to these known Li2CO3 and LiOH residues, metal oxide-based cathode materials are highly prone to contamination from improper storage and handling (step 3 in Figure 1), a fact that was so far mainly discussed in the patent literature.6–8,14–16 As of yet, the mechanism of these weathering phenomena and the nature of the resulting surface contaminants have not been clearly resolved. Ni-rich materials are particularly sensitive to moisture exposure.17–19 Long air exposure of the CAM powder typically results in a high content of soluble base,7 which makes it difficult to fabricate good electrodes due to gelation of the cathode slurry caused by the increased pH.3 Further, a deterioration of cycling performance is observed for batteries made from surface contaminated cathode active materials.17,20,21
Out of the few scientific publications that deal with the storage of cathode active materials, the article by Shkrob et al.22 presents evidence for a bulk H+/Li+ exchange during long-term exposure (several months) of NCM materials to humid air. While these bulk changes are not the focus of our current study, also Liu et al. have reported Li+ cations and oxygen atoms migrating toward the surface of layered oxide particles and recombining with water and CO2 to yield LiOH, LiHCO3, and Li2CO3.19,23 Recently, Faenza et al.24 conducted a study on NCA proposing to remove those contaminants via thermal treatment. However, similar to Liu et al.,19,23 they interpreted surface species that could be removed between 150 and 350°C as LiHCO3. Although thermodynamic data on LiHCO3 is scarce, there is some consensus that it can be formed by the reaction of CO2 with aqueous Li2CO3 and is only stable in solution.25 More specifically, CO2 capture by aqueous Li2CO3 has been predicted by DFT to take place at T ≤ 300K, pH2O = 1 bar and pCO2 ≥ 0.1 bar, but no experimental evidence was provided.26 To the best of our knowledge, solid LiHCO3 has not been observed at ambient conditions and there is no known or experimentally determined crystal structure. In short, its existence as a solid contaminant on metal oxide surfaces at temperatures up to 150°C appears unlikely. The formation of lithium carbonate impurities from synthesis or improper storage can, in principle, be mitigated by washing the affected oxide in water18 or alcohol.27 To our knowledge, only two articles reported surface contaminants other than the above-mentioned lithium compounds: The first is a paper by Moshtev et al.,28 suggesting a reaction of overlithiated LiNiO2 with water to nickel (+III) oxide hydroxide (NiOOH) and surface LiOH due to Li+ de-intercalation. The second is a study on the ambient storage NCM811 based electrodes which was conducted within our group in parallel to the present work.29 Therein, the appearance of a voltage spike in the first charge of electrodes stored over extended times in ambient air as well as a significant performance loss in full-cell cycling is described. Both effects increase with the time of exposure to ambient air (3 and 12 months). Raman spectroscopy demonstrated that hydrated nickel carbonate-hydroxides (referred to as (NiCO3)2·(Ni(OH)2)3·4 H2O in that work) are crucial surface contaminants produced upon ambient air storage, rather than only the commonly reported Li2CO3 and LiOH surface contaminants.
In a recent study,30 we added discrete amounts of H2O or TBAOH x 30 H2O as hydroxide ion (OH−) sources in order to study the hydrolysis of electrolytes based on ethylene carbonate (EC). At high temperature (≥ 60°C), both the H2O- and the OH−-induced EC hydrolysis generated large amounts of CO2. The decisive finding, however, was that the OH−-induced reaction has a lower activation energy and is thus already relevant at typical battery operating conditions (≤ 40°C). These results have important implications for cell manufacturing and cathode active materials synthesis. On the one hand, trace amounts of water and OH− could easily be introduced into lithium-ion cells by improper drying of cell components, as pointed out in previous studies with regard to gas evolution at the cathode31,32 and the anode.33,34 On the other hand, alkaline surface contaminants originating from the synthesis and/or the storage of transition metal oxide based CAMs in moisture and CO2 containing atmosphere (i.e., ambient air) would likely attack carbonate-based electrolytes in a similar manner as described above. In the literature, spinel coating has been demonstrated to overcome chemical instability of layered oxides.35 In principle, bulk doping might increase or decrease the reactivity of layered oxides with CO2 and H2O by altering the basicity of the oxide surface. The NCM samples described in the article at hand were neither modified by surface coating nor by bulk doping.
In this study, two different metal oxide-based cathode active materials are investigated in terms of their susceptibility to surface contamination: the widely used LiNi1/3Mn1/3Co1/3O2 (NCM111) and the Ni-rich LiNi0.8Mn0.1Co0.1O2 (NCM811). The samples are preconditioned under carefully controlled conditions (see Experimental Section for details), leading to "wet" (after extended exposure to wet air), "dry" (standard drying of as-received CAMs), and "calcined" samples (heat-treatment of CAMs). These are subjected to detailed TGA-MS and DRIFTS (diffuse reflectance infrared Fourier transform spectroscopy) analyses, and their reactivity with EC-based electrolyte is tested by on-line mass spectrometry (OMS) of heated mixtures of EC and differently conditioned CAMs. In this work, we also explore a strategy to reverse surface contamination from improper storage conditions. Finally, we demonstrate that the condition of the CAM surface strongly affects the cycling stability of NCM811//graphite full-cells.
Experimental
Treatment of cathode active materials
To investigate the formation and the effect of surface impurities, the two CAM samples, NCM111 and NCM811 (all BASF, Germany) are treated in three distinct ways as graphically summarized in Figure 2.
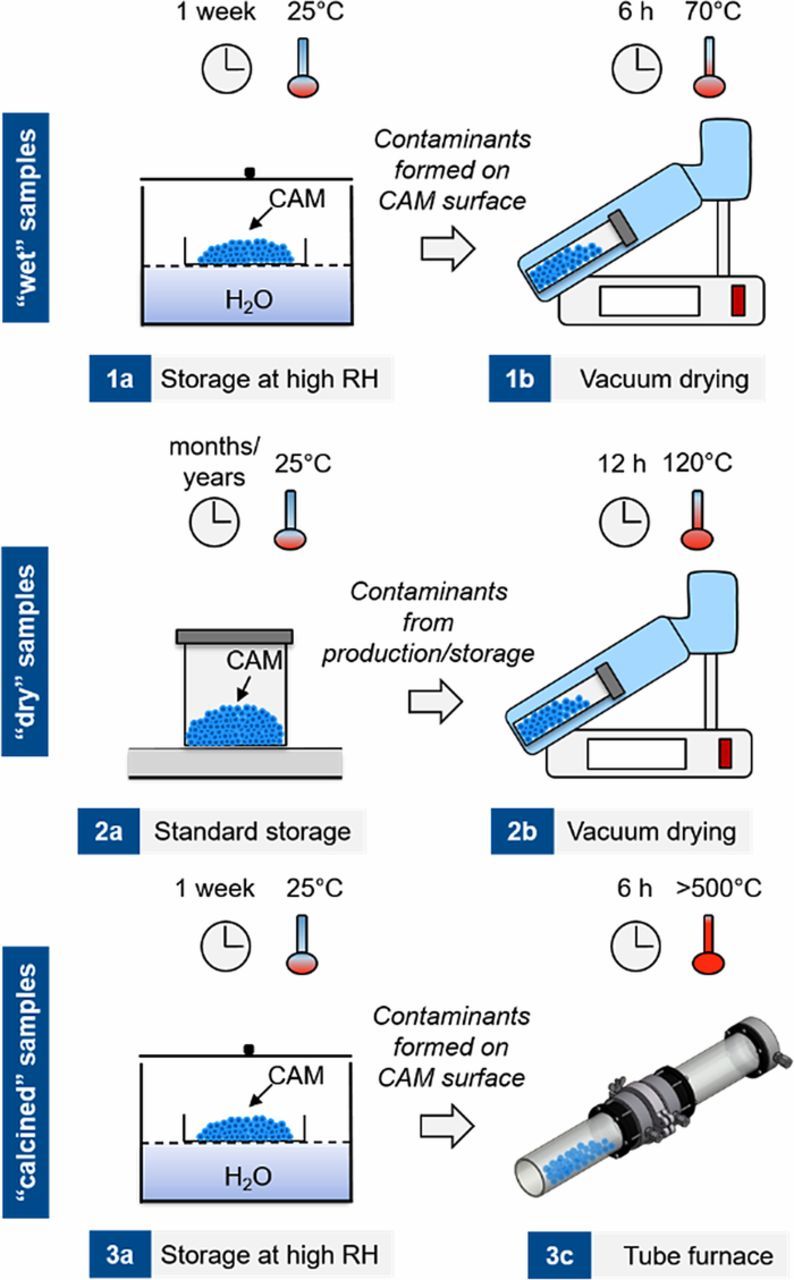
Figure 2. Storage conditions for the two CAM samples, NCM111 (standard material) and NCM811 (Ni-rich material). The "wet" condition is obtained by storing the CAMs under high relative humidity (RH) for one week, followed by mild drying under dynamic vacuum (6 h at 70°C) to remove physisorbed water (upper panel); the "dry" condition refers to the as-received CAMs stored in an Ar-filled glove box and dried under standard electrode fabrication conditions (12 h at 120°C under dynamic vacuum) prior to use (middle panel); the "calcined" condition refers to "wet" storage, followed by a high temperature treatment (6 h at >500°C in a pure argon flow) to remove surface contaminants (lower panel).
The "wet" samples are obtained by storing the CAM powder for one week in ambient air over an open water bath held at 25°C, thus exposing them to moisture (relative humidity of 85 ± 5%) and the typical concentration of ∼400 ppm CO2 in air (step 1a in Figure 2). The vessel contining the water bath was covered with a lid which contained a small hole to allow CO2 diffusion from the ambient into the vessel, so that CO2 could be supplied continuously. The samples are then dried in a glass oven (Büchi, Switzerland) for 6 h at 70°C under dynamic vacuum to remove physisorbed H2O (step 1b in Figure 2), and subsequently stored in an Ar-filled glove box (<0.1 ppm O2 and H2O, MBraun, Germany) without exposure to ambient air after drying. We strive to demonstrate the effect of surface contaminants on cell cycling behavior and thus wanted to ensure not to decompose any surface contaminants. For this reason, we chose the unusually low drying temperature of 70°C for the "wet" samples.
The simultaneous presence of CO2 and H2O during "wet" storage facilitates the formation of carbonates, hydroxides, and their hydrates. Without moisture, no hydroxides or hydrates can be formed, which also might impede the formation of carbonates (this was demonstrated by DRIFTS measurements for materials stored for several days in pure but dry CO2; data not shown). The higher the moisture content, the faster the formation of contaminants and the higher the amount of contaminants being formed.
The "dry" samples are taken from the as-received CAM powders that were shipped under inert gas packaging and stored in an Ar-filled glove box (step 2a in Figure 2). These samples are dried at the standard conditions for electrodes in our lab, viz., 12 h at 120°C under dynamic vacuum in a glass oven (step 2b in Figure 2), before returning them into the glove box without exposure to ambient air. Note that these samples were not necessarily handled under inert atmosphere before shipping, such that a surface contamination prior to handling in our labs cannot be excluded. Finally, the "calcined" samples are preconditioned in the same way as the "wet" samples. After one-week of exposure to moisture and CO2, the samples are heat treated in a tube furnace (Carbolite, Germany) under argon flow (1 l/min; 99.999% purity, Westfalen, Germany) for 6 h at 625°C in case of NCM111 and at 525°C in case of NCM811 due to its lower thermal stability (step 3b in Figure 2). Afterwards, the "calcined" samples are transferred into the glove box without exposure to ambient conditions.
Surface area measurements
The surface area of the "dry" and "calcined" CAMs is determined by Brunauer–Emmett–Teller (BET) N2 adsorption in the relative pressure range of 0.05 ≤ (p/p0) ≤ 0.30, using an Autosorb-iQ instrument (Quantachrome, Germany). Prior to the measurement, all samples are degassed under dynamic vacuum at 200°C for 12 h. This relatively low degassing temperature is chosen to stay well below the calcination temperature, since the purpose of the BET measurements is to see if any sintering of the particles occurs during calcination. Table I shows the calcination temperature for the different CAMs and the BET surface area before and after calcination, as well as the absolute (in m2/g) and the relative change upon calcination (in %). For both, the NCM111 and the NCM811 sample, the surface area decreases somewhat upon calcination, i.e., by 23% in the case of NCM111 and by 17% in the case of NCM811. Note that no harm is done to the crystal structure of the materials, as was confirmed by XRD (data not shown).
Table I. BET surface area of CAMs in the as-received condition ("dry") and after calcination in a tube furnace under Ar flow at 625°C for NCM111 or 525°C for NCM811, aimed toward removing surface contaminants ("calcined"). Measurements were conducted with 10 g of CAM.
| Active material | ABET "dry" [m2/g] | Heat treatment | ABET "calcined" [m2/g] | ΔABET [m2/g] | ΔABET [%] |
|---|---|---|---|---|---|
| NCM111 | 0.31 | 625°C | 0.24 | −0.06 | −23 |
| NCM811 | 0.30 | 525°C | 0.25 | −0.05 | −17 |
Thermogravimetric analysis coupled with mass spectrometry (TGA-MS)
To investigate changes of the CAM surface induced by the above described storage conditions, the samples are analyzed by TGA-MS using a Mettler Toledo TGA/DSC 1 (Mettler Toledo, Switzerland) coupled to a Thermostar MS (Pfeiffer Vacuum, Germany). All samples are held at 25°C for 10 min and then heated from 25 to 1125°C at a rate of 10 K/min under Ar at a flow rate of 60 ml/min, and the associated weight loss together with the corresponding mass signals of evolved gases are recorded. It should be noted that the first ten minutes of the mass traces were used to fit a baseline. In addition to the CAM samples, also lithium reference compounds (Li2O, LiOH, and Li2CO3; purity >97% for all compounds, Sigma-Aldrich, Germany) and transition metal carbonate hydrate reference compounds (MnCO3·xH2O, CoCO3·xH2O, and NiCO3·2Ni(OH)2·xH2O; purity >99.9% for all compounds, Sigma-Aldrich, Germany) are investigated using the same protocol. The NCM811 sample is subjected to a second testing protocol, which comprises four steps: First the CAM in "dry" condition is heated from 25 to 525°C at 10 K/min under Ar at a flow rate of 60 ml/min (step 1). After cooling down to 25°C under Ar, the same procedure is repeated without interim removal of the sample from the instrument, i.e., without air exposure, thus mimicking the analysis of a "calcined" sample (step 2). Subsequently, the sample is removed from the instrument, stored for one week at ambient air conditions and then re-measured (step 3). This resembles the analysis of a "wet" sample. Finally, the sample is exposed for only 20 min to ambient air conditions and measured again to evaluate the changes induced by the estimated minimum exposure time during material processing for electrode fabrication outside of a glove box, viz., on the order of 20 min (step 4).
Diffuse reflectance infrared fourier transform spectroscopy (DRIFTS)
Infrared spectroscopy in diffusive reflectance mode (DRIFTS) is sensitive to infrared active species at the surface of particulate materials. DRIFTS spectra are recorded by an IR spectrometer (Cary 670, Agilent, USA) with mirror optics mounted in a Praying Mantis configuration (Harricks, USA) that allows to collect diffuse IR radiation scattered from the particle surface. Mixtures of NCM811 powder in conditions "wet", "dry", and "calcined" (see Figure 2) were prepared at 1 wt% of sample in finely ground KBr (FTIR-grade, Sigma-Aldrich, Germany, dried at 120°C under vacuum overnight prior to use) to characterize carbonate and hydroxide groups on the particle surface. The sample/KBr mixture was prepared in an Ar-filled glove box and the mixture was put in an air-tight chamber with IR-transparent windows (HT reaction chamber, Harricks, UK). The intensity of DRIFTS spectra (sample in KBr) is calculated versus a reference (KBr only) and given in Kubelka-Munk units: Intensity [KM] = (1 − R∞)2/(2 R∞) with R∞ = Isample/Ireference. The DRIFTS spectra are compared with spectra obtained by regular Fourier transform infrared (FTIR) spectroscopy in transmission mode. For the latter, pellets are prepared in an Ar-filled glove box at the same KBr to sample weight ratio using a manual KBr pellet press (Pike Technologies, USA). In addition, DRIFTS and transmission spectra are compared to FTIR spectra in attenuated total reflection mode (ATR). The ATR-FTIR spectra are obtained using a diamond ATR crystal and an IR spectrometer (Spectrum Two, Perkin Elmer, USA) inside the glove box (<0.1 ppm H2O and CO2).
On-line mass spectrometry (OMS)
To test the reactivity of the CAM samples exposed to the different treatment conditions with ethylene carbonate (EC) containing electrolyte, 1.03 g of CAM are mixed with 240 μl of 1.5 M LiClO4 EC electrolyte (≡ 0.36 g) in our previously developed OEMS (on-line electrochemical mass spectrometry) cell hardware,31 mimicking a realistic electrolyte to CAM mass ratio of 0.35:1 in commercial battery cells.36 We use the EC-only electrolyte as a probe for the amount and reactivity of surface contaminants present on the particle surface and thus selected an electrolyte salt that does not react with hydroxide, carbonate, or hydrate surface groups. E.g., it has been shown by Ellis et al. that surface carbonates react with LiPF6 to form CO2 (equation 9 in Ref. 37). While not a commercially relevant salt, LiClO4 is useful as a substitute for LiPF6 to enable such diagnostic tests without competing reactions of the salt. This was also shown in a previous study of our group, investigating the hydrolysis and associated gas generation of ethylene carbonate.
Before cell assembly, all cell hardware is dried for at least 12 h at 70°C in a vacuum oven (Thermo Scientific, USA). The sealed cell containing the CAM/electrolyte mixture is placed into a programmable temperature-controlled chamber (KB 23, Binder, Germany), and connected to the mass spectrometer via a crimped capillary leak (∼1 μl/min gas flow rate into the mass spectrometer).38 First the cell is held at 10°C for 5 h to record a stable baseline for all ion current signals (m/z = 1 to 128). After that, the temperature is raised to 60°C and the corresponding gas evolution is recorded for 12 h (mimicking storage of a lithium-ion cell at elevated temperature). The cell temperature is recorded with a thermocouple positioned in a 1 cm deep hole drilled into the stainless steel cell body. For translation of the OMS ion current signals Iz into units of [ppm], the temperature is set back to 25°C and the cell is purged with a calibration gas containing H2, CO, O2, and CO2 (the respective concentration of the gases is 2000 ppm in Ar, Westfalen, Germany). With the calibration gas we can quantify the concentrations of H2 (m/z = 2), CO (m/z = 28), O2 (m/z = 32), and CO2 (m/z = 44) in the cell head space (for details on the calibration, see reference 31).
Electrode preparation and cycling
NCM811 electrodes were prepared by mixing 96 wt% of the cathode active material (HED NCM811, BASF, Germany) with 2 wt% conductive carbon (Super C65, Timcal, Switzerland) and 2 wt% polyvinylidene fluoride binder (PVDF, Kynar HSV 900, Arkema, France) using N-methylpyrrolidone (NMP) as dispersant. The powders were weighed in the glove box (O2 and H2O < 0.1 ppm, Glovebox Systemtechnik, Germany). Subsequently, 0.67 g of N-methylpyrrolidone (NMP, Sigma-Aldrich, Germany) per gram of solid (60 wt% solid content) are added in several steps and the mixture is stirred with a planetary orbital mixer (Thinky, Japan) until a highly viscous, lump-free paste is obtained. The above paste is applied on an 18 μm thick aluminum foil (MTI, USA) with a 100 μm four-edge-blade (Erichsen, Germany). The coated foil is dried overnight in a convection oven at 50°C. Disc-shaped cathodes with a diameter of 11 mm are punched out of the foil and compressed at 1 t for 20 s.
The cathodes are then weighed, dried overnight in a vacuum oven at 120°C, and introduced into an Ar glove box without exposure to the ambient. For the "calcined" CAM powder, the entire process of slurry preparation, coating, drying, punching, and compressing is carried out under inert conditions in an Ar-filled glove box, with conductive carbon and PVdF pre-dried at 120°C overnight in a vacuum oven. The areal loading of the NCM811 cathodes after drying is 7.5 mgNCM811/cm2, corresponding to an areal capacity of 1.5 mAh/cm2 when using a specific capacity of 200 mAh/gNCM811.
The graphite anodes are prepared with a composition of 95 wt% T311 (SGL Carbon, Germany) and 5 wt% PVdF (Kynar HSV900, Arkema, France) under addition of 0.69 g of NMP per gram of solids (59 wt% solid content) in the same sequential mixing process as for the cathodes. The resultant ink is applied onto a 12 μm thick copper foil (MTI, USA) with a 100 μm four-edge-blade (Erichsen, Germany). The coated foil is dried overnight in a convection oven at 50°C. Disc-shaped electrodes with a diameter of 11 mm are punched out of the foil and compressed at 0.5 t for 20 s. The anodes are then weighed, dried overnight in a vacuum oven at 120°C, and introduced into an Ar glove box without exposure to the ambient. The areal loading of the graphite anodes after drying is 5.3 mgT311/cm2, corresponding to an areal capacity of 1.8 mAh/cm2 when using a specific capacity of 340 mAh/gT311. Consequently, the balancing of the NCM811:graphite full-cells is 1:1.2 in units of mAh/cm2, if referenced to the 1st charge capacity of the cells.
Electrochemical testing is conducted in Swagelok T-cells at 45°C with 60 μl of LP572 electrolyte (1 M LiPF6 in EC:EMC 3:7 (w:w) plus 2 vol% VC, BASF, Germany). Anode (counter electrode) and cathode (working electrode) are separated by two glass fiber separators (glass microfiber filter #691, VWR, Germany) with 11 mm diameter. Lithium metal (Rockwood lithium, USA) was taken as reference electrode by utilizing a 3-electrode setup in the T-cell. The cycling protocol was as follows: the cells were cycled between cell voltages of 3.0–4.2 V, starting with two formation cycles at C/10, and followed by 300 cycles at 1 C. Every charge (1C) was performed in constant current – constant voltage (CC-CV) mode with a C/10 current cutoff at 4.2 V. All discharge cycles were carried out in constant current (CC) mode only. The cells were cycled at 45°C (including the formation cycles) with a battery cycler (Series 4000, Maccor, USA).
Results
Quantification of surface contaminants
Thermogravimetric analysis with coupled mass spectrometry (TGA-MS) is used to quantify the amount of surface species on the two different cathode active materials used in this study as a function of the storage conditions. Figure 3 shows the TGA-MS analyses for "dry" and "wet" samples of NCM111 (Figures 3a and 3b and NCM811 (Figures 3c and 3d with their weight loss upon heating to 1125°C (upper panels) and the corresponding mass traces of evolved gases (lower panels).
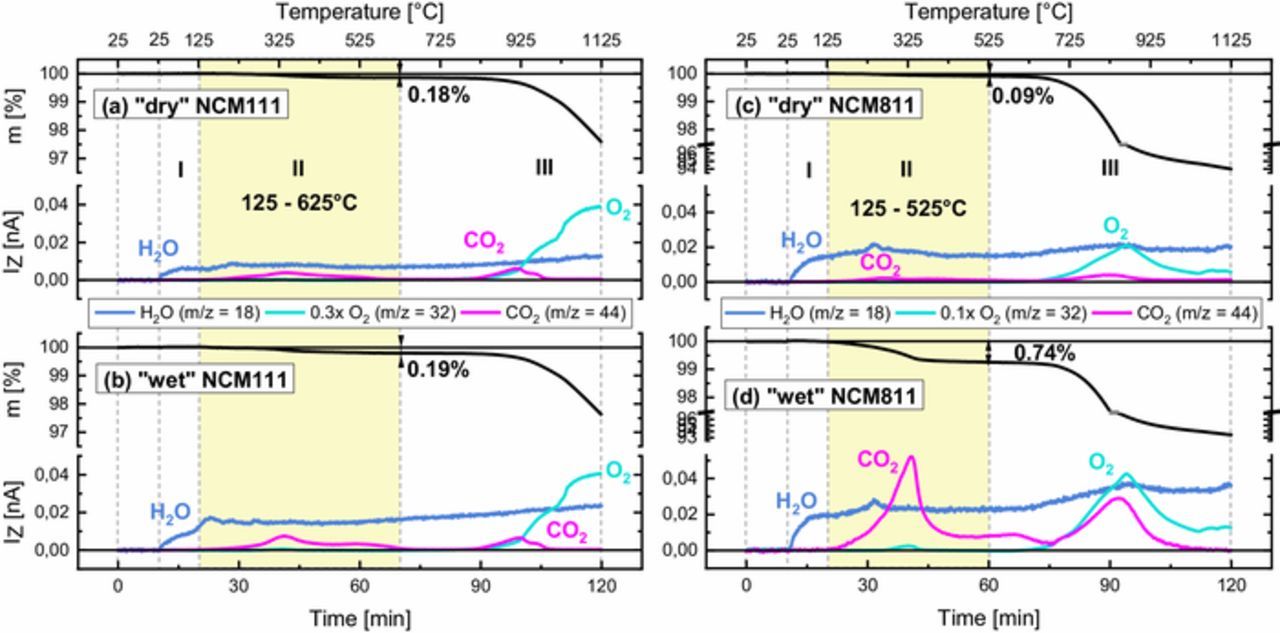
Figure 3. TGA-MS analysis under Ar of NCM111 (a and b) and NCM811 (c and d) stored under "dry" and "wet" conditions. For each sample the characteristic weight loss (upper panel) and the corresponding mass signals (lower panel) are shown for a 10 K/min temperature ramp from 25 to 1125°C. The yellow area marks the temperature range from 125 to 625°C for NCM111 and to 525°C for NCM811, where a mass loss from the thermal decomposition of the surface contaminants with its characteristic H2O and CO2 fingerprint is observed.
For all samples, three distinct regions can be identified upon heating: (i) In the temperature range from 25 to 125°C (region I), an increase of the H2O baseline MS signal is observed for all samples. This can be explained by a continuous desorption of minor H2O traces from cold spots of the MS capillary coupled to the TGA. In addition, the desorption of physisorbed H2O from the samples has to be considered, however, this effect seems to be small since no measurable weight loss is observed in that temperature range for any of the samples. Physisorbed H2O may stem from the unavoidable short term exposure of the samples to ambient air during transfer from the glove box to the TGA (<2 min exposure time). (ii) In the temperature range from 125 to 625°C for NCM111 and to 525°C for NCM811 (region II, marked by the yellow area in Figure 3), a mass loss concomitant with a characteristic H2O and CO2 fingerprint is observed for all samples. Since the thermal decomposition of NCMs at such low temperatures can be excluded,3 we associate this weight loss with the thermal decomposition of surface contaminants. In contrast to oven Karl-Fischer titration, which is described in the literature39 to assess the amount of physisorbed water on cathode active materials, thermogravimetric analysis serves to assess the amount of physisorbed water (below 125°C, i.e., segment (i)) and of chemisorbed water (above 125°C, i.e., segment (ii)) like tightly bound hydrates which co-crystallize with species such as LiOH·H2O. This is an important fact, since the physisorbed water will be removed by standard electrode manufacturing processes, which typically include drying at 125°C, whereas drying at these temperatures would not remove chemically bound water which we analyze in the study at hand. (iii) At temperatures above 625°C, the thermal decomposition of residual Li2CO3 (0.1 wt% for NCM111 according to the supplier) leads to the release of CO2 (compare also Figure 4c) and the thermal decomposition of the NCMs under Ar flow leads to the release of O2. As both processes overlap, a quantification of Li2CO3 via TGA-MS is not possible for these materials. As a side note it shall be mentioned that the thermal decomposition of NCM under Ar flow and the concomitant O2 release is detected already at 675°C for NCM811 (compared to 825°C for NCM111), consistent with the expected lower thermal stability of Ni-rich layered oxides, clearly shown for partially delithiated NCMs.3,40
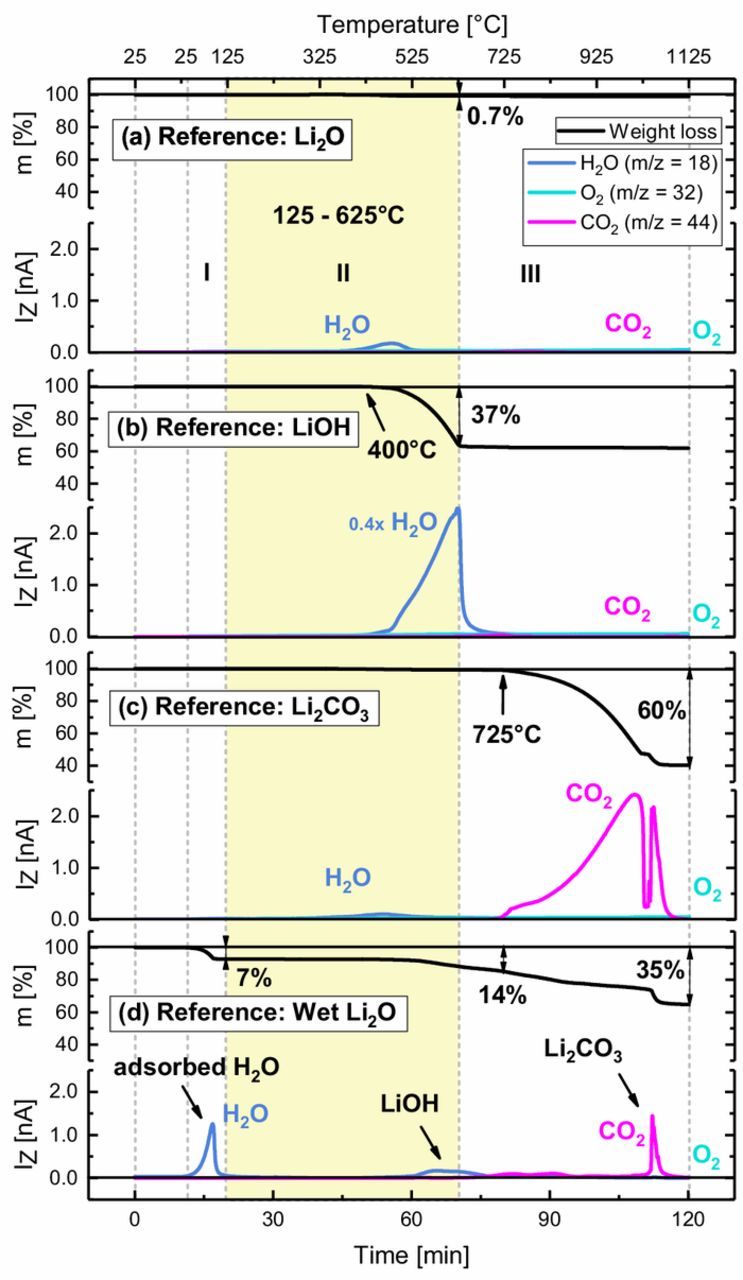
Figure 4. TGA-MS analysis of various lithium containing reference compounds: (a) Li2O, (b) LiOH, (c) Li2CO3, and, (d) Li2O stored for 1 week under "wet" conditions. For each compound the characteristic mass loss (upper panel) and corresponding mass signals (lower panel) are shown for a 10 K/min temperature ramp from 25 to 1125°C under Ar flow. Regions I, II (marked by the yellow area), and III correspond to those shown in Figure 3.
For NCM111 (Figures 3a and 3b), a weight loss of ∼0.2% between 125 and 625°C is found for both "dry" and "wet" samples. The corresponding H2O and CO2 traces are more pronounced for the "wet" sample. Given the small BET surface area of ∼0.3 m2/g available for the formation of surface contaminants, the rather small weight loss is not surprising. It has to be noted that subtle differences in mass loss between the "dry" and the "wet" sample (<0.05%) may be masked by slightly varying baseline shifts of the microbalance.
A much stronger impact of the storage conditions on the amount of surface contaminants is seen for NCM811 (Figures 3c and 3d), where the weight loss of ∼0.1% between 125 and 525°C for the "dry" sample is increased to ∼0.7% through "wet" storage. Regarding the MS signals, this increase is mainly reflected by a higher CO2 trace, whereas the H2O signal remains mostly unaffected. Considering the essentially identical BET surface areas of NCM811 and NCM111 (see Table I), it is perhaps not surprising that the extent of surface contamination of the "dry" CAMs is comparable. However, NCM811 is clearly much more sensitive to "wet" storage, suggesting that the high Ni content of NCM811 seems to favor the formation of supposedly carbonate contaminants under moisture and CO2 containing atmosphere. The exact amounts of surface contaminants can only be calculated from the measured weight losses if the chemical composition of contaminants is known. Therefore, the nature of contaminants is further investigated in the next section by comparing the above observed decomposition temperatures and evolved gases with those of reference compounds.
Comparison of surface contaminants to lithium salt references
According to the CO2 and H2O fingerprint found for the NCM surface contaminants, we suggest that they consist of hydroxides, carbonates, bicarbonate species, and/or their hydrates. These species could be bound either to lithium, or to at least one of the transition metals (Ni, Mn, and/or Co).) Residual lithium from the cathode material synthesis is generally believed to be present in the form of Li2O on the CAM particle surface after calcination,17 since this is the thermodynamically stable high-temperature phase even under argon.9 Several research groups reported on the reaction of Li2O with moisture and CO2 to yield LiOH and Li2CO3 on the particle surface:17–19,23
![Equation ([1])](https://content.cld.iop.org/journals/1945-7111/166/12/A2322/revision1/d0001.gif)
![Equation ([2])](https://content.cld.iop.org/journals/1945-7111/166/12/A2322/revision1/d0002.gif)
Both reactions are equilibria, which are clearly driven to the right side as can be estimated from thermodynamic calculations. By using the standard free energy of formation values from the CRC handbook,41 one obtains Δf G⊖ ∼ −84,7 kJ/mol for the LiOH formation according to Equation 1 and Δf G⊖ ∼ −91,8 kJ/mol for the Li2CO3 formation according to Equation 2.
In order to reveal whether the observed surface contamination can be assigned soley to lithium compounds, the TGA-MS analyses of Li2O, LiOH, Li2CO3 as well as of Li2O stored under "wet" conditions are shown in Figure 4.
As originally demonstrated in our previous work,9 Figure 4a confirms that Li2O does not thermally decompose in the examined temperature range of 25–1125°C, except for a minor release of H2O at ∼400°C. This coincides with onset of H2O release upon the thermal decomposition of LiOH above ∼400°C (see Figure 4b), suggesting the presence of LiOH impurities in the Li2O reference sample. Figure 4c shows that Li2CO3 decomposes at temperatures higher than 725°C under the release of CO2. Thus, Li2O, LiOH, nor Li2CO3 can account for the mass signal patterns observed between 125 and 625°C for the "dry" and "wet" CAM samples, particularly not for the observed CO2 evolution (compare Figure 3). However, Figure 4c does confirm that the CO2 release above 625°C that is seen for all NCM samples can indeed be assigned to Li2CO3 residues. Unfortunately, this process cannot be quantified from the related mass loss, as it overlaps with the mass loss due to oxygen release from the NCMs (the MS signals from the TGA-MS are only semi-quantitative). It is interesting to note that for NCM811, the Li2CO3-related CO2 release concomitant with the O2 release at high temperature is substantially increased after "wet" storage, which is not observed for NCM111. This indicates that either more residual Li2O from the synthesis process is present on NCM811 than on NCM111, and/or that intercalated Li in the near-surface region of NCM811 is more prone to deintercalation and reaction with H2O and CO2. The possibility of Li2CO3 formation from residual Li2O on the surface is further strengthened by a reference TGA-MS measurement with Li2O that was stored for one week under "wet" conditions (Figure 4d): During storage, physisorbed H2O (evidenced by H2O evolution below 125°C) partly reacts with Li2O to form LiOH (identified by the H2O trace between 500 and 650°C) via Reaction 1. In addition, atmospheric CO2 can react with Li2O and/or previously formed LiOH (Reaction 2) to yield Li2CO3, the presence of which is evidenced by the CO2 signal between 650 and 1100°C. It is important to note, however, that there is no reaction of Li2O in ambient air that leads to compounds which exhibit a mass loss and MS signal patterns which match those observed during the thermal decomposition of NCM surface contaminants in the temperature range of 125–625°C (see Figure 3).
Therefore, it has to be concluded that lithium salts like LiOH or Li2CO3 cannot be the only surface contaminants on NCMs exposed to the ambient. It is important to point out that we do not negate the presence of LiOH and Li2CO3 on the surface of these NCM samples, and as a matter of fact Li2CO3 impurities are clearly detected in the TGA-MS measurements, as discussed above. However, there must be an additional type of surface contaminants originating from storage under H2O and CO2 containing atmosphere (e.g., ambient air) that gives rise to surface species that decompose under release of H2O and CO2 at temperatures as low as 125–625°C.
Comparison of surface contaminants to transition metal references
Since Li salts cannot be the origin of surface contaminants that yield the observed CO2 mass signals at 125–625°C, we will now consider other surface contaminants which might form upon the reaction of CO2 and H2O with NCM surfaces. In principle, dangling oxygen bonds at the Ni, Mn, and Co oxide surface could react to hydroxides and carbonates upon exposure of NCM with H2O and CO2:
![Equation ([3])](https://content.cld.iop.org/journals/1945-7111/166/12/A2322/revision1/d0003.gif)
![Equation ([4])](https://content.cld.iop.org/journals/1945-7111/166/12/A2322/revision1/d0004.gif)
To evaluate this hypothesis, we investigate the TGA-MS signatures of the stable hydrates of the carbonates of Mn, Co, and the stable hydrate of the mixed carbonate hydroxide of Ni. The results are shown in Figure 5.
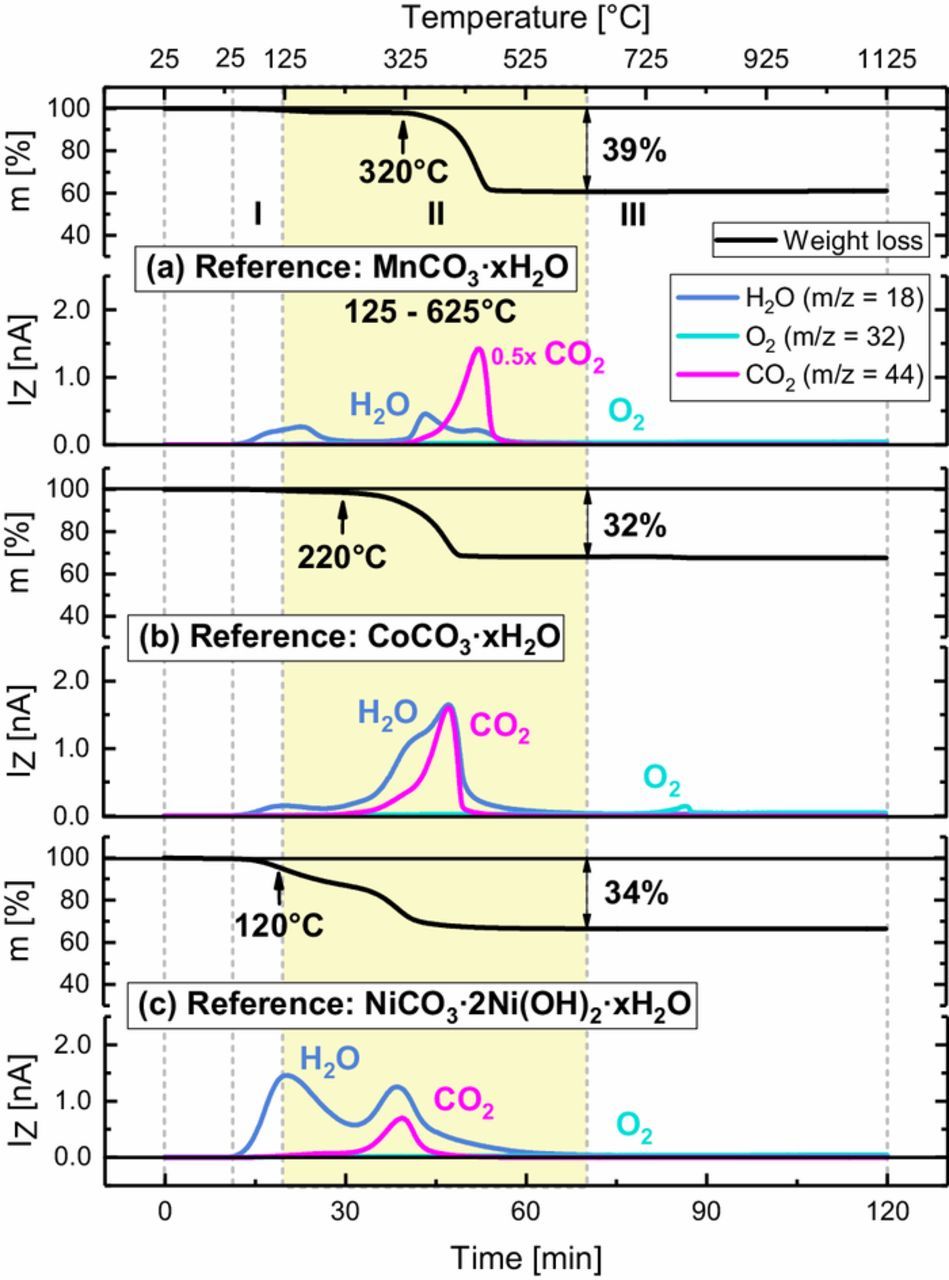
Figure 5. TGA-MS analysis of several transition metal based reference compounds: (a) MnCO3·xH2O; (b) CoCO3·xH2O; and, (c) NiCO3·2Ni(OH)2·xH2O (c). For each compound the characteristic mass loss (upper panel) and corresponding mass signals (lower panel) are shown for a 10 K/min temperature ramp from 25 to 1125°C under Ar flow. Regions I, II (marked by the yellow area), and III correspond to those shown in Figure 3.
Figure 5a shows the thermal decomposition of the first reference compound MnCO3·xH2O, yielding H2O and CO2 once the temperature is increased to beyond ∼320°C. While the simultaneous release of H2O and CO2 is also found as the characteristic fingerprint of the NCM surface contaminants (compare Figure 3), the decomposition onset temperature and the onset for CO2 evolution (∼320°C) of the MnCO3·xH2O is significantly higher than that between ∼125–200°C observed for the surface contaminants of the NCM materials, particularly of the "wet" stored materials. Consequently, hydrated manganese carbonates could be part of the contaminants, but not their only or principal component. The TGA-MS signature of the CoCO3·xH2O reference compound (see Figure 5b) is similar to that of MnCO3·xH2O, but has a lower onset temperature (∼220°C) for its decomposition and for CO2 evolution. While the Co compound could also be part of the NCM surface contaminants, its decomposition onset temperature is still too high to explain the onset of the weight loss and CO2 evolution for the "dry" and particularly the "wet" NCM materials at ∼125–200°C. Finally, the thermal decomposition of NiCO3·2Ni(OH)2·xH2O reference compound is depicted in Figure 5c. It features a weight loss onset at ∼120°C, accompanied by the release of H2O with two distinct peaks around ∼125 and ∼300°C as well as the onset of CO2 evolution at ∼250°C. This very much resembles the fingerprint observed for the "dry" and particularly the "wet" NCMs in Figure 3, which suggests that the nickel reference compound (or related nickel compounds, e.g., (NiCO3)2·(Ni(OH)2)3·4 H2O)12 is likely to represent a principal component of the NCM surface contaminants. This conclusion was also reached in a Raman spectroscopy study of surface contaminants on NCM811 stored for extended time at ambient air, which showed that simple transition metal carbonates and hydroxides were not part of the formed surface contaminants.12 It should be noted that nickel carbonate naturally occurs in its hydrated form42 or as a hydroxide,43 with the exception of Gaspéite,44 a very rare nickel carbonate mineral. The here examined nickel compound, referred to as basic nickel carbonate, was the only commercially available form of nickel carbonate we could find.
All in all, the thermal analysis of the transition metal carbonate(-hydroxide) hydrates suggests that the basic nickel carbonate NiCO3·2Ni(OH)2·xH2O is the major surface contaminant of NCMs stored under moisture and CO2 containing atmosphere. The reader should note that based on our TGA-MS analysis we cannot exclude the presence of other transition metal carbonates like MnCO3, CoCO3, and their hydrates, since the temperature ranges of thermal decomposition of these compounds overlap. However, the fact that the major weight loss already starts at ∼125°C together with the observation that Ni-rich NCMs are more prone to surface contamination (see Figure 3), clearly points in the direction of NiCO3·2Ni(OH)2·xH2O or related compounds. It should further be noted that on average Ni is in the oxidation state +II in pristine NCM111 and NCM811, while Co and Mn are on average in oxidation states of +III and +IV, respectively. Since the formation of transition metal carbonates and hydroxides requires the respective transition metal to be present in the oxidation state +II, it is likely that basic nickel carbonate NiCO3·2Ni(OH)2·xH2O is indeed formed preferentially.
It shall be mentioned that Ni-rich materials are known to be very basic, leading to a high pH of electrode slurries (pH > 11),17 leading to difficulties for electrode fabrication due to the gelation of the polyvinylidene fluoride (PVdF) binder in coating slurries.3,17 In light of the above findings, these issues can be linked to the high sensitivity of Ni-rich materials toward improper storage conditions. On a final note, the TGA-MS results suggest that a thermal treatment of surface contaminated NCM under inert gas conditions at 625°C (for NCM111) or 525°C (for NCM811) should allow for the removal of all transition metal based surface contaminants as well as of LiOH contaminants (contrary to Li2CO3 and Li2O surface impurities, which will remain intact at these temperatures) without degrading the NCM bulk structure or morphology (see BET results). Thus, the above-mentioned difficulties for electrode fabrication could be circumvented even for improperly stored Ni-rich NCMs by performing a heat-treatment under inert gas atmosphere prior to ink fabrication.
DRIFTS analysis of surface contaminants
Figure 6 shows a comparison of infrared spectra of "dry" (blue line), "wet" (green line), and "calcined" (navy line) NCM811 powder taken by ATR-FTIR (a), by transmission FTIR (b), and by DRIFTS (c). This analysis was exemplarily performed for NCM811, since it is most prone to surface contamination and therefore offers the highest intensity for IR active surface species. While ATR-FTIR and transmission FTIR spectra (see Figures 6a and 6b) show a very poor sensitivity for the detection of the definitely present Li2CO3 with the characteristic CO32− asymmetric stretching vibrations centered around 1470 cm−1 (marked by the accordingly labeled vertical dashed line in Figure 6) and out-of-plane vibrations at 850 cm−1,45–47 the DRIFTS signals (see Figures 6c and 6d) which are more intense for powder samples show clearly resolved carbonate bands at 1470 cm−1 and a broad shoulder corresponding to hydroxide or hydrate species (OH−/H2O) around 3450 cm−146 (see Figure 6c). In addition, residual sulfate traces from CAM manufacturing give rise to SO42− stretching vibrations at 1130 cm−1.48 The peaks at 2900 cm−1 are artefacts from the sample preparation using polyethylene49 weighing boats. A comparison of the DRIFTS data for the differently treated NCM811 samples (see Figures 6c and 6d), namely of the upward pointing CO32− bands at 1470 cm−1 and the OH−/H2O bands at 3450 cm−1, much more clearly reveals the impact of moisture and CO2 on the formation of surface contaminants (note that it is currently unclear why the OH−/H2O band points downward rather than upward). Both, the hydroxide/hydrate and especially the carbonate content increase upon "wet" storage (green line) and decrease again by the subsequent calcination of the "wet" material at 525°C (navy line). Note that it is not surprising that the "calcined" NCM811 sample still shows a carbonate band, because in contrast to transition metal carbonates, Li2CO3 cannot be removed by the 525°C heat-treatment (see TGA analysis in Figures 3 and 4). While DRIFTS does not allow us to discriminate between different metal centers of the surface hydroxides and carbonates, the CO32− and OH−/H2O vibrations are in agreement with the main contaminant revealed by TGA-MS, viz., basic nickel carbonate NiCO3·2Ni(OH)2·xH2O.
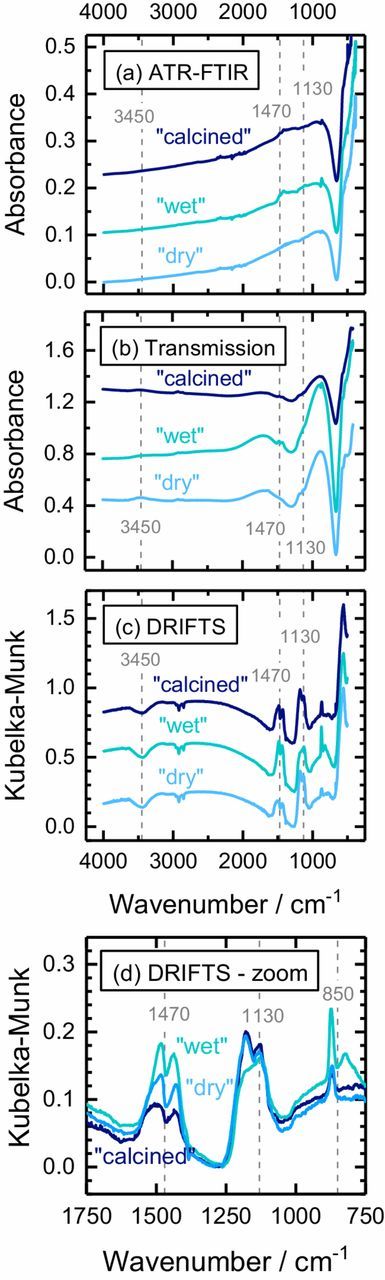
Figure 6. Infrared spectroscopic analyses of "dry" (blue lines), "wet" (green lines), and "calcined" (at 525°C under Argon, navy line) NCM811 by: (a) ATR-FTIR (undiluted NCM811) – arbitrary offset; (b) transmission FTIR (1 wt% NCM811 in KBr powder) – arbitrary offset; and, (c) DRIFTS (1 wt% NCM811 in KBr powder) – these spectra which are displayed in Kubelka-Munk units have been normalized to range between 0 and 1. The bands marked at 1130 cm−1 correspond to SO42−, those at 850 and 1470 cm−1 correspond to CO32−, and those at 3450 cm−1 correspond to OH−/H2O. (d) Enlarged view of the data in panel (c) without any arbitrary offset.
Effect of surface contaminants on electrolyte stability
Having identified the nature and the amount of surface contaminants on NCM materials, we now want to investigate their impact on the stability of an ethylene carbonate (EC) based electrolyte at elevated temperature. The following experiment is based on our previous study,30 where we demonstrated that catalytically active hydroxide ions (OH−) in the presence of trace amounts of H2O can lead to a rapid decomposition of ethylene carbonate (EC) at temperatures relevant for lithium-ion battery operation. The decomposition of EC is induced by a nucleophilic attack of OH− and a subsequent ring opening reaction of EC under abstraction of CO2. Concluding this past study, we had already speculated that a similar reaction can be triggered by basic surface contaminants (even though we had not yet had evidence for NiCO3·2Ni(OH)2·xH2O surface species). This reaction would not only lead to the decomposition of EC-based electrolyte and accumulation of CO2 gas in the battery cell, but likely also to a deterioration of battery performance from further reactions of the decomposition products (see Discussion Section for a detailed explanation of the electrolyte breakdown).
In order to test this hypothesis, 1.03 g of "wet", "dry", and "calcined" NCM811 are mixed with 240 μl of 1.5 M LiClO4 in EC, resulting in a realistic electrolyte to CAM ratio of 0.35:1,36 and the gas evolution from this mix is recorded by on-line mass spectrometry (OMS) during a 12 h dwell at a constant temperature of 60°C. The upper panel of Figure 7 depicts the temperature set point (black line) and the cell temperature (red line) vs. time for these OMS measurements.
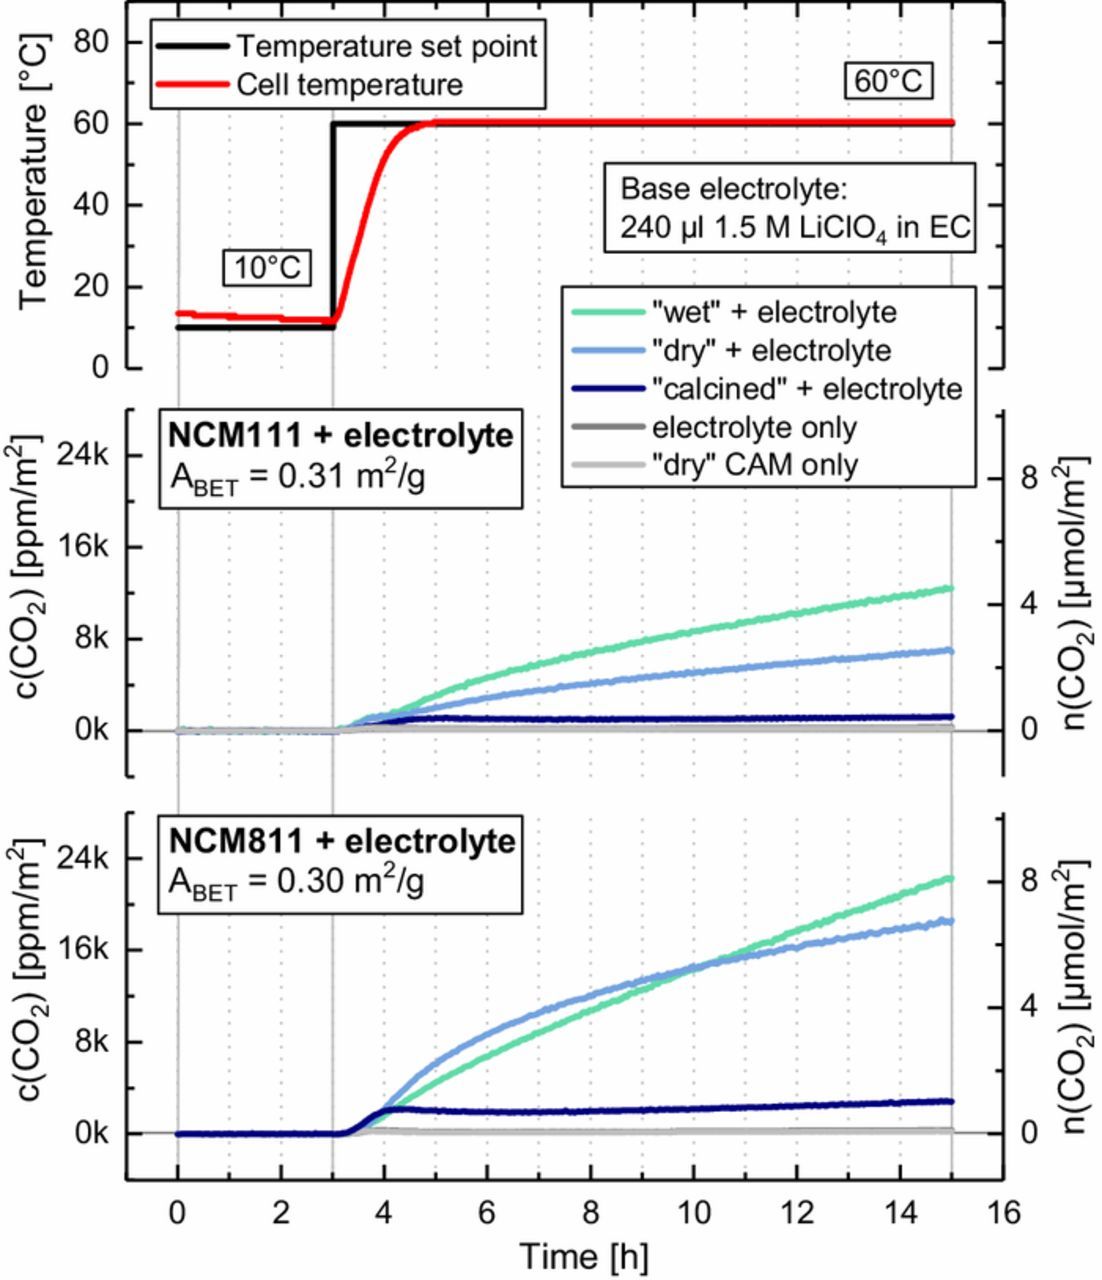
Figure 7. On-line mass spectroscopic analysis of the gas formation vs. time upon 60°C heating of mixtures of 1.5 M LiClO4 in EC (240 μl, <20 ppm H2O) with differently treated NCMs (1.03 g): "wet" (green line), "dry" (blue line) and "calcined" (navy line); background signals for pure electrolyte (dark gray) and "dry" CAM (light gray) are given for reference. The upper panel shows the temperature set point (black line) and the measured cell temperature (red line). The middle and lower panel show the corresponding evolution of the CO2 for NCM111 and NCM811, respectively, given either in terms of the CO2 concentration in the cell head space normalized to the BET surface area (see Table I) in [ppm/m2] (left y-axis) or in terms of total evolved amount in [μmol/m2] (right y-axis).
The middle panel of Figure 7 shows the CO2 evolution for the applied temperature profile for NCM111 mixed with the EC-containing electrolyte, given in surface area normalized units of [ppm/m2] (left y-axis) and [μmol/m2] (right y-axis, see Table I for BET surface areas). As in our previous study,30 CO2 is the only gas detected by OEMS, suggesting that indeed the hydrolysis of EC is the origin of the gassing. More electrophilic additives such as FEC or VC would probably react much faster with the nucleophilic OH groups on the CAM surface and thus decompose at much faster rate. The strongest CO2 evolution is detected for the "wet" NCM111 sample (green line), yielding ∼4 μmol/m2 at the end of the experiment. About half of this amount of CO2 (∼2 μmol/m2) is detected for the "dry" NCM111 sample (blue line). Interestingly, the "calcined" material (navy line) shows almost no gas evolution at all, apart from an initial increase to ∼0.3 μmol/m2 after which no further CO2 evolution is observed. This comparison indicates a clear correlation between the extent of surface contamination and the extent of gassing caused by chemical electrolyte decomposition at elevated temperature.
For the Ni-rich NCM811, the gassing for the material in "wet" and "dry" condition (green and blue line in the middle panel of Figure 7) is twice as high as for NCM111 even in "wet" condition. The reason for the rather similar CO2 evolution from "dry" and "wet" NCM811 is unclear at this point, but given the difference in CO2 formation rate (slope of the green and blue line in lower panel of Figure 7), the 15 h measurement time was just not sufficient to reflect to high sensitivity of NCM811 to ambient air exposure during material packaging/handling (see Discussion Section for a quantitative assessment of this fact). Again, upon heat-treatment, surface contaminants are removed and the reactivity with the EC-based electrolyte is reduced by an order of magnitude (navy line). The substantial increase in the extent of CO2 evolution with the Ni content of the NCM is a further strong indication that basic nickel carbonate NiCO3·2Ni(OH)2·xH2O is the critical surface contaminant on NCMs, as suggested by the TGA-MS patterns (compare Figure 3d and Figure 5c). Consequently, due care has to be taken for the storage and handling of Ni-rich cathode materials, e.g., Ni-rich NCMs and NCAs, which are considered to be among the most promising candidates for future battery electric vehicle applications.1,4,5
In summary, the findings in Figure 7 prove that a heat-treatment of NCMs exposed to atmospheric moisture and CO2 can effectively remove the transition metal based surface contaminants and thereby prevent their strong effect on the decomposition of EC-based electrolyte. This finding is in excellent agreement with the TGA-MS analysis presented above, which already suggested that a heat-treatment at 625°C for NCM111 and at 525°C for NCM811 should be sufficient to remove all surface contaminants except for Li2CO3 and Li2O (see Figure 4). Note that the first CO2 release for the NCM samples in Figure 3 ceases at 625°C, indicating that all transition metal reference compounds are transformed into their stable oxide phases at that temperature (see Figure 5). Interestingly, the OMS data for NCM111 (middle panel in Figure 7) and even more though for NCM811 (lower panel in Figure 7) suggest that the "dry" NCMs already contain significant amounts of surface contaminants that can lead to considerable CO2 evolution by EC decomposition. Again, this is in agreement with our TGA-MS analysis, since the "dry" NCMs already show noticeable weight losses (see Figures 3a and 3c) and the applied drying step at 120°C is clearly not sufficient to remove these surface contaminants. The latter is especially significant with regard to the fabrication of electrodes, which can usually not be dried at temperatures higher than 120°C due to the limited thermal stability of the PVdF binder. In consequence, nominally "dry" NCMs still contain surface contaminants that might lead to EC decomposition, CO2 gassing, and inferior cell performance at elevated temperature.
Lastly, we would like to point out that residual Li2O and Li2CO3 can definitely be excluded as the type of surface contaminants that lead to CO2 evolution by a reaction with EC-containing electrolyte, since neither Li2O nor Li2CO3 are removed by a heat-treatment at 625°C (compare Figures 4a and 4c),9 and yet the heat treated samples show only a minimal CO2 evolution (see Figure 7). As a matter of fact, the reactivity of Li2CO3 contaminants on the cathode and its implications for cell performance are currently being debated controversely in the literature: while Renfrew et al.11 suggest that Li2CO3 will be electrooxidized in the first cycles, Jung et al.12 suggest that the decomposition of Li2CO3 is soley due to its reaction with protic species (Li2CO3 + 2 H+ → 2 Li+ + H2O + CO2) which are produced upon electrolyte oxidation at high potentials50 and/or by side reactions related to the oxygen release from NCMs at high SOC.51 If the latter hypothesis were true, Li2CO3 impurities alone should only contribute to CO2 gassing, which would have a minor effect on battery cycle life if the Li2CO3 levels are sufficiently low (particularly in Swagelok T-cell or coin cell tests, where gassing induced cell bulging is less problematic). For completeness, it shall not be omitted that the base electrolyte alone (1.5 M LiClO4 in EC, <20 ppm H2O) shows a negligible amount of CO2 evolution (dark gray line) coming from the thermal decomposition of EC at 60°C.30
Contaminant removal and critical exposure time
A final TGA-MS experiment shall elucidate how different exposure times to ambient air influence the formation of surface contaminants on NCMs. Figure 8 shows a four-step TGA-MS measurement in which a single sample is subjected to four consecutive temperature ramps from 25 to 525°C. A NCM811 sample is chosen for this procedure because of its relatively high weight loss in the temperature range associated with surface contaminants compared to NCM111, which allows the more precise signal quantification.
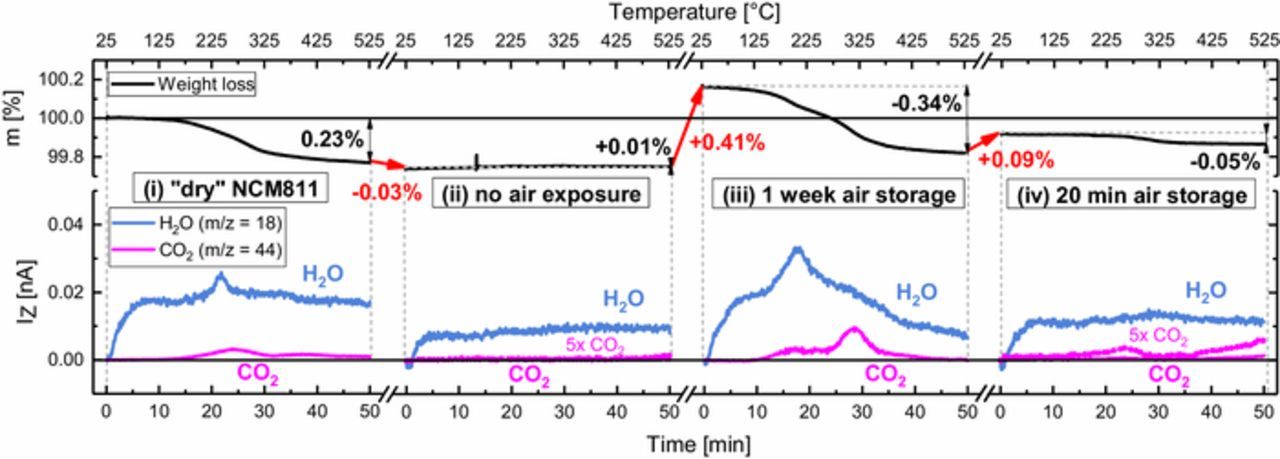
Figure 8. Four step TGA-MS measurement of one NCM811 sample showing the characteristic mass losses (upper panel) and corresponding mass signals (lower panel) during four consecutive temperature ramps from 25 to 525°C at a heating rate of 10 K/min in Ar flow. From left to right panel: (i) The sample in "dry" condition is heated to 525°C, followed by cooling to 25°C under Ar inside the closed instrument. (ii) It is then immediately heated again without interim air exposure, thus mimicking a "calcined" sample. (iii) After cooldown, the sample is removed from the instrument and stored for one week at ambient air and then heated again, thus representing a rough analogue to a sample in "wet" condition. (iv) After cooldown to 25°C, the sample is stored for only 20 min at ambient air and heated again, representing a CAM exposed to ambient air for the duration typical for battery material processing in most laboratories; a 5-fold magnification of the CO2 signal (pink dotted line) shows CO2 evolution between 200–300°C, contrary to the sample without air exposure in panel (ii).
Starting with "dry" NCM811 (panel (i) of Figure 7), the CO2 and H2O mass traces in the temperature window from 25 to 525°C shown Figure 3c are reproduced, however with a concomitant weight loss of 0.23% instead of 0.09%, which can be rationalized by different transfer times of the TGA sample on air. It has to be noted that according to our foregoing analysis of samples calcined at 525°C, the structural integrity of NCM811 is fully preserved during this procedure. During the subsequent cooldown to room temperature, the sample is kept within the closed TGA-MS instrument and not exposed to ambient air. It is then directly heated again to 525°C, mimicking a material that has been calcined and stored under Ar. As seen in panel (ii) of Figure 7, a negligible weight increase of 0.01% (red arrow) is monitored during cooldown between the two experiments, and this amount is lost again during the 2nd ramp at temperatures below 125°C under release of H2O. In addition, in the corresponding mass spectrum there is virtually zero CO2 desorption detected (dotted line in panel (ii) displays m/z = 4 4 multiplied by five). This is attributed to marginal air leakage into the closed TGA-MS, leading to the physisorption of minor amounts of H2O on the NCM811 surface during cooldown. This again confirms that all surface contaminants are successfully removed during a heat-treatment in Ar at 525°C, which was conducted in the first step.
After the cooldown following this second temperature ramp, the sample is stored for one week at ambient air (relative humidity 35 ± 5%), which results in a weight gain of 0.41% (red arrow between panels (ii) and (iii)) due to the renewed buildup of surface contamination on the NCM811 particles. In the subsequent third temperature ramp (panel (iii)), about the same amount is removed again, and the CO2 and H2O mass signal fingerprints resemble those of the "wet" NCM811 (see Figure 3d). This indicates that one week of open storage under ambient air conditions is as detrimental to the NCM811 material as our "wet" storage conditions (see Figure 2), which we had chosen deliberately to mimick extended air exposure. However, even after such a prolonged storage at ambient air, the complete removal of surface contaminants by heating up to 525°C under inert gas is feasible. In the final experiment, the "calcined" NCM811 sample obtained after the experiment shown in panel (iii) is exposed to ambient air for 20 min, which is sufficient to cause a weight-gain of 0.09% (red arrow between panels (iii) and (iv)). A subsequent fourth temperature ramp to 525°C shows a corresponding mass loss and also a weak CO2 desorption signal (dotted red line in panel (iv)) which indicates the presence of transition metal based surface contaminants. This demonstrates that a time period that can be regarded as the minimum exposure of a CAM during electrode fabrication in most laboratories is already sufficient to build up noticeable amounts of surface contaminants on the pristine (i.e., "calcined") CAM surface. In that case, the contamination level is roughly comparable to that of the as-received ("dry") material.
Cycle life of NCM811//Graphite cells with differently conditioned NCM811
After identifying and quantifying the surface contaminants on differently conditioned NCMs, and after demonstrating that a heat-treatment under inert gas can remove transition metal based surface contaminants, we now want to examine the impact of these contaminants on battery cell performance. For that purpose, NCM811//graphite Swagelok T-cells with 60 μl of electrolyte (LP572, BASF) are cycled with 1C between 3.0-4.2 V at an elevated temperature of 45°C, where degradation phenomena are typically more pronounced due to faster kinetics of the parasitic reactions. Figure 9a shows that the capacity retention over 250 cycles at 1C is very poor for cells with "wet" NCM811 (55%; green symbols), far inferior to those with "dry" NCM811 (85%; blue symbols). Cells with "calcined" NCM811 (navy symbols) always show the highest capacity and have the best capacity retention (92%), indicating that (i) transition metal based surface contaminants do have a detrimental effect on capacity retention, and (ii) that this effect increases with the amount of surface contaminants. After 250 cycles, there is a difference in specific discharge capacity of 16 mAh/gNCM811 between cells with "calcined" (176 mAh/gNCM811) and "dry" NCM811 (160 mAh/gNCM811), and another 66 mAh/gNCM811 between cells with "dry" and "wet" NCM811 (94 mAh/gNCM811).
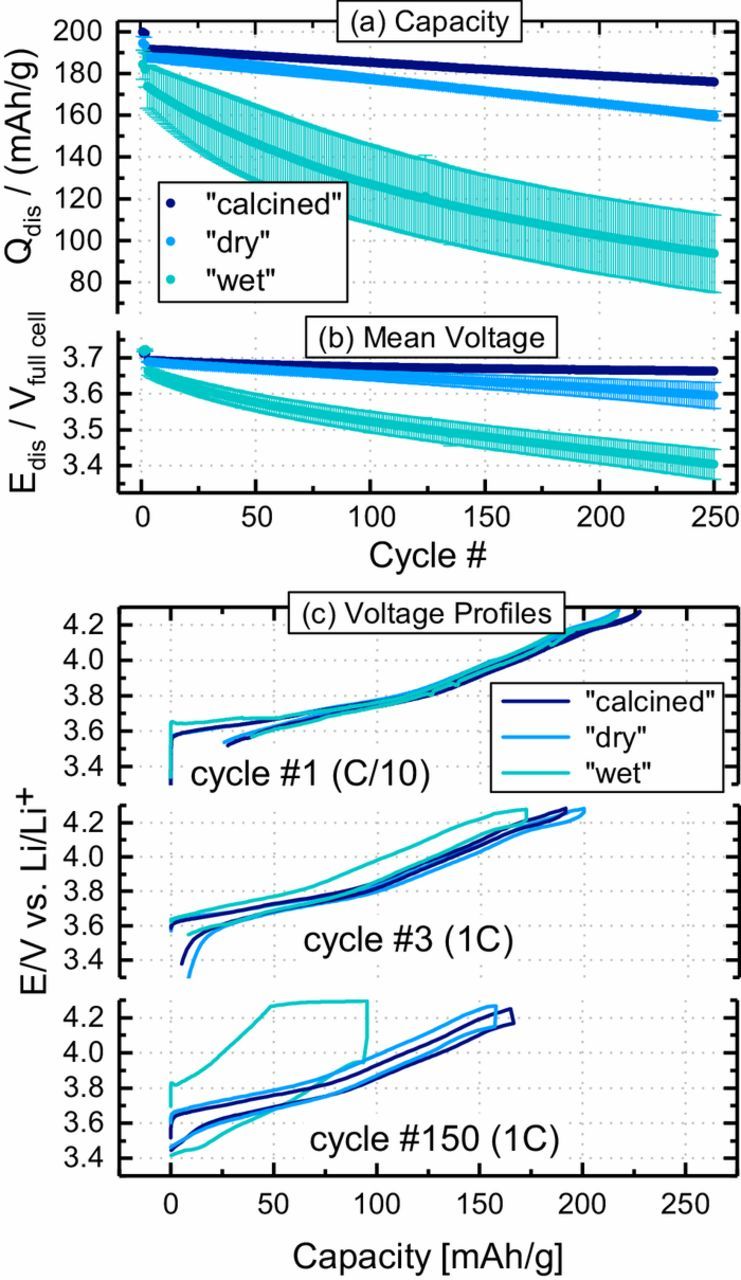
Figure 9. Charge/discharge cycling of NCM811//graphite Swagelok T-cells prepared with "dry" (blue), "wet" (green), and "calcined" (navy) NCM811, conducted between 3.0–4.2 V with 60 μl LP572 electrolyte at 45°C: (a) specific discharge capacity (left y-axis, solid spheres); (b) mean discharge cell voltage in each cycle (defined as  discharge = ∫ Vdischarge · dqdischarge / qdischarge); and, (c) the cathode voltage profiles vs. the lithium reference electrode for the first cycle at C/10 and the 3rd as well as the 150th cycle at 1C. The first two cycles were conducted at C/10, followed by cycling at 1C (CC-CV charge and CC discharge); error bars represent standard deviation of two cells.
In order to gain a better understanding of the capacity fading in cells with "wet" NCM811, it is instructive to analyze the charge-averaged mean discharge voltage (see Figure 9b), a measure for the impedance buildup in lithium-ion cells. It can be obtained for every cycle by integrating the cell voltage over the discharge capacity and dividing the integral by the total discharge capacity ( discharge = ∫ Vdischarge · dqdischarge/qdischarge).52 A low mean discharge cell voltage, especially at high rates, is indicative of a high impedance for Li+-ion extraction from the anode material and/or Li+-ion insertion into the cathode material. Figure 9b clearly shows that the mean discharge cell voltage after 250 cycles of cells with "wet" NCM811 is ∼190 mV lower than that of cells with "dry" NCM811, which in turn is ∼70 mV lower than that for cells with "calcined" NCM811 (i.e., with "wet" NCM811 after heat-treatment under inert gas at 525°C). This demonstrates that the cell impedance growth gets much more pronounced with increasing amounts of cathode surface contaminants. Thus, it can be summarized that the deliberate contamination of NCMs by "wet" storage causes a large impedance growth over cycling that leads to higher capacity fading, but that this effect can be mitigated by a subsequent heat-treatment under inert gas at 525°C. A similar effect of heat-treatment was observed for cells with NCA (LiNi0.8Co0.15Al0.05O2) stored at ambient air, showing that those cells have a large capacity fading which can be substantially reduced when annealing the ambient air exposed NCA under air at 500°C.24
The high overpotentials associated with an increase of internal resistance over cycling can cause the cells to reach their voltage cutoff while a considerable fraction of the cyclable lithium is still contained in the anode or cathode material. In order to elucidate whether the charge or the discharge process is more affected by increased impedance of the differently pre-trated CAMs rather than by a loss of cyclable lithium, Figure 9c displays the cathode voltage profiles versus the lithium reference for cycle #1 at C/10, for cycle #33 (1C), and for cycle #150 (1C). Figure 9c suggests that the storage condition has no influence on the cell polarization during the initial charge and discharge cycles of the different NCM811 samples, as the voltage profiles of the cells containing "wet" (green), "dry" (blue), and "calcined" material (navy) show only subtle differences for cycle #1 at 0.1C and only small differences for cycle #3 at 1C. In cycle #1, polarization of the "wet" cells is evident from the slightly increased polarization around 3.6 V. The "wet" storage, i.e., exposure to water vapor, might lead to the formation of a resistive surface layer similar as in case of washing with water,53,54 which would lead to a reduced Li+ conductivity of the surface-near regions in the oxide particle. The slow C-rate, however, masks most of the polarization effects due to surface contaminants. Over prolonged cycling, the charge and discharge voltage profiles gradually drift apart, as can be seen exemplarily in Figure 9c for cycle #150, indicating increased overpotentials, as expected from the above analysis of the mean discharge cell voltage (compare Figure 9b). This is consistent with the fact that the overpotentials are much more pronounced for the cells containing "wet" NCM811 (see green lines in Figure 9c vs. blue and navy lines). Interestingly, the increased cell polarization is drastically limiting the capacity especially during charge, as the cell voltage is pushed toward the upper cutoff voltage. This polarization induced failure of the cells is different from failure mechanisms that are accompanied by low coulombic efficiency, e.g., the loss of cyclable lithium.55,56 A mechanistic explanation for the large polarization of cells containing "wet" NCM811 is attempted at the end of the Discussion Section.
Discussion
In the study at hand, we have combined a variety of characterization techniques such as TGA-MS, OMS, DRIFTS, and electrochemical cycling to understand the nature and the origin of surface contaminants on NCM811 compared to NCM111. To further connect the findings from the individual techniques as well as to underline the relevance of surface contamination in industrial cell manufacturing, the following section presents (i) an estimation of the amount of surface contaminants based on the TGA-MS analysis, (ii) kinetic considerations regarding electrolyte breakdown by EC hydrolysis based on the gassing detected by OMS, (iii) a projection of the findings of TGA-MS and OMS on commercial battery cells, and (iv) concluding remarks of the impact of storage conditions on the cycling behavior of full cells.
Estimation of the amount of surface contaminants
We have shown that Ni-rich materials are especially susceptible to surface contamination due to storage and handling in ambient air and that basic nickel carbonate NiCO3·2Ni(OH)2·xH2O (or varying compositions thereof)30 rather than LiOH or Li2CO3 accounts for the high reactivity of contaminated samples with an EC-based electrolyte demonstrated by the OMS data in Figure 7. In the following, we want to estimate the amount of surface contaminants for "wet" NCM811 based on the 8.2 μmol/m2 of evolved CO2 (see lower panel of Figure 7), equating to a total amount of ∼2.5 μmol of CO2 based on the NCM811 BET area and the amount of NCM in the cell (i.e., from 8.2 μmol/m2 × 0.30 m2/gNCM × 1.03 gNCM) or to ∼2.4 μmol/gNCM. Comparing this to the total moles of EC in the electrolyte of 3680 μmol obtained from the electrolyte's density, the used volume, the EC mass fraction and its molecular weight (i.e., from 1.5 g/cm3 × 240 μl × 0.9 × (88 g/mol)−1),) one can conclude that only ∼0.07% of the EC that is present in the OMS cell is converted to CO2 during the entire OMS experiment. Consequently, the reaction is not limited by the amount of EC available for reaction with the CAM surface.
Next we will examine whether the amount of the proposed critical surface contaminant on "wet" NCM811, viz., the basic nickel carbonate NiCO3·2Ni(OH)2·xH2O which decomposes between 120–525°C (see Figure 5c) would be sufficient to produce the observed amount of CO2 in the OMS experiment (lower panel of Figure 7). However, to do so one first needs to determine the decomposition reaction and the water content (x) of NiCO3·2Ni(OH)2·xH2O. Based on the TGA-MS analysis, NiCO3·2Ni(OH)2·xH2Odecomposes between 120–525°C with a weight loss of 34%, accompanied by the release of H2O and CO2, and without further changes up to 1125°C (see Figure 5c). As the thermodynamically stable high-temperature decomposition products should be NiO, CO2, and H2O, the following decomposition reaction is expected:
![Equation ([5])](https://content.cld.iop.org/journals/1945-7111/166/12/A2322/revision1/d0005.gif)
For this reaction, the relative weight loss Δm upon decomposition can be determined from the molecular weight of NiCO3·2Ni(OH)2·xH2O (Mbasic-Ni = (304 + x × 18) g/mol) and that of the only remaining solid compound NiO (MNiO = 74.7 g/mol):
![Equation ([6])](https://content.cld.iop.org/journals/1945-7111/166/12/A2322/revision1/d0006.gif)
While the water content of the basic nickel carbonate was not specified, the plausible value of two H2O molecules per formula unit (i.e., x = 2) results in a value of Δm of 34.1%, which is in perfect agreement with the TGA-MS data in Figure 5c. Thus, our basic nickel carbonate model reference compound is NiCO3·2Ni(OH)2·2H2O with Mbasic-Ni = 340 g/mol.
Assuming that the mass loss of "wet" NCM811 of 0.74% between 120–525°C (see Figure 3d) would be entirely due to the thermal decomposition of NiCO3·2Ni(OH)2·2H2O, its amount on the "wet" NCM811 would equate to ∼2.2 wt% (from 0.74% divided by the mass loss Δm upon the thermal decomposition of NiCO3·2Ni(OH)2·2H2O; see Figure 5c). Although we are aware that it is a crude simplification to neglect potential contributions of Mn- and Co-based surface contaminants which also decompose below 525°C, their similar mass losses (39% and 32%, see Figure 5) would not significantly change the calculated surface contaminant weight fraction; furthermore, based on the above analysis, the fraction of Mn- and Co-based surface contaminants is expected to be minor compared to that of basic nickel carbonate. Considering that the thermal decomposition of EC even at 60°C is most strongly promoted by OH− compared to H2O31 we now determine the molar amount of OH− contained in the proposed NiCO3·2Ni(OH)2·2H2O surface contaminant on "wet" NCM811: based on the above estimates of its mass fraction (∼2.2 wt%), its molecular weight (Mbasic-Ni = 340 g/mol), and the fact that it contains 4 moles of OH− per formula unit, this equates to ∼260 μmolOH-/gNCM. Consequently, the amount of CO2 evolved over 8 hours at 60°C (∼2.4 μmol/gNCM, see above) corresponds to only ∼1% of the EC that could potentially be decomposed to ethylene glycolate when using up all of the bound OH− ions (from the previously reported reaction EC + OH- → EG− + CO2).30 This analysis suggests that neither the amount of EC nor the amount the NiCO3·2Ni(OH)2·2H2O surface contaminant are limiting the overall CO2 evolution in the OMS experiment with "wet" NCM811 (lower panel of Figure 7). This is consistent with the observation that the CO2 evolution rate (i.e., the slope of CO2 concentration vs. time) with "wet" NCM811 stabilizes at a constant value for a given sample after several hours at 60°C, indicating that the kinetics of the reaction is controlling the CO2 evolution rate.
Kinetic analysis of EC decomposition
Next we want to analyze the kinetics of the EC decomposition and discuss the implications for swelling of pouch cells. Figure 10 summarizes the CO2 evolution rates from the reaction of the NCM samples with the EC-based electrolyte obtained from linear regression of the CO2 evolution curves in Figure 6 during the last 3 h of the experiment (note that the rate of CO2 evolution rates do not change much anymore at this point of the experiment). The CO2 evolution rates are given in [molCO2/(s·gEC)], which are normalized units with respect to the amount of EC in the cell for better comparability to gassing in other battery cells. It should be noted that these data are not normalized to the rather similar BET surface areas of NCM811 and NCM111 (roughly 0.3 m²/g for the pristine materials, see Table I), as was done in Figure 7.
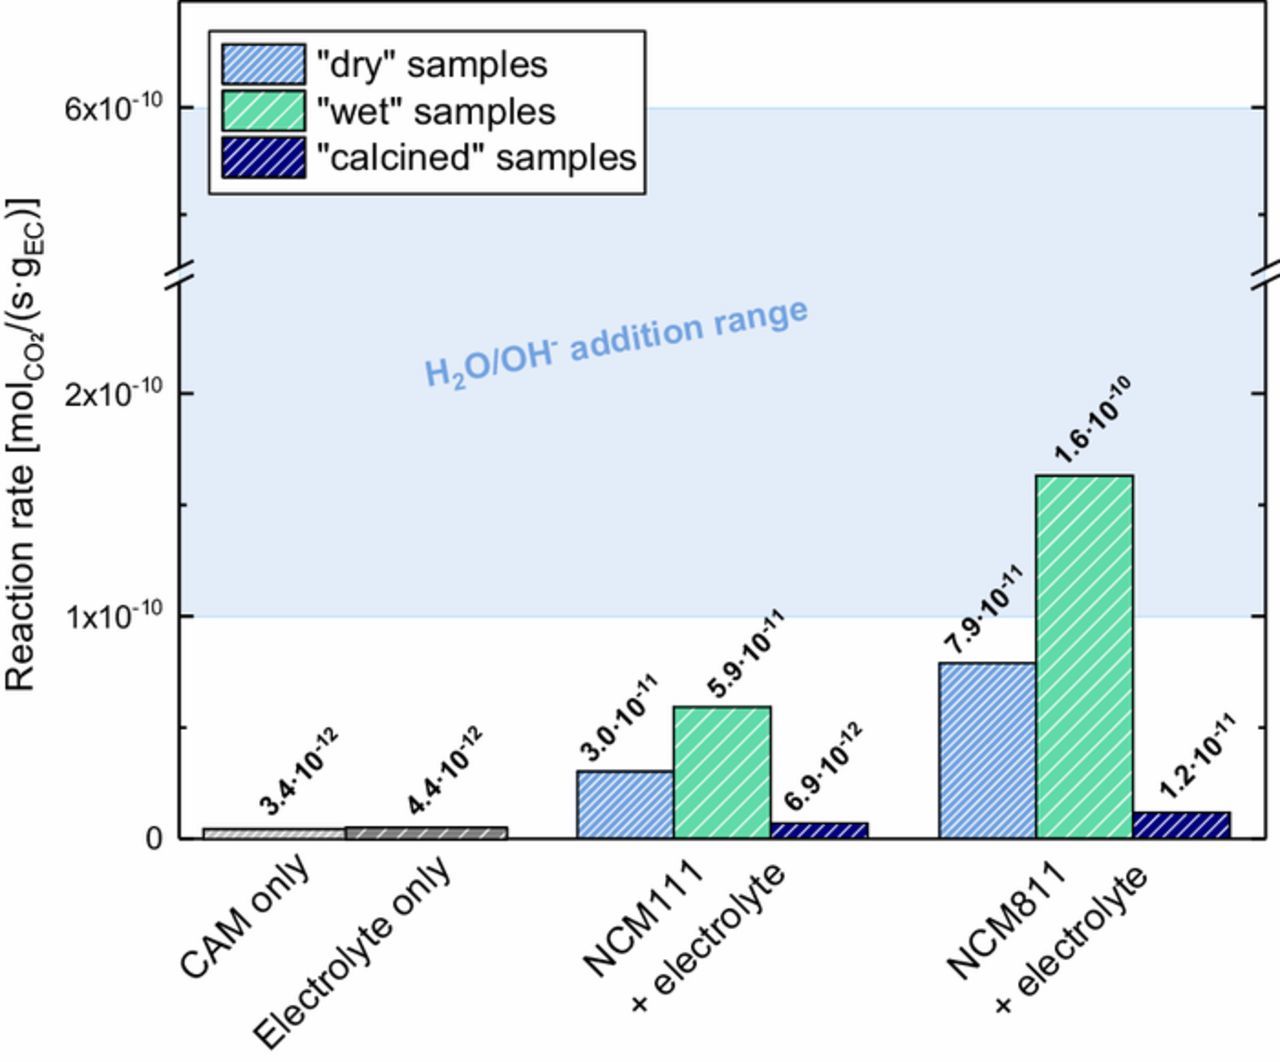
Figure 10. CO2 evolution rates at 60°C (normalized to the mass of EC) as a measure for the EC decomposition rate, determined from a mixture of electrolyte (240 μl of 1.5 M LiClO4 in EC) and "wet" (green), "dry" (blue), and "calcined" (navy) NCMs (1.03 g).) The data was extracted from the CO2 evolution curves in Figure 7 by linear regression during the last 3 h of the 60°C temperature hold; the here used electrolyte/CAM mass ratio of 0.35/1 reflects that in commercial battery cells. The blue area represents the range of EC decomposition rates that were determined in our previous work,30 where we directly added H2O and OH− to the same EC-based electrolyte, at H2O and OH− concentrations between ∼11–280 μmol/gelectrolyte with ∼0.4–10 μmol/gelectrolyte, respectively.
For both NCM111 and NCM811 samples, a clear trend in CO2 evolution rate is visible: (i) the "wet" samples with the highest amount of surface contamination (see Figures 3b and 3d) show the highest CO2 evolution rates; (ii) the "dry" samples which are not free of surface contaminants (see Figures 3a and 3c) show considerable CO2 evolution rates as well and, (iii) the "calcined" samples show a quasi-zero CO2 evolution rate, indicating that the complete removal of reactive surface species effectively prevents the decomposition of EC. The background measurements with only 240 μl of 1.5 M LiClO4 in EC in the cell or with only CAM powders also show a quasi-zero CO2 evolution rate of <5·10−12 molCO2/(s·gEC) when compared to the rates for "wet" and "dry" samples. which are one to almost two orders of magnitude higher.
The rate of gas generation from reactions with surface groups on the cathode materials would likely follow a rate equation like r ∝ mEC·ANCM, where mEC is the total mass of EC in the cell and ANCM is the total surface area of NCM cathode active material in the cell. The amount of EC would be rate limiting, since we chose an electrolyte/CAM mass ratio of 0.35/1, which reflects the ratio used in commercial battery cells. Similarly, the amount of surface groups, which clearly scales with the available surface area, is also a limiting factor.
An interesting observation is that the EC decomposition rates for "wet" and "dry" samples are remarkably close to the rates obtained for the addition of H2O and OH− to the same EC-based electrolyte from our previous work:30 at 60°C, different concentrations of H2O and OH− ranging from 200–5000 ppm H2O with 7–167 ppm OH− (introduced as TBAOH·30H2O) led to CO2 evolution rates between ∼1-−10 molCO2/(s·gEC) (see blue marked area in Figure 10). As our previous study OH− was shown to most strongly promote EC decomposition, it is interesting to compare the OH- concentrations achieved by the addition of TBAOH·30H2O (a strong base, homogeneously distributed in the electrolyte) with the estimated amount of OH− introduced by the NCM surface contaminants. The above given H2O and OH− concentrations in our previous study equate to ∼11–280 μmolH2O/gelectrolyte with ∼0.4–10 μmolOH-/gelectrolyte, respectively. This may be compared to the H2O and OH− concentrations introduced by the hypothesized NiCO3·2Ni(OH)2·2H2O surface contaminant on "wet" NCM811, which we had estimated above (∼130 μmolH2O/gNCM and ∼260 μmolOH-/gNCM), which based on the electrolyte/NCM mass ratio of 0.35/1 equates to substantially larger concentrations of ∼370 μmolH2O/gelectrolyte and ∼740 μmolOH-/gelectrolyte (here we have neglected the possible additional presence of LiOH on the NCM surface). Thus, while we believe that the OH− catalyzed EC hydrolysis reaction proceeds by the same reaction mechanism (viz., a nucleophilic attack of EC by OH− with subsequent ring opening and CO2),30 independent of whether H2O/OH− or basic nickel carbonate surface contaminants are in contact with the electrolyte, the effectiveness of homogenously dispersed H2O/OH− to promote the EC decomposition is obviously higher than that of surface bound H2O/OH−, as illustrated here by the similar decomposition EC decomposition rate with "wet" NCM811 despite the a much higher nominal H2O and OH− concentration. Nevertheless, the following estimates will demonstrate that the surface contamination triggered EC decomposition rates are quite significant for commercial-size battery cells.
Implications for the storage of battery cells at elevated temperature
The reactivity of NCM surface contaminants with alkyl carbonate electrolyte (demonstrated in Figures 7, 9, and 10) can have a pivotal influence on the storage life of lithium-ion batteries at elevated temperature. To illustrate the extent of CO2 gassing that is to be expected during storage at 60°C, one may calculate the amount of CO2 which would be produced over 100 h (a typical time for storage experiments) in a 3 Ah battery using the reaction rates given in Figure 10. Note that this estimate would apply for a battery in its discharged state, for which gassing and the associated cell bulging is typically lower than in the charged state. Figure 11 gives an overview of the model calculations, which are described in more detail in the following. A 3 Ah battery would contain ∼20 g cathode active material (based on an NCM capacity of ∼150 mAh/g) and ∼7 g of electrolyte (based on ∼0.35 gelectrolyte/gCAM),37 which for a typical electrolyte formulation (e.g., the here used LP572 electrolyte with ∼13 wt% LiPF6, ∼25 wt% EC, ∼60 wt% EMC and ∼2 wt% VC) would correspond to ∼1.75 g EC in the cell. For this cell configuration, the CO2 evolution rate of 5.9·10−11 molCO2/(s·gEC) for "wet" NCM111 shown in Figure 10 would translate into a consumption of ∼0.2% of the EC accompanied by the formation of ∼0.9 cm3 CO2 (referenced to standard conditions of 25°C and 1 bar) over 100 h storage at 60°C. For the gas evolution rate of "wet" NCM811, that number would be ∼2.4 cm3 CO2 (note that for this, only ∼2% of the OH− groups stored in the NiCO3·2Ni(OH)2·2H2O surface contaminant on the "wet" NCM811 would be required). Since compared to our OMS experiment, the EC content of the commercial LP572 electrolyte is three times smaller, the CAM:EC ratio is three times higher which most probably leads to an even higher CO2 evolution. As any gas formation above 1–5 cm3 would likely be considered significant for a 3 Ah pouch bag cell,57 a detrimental effect on cell-life would be expected.58
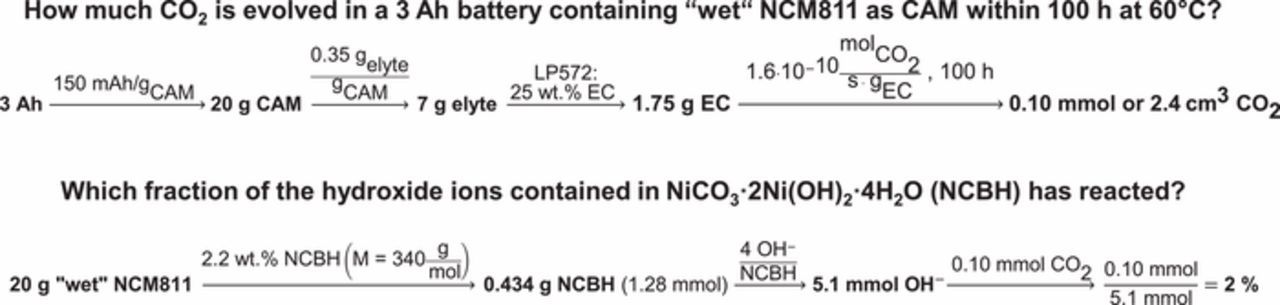
Figure 11. Overview of the model calculations of CO2 generation due to the reactions of surface contaminants with the electrolyte component EC for a 3 Ah battery cell containing "wet" NCM811 as cathode active material.
Implications for cycling at elevated temperature
The reduced capacity retention for T-cells with cathodes made from "wet" NCM811 powder was demonstrated in Figure 9. The capacity fading goes along with a decreasing mean discharge voltage and an increasing overall internal cell resistance that is much more pronounced for cells with contaminated NCM811 than for cells with "dry" or "calcined" NCM811. On a mechanistic level, this can be rationalized by an accumulation of unwanted reaction products in cells containing "wet" NCM811 that cause a larger impedance buildup on the anode and/or the cathode. In Figure 7 it was shown that surface contaminants lead to considerable gassing due to the decomposition of EC-based electrolytes at elevated temperature. By comparison with our previous work, we provided evidence that the EC decomposition rates triggered by surface contaminants are comparable to the OH−-driven hydrolysis of EC-based electrolyte (see Figure 10).30 It is thus likely that during cell cycling at 45°C (see Figure 9) such hydrolysis reactions induced by basic surface groups on the contaminated NCM811 material lead to the accumulation of electrolyte decomposition products on the electrodes. Such unwanted material imposes a kinetic hindrance for Li+-ion insertion/extraction and hence compromises efficient charge/discharge cycling.59
Conclusions
In this work, we attempted an in-depth analysis of the chemical composition and the quantity of surface contaminants on two different metal oxide-based cathode active materials (CAMs), the widely used LiNi1/3Mn1/3Co1/3O2 (NCM111) and the Ni-rich LiNi0.8Mn0.1Co0.1O2 (NCM811). To demonstrate the sensitivity of these materials to storage and handling in ambient air, we preconditioned the samples in three different ways: (i) the "wet" condition is obtained by storing the CAMs under high relative humidity; (ii) the "dry" condition refers to the as-received materials dried at standard electrode fabrication temperature; and, (iii) the "calcined" condition refers to the "wet" samples subjected to a heat-treatment under inert gas at 625°C for NCM111 and at 525°C for NCM811, with the intention of removing all surface contaminants.
By TGA-MS it was shown that already the "dry" samples exhibit a significant weight loss in the temperature range from 125–625°C, accompanied by a characteristic H2O and CO2 evolution associated with the presence of transition metal hydroxides and carbonates on the surface. Infrared spectroscopic analysis further substantiated the presence of carbonate and hydroxide/hydrate surface species; from an experimental point of view, it was also demonstrated that the sensitivity of FTIR measurements in diffuse reflectance mode (DRIFTS) is superior compared to ATR- and transmission FTIR. The amount of the surface contaminants is increased by "wet" storage to account for a weight loss on the order of ∼1 wt% in the case of "wet" NCM811 upon heating to 525°C. Comparing the TGA-MS patterns to those of several reference samples, it was found that basic nickel carbonate NiCO3·2Ni(OH)2·2H2O is likely to be the major and the most critical surface contaminant formed upon ambient air exposure of NCMs (particularly of Ni-rich NCMs).
On-line mass spectrometry (OMS) measurements show that "wet" and "dry" NCMs exhibit a high reactivity with ethylene carbonate (EC) based electrolyte, yielding substantial amounts of CO2 by the hydrolysis of EC with the hydroxyl groups and/or hydrates on the NCM surface. This reactivity is quasi-zero for the "calcined" samples where most basic surface contaminants are removed. Battery cells built with such "calcined", contaminant-free cathode material outperform cells with "wet" or even "dry" cathode material in extended charge/discharge cycling at 45°C due to much lower cell polarization. Against the common understanding, we show that residual Li2CO3 from the synthesis is not a detrimental surface contaminant, since it is still present on our "calcined" samples.
In short, our main findings are 1 that NCM811 is much more prone to surface contamination from ambient CO2 and moisture compared to NCM111, 2 that basic nickel carbonate was identified as the major and most important surface contaminant, and 3 that the latter clearly has detrimental effects on the gassing behavior and on the cycling of full cells. We are currently investigating ways to inertize metal oxide-based cathode materials, such that storage under moisture and CO2 containing atmosphere does not lead to surface contamination.
Acknowledgment
The authors acknowledge BASF for financial support of this research through the framework of its Scientific Network on Electrochemistry and Batteries. In particular, we thank Dr. Manuel Mendez and Dr. Heino Sommer (BASF) for fruitful discussions and helpful advice. We further thank Louis Hartmann and Christian Sedlmeier for their dedicated work and support of this project during their Bachelor's thesis and research internship, respectively.
ORCID
Johannes Sicklinger 0000-0003-2815-993X
Michael Metzger 0000-0002-5512-8541
Daniel Pritzl 0000-0002-9029-107X
Hubert Gasteiger 0000-0001-8199-8703