
Abstract
Cathode-electrolyte interphase (CEI) is critical for inhibiting the cathode degradation to maintain cell life. However, the evolution of the CEI is still unclear due to its complex and slow dynamic process. Here we used scanning electrochemical microscopy (SECM) for in situ investigation of CEI formation process on LiFePO4 cathode. Feedback images and probe scan curves showed a heterogeneous passivation that was gently generated on the LiFePO4 particles during both charging and discharging. Besides, a LiFePO4 composited electrode was also used to investigate the CEI formation to simulate the condition of real battery system. The composited cathode does not show obvious CEI formation within first two cycles. The SECM results between the pristine LiFePO4 particles and the composited LiFePO4 indicated the dynamic accumulation of CEI, which is influenced by the ability to charge transfer kinetics of cathode materials. This approach provided a feasible consideration for the connections between the dynamic evolution of the CEI and changes in charge transfer capability of cathode during cycling.
Download figure:
Standard imageHighlights
In-situ investigation of cathode-electrolyte interphase formation.
The evolution of native active material and composite slurry were compared.
The electrochemical activity change upon cathode cycling are analysed in situ.
The influence of the charge transfer capability upon CEI generation is revealed.

This is an open access article distributed under the terms of the Creative Commons Attribution 4.0 License (CC BY, https://creativecommons.org/licenses/by/4.0/), which permits unrestricted reuse of the work in any medium, provided the original work is properly cited.
Lithium-ion batteries (LIBs) have been a key component of electrochemical energy storage devices, particularly in electric vehicles (EVs) and portable electronics applications due to their long cycle life and high specific capacity. The metal oxide cathode is the main component responsible for the LIBs' high voltage and high energy density. Based on the categories of lattice structure, cathode materials can be broadly classified into three groups: layered, spinel, and olivine structure cathode materials.1–3 The operating voltage of these commercially available cathode materials is between 3.5 V and 4.5 V vs ELi+/Li. However, during battery cycling, severe side reactions occur at the electrode/electrolyte interface resulting in electrolyte decomposition, especially at high operating voltages.4,5 Fortunately, a cathode-electrolyte interphase (CEI) can be formed from the decomposed electrolytes. Similar to the anode counterpart, the solid-electrolyte interphase (SEI), an optimally stable CEI is essential to protect the cathode surface from further degradation and extend cycle life.6 However, most of the CEI generated throughout the cycle is discontinuous and uneven,7,8 which is insufficient to inhibit cathode damage and capacity loss.
According to previous literature, CEI consists of LiF, LixPOyFz, and Li2CO3, and other inorganic components, as well as organic components such as ROCO2Li, RCFx, and RCOxFy, etc.9–12 The type of cathode material also affects the composition of the CEI, as the transition metals released during battery cycling are typically involved in the CEI formation process.13 Currently, the cause of CEI generation is thought to be the oxidation or reduction of electrolyte species in response to cathodic potential distortions during cycling.14,15 The nucleophilic cathodic materials exhibit the Lewis basicity, which are more inclined to coordinate with oxygen atoms from electrolyte species, resulting in dehydrogenation reactions.16 The currently accepted theory states that the redox reactions initiate and form a non-uniform CEI on the cathode surface when the cathode Fermi level (μc) is lower than the highest occupied molecular orbital (HOMO) of the electrolyte.17–19 However, according to reports from Sui's group, the CEI can be formed when the critical voltage is below 4.05 V vs ELi+/Li, but decomposition occurs when the potential is higher than 4.05 V.20 Thus, the CEI formation mechanism still remains a mystery. In recent years, various electrochemical characterization tools have been used to explore the research of CEI in different systems.21 Zhang's group succeeded in monitoring the dynamics of CEI formation in a carbonate-based electrolyte with or without Tris (trimethylsilyl) borate (TMSB) in real time when charged to 4.8 V vs ELi+/Li using the operando-attenuated total reflection Fourier transform infrared (ATR-FTIR) technique.22 The chemical composition of the surface layers of Li4Ti5O12 at 25℃, 40℃ and 60℃ over 100 cycles using time-of-flight secondary ion mass spectrometry (ToF-SIMS) has been studied by the group of Hervé Martinez and concluded that the proportions of organic and inorganic species in the CEI vary with temperature.23 CEI has been studied using a range of sophisticated characterizing techniques. However, the results focus more on its electrochemical/chemical performance, which is often susceptible to the influence of external factors such as additives,24,25 temperature,26 and lattice transformation of the cathode materials. Therefore, it is still unknown how CEI evolves dynamically, especially at normal voltages in the absence of other influences. Due to the thin thickness, sensitive chemical properties, and complex composition of CEI, more sophisticated characterization tools are needed to study the kinetic evolution of CEI which can be measured in situ, to distinguish the electrode surface from the electrolyte, and to effectively obtain the electrochemical information.
Among the various of the advanced electrochemical characterization tools, scanning electrochemical microscopy (SECM) has become a powerful tool for detecting local electrode/electrolyte interface in LIBs in recent years.27–30 As an advanced electroanalytical scanning probe technique, SECM can quantify local electron transfer activity and topography changes with a high spatial and temporal resolution.31–34 Additionally, it can also in situ detect the electrochemical response of the substrate surface under operating conditions due to its unique four-electrode system.35 In recent years, the SECM has been applied to the study of the cathode side. Robert C. Tenent successfully combined SECM with inductively coupled plasma (ICP) and electron paramagnetic resonance (EPR) spectroscopy to monitor the Mn dissolution process on a LiMn2O4 (LMO) thin film.36 Li's group has shown a discontinuous CEI formed on an LMO cathode in an aqueous electrolyte using SECM.37 However, there is currently more interest in CEI generated in organic systems. Therefore, in our study, we decided to investigate the potential dependent CEI formation mechanism on the LiFePO4 (LFP) cathode material. With a high theoretical specific capacity of 170 mAh g−1 and good cycling stability,38 LFP is currently the most common olivine material, which can eliminate the interference of transition metal dissolution and surface lattice transition during CEI formation.9
Herein we investigated how CEI forms on native LFP material as well as on commonly composited cathode. We detected the changes in normalized current and quantified the local electron transfer kinetics (kf) using the redox mediator couple, ethyl viologen (EV2+/EV+), which allowed us to visualize the gradual CEI evolution process on LFP surface. While the native LFP particles demonstrate a clear CEI formation on second charge-discharge cycle, this process is suppressed at composited cathode. Hence, we propose that the path of electron transfer, which controls the decomposition process of electrolyte to form a CEI layer, is determined by the conductivity between the electrode and the electrolyte. Our work also sheds light on the in situ evaluation of electrode-electrolyte interphase properties for LIB systems.
Experimental Materials
All chemicals were purchased and used commercially. Propylene carbonate (PC, anhydrous, 99%) was purchased from Energy Chemical. Ethylene carbonate (EC, anhydrous, 98%) was purchased from Macklin. Lithium iron phosphate (LiFePO4, >98%, D90 ∼ 3.556 μm, polycrystalline carbon coated, ∼ 1.5%) was purchased from Shenzhen Kejing Star Technology Co. Ethyl viologen diperchlorate (EV(ClO4)2, 98%) was purchased from Aladdin. Lithium hexafluorophosphate (LiPF6, 99.9%) was purchased from DoDoChem. 12.5 μm radius Au wire (≥99.99%) was purchased from Zhongnuo Advanced Materials Technology Co. Pyrrole (99%) was purchased from TCI Chemicals. Acetone (AR) was purchased from ChinaSun Specialty Products Co., Ltd. Polyvinylidene fluoride (PVDF) and tetrabutylammonium hexafluorophosphate (TBAPF6, 98%) were purchased from Aladdin. N-Methylpyrrolidone (NMP, 99.9%) was purchased from Sigma-Aldrich. Ketjen Black (ECP-600JD) was purchased from TIMCAL. Diethyl carbonate (DEC, 99%) was purchased from Energy Chemical. Acetonitrile (99.5%) was purchased from was purchased from TCI Chemicals.
Substrate fabrication and characterization
The patterned LFP working electrode was fabricated using an electric airbrush and shadow mask. The LFP powder was dissolved in acetone and ultrasonicated for 5 min to prepare a suspension (5 mg ml−1). We placed the shadow mask plate on an aluminum foil and slowly sprayed the suspension onto the mask with an electric spray pen (40 min). The structure diagram of the electric spray pen has been shown in Fig. S1a. In order to prevent blowing away the LFP particles that have already been sprayed, we employed a modest air flow while spraying with an electric spray pen that is roughly 10 cm up from the aluminum foil. Due to the rapid evaporation of acetone, only LFP particles remained on the aluminum foil after spraying. The optical microscope images of fabricated LFP pattern are shown in Figs. S1b, S1c. The composited LFP electrode was prepared by mixing, coating, and drying the active ingredient (LFP), Ketjen Black, and PVDF in a mass ratio of 8:1:1. The patterned LFP was characterized by several techniques including optical microscopy (OLYMPUS BX), scanning electron microscopy (SEM, Hitachi SU 8010), and X-ray photoelectron spectroscopy (XPS) depth profiling (Quantum 2000, Physical Electronics, USA). SEM images were taken at 10 kV acceleration voltage and 10 μA emission current. X-ray photoelectron spectroscopy depth profiling of passivation layers was performed using a monochromatic Al Kα source (1486.6 eV) with a pass energy of 23.5 eV. The energy resolution used was 0.2 eV. We sprayed the same thickness of LFP, cleaned it three times with DEC and moved it in the glove box for 12 h to vacuum the sample to confirm that the XPS result was from the LFP and not the aluminum foil.
Electrochemical measurements
All electrochemical experiments were performed with a four-electrode setup on CHI 920D SECM (CHI Instruments). A radius of 12.5 μm Au ultra-micro electrode (UME) was selected as the working electrode, the fabrication of which can be found in previous reports.39,40 A Pt wire and a polypyrrole quasi-reference electrode (PPy QRE) were used as counter and reference electrodes. The experiments were performed in 8 mM EV(ClO4)2 in 0.1 M LiPF6 PC/EC solution. The PPy QRE was fabricated by deposition in a Pt filament by cyclic voltammetry, with a voltage range of −0.6 ∼ 1.2 V (vs EAg/AgCl) cycling 50 times in 10 mM pyrrole, 0.1 M TBAPF6, acetonitrile solution.41 The conversion relationship between voltage relative to PPy QRE and Li is described in Fig. S2. The cyclic voltammetry (CV) curves of EV2+ and LFP are shown in Fig. S3.
SECM feedback imaging
SECM feedback mode is the most commonly used technique for analysing the local electron transfer kinetics changes with high resolution. Two different types of substrates, patterned LFP electrode and composited LFP electrode, were selected to study the kinetics during CEI formation. The Au UME was scanned over two substrates at constant height and detect the EV2+/EV+ feedback current of changes. There, the SECM feedback images were obtained by varying the applied substrate potentials. These SECM images were used to study the dynamic evolution of CEI formation. The changes in normalized feedback currents would mirror the extent of CEI passivation on the electrode surface, evolving from the exposed LFP particle (positive feedback) to the CEI-covered surface (negative feedback).
Approach curve
The approach curve is the electrochemical tool that can be used to quantify the local electrochemical reactivities. Following each SECM, the approach curve measures the trend of the tip current change as a function of the reduced tip-substrate distance over a wide substrate voltage range (3.1 ∼ 4.0 V vs ELi+/Li). The approach curve measures the trend of tip current change with respect to reduced tip-substrate distance. The determined normalized current and normalized distance relationship is listed as follows: normalized current iT/iT, ∞ and normalized distance L = d/a; Where iT is the tip current, iT, ∞ is the steady-state current in bulk solution, d is the distance between the probe and the substrate, and a is the radius of Au UME (12.5 μm). The iT/iT, ∞ change reflects the conductivity and electrochemical property of the position of interest. Fitting the approach curves with analytical expressions from Cornut and Lefrou can yield the heterogeneous charge transfer rate constant kf,42 which can quantify the kinetic coefficient of the substrates. More details about mathematical kf fitting can be found in supporting information.
Results and Discussion
The complicated process of CEI formation can be influenced by a number of variables, including electrolyte, operating voltage, additive, and inherent properties of the cathode material, etc.13,19 So, we first want to confirm how the properties of the cathode material itself influence dynamic evolution of CEI. An electric spray pen was used to fabricate LFP particles onto the aluminum foil to fabricate the patterned LFP electrode (Fig. 1a). As the average diameter or radius of the LFP particles is approximately 1.3 μm, it is imperative that the patterned LFPs have sufficient thickness and coverage for the SECM probe to obtain the necessary electrochemical information.43,44 The accuracy of the total signal collected decreases with thinner LFP layers and less surface coverage (Figs. S1b, S1c). Finally, a moderate thickness has been achieved. As shown in Figs. 1b, 1c and 1d, the patterned LFP presents an array of 200 μm array with 500 μm center separation, and an average pattern height close to 8 μm in diameter.

Figure 1. Fabrication and SEM images of patterned LFP electrode. (a) Schematic illustration of fabrication procedure of patterned LFP. (b) Top view SEM image of a patterned LFP. (c) The photo of the patterned LFP sample. (d) Side view SEM image of a patterned LFP.
Download figure:
Standard image High-resolution imageIn order to visualize the in situ formation of CEI, we utilized the SECM imaging technique to track the LFP surface activity change while cycling. In this experiment, a 25 μm diameter Au UME was selected to monitor the change in redox couple EV2+/EV+ feedback charge transfer kinetics on patterned LFP substrate (Fig. 2a).31,45 During the experiment, Au UME was held at 2.4 V vs ELi+/Li to reduce EV2+ to EV+, a diffusion-limited steady-state current (iT) on the probe. This steady-state current will increase or decrease as the probe approaches the substrate surface in response to variations in the local diffusion capacity of EV+ and the local regeneration rate of EV2+ caused by differences in substrate activity and topography.37 Since the original LFP sample surface is covered by 1.5% polycrystalline carbon, this ensures the LFP substrate to oxidize EV+ back to EV2+. On the contrary, when the probe approaches to the surface of the aluminum current collector (surface covered by native oxide, Al2O3), or the passivated LFP particle after CEI formation, a negative feedback current with deduced iT is generated. To simplify the analysis, the measured tip current iT, is normalized to iT/iT, ∞. The changes of iT/iT, ∞ reflect the electron transfer and interphase formation across the LFP surface.

Figure 2. Illustration of SECM Measurement during CEI formation. (a) Schematics of SECM feedback image on LFP patterns before and after cycling. (b)–(c) Selected representative SECM feedback images at various Esub during first (b) and second (c) charge-discharge cycle. The values of selected Esub vs ELi+/Li are listed in each panel.
Download figure:
Standard image High-resolution imageWe then examined the potential-dependent reactivity of the patterned LFP electrode to monitor the development of the CEI formation using SECM feedback mode. The substrate, working and counter electrodes used in this experiment were the patterned LFP electrode, a 25 μm diameter Au UME and a Pt wire, respectively. The SECM experiment was performed inside an Ar filled glovebox, using an electrolyte solution of 1:1 (v/v) EC/PC containing 8 mM EV(ClO4)2 and 0.1 M LiPF6. SECM images of the patterned LFP region were measured at different substrate voltage biases (3.1 ∼ 4.0 V vs ELi+/Li) to study the dynamic evolution of the CEI (see Figs. 2b, 2c for representative potentials, and Fig. S4 ∼S7, for full data). From the SECM image, we can tell the distinct difference between circular positive feedback LFP pattern and negative feedback aluminum foil region. During the first cycle, as the voltage gradually rose to 4.0 V and returned back to 3.1 V, the feedback current began to gradually decrease, indicating that electrolyte decomposition was slowly occurring on the surface of the LFP particles. As the cycling continued, the feedback current continuously changed from positive feedback to negative feedback, suggesting the accumulation of decomposition products and the formation of an uneven CEI layer that progressively covered LFP surfaces (Fig. 2b). The changes in the normalized current at the surface of the LFP depicted the formation process of an inhomogeneous CEI during the initial charging and discharging steps which agrees with previous reports.46,47 At the second cycle, the normalized current of the LFP surface turned into negative feedback current completely (Fig. 2c). This phenomenon illustrates how the CEI evolves upon cycling.
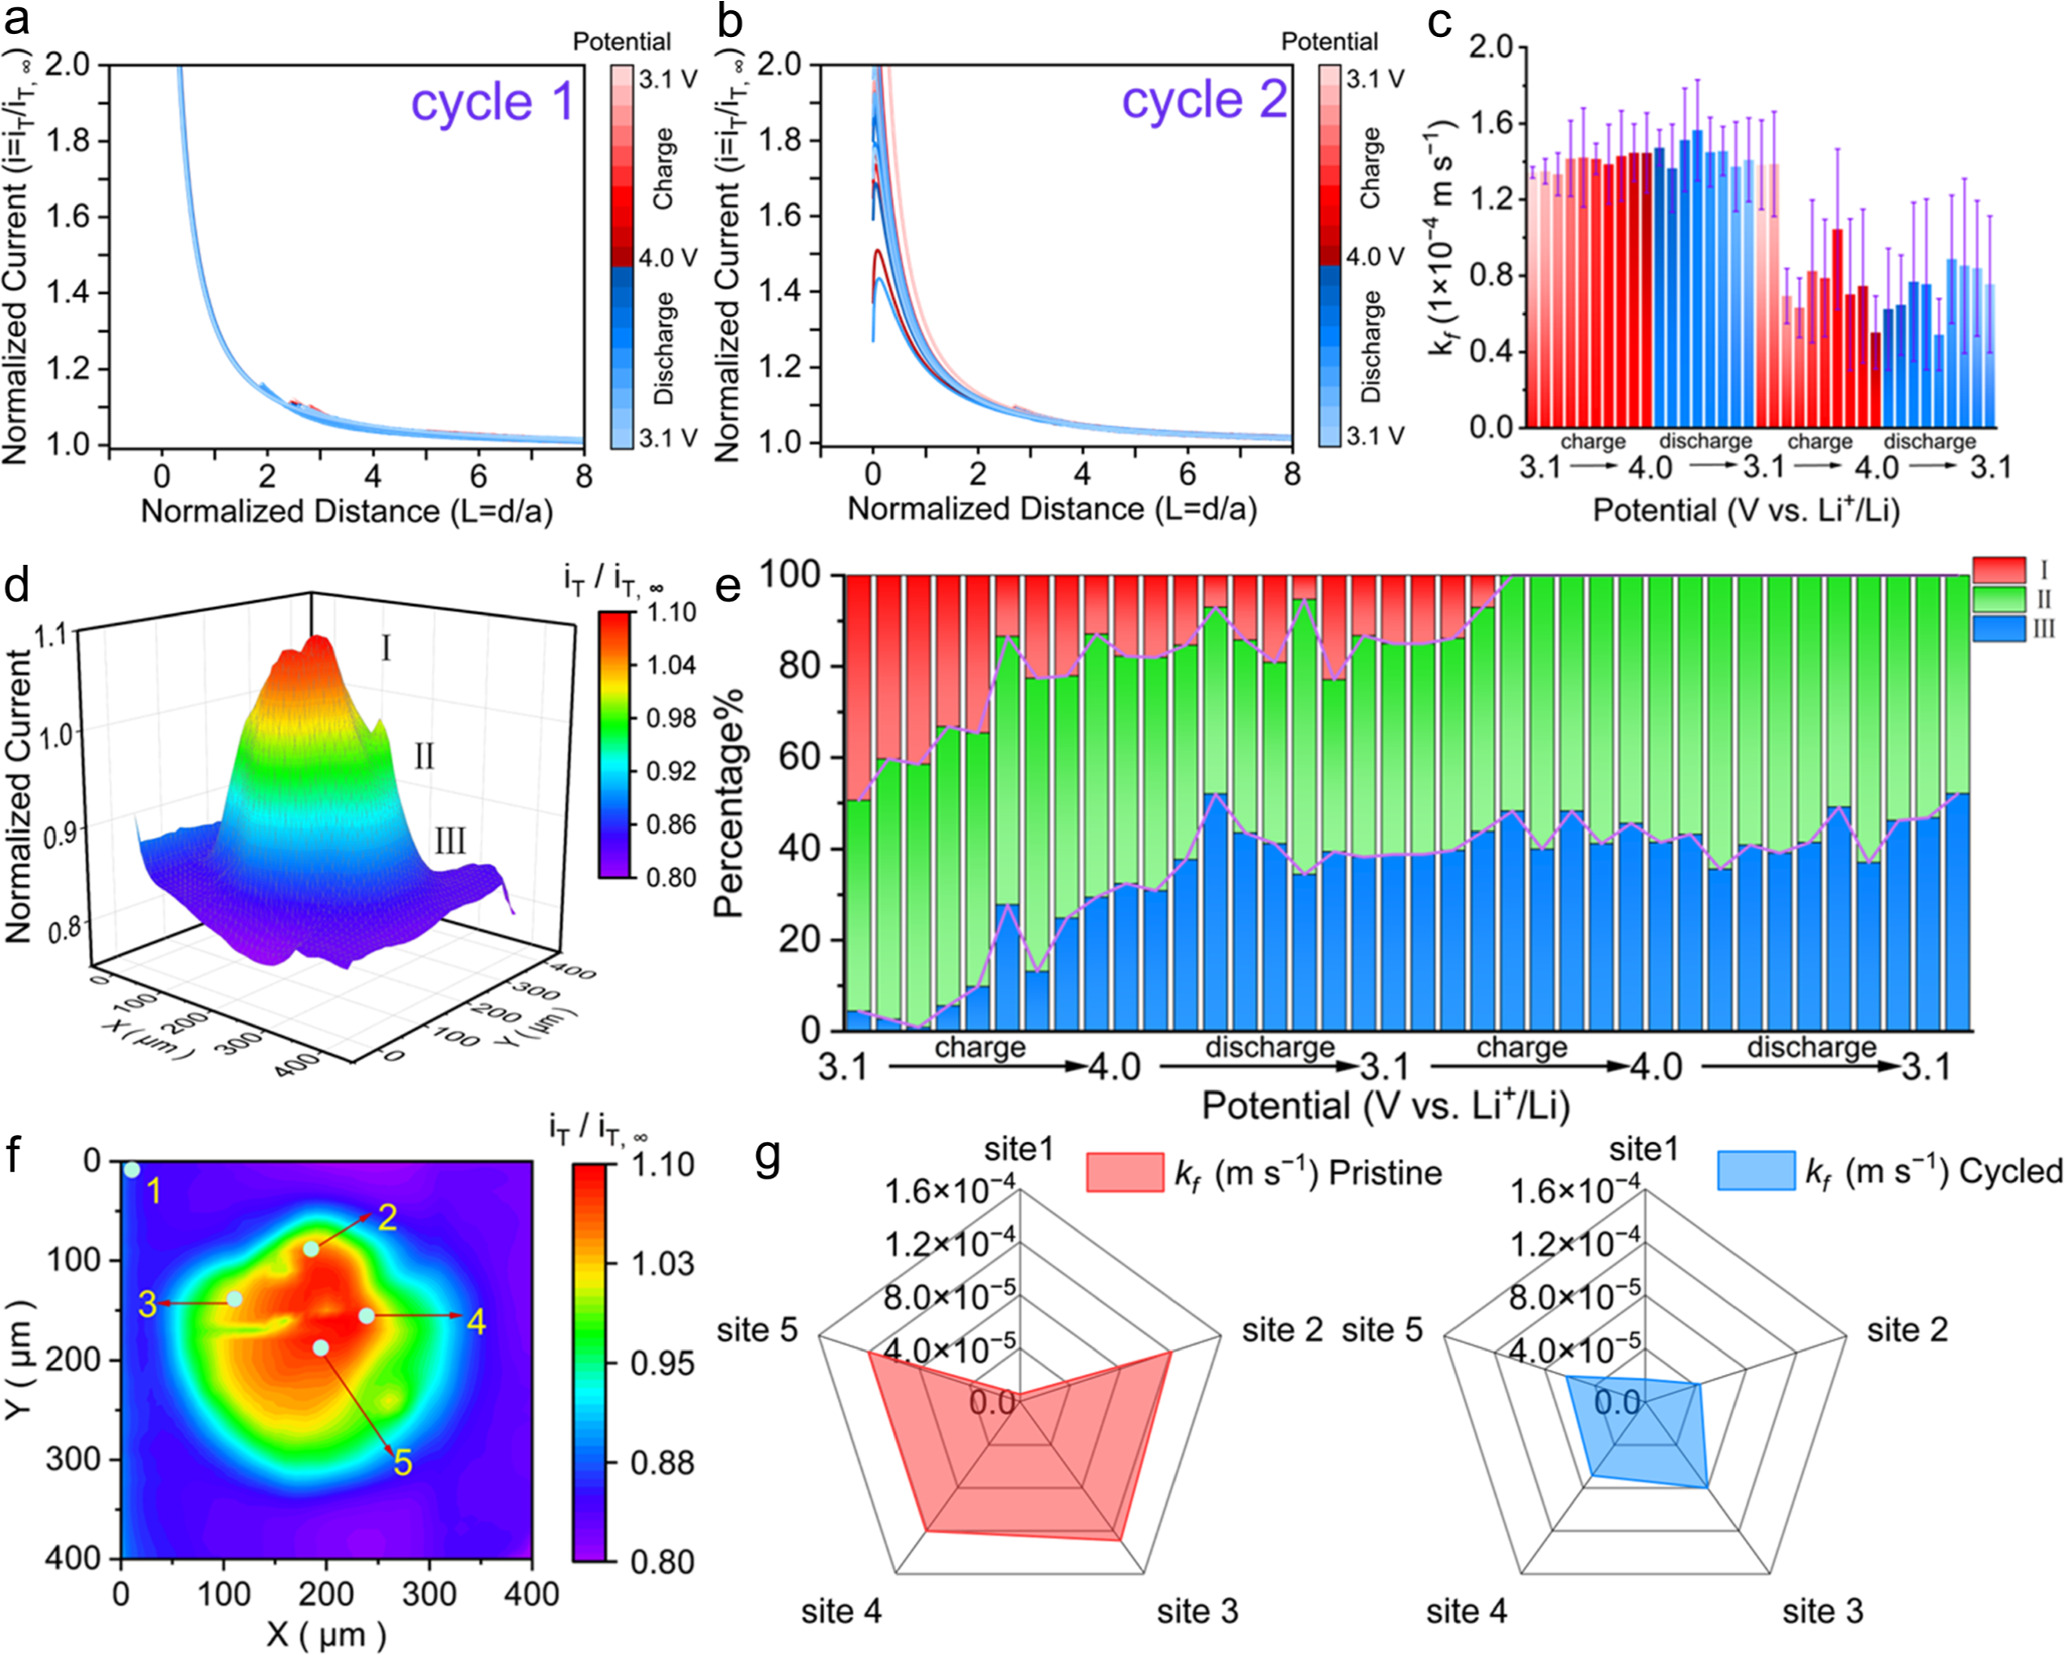
To further evaluate the evolution of CEI at different voltages during charging and discharging in more detail, we proceeded to quantify the dynamic electron-transfer kinetics constant kf at different voltages. Following each SECM image, repetitive approach curves were obtained with progressive substrate potential (Esub) biases, and we quantified the kinetic parameter kf during CEI generation via mathematical fitting (Fig. 3). It is clear that during the first cycle, the approach curves trends did not change significantly and the LFP surface maintained positive feedback (Fig. 3a). However, by the second charge/discharge cycle, the passivation becomes more recognizable (Fig. 3b). It is important to note that this slow passivation is not a uniform process, as we have also observed evidence of earlier change at other sites (Fig. S8). Therefore, we repeated the experiment over 5 positions, and summarized the trend of average kf with respect to different Esub. As shown in Fig. 3c, the average kf remains stable around 1.4 × 10⁻⁴ m s−1 upon first cycle charge-discharge with a total duration of 19 h, but rapidly loose half activity once step into second cycle (3.3 V vs ELi+/Li).

Figure 3. Probe scan curves and calculated the kinetic constant kf of LFP interface during the CEI formation. (a) The obtained approach curves over LFP pattern at the first cycle. (b) The obtained approach curves during the second cycle (Esub range 3.1 ∼ 4.0 ∼ 3.1 V vs ELi+/Li). (c) The change of average kinetic constant kf during first two cycles. (d) 3D SECM feedback image of patterned LFP. Based on the magnitude of the normalized current, it can be divided into 3 parts; red, iT/iT, ∞ > 1 (Region Ⅰ); green, 0.9 < iT/iT, ∞ < 1 (Region Ⅱ); blue, iT/iT, ∞ < 0.9 (Region Ⅲ). (e) A statistical percentage change of three selected regions listed in panel d during cycling in the center area of interest. (f) Schematic representation of selected sampling points on the LFP pattern with Sample 1 on aluminum foil, and Sample 2 ∼5 on different regions of LFP pattern. (g) Radar map of kf changes at selected sampling areas in panel f before (left) and after (right) cycles.
Download figure:
Standard image High-resolution imageConsidering that the CEI is not generated uniformly on the electrode surface during the actual evolution process, apart from single site approach curves, we further divide the LFP SECM pattern into three parts (iT/iT, ∞ > 1 (I), 0.9 < iT/iT, ∞ < 1 (II), iT/iT, ∞ < 0.9 (III)) based on the normalized current value (Fig. 3d), to better assess the evolution of CEI throughout the whole electrode. Region Ⅰ represents the area with positive feedback, probably caused by higher local activity of LFP or closer tip-substrate distance due to raise topography at pattern center. Region Ⅱ shows the area with mixed feedback behavior at the edge of the pattern. Region Ⅲ covers most of the exposed aluminum current collector region with negative feedback response. We selected a strategic location to observe the changes in the feedback current to illustrate the evolving process of CEI (Fig. S9a). During the charge-discharge process, the proportion of region Ⅰ will gradually decrease and diminish at 3.4 V vs ELi+/Li of second charge cycle, which agrees with the previous calculated kf trend. This indicates the active LFP surface gradually passivated by the formation of CEI, and eventually turned into compromised reactivity of region Ⅱ. In contrast, the stability of commercial aluminum foil is demonstrated by the fact that the aluminum current obtained (Region III) does not change during cycling (Fig. 3e). As shown in Figs. 3f, 3g, the kf of the four sites (sample 2 ∼ 5) decreased from ∼ 1.2 × 10⁻⁴ m s−1 to roughly 5 × 10⁻⁵ m s−1 after cycling. As a comparison, we discover the kf of the aluminum foil only suffers a slight activity increase which reveals the trivial electrolyte decomposition on the surface of the current collector (Fig. S9b). In general, these results show that CEI evolution is continuously proceed in both processes of charging and discharging. During this process, the CEI will gradually accumulate and cycle into a thicker state.
In addition to the SECM results mentioned above, the presence of CEI was also confirmed by Raman spectroscopy and XPS analysis. The Raman spectrum of the pristine and cycled electrode is shown in Fig. 4a. For pristine LFP sample, we can clearly locate its lattice vibrational response (below 400 cm−1), antisymmetric stretching mode of PO43− (400 ∼ 700 cm−1), and intermolecular stretching motions of PO43− (900 ∼ 1100 cm−1).48 After cycling, these characteristic responses of LFP almost disappear, leaving only broad D (1340 cm−1) and G (1600 cm−1) bands of the polycrystalline carbon component. This result indicates that the surface sensitive Raman interaction of LFP is blocked by the development of CEI.

Figure 4. XPS and Raman spectrum analysis for CEI. (a) The Raman spectrum of the patterned LFP before and after cycling. (b)–(d) Elemental sensitive XPS results of (b) C 1s, (c) O 1s, (d) F 1s spectrum before and after cycling.
Download figure:
Standard image High-resolution imageThe chemical composition of the CEI was further investigated using XPS. The C 1 s, O 1 s, F 1 s of the XPS spectra demonstrate that both inorganic and organic species were observed by comparing the pristine and cycled LFP substrates. When comparing the C 1 s spectra of cycled LFP samples, we observe an enhanced C-O-C peak at 286 eV and the appearance of a new peak at 291 eV, which is thought to correspond to Li2CO3 or ROCO2Li species (Fig. 4b). It is easy to find the corresponding intensified C=O peak at 533 eV in O 1 s spectra (Fig. 4c).
Except for the coexistence of common elements in both cycled and pristine substrates, the appearance of LiF (685.5 eV), LixPOyFz (687.5 eV) bands on F 1 s spectra of cycled LFP proved the reaction between LiPF6 electrolyte and LFP (Fig. 4d). LixPFy, the product of the LiPF6 decomposition reaction, was found at 136.5 eV in P 2p spectra, 57 eV in Li 1 s spectra as well (Fig. S10). The distribution of organic and inorganic components we observed is consistent with previous research under similar conditions.49–51
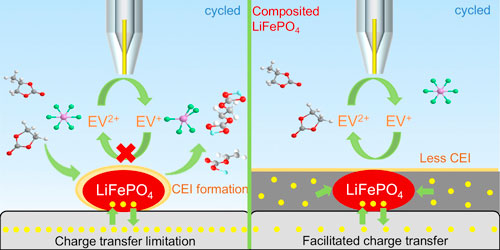
Considering that the actual working electrode is typically a composite mixture of active electrode material, conductive additive and binder. The behavior of composited cathodes may differ from the CEI generation mechanism seen within the active LFP particles alone. Here, we also prepared the composited LFP electrode and repeated the above SECM experiment in the same system. The SECM images and approach curves upon composited LFP cycling are shown in Figs. 5a, 5b and S11 ∼ S14. The boundary between the composited LFP and the aluminum foil was selected as the region of interest. The location of selected points has been shown in Fig. S15a. Unlike the patterned LFP electrode, there is no apparent CEI passivation generated in the SECM images after two full cycles. The results of the successive approach curves also monitored the kf changes in situ. In contrast to the pattern LFP, the composited LFP revealed constant positive feedback behavior with the heterogeneous kf fitting maintained at ∼ 1.2 × 10⁻⁴ m s−1 (Figs. S15b, S15c). However, the XPS results of the composite electrode also detected substances similar to CEI (Fig. S16). Therefore, the composited LFP with mixed components demonstrated resistance towards CEI formation induced surface passivation, but it doesn't completely stop the electrolyte from slowly and continuously degrading.

Figure 5. SECM feedback images and approach curves of the constant voltage charge/discharge process on the composited LFP and CEI generation mechanism diagram. (a) the SECM images during two cycles, pristine (left), one cycled (middle) two cycled (right). (b) the approach curves during the first cycle. (c) Diagram of the CEI generation mechanism on two substrates. Pristine (left), CEI accumulation on the patterned LFP (middle), composited LFP (right).
Download figure:
Standard image High-resolution image
Combining the experimental results of patterned native LFP and composited LFP, we find that the conductive additive and binder are important factors in CEI growth. Thus, we propose that the conductivity at electrode-electrolyte interface can be a critical factor that controls the dynamic evolution of CEI, especially at normal operating voltages. For the patterned LFP electrode with weak electron transfer capability, the electrolyte is adsorbed on the surface of the active material and slowly decomposes upon charging. Due to the weak contact between the cathode material and current collector (native oxide densely packed aluminum foil), electrons cannot be efficiently transferred between LFP and current collector in a timely manner. This leads to accumulated local potential distortions, progressive electrolyte decomposition and continuous formation of CEI (Fig. 5c). For the composited LFP, good electrical conductivity promotes the rapid charge transfer, thus weaken the uncontrolled potential bias induced CEI accumulation. Our finding can explain why thin and uneven CEI formation is observed in real battery system after long-term cycling, when volume expansion, material inactivation and decomposition cause distortions in local conductivity.
Conclusions
In this work, the dynamic evolution of CEI formation on patterned LFP and composited LFP is investigated using in situ SECM. Combining SECM-based electrochemical measurements, the surface kinetics and the local passivation behavior during the CEI formation for pristine LFP sample were systematically demonstrated, with clear evidence of CEI formation during second cycle and a distinct kf drop. On the composited LFP, however, the same results cannot be obtained under the same conditions. Therefore, we propose a point that the CEI generated can be attributed to the limitation of electron transfer leading to the decomposition of electrolytes within the operating voltage range. Our results have shown that the LFP itself is unable to transfer electrons in a timely manner throughout the cycles due to the lack of conductive additives, causing the adsorbed electrolyte on the LFP surface to oxidize. The decomposition products generate an unevenly thick passivation covering the surface of the LFP, which eventually accumulates to form CEI layer. In composited LFP, conductive additives reduce electrolyte decomposition, facilitate electron transfer and prevent CEI formation. These results not only provide a new insight into the fundamental understanding of the dynamic evolution of CEI, but also provide a potential strategy for constructing CEI with good performance to achieve cathode protection under long cycles. Additionally, it provides new ideas for SECM to be applied in the field of lithium-ion batteries, especially for the research on the cathode materials side.
Acknowledgments
This work was supported by the National Natural Science Foundation of China (22204115), the Natural Science Foundation of Jiangsu Province (BK20220485), the Suzhou Municipal Science and Technology Bureau (ZXL2022494) and the start-up research grant for a distinguished professor at Soochow University (J.H.).