
Abstract
Industry-standard diagnostic methods for rechargeable batteries, such as hybrid pulse power characterization (HPPC) tests for hybrid electric vehicles, provide some indications of state of health (SoH), but lack a physical basis to guide protocol design and identify degradation mechanisms. We develop a physics-based theoretical framework for HPPC tests, which are able to accurately determine specific mechanisms for battery degradation in porous electrode simulations. We show that voltage pulses are generally preferable to current pulses, since voltage-resolved linearization more rapidly quantifies degradation without sacrificing accuracy or allowing significant state changes during the measurement. In addition, asymmetric amounts of information gain between charge /discharge pulses are found from differences in electrode kinetic scales. We demonstrate our approach of physics-informed HPPC on simulated Li-ion batteries with nickel-rich cathodes and graphite anodes. Multivariable optimization by physics-informed HPPC rapidly determines kinetic parameters that correlate with degradation phenomena at the anode, such as solid-electrolyte interphase (SEI) growth and lithium plating, as well as at the cathode, such as oxidation-induced cation disorder. If validated experimentally, standardized voltage protocols for HPPC tests could play a pivotal role in expediting battery SoH assessment and accelerating materials design by providing new electrochemical features for interpretable machine learning of battery degradation.
Export citation and abstract BibTeX RIS

This is an open access article distributed under the terms of the Creative Commons Attribution 4.0 License (CC BY, http://creativecommons.org/licenses/by/4.0/), which permits unrestricted reuse of the work in any medium, provided the original work is properly cited.
Lithium-ion batteries, owing to their high power and energy densities, have become ubiquitous energy storage devices for portable electronic devices. 1,2 A key metric in the design of Li-ion battery materials is rate capability for discharge, 3–5 but there is a complex, material-dependent trade-off between increased cycling rates and reduced battery lifetime, strongly correlated with power fade in electrodes. 6 Capacity fade and internal degradation resulting from long-term use of Li-ion batteries must be rapidly and accurately quantified in order to improve their performance, reliability, and safety 7–10 and inform second-use and end-of-life decisions. 11 Degradation of Li-ion batteries stems from a plethora of physical mechanisms, such as solid electrolyte interphase (SEI) formation 12,13–15 and lithium metal plating 16–19 at the anode and structural changes at the cathode, such as oxidation-induced cation disorder, 20 rock-salt phase-transitions and densification, 21,22 anti-site defects, 23 and secondary particle cracking. 24,25 These degradation mechanisms lead to losses in rate capability by lowering accessible capacity at the same current or power within the operating voltage range. When this measure of state of health (SoH) reaches a given threshold, such as 80% of the nominal capacity under slow discharge, the battery is considered to have reached the end of its useful life, but the internal state of degradation is unknown and difficult to assess.
During the course of battery operation, assessing the performance and health of a cell is a challenging task, normally addressed by intermittent diagnostic tests. Various types of diagnostic tests are performed non-destructively to evaluate the ability of a battery to store and release energy, typically after a battery has undergone significant electrochemical cycling. 26,27 High-precision coulometry tests can infer different degradation modes from measurements, 28–30 but require equipment with extreme measurement precision. Reference performance tests (RPT) measure the ability of a battery to charge and discharge a specific current. 31–33 Electrochemical impedance spectroscopy (EIS) quantifies the frequency-dependent response to small AC perturbations. 34,35 Hybrid pulse power characterization (HPPC) tests utilize large intermittent current pulses and rest periods to capture the behavior of a cell under high currents far from equilibrium. 36–39 All of these tests can be leveraged for interpretable machine learning of battery degradation, based on cell level SoH and performance, such as internal resistance and accessible capacity, 40–44 but connections to microscopic kinetic parameters could lead to more robust feature engineering and insights into the internal state of degradation.
To comprehensively understand the operational limits of a battery in diagnostics, it is essential to subject it to high-rate perturbations. It is advantageous to initiate experiments from an equilibrium state, as it facilitates better calibration and supplies a more controlled starting point for assessing behavior, which most diagnostic tests do not provide. For example, RPT tests impose a current constraint for a full (dis)charge, so the battery is continuously residing in a nonequilibrium state. Conversely, EIS is generally performed near equilibrium in batteries, since applying a DC bias (as is often done in fuel cells) results in drifting spectra associated with dynamical heterogeneities and varying state of charge. Among the various diagnostic tests available, HPPC tests stand out, as they offer an abundance of kinetic information far from equilibrium yet are calibrated against equilibrium conditions. State-of-the-art experimental design of diagnostics using pulses lacks a systematic basis to distinguish and quantify different degradation mechanisms. Information is typically extracted by fitting lumped parameters that are only qualitatively connected with degradation mechanisms, such as the loss of active material, loss of lithium inventory, or increasing area-specific impedance. 45,46 While such results from diagnostic tests provide valuable insights, they are difficult to connect unambiguously with root causes of degradation. 47–50 These observed "symptoms" do not offer a direct mapping to specific mechanisms that can be rigorously captured in physical models, such as film resistance and electrolyte concentration loss. 20,51
The introduction of pulse measurements in electrochemistry is not a recent development, as they are frequently used to extract information on diffusive dynamics 52 with Galvanostatic and Potentiostatic Intermittent Titration Techniques (GITT, PITT). 53–55 Pulse measurements are sometimes interpreted by porous electrode theory (PET) simulations. 56–61 Despite their widespread utilization, 62,63 however, there is still inadequate understanding of how pulses affect cells. For HPPC tests in particular, the theoretical understanding of pulse dynamics in the short-time reaction-limited regime is incomplete, and no clear rationale for selecting specific states of charge and currents for the applied pulses is available. While some progress has been made with porous-electrode type modeling to simulate HPPC, as shown in Fig. 1b with pulses from measurements similar to industry-standard HPPC, 36, 38, 64–66 these protocols have not yet been optimized to extract maximum information. Current methods approaching experimental design with PET simulations present significant computational challenges due to the extensive search space and the significant computational time required. 67 Although efficient numerical solver backends such as SUNDIALS 68 can help overcome these challenges, 69 such problems are still rate limiting. As battery management systems move toward health monitoring and applying optimized protocols during operation, simple optimization problems to extract degradation from diagnostics become more attractive. 70 Previous work 36 analyzing HPPC modeling with porous electrode theories applied sensitivity studies for cell-specific models without providing general analysis of information content extracted from pulses. Furthermore, PET-type simulations often suffer from poor identifiability of parameters inferred from experimental data, 67,71,72 which complicates attempts to predict improved experimental design. These problems have hindered progress in the search for optimal protocols, 73,74 especially for battery management systems. Thus, simpler models of pulse diagnostics for a generalized design framework are necessary.
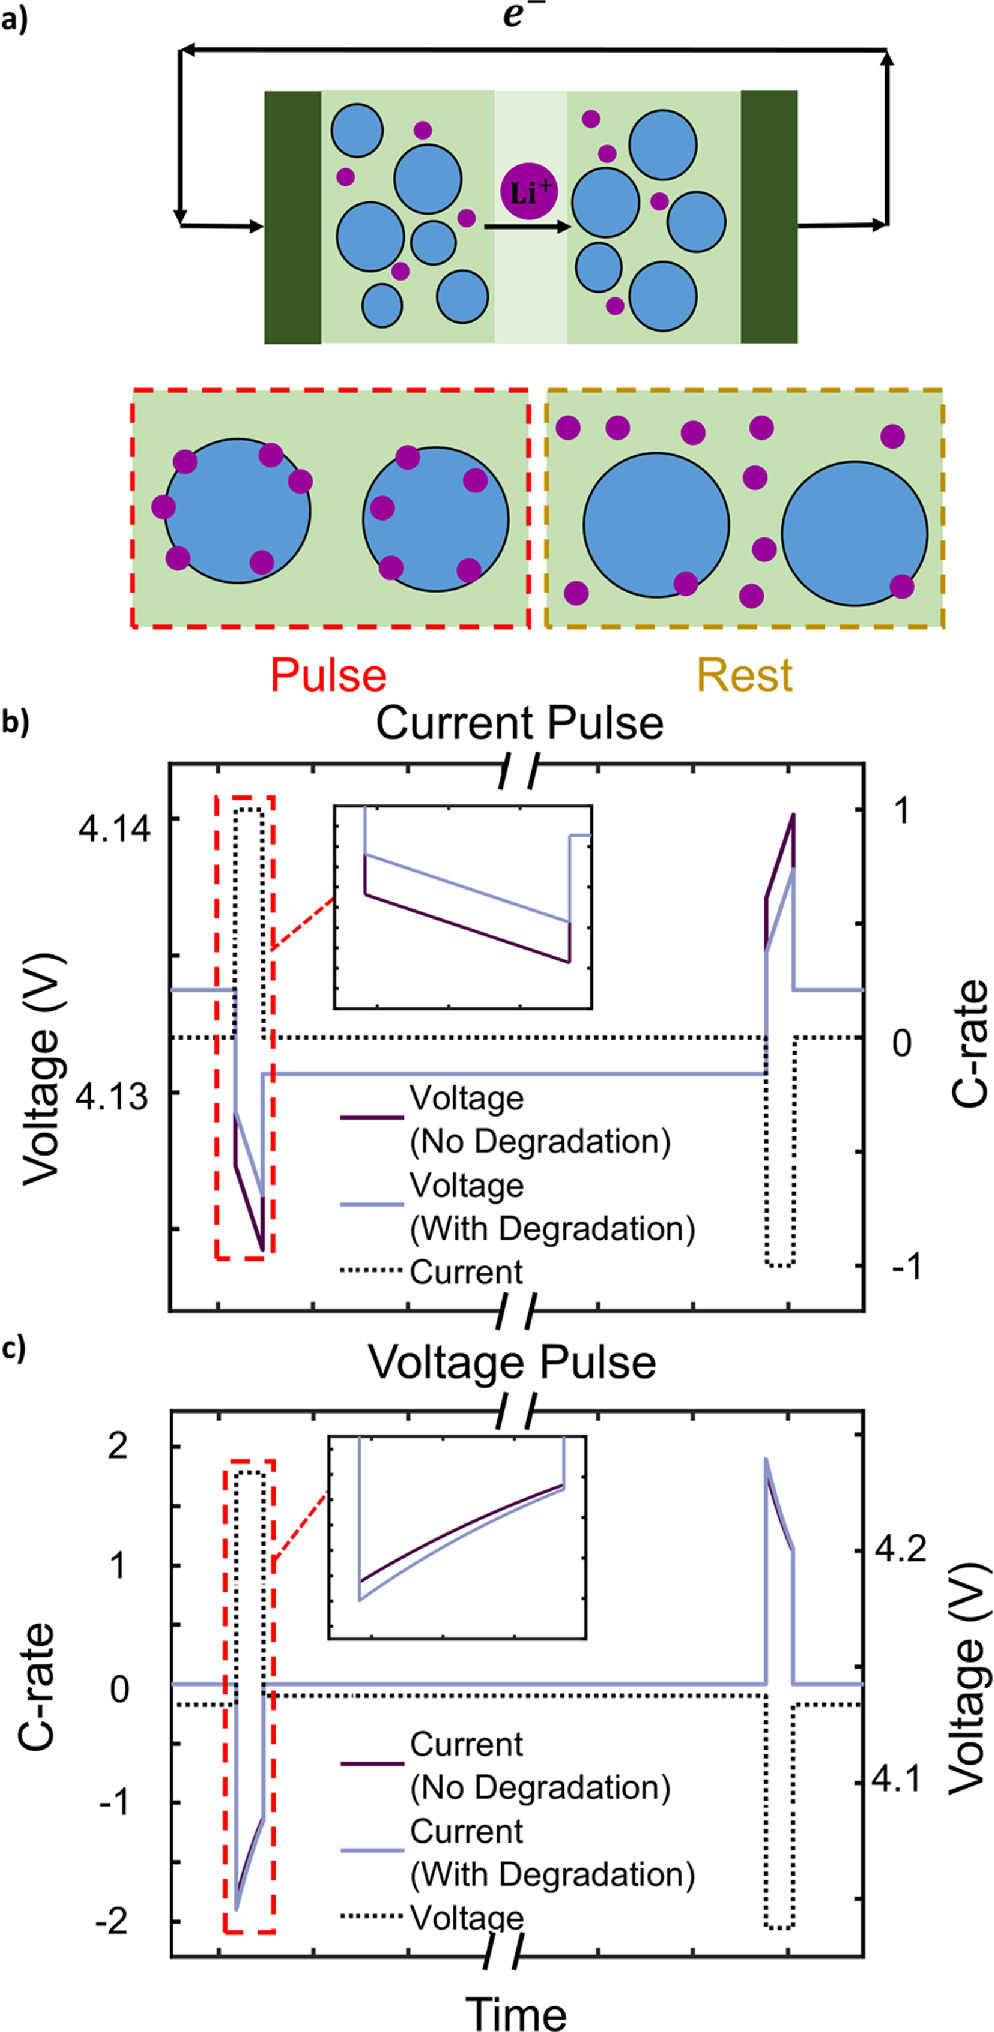
Figure 1. a) A comparison of the physical description of pulsing and resting in a battery cell, where lithium ions in the electrolyte are purple and battery particles are blue. b) Voltage response to a current pulse and c) current response to a voltage pulse and the effects of degradation on a pulse measurement in an industry-standard HPPC measurement are shown, with the pulse and rest sections displayed.
Download figure:
Standard image High-resolution imageIn view of these challenges, we choose to tackle this problem by establishing a physical interpretation of certain simulated cell behavior subject to pulsed conditions, and attempt to find a comprehensive method to understand pulse experiments. Because degradation mechanisms are convoluted between the two electrodes, distinguishing physical degradation mechanisms for a full cell is not a simple task. To address this challenge, we develop a theoretical framework to separate mechanisms for a half-cell material using the fitness framework for voltage pulses, and then expand the framework to a full cell. Our investigations have led to the development of an explicit representation that separates degradation mechanisms for full cells and can be used as a direct function for optimization problems. We demonstrate that voltage pulses using the fitness framework reliably extract dominant degradation mechanisms using multivariable optimization, and validate these results with porous electrode simulations. Overall, our analysis has also led us to propose voltage pulses, a novel method of measuring battery degradation, using a "fitness" framework. 51 The key advantage of the voltage pulse method is the explicit physical separability of degradation mechanisms from the fitness framework, shown in Eq. 13, which indicates that loss in fitness can be directly attributed to each degradation mechanism. This contrasts with implicit formulations in current pulses, simplifying numerical calculations. Asymmetric effects of the cathode/anode on the full cell system based on kinetic parameters are predicted from our explicit model, which increase numerical efficiency in optimization problems. Voltage pulses also provide other physical advantages, such as mitigating electrode heterogeneity that results from phase separation 75 and electro-autocatalysis, 76 which increases diagnostics accuracy. Current response is also closely linked to rate capability, which holds higher importance in high-rate battery operation relative to conventional degradation metrics, such as practical capacity and lifetime. 77,78
This implementation of physics-informed HPPC significantly enhances the quality of information gathered compared to industry-standard HPPC experiments. The method demonstrates an asymmetric sensitivity of information to degradation parameters between charge and discharge from differing scales of cell kinetics. It enables us to discern the physical roots behind degradation symptoms more accurately and efficiently. The impact of different states of charge and voltages on probing distinct degradation mechanisms is also explored. 46 Our investigations also shed light on the limitations of HPPC experiments, specifically the fact that degradation mechanisms at the overpotential dominant electrode (the electrode where the overpotentials are larger than that at the opposing electrode) are extracted more easily than those at the non overpotential dominant electrode.
Theory
Degradation mechanisms and models
During a pulse, lithium ion-electron pairs (de)intercalate into the solid active material or electrolyte, driven by a current or voltage hold. This large perturbation over short timescales offers significant insight into the electrochemical dynamics. 79 Since ion diffusion timescales in the electrolyte and solid are much longer than the reaction timescales, the latter are most discernable immediately after the pulse is applied. Even at shorter timescales, double layer relaxation tends to dominate, 80–82 so the experimental choice of measurement times must be tailored to avoid this effect. As a result, timescale analysis is performed in the cell modeling sections.
In this context, we begin with a theoretical examination of the behavior within the battery during a pulse, providing guidance on how diagnostic experiments should be structured. We consider three common physical types of degradation related to power fade: film resistance Rf
, which introduces an additional resistance to the overpotential applied to the (de)intercalation reaction, typically arising from solid electrolyte interphase formation;
14
surface blockage  of kinetics, which reduces the number of available sites at the surface for intercalation, arising from phase transformations at the surface;
20,51
and electrolyte loss from parasitic reactions, which changes the availability of the reactant, the concentration of lithium ions in the electrolyte solution c+.
83
Many common degradation mechanisms can be lumped into these three categories, such as cathode electrolyte interphase (CEI)
84
or graphite solid electrolyte interphase (SEI)
13–15,85
growth for the film resistance mechanism, structural disordering/phase transitions in nickel-rich materials for the surface blockage,
20
and electrolyte decomposition for the electrolyte loss mechanism.
7
Other types of degradation mechanisms could be integrated as well. By systematically studying the impact of these degradation mechanisms within pulse experiments, we elucidate their individual contributions, facilitating design of diagnostic experiments tailored to distinguish degradation factors.
of kinetics, which reduces the number of available sites at the surface for intercalation, arising from phase transformations at the surface;
20,51
and electrolyte loss from parasitic reactions, which changes the availability of the reactant, the concentration of lithium ions in the electrolyte solution c+.
83
Many common degradation mechanisms can be lumped into these three categories, such as cathode electrolyte interphase (CEI)
84
or graphite solid electrolyte interphase (SEI)
13–15,85
growth for the film resistance mechanism, structural disordering/phase transitions in nickel-rich materials for the surface blockage,
20
and electrolyte decomposition for the electrolyte loss mechanism.
7
Other types of degradation mechanisms could be integrated as well. By systematically studying the impact of these degradation mechanisms within pulse experiments, we elucidate their individual contributions, facilitating design of diagnostic experiments tailored to distinguish degradation factors.
In order to assess the impact of cell degradation on rate capability, we employ multiphase porous electrode theory (MPET) simulations 86,87 based on nonequilibrium thermodynamics 88 to compare the pulse response of a degraded cell and the response prior to degradation. Importantly, MPET captures the rate-dependent populations of active particles sustaining the applied current, 75, 89–91 which control internal resistance and parasitic side reactions. 17,18,20,51,76 Degradation manifests itself by gradually altering the current or potential response from cycle to cycle, and the model attributes these changes to a number of physical mechanisms.
The response to large pulses is initially dominated by reaction kinetics. 79 Both cathode and anode kinetics contribute to cell performance during this period, and degradation from both electrodes collectively impacts current capacity. The net Faradaic reduction current at an electrode is the difference between the reduction and oxidation currents, 52

which depend on the overpotential η, expressed as the change in free energy of the intercalation reaction per electron charge transferred, 88

where c is the concentration of the intercalated lithium in the solid, μ(c) is the chemical potential of the intercalated lithium, ϕ+/s represents the lithium ion electrical potential in electrolyte or solid, a+ is the activity of the lithium ions in electrolyte depending on its concentration c+, i denotes the intercalation current density, and Rf is the film resistance from degradation.
The traditional approach of modeling electrochemical reactions applies the Butler-Volmer equation, a thermodynamically reversible reaction rate derived via transition state theory. 88 However, with this method, a simple phenomenological model is fitted to extract only the exchange current density as a kinetic parameter, with no dependence on electron transfer parameters. The phenomenological exchange current density is dependent on the activity of intercalated lithium and vacancies. 92,93 As an alternative to the traditional approach of modeling electrochemical reaction rates with the Butler-Volmer equation, 52 we adopt the general quantum-mechanical framework for intercalation reaction kinetics provided by coupled ion-electron transfer (CIET) theory 59,94 based on equilibrium thermodynamics. 88 The exchange current density using CIET reactions is obtained through rigorous derivations and explicitly includes the effects of the electron transfer barrier through the reorganization energy of the solid. 94 The theory has two simple limits: 94 1) For fast electron transfer with slow ion transfer ("ion-coupled electron transfer", ICET), the theory predicts similar overpotential dependence to Butler-Volmer kinetics with a new form of the exchange current accounting for electron transfer barriers; 2) in the opposite limit of rate-limiting electron transfer ("electron-coupled ion transfer", ECIT), the theory combines Marcus kinetics of electron transfer 95,96 with corrections for nonequilibrium thermodynamics of ion transfer. 88 The latter was first proposed as a mechanism for lithium intercalation in lithium iron phosphate, 59,97 and recently validated by inverse learning from X-ray images. 94,98 Given this rigorous validation for one important Li-ion battery material, we assume ECIT kinetics in our study, but do not expect major changes to our results with other limits of CIET theory. The differences between ECIT and ICET are most pronounced at large overpotentials, while both limits of CIET theory predict a similar concentration-dependent exchange current at small overpotentials, which vanishes linearly at high filling fractions. 94 This universal concentration dependence of CIET kinetics has a strong effect on degradation and capacity loss, as the reaction rate vanishes as the theoretical capacity is approached. Changes to the specific reaction model would only change the sensitivity to the underlying degradation parameters at large overpotentials relative to the reorganization energy (typically several 100 meV).
It is convenient that an accurate analytical approximation of the ECIT rate is available, 59,94,99 given by

in terms of the exchange current prefactor  , the rescaled capacity after degradation
  , and the formal overpotential ηf
and Marcus reorganization energy λ, each scaled to the thermal energy (kB
T/e), where the function
, and the formal overpotential ηf
and Marcus reorganization energy λ, each scaled to the thermal energy (kB
T/e), where the function  is defined as
The dimensionless formal overpotential is defined as  , where the ionic concentration dependencies are removed since ionic concentration is considered separately as a reactant. As with other reaction models, the reduction current
  dominates during intercalation, while the oxidation current is
  , which is dominant during de-intercalation. An important prediction of CIET theory is the linear decay of the reaction rate in the approach to complete filling of the (degraded) lattice,
  , which requires a vacancy for the transition state.
59,94
This leads to a strong effect of electro-autocatalysis,
100
which leads to more homogeneous concentration profiles with higher resistance during intercalation and more unstable heterogeneous profiles with lower resistance during de-intercalation, as observed in recent experiments on both phase-separating
98
and solid-solution
76
cathode active materials.
, which requires a vacancy for the transition state.
59,94
This leads to a strong effect of electro-autocatalysis,
100
which leads to more homogeneous concentration profiles with higher resistance during intercalation and more unstable heterogeneous profiles with lower resistance during de-intercalation, as observed in recent experiments on both phase-separating
98
and solid-solution
76
cathode active materials.
Cell models
Single particle model
A single particle model serves as the simplest representation emphasizing active material intercalation of the electrode. This model captures interplay between active material reaction and diffusion processes 101 using the particle lengthscale to estimate reaction area in a full electrode. During a pulse, the interplay between timescales for reaction, diffusion and applied current determine the concentration profiles that arise within single particles, 79 which can develop either bulk-surface quasi-equilibrium or diffusion-limited core-shell patterns. For phase separating materials, the former regime involves intercalation waves sweeping across the surface of the particle, 88,102 but as we consider here, for non-phase separating materials, the bulk-surface quasi-equilibrium structure corresponds to nearly uniform solid concentration, which is ideal for degradation estimation. In this case, it is only necessary to avoid solid diffusion limitation leading to non-uniform core-shell concentration profiles. In order to estimate the conditions for quasi-equilibrium, we perform a scaling analysis of the reaction-diffusion equation for a particle,

such that  and τI,p
= I−1 are the solid diffusion and process timescales, respectively. Here, Lp
is the particle length, Dp
is the solid particle diffusivity, and I is the C-rate. When τI,p
≫ τD,p
, the quasi-equilibrium/reaction limited regime is reached, the ideal region for the application of the reaction-limited model in the current work. Conveniently, as observed in Fig. 4ab of Ref. 79, most common battery electrode materials lie in the reaction-limited regime. Exceptions occur at large pulses, when the dimensionless current is large (i/i0 ≥ 103), or when particle size is large as in graphite platelets, (Lp
≥ 105 nm). Here, i0 is the related to the exchange current density of the material, and i is the dimensionalized applied current. Thus, for our pulse measurements, we assume that the system is reaction limited,
79
allowing us to neglect solid state diffusion in the particles.
and τI,p
= I−1 are the solid diffusion and process timescales, respectively. Here, Lp
is the particle length, Dp
is the solid particle diffusivity, and I is the C-rate. When τI,p
≫ τD,p
, the quasi-equilibrium/reaction limited regime is reached, the ideal region for the application of the reaction-limited model in the current work. Conveniently, as observed in Fig. 4ab of Ref. 79, most common battery electrode materials lie in the reaction-limited regime. Exceptions occur at large pulses, when the dimensionless current is large (i/i0 ≥ 103), or when particle size is large as in graphite platelets, (Lp
≥ 105 nm). Here, i0 is the related to the exchange current density of the material, and i is the dimensionalized applied current. Thus, for our pulse measurements, we assume that the system is reaction limited,
79
allowing us to neglect solid state diffusion in the particles.
The system consists of a single active material particle in an idealized electrolyte, corresponding to a half cell electrode. We define ϕ = ϕs − ϕ+ as the difference between the solid and electrolyte potential, which is the electrical potential difference applied to the kinetic interface. Within this single-particle model, the electrolyte potential applied to the single particle is denoted as ϕ, while the current is i, representing the rate of lithium-electron pairs intercalating or deintercalating into the active material. The relationship between the current and potential is dictated by the reaction kinetics, modeled by the coupled-ion electron transfer kinetics. To account for the complexities of a full cell, further extensions to the model are required as discussed below.
Full cell model
In a realistic electrode, the single particle model falls short at accurately capturing the cell level transport limitations. To represent these interactions more realistically, electrode scale models are employed, which more accurately capture the interplay between electrolyte transport and kinetics within the electrode. Since our primary focus is capturing the kinetics of the cell with a specific emphasis on degradation, we aim to incorporate the effects of the interacting cathode and anode in a full cell. From the macroscopic design of an electrode, limitations from electrolyte diffusion/conduction or solid conduction can aid the proper analysis of timescales for pulse selection. 101 However, because of the large amount of carbon additives added in battery manufacturing, solid electronic conduction rarely is limiting. Thus, the limitations from electrolyte transport are often found to be of the most interest in a pulse process. These limitations can be understood using a scaling analysis.
From porous electrode style transport equations in Ref. 86, we observe that electrolyte-scale transport is captured along the electrode with lithium-ion mass conservation in the electrolyte,

where ε is the porosity, cl is the lithium concentration in electrolyte, ν+ is the number of ions per molecule of neutral salt, Fl,+ is the flux of lithium ions, and RV,+ is the volumetric reaction rate of the lithium ions. Charging occurs during the electrode process timescale as

where PL is the volumetric electrode loading, I is the C-rate of the electrode, and ρs is the lithium site density of the active material. If measurements occur within this timescale, we can properly capture the pulse reaction dynamics. Analogously, the measurement timescale is the experimental timescale at which measurements are extracted, τm,l = tpulse. For electrolyte diffusion limitation, we observe that

which is the timescale on which electrolyte diffusion occurs, where a is the Bruggeman scaling coefficient, Ll is the electrode length, and Dl is the effective electrolyte diffusivity. For electrolyte conduction, we observe that

is the electrolyte transport timescale, where z+ is the valence of lithium ions, σi
is the electrolyte conductivity, and  is the transference number. When the process timescale, electrolyte diffusion timescale, and electrolyte conduction timescales are compared, the necessary measurement timescales become apparent. Using electrolyte transport parameters from Ref. 103, we observe that τD,l
∼ 10 s and τσ,l
∼ 10 s. This indicates that electrolyte transport limitation occurs after the pulse is taken if measured around τm,l
∼ 1 s. Thus, we avoid transport limitation when the measurement timescale τm,l
is selected properly, and can use these approximations then. Thus, in the context of a full cell, when a voltage hold is applied, only the voltage difference ϕapplied = ϕs,c
− ϕs,a
between the cathode and the anode is controlled. (In this full cell, we use the subscript a to refer to the anode, and the subscript c to refer to the cathode.) From the full cell constraint on the system, the total amount of cathode reaction must equal the anode reaction. The solid electrical potentials, ϕs,c
and ϕs,a
, can be determined through a porous electrode theory model using current or voltage constraints. Overall, our simple full cell electrode model has the governing equations
is the transference number. When the process timescale, electrolyte diffusion timescale, and electrolyte conduction timescales are compared, the necessary measurement timescales become apparent. Using electrolyte transport parameters from Ref. 103, we observe that τD,l
∼ 10 s and τσ,l
∼ 10 s. This indicates that electrolyte transport limitation occurs after the pulse is taken if measured around τm,l
∼ 1 s. Thus, we avoid transport limitation when the measurement timescale τm,l
is selected properly, and can use these approximations then. Thus, in the context of a full cell, when a voltage hold is applied, only the voltage difference ϕapplied = ϕs,c
− ϕs,a
between the cathode and the anode is controlled. (In this full cell, we use the subscript a to refer to the anode, and the subscript c to refer to the cathode.) From the full cell constraint on the system, the total amount of cathode reaction must equal the anode reaction. The solid electrical potentials, ϕs,c
and ϕs,a
, can be determined through a porous electrode theory model using current or voltage constraints. Overall, our simple full cell electrode model has the governing equations
from the equality of the total anode and cathode reaction, where the reaction rates are defined with Eq. 3. In this equation, f represents the dimensionless factor  , which relates the particle scale current to the electrode scale current densities for each electrode, where L is the length of the electrode, PL
is the volume loading of the solid material at the electrode, ε is the porosity of the electrode material, Ap
is the particle area, Vp
is the particle volume, and
, which relates the particle scale current to the electrode scale current densities for each electrode, where L is the length of the electrode, PL
is the volume loading of the solid material at the electrode, ε is the porosity of the electrode material, Ap
is the particle area, Vp
is the particle volume, and  indicates the averaged parameter over the entire electrode. For the current density descriptions, ia
and ic
are the average particle level intercalation currents densities at the cathode and anode, while icell is the total cell level intercalation current density. From the two constraints in Eq. 10, in a current control system, the cell current is fixed and the two voltage variables ϕa
and ϕc
are determined through the constraints. In contrast, for a voltage control system, the difference between the cathode and anode voltages, ϕc
− ϕa
, is fixed and thus the cell level current and absolute voltage values are variable.
indicates the averaged parameter over the entire electrode. For the current density descriptions, ia
and ic
are the average particle level intercalation currents densities at the cathode and anode, while icell is the total cell level intercalation current density. From the two constraints in Eq. 10, in a current control system, the cell current is fixed and the two voltage variables ϕa
and ϕc
are determined through the constraints. In contrast, for a voltage control system, the difference between the cathode and anode voltages, ϕc
− ϕa
, is fixed and thus the cell level current and absolute voltage values are variable.
Cycling conditions
Current pulses
When subjecting two cells to an identical current pulse, one in a nondegraded condition and the other in a degraded condition, differences emerge in voltage behavior. In contrast, the full cell current values are the same for both the nondegraded and degraded cells because of the current constraint. From the current constraint in a nondegraded cell, Eq. 10 holds. In a degraded cell, an analogous current constraint holds as

but the voltage response is different. The voltage difference in the nondegraded cell is ϕs,c − ϕs,a . For the degraded cell, it contains an additional term from the voltage shift for degradation, resulting in Δϕs,c − Δϕs,a + (ϕs,c − ϕs,a ). The two current hold equations (Eqs. 10, 11) can be solved for the exact solution of the voltage difference. Though an approximate linear solution of this model can be derived for the half cell, there is no absolute fitness for the full cell since the reference potentials between electrodes are arbitrary (the half cell linearizations are shown in Appendix D). The only viable solution is an implicit solution for the current pulses.
Voltage pulses
Analogously to the current pulses, we target an exact solution for the potential shift by resolving the current constraints. Voltage pulses have an advantage over current pulses in phase-separating materials, since most voltages chosen are outside the voltage corresponding to the miscibility gap in phase separating materials. In addition, the non-coupled behavior of voltage control avoids particle-by-particle and other population effects seen in current pulses, 75 since all particles are connected to the electrolyte. To streamline our analysis, new notation (such as the fitness variable W) is introduced.
When a cell is subject to a voltage pulse before degradation occurs, the resulting current response is denoted as  upon degradation, the degraded response is i. We establish a relationship between the responses with the fitness
  , which is the ratio between the degraded and nondegraded current. This describes the change in rate capability of the battery
51
by linking it to physical degradation parameters. The exact solution of the current ratios for one electrode is the fitness
, which is the ratio between the degraded and nondegraded current. This describes the change in rate capability of the battery
51
by linking it to physical degradation parameters. The exact solution of the current ratios for one electrode is the fitness

Since the same voltage is applied before and after degradation, it can be seen from Ref. 51 that a linear approximation can be applied to the degradation parameters since the degradation amount is small. The fitness is found for a coupled ion-electron transfer reaction to be
This equation provides direct physical insight into the factors influencing each degradation mechanism, and indicates that the contribution of each degradation mechanism is separable. There are many advantages to applying the fitness framework relative to the analysis of raw electrochemical measurements, expounded in Ref. 51. The linearized fitness framework is shown to be accurate at small amounts of degradation, which is true for any operational battery. In addition, each degradation mechanism is separable using this framework, simplifying the attribution of rate capability loss to specific degradation mechanisms. When there is minimal degradation, the explicit physical separability is shown in Eqs. 22 and 23 in Ref. 51 for the Butler-Volmer and coupled ion electron reaction models respectively, and reiterated in Eq. 13 in the current work. The explicit relationship between the rate capability and each degradation mechanism also eases numerical computation, in contrast to implicit solutions. Finally, the rate capability loss of each of the mechanisms is also physically correlated with kinetic parameters, introducing physical interpretability to the framework. The physical interpretability is introduced by kinetic parameters that modulate the influence of degradation on fitness reduction. Specifically, the film resistance mechanism correlates with the differential conductance, denoted as  100
, which characterizes the rate of current acceleration in response to an increase in potential. For a coupled ion-electron transfer reaction, the differential conductance reaches a maximum from the limiting current (observed in Fig. 6b for a nickel manganese cobalt oxide electrode material). In comparison, using a Butler-Volmer reaction model will cause the differential conductance to grow exponentially. Both calculations are shown in Appendix D of Ref. 51. Thus, the Butler-Volmer reaction model would indicate a higher impact of film resistance on the rate capability of a particle. Similarly, the electrolyte concentration mechanism is primarily related to the reduction current fraction in the total current,
100
, which characterizes the rate of current acceleration in response to an increase in potential. For a coupled ion-electron transfer reaction, the differential conductance reaches a maximum from the limiting current (observed in Fig. 6b for a nickel manganese cobalt oxide electrode material). In comparison, using a Butler-Volmer reaction model will cause the differential conductance to grow exponentially. Both calculations are shown in Appendix D of Ref. 51. Thus, the Butler-Volmer reaction model would indicate a higher impact of film resistance on the rate capability of a particle. Similarly, the electrolyte concentration mechanism is primarily related to the reduction current fraction in the total current,  for the coupled ion electron transfer model. This arises because electrolyte concentration only participates as a reactant in the reduction reaction. In contrast, when using the standard Butler-Volmer reaction model, the differential conductance replaces the reduction current fraction as the kinetic prefactor modulating degradation effects on rate capability, shown in Eq. 22 in Ref. 51. This indicates a larger sensitivity of the fitness with the Butler-Volmer model with respect to the electrolyte concentration. Overall, using a Butler-Volmer expression indicates a stronger impact of degradation parameters on fitness loss than the coupled-ion electron transfer model, which is more physically motivated.
The kinetic parameters that modulate degradation effects on fitness changes, such as differential conductance, are significantly influenced by the correct choice of exchange current density and reorganization energy. For example, use of larger exchange current densities increase the magnitudes of the differential conductance. Similarly, changes in the reorganization energy modify the overpotential corresponding to the limiting current, which rescales the overpotential dependence in differential conductance. Thus, use of accurate kinetic parameters is crucial to the applicability of this framework.
As we extend the half cell model to a full cell, the presence of degradation, characterized by kinetic changes in the electrodes, introduces a shift in the behavior of the system. When the system is degraded, due to the current constraint requirement and the altered kinetics, the same absolute potentials ϕs,c,a cannot be applied to the cathode and the anode. This discrepancy arises because the equality in current is no longer maintained. To ensure the current constraint is still satisfied on the full cell, there is a necessity for a potential shift Δϕ to be applied to both the solid potential at the anode and cathode. Consequently, the voltage in this degraded full cell is calculated as (ϕs,c + Δϕ) − (ϕs,a + Δϕ) = ϕs,c − ϕs,a , resulting in the same experimental voltage as previously measured. In short, this shift in potentials at both electrodes is essential to maintain the current constraint in the presence of degradation.
We use specific notation to distinguish between fitness values with (W) and without ( ) the voltage shift. Analogously to Eq. 10, with the inclusion of the voltage shift, the modified current constraint fa
ia
(ϕs,a
+ Δϕ) = − fc
ic
(ϕs,c
+ Δϕ) holds. This equation is solved implicitly to determine the value of the voltage shift. Once the voltage shift is determined, the fitness W can then be found by ensuring equality of the fitness values between the cathode and anode in the full cell as
) the voltage shift. Analogously to Eq. 10, with the inclusion of the voltage shift, the modified current constraint fa
ia
(ϕs,a
+ Δϕ) = − fc
ic
(ϕs,c
+ Δϕ) holds. This equation is solved implicitly to determine the value of the voltage shift. Once the voltage shift is determined, the fitness W can then be found by ensuring equality of the fitness values between the cathode and anode in the full cell as

Linear approximation for degradation
Though we have found an exact implicit solution for this problem, implicit solutions can be computationally inefficient, particularly for optimization processes. Obtaining an explicit solution for complex problems can significantly reduce optimization time and provide valuable physical insights. We take advantage of the explicit linearized fitness framework and perform a first-order linearized approximation for the voltage shift to simplify the calculations. After linearization for the voltage shift, we apply the fitness approximation of the half cell described in Eq. 13, generating an explicit expression for effects of degradation on the response. This approach combines computational efficiency with a high degree of accuracy. Eq. 14 holds true in the exact solution of a voltage pulse problem. However, the full cell fitness is not only defined by the effects of degradation as the half cell fitness is, but also by a voltage shift from ensuring current equality between the two electrodes. We attempt a simple linear approximation to capture these effects. Initially, using the linear approximation in each electrode for the rate capability, the fitness without the voltage shift is found to be the current ratio  . To include the effects of the voltage shift, we introduce χ, which denotes the fractional change in the current with potential shift relative to that without

The overall fitness is obtained through the ratio of degraded Eq. 10 with the nondegraded version, resulting in

This expression captures the overall change in current in the full cell, incorporating both degradation and voltage shift effects when there is less degradation. The full cell fitness thus captures the half cell fitnesses with the inclusion of a voltage shift term. To the first order, the voltage shift term can be approximated using a Taylor expansion on χ based on the voltage shift:

Applying this approximation to Eq. 16, the voltage shift is approximated as

with Eq. 10 constraining the full cell current equality. Thus, using Eqs. 17 and 18, the overall fitness is a weighted sum over the cathode and anode fitnesses

which approximates the shifted fitness by considering the voltage change. This expression is a reweighted sum of the ratio between the electrode scale and kinetic capabilities of the electrodes, where f represents the rescaling to the electrode area from the particle area and  is the differential conductance, reflecting the kinetic capability of the electrode material. The explicit representation of the fitness term in a full cell offers a direct physical understanding of asymmetric effects from each electrode in a full cell model. The conductance ratio
  represents a ratio of the conductances of the cathode relative to the anode. This ratio is influenced by both material properties and electrode design, particularly the reactive surface area. From the limiting values of the formulae, the results of the full cell indicate that when the anode differential conductance is larger than that of the cathode, the fitness of the cathode dominates the full cell. Conversely, if the cathode differential conductance is larger than that of the anode, the fitness of the anode dominates. The conductance ratio thus aids distinguishing between electrodes by the different scales modulating the half-cell fitness influences on the full cell.
In most balanced full cells, fa ∼ fc to minimize total mass of the cell, causing fa /fc to be constant and electrode design dependent (neglecting small changes from degradation). The main variable affecting the conductance ratio is the differential conductance of the cathode and the anode. These are dependent on the kinetic properties of the intercalation reaction occurring in the electrode, as well as the state of charge and applied voltage. An electrode is referred to as "overpotential dominant" when the overpotential at one electrode is significantly larger than that at the opposing electrode, which often occurs when the exchange current densities of the electrodes differ by orders of magnitude. This concept relates to the dominance of the performance of one electrode to overall cell behavior. Special cases with respect to half cell electrodes or switching between dominant electrodes are considered in Appendix F.
The explicit calculations from the linear approximation accelerate the optimization process compared to the implicit exact solution. The linearized model almost exactly matches the implicit solution in the feasible range of degradation for the dominant electrode. For instance, consider a NMC532-graphite cell in which the anode is potential dominant. The linear and exact approximate values from voltage pulses are plotted in Fig. 2, where differential conductance is derived in Appendix D in Ref. 51. A good match is seen at the overpotential dominant electrode (anode), whereas at the non overpotential dominant electrode (cathode), the fitness values are smaller and the accuracy is reduced.

Figure 2. Goodness-of-fit results for the linear approximation and the exact calculation of the fitness W for each degradation mechanism in a full cell NMC532-graphite cell for a 100 mV (dis)charge pulse are shown at various states of degradation, from least to most degraded at a cathode state of charge of 0.8 and anode state of charge of 0.4. The effects of film resistance on the (a) cathode and (d) anode, the surface blockage of the (b) cathode and (e) anode, and the (c) electrolyte concentration loss are plotted for this cell at values close to the initial nondegraded state.
Download figure:
Standard image High-resolution imageSimulated Diagnostics
Virtual experimental design
Our primary goal of understanding pulses is to employ them in full cell diagnostics to quantitatively assess the extent of degradation in a cell. Determining the absolute degradation level in a specific cell is challenging due to significant variability between cells during manufacturing. 104,105 Instead, we aim to establish a relative measure of degradation for each cell compared to its initial state, enabling more meaningful evaluation of battery degradation across different cells.

Figure 3. HPPC simulation shown for a single pulse size, with six different values of state of charge c0 where the pulses are performed, with slow charges between the different state of charge values. The pulse experiments are repeated for each pulse value. The pulses are performed using the protocol in Algorithm 1.
Download figure:
Standard image High-resolution imageBased on our theory of voltage pulse measurements, Eq. 13 illustrates that degradation parameters influence half-cell kinetics jointly with kinetic-related parameters such as the differential conductance or the reduction current fraction. Figures 4bc present the kinetically related differential conductance values and reduction current fractions at different states of charge and overpotentials, while Fig. 4d displays the effect of the surface blockage on the current at different states of charge. Applying high overpotentials generates a wide range of differential conductance values, which influences the calculation of the film resistance. The reduction current fraction is subject to a singularity when there is no current. This is seen in the denominator of the reduction current fraction for the CIET reaction model,

This indicates that in the linearized approximation, higher voltage pulse values have more numerical accuracy for estimating electrolyte loss. On the contrary, overpotential does not influence the fitness calculation for the surface blockage mechanism, and instead variations in states of charge are needed to observe changes in the current response. In summary, a wide spectrum of states of charge and large voltage pulse sizes are necessary to differentiate between the various degradation mechanism values. These considerations are valuable for designing industrial HPPC tests, where previously the choice of pulse size is arbitrary. 38

Figure 4. a) Tafel plot for a coupled-ion electron transfer reaction relative to the overpotential for a NMC532 model at different states of charge, which gives rise to different differential conductance behavior as well as reduction current fraction in the next two plots. b) Differential resistance values for a NMC532 model captured at different overpotentials for various states of charge are plotted. Specifically, pulses at 5, 20, and 100 mV overpotentials are plotted at the red points. c) Reduction current fraction is plotted with respect to different overpotentials. State of charge variation plays a minimal role in the reduction current fraction, causing reduction current fractions at different SOC values to overlap. The reduction current fraction values for pulse experiments at 5, 20, and 100 mV overpotentials are shown as red points. d) Kinetic fraction of surface blockage is plotted at different state of charge values for varying overpotentials.
Download figure:
Standard image High-resolution imageTo account for the needs of varied pulse sizes and states of charge, we design a set of HPPC experiments, shown in Algorithm 1, that perform voltage/current pulses relative to the open circuit voltage at various states of charge for a single pulse size. This method is able to capture physical degradation mechanisms, and more importantly, quantify and separate each physical degradation mechanism, especially the dominant mechanism.
Virtual experimental procedure
The procedure is to perform current or voltage pulses of size icell or ΔV in our HPPC analysis with alternating pulses and rest states (Algorithm 1). Knowledge of the open circuit voltage curve OCV(c0) is necessary for this design structure, which may be difficult to validate once degradation occurs in a full cell. To ensure closeness to the true open circuit voltage curve, we perform voltage holds in between states of charge to ensure minimal influence of kinetics. 100 The rest and pulse times can vary with different battery material and design.
Algorithm 1. HPPC protocol.
for
c0 in all states of charge tested do
/* move the battery to the next state of charge*/ do a 0.05 C current hold until the voltage is at OCV(c0); /* rest the battery*/ do a zero current hold for  ;
; /* equilibrate the battery to reduce the kinetic effects from moving to the next state of charge*/ do a voltage hold at OCV(c0) until the current magnitude is less than 0.001 C; /* rest the battery*/ do a zero current hold for  ;
; /* perform a charge pulse*/ do a voltage or current hold for  at OCV
  or
or  current;
 /* rest the battery*/ do a zero current hold for  ;
; /* perform a discharge pulse*/ do a voltage or current hold for  at OCV
  or
or  current;
end
Simulation Results
For each system, the HPPC protocol denoted in Algorithm 1 is executed using multiphase porous electrode theory simulations 101,106,107 implemented in the open-source MPET software package, 86 which captures the electrode scale transport and particle scale kinetics in a full cell battery electrode. Porous electrode simulations capture the transport and kinetics of an electrode at two scales, with transport at the electrode scale covering electrolyte diffusion/conduction and solid conduction, and reactions/solid diffusion occurring at particle level. Simple one-dimensional Cahn-Hilliard 88 (similar to reaction-diffusion) models are used to capture particle dynamics, modified to include fluxes from phase separating thermodynamics. Conservation equations for lithium ion mass and charge are applied at the electrode scale, capturing macroscopic transport between the cathode, separator, and anode. The current responses from voltage pulses, and voltage responses from current pulses, are used to optimize for the state of degradation and compared with the reference solution. The fitted solutions are extracted from pulse responses for the HPPC protocol at both the degraded and nondegraded states.
The objective function was assessed at the initial time measurement of the pulse from simulations, chosen for its accuracy in capturing kinetic information. We formulate the objective functions for minimization to ensure that each state of charge carries equal weight. For voltage pulses, the objective function is

while for current pulses, the objective function is

where  are the degradation parameters under consideration. The fmincon function in MATLAB was used to execute the optimization procedure. The code for the procedure is provided in lightningclaw001/public_paper_scripts under the folder smart_HPPC (https://github.com/lightningclaw001/public_paper_scripts/tree/main/smart_HPPC).
The optimization tests are conducted on a NMC532-graphite full cell. The kinetic parameters of exchange current density and reorganization energy were extracted from a large set of measurements for a wide range of materials, including pulses and impedance, in Ref. 60. Kinetic parameters for NMC532 and graphite were estimated from this dataset. Electrode scale parameters are obtained from Ref. 67. Specific details regarding the porous electrode scale and kinetic parameters used are reported in Appendixes A and B. A range of degradation parameters are assessed across various degradation states, spanning nine points from least to most degraded. Timescales of τrest = 20 min and τpulse = 0.6 s for resting and pulsing are employed, which was sufficient for relaxation in the simulations. For the cathode, the filling fraction values of c0 are set from 0.3 to 0.8 with a spacing of 0.1, which encompassed a total of six state of charge values for the cathode. The anode filling fraction values correspondingly varied from 0.9 to 0.4. The filling fraction values are derived from the parametrized ranges of the active material. Voltage pulses of 100 mV or current pulses of 0.1 C are applied, corresponding to the typical magnitude of common HPPC experiments. 38,79
As seen in Fig. 4, the use of high voltage pulses allows for a broader range of information to be extracted due to wider variation in differential conductance values. This leads to more precise results for the film resistance values. Moreover, the utilization of higher filling fractions assesses a wide variance of surface blockage prefactors, as seen in Fig. 4d. This accounts for the increased sensitivity of surface blockage effects at lower filling fractions for the cathode, corresponding to higher filling fractions for the anode.
The optimization solutions for the exact method and linear approximation are shown in Fig. 6 for the voltage and current pulses respectively. With the large number of possible degradation mechanisms, only the dominant degradation mechanisms can be captured feasibly because of the insensitivity of degradation at the non-dominant electrode. This is mainly because of the differing electrode sensitivities, as observed in Fig. 5. Hence, multiple simulations are performed where the dominant degradation mechanism is different for each, plotted in Fig. 6. Some optimization error can be attributed to the averaging of porous electrode scale effects.
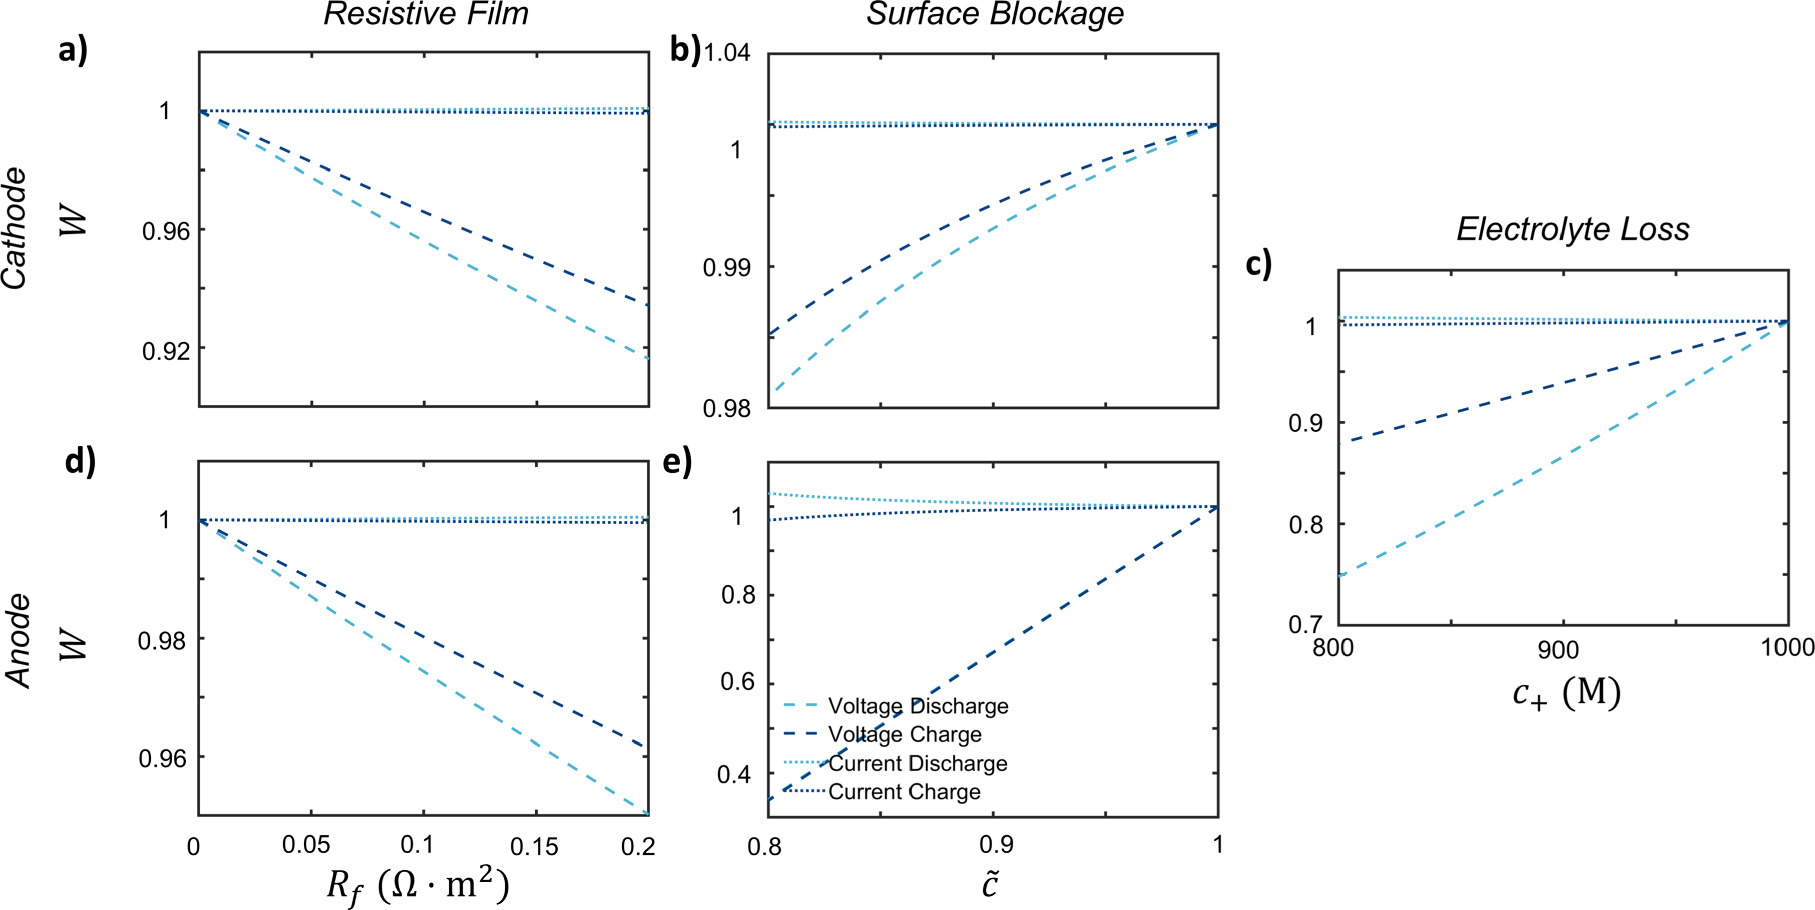
Figure 5. Sensitivity analysis of each degradation mechanisms on the fitness W for a NMC532-graphite cell for a 100 mV (dis)charge voltage pulse or for a 1 C (dis)charge current pulse at a cathode state of charge of 0.8 and anode state of charge of 0.4. The effects of (a) film resistance for the cathode, (b) the surface blockage for the cathode, (c) the electrolyte concentration, (d) the film resistance for the anode, and (e) the surface blockage of the anode are plotted for this cell for values close to the initial degradation state.
Download figure:
Standard image High-resolution image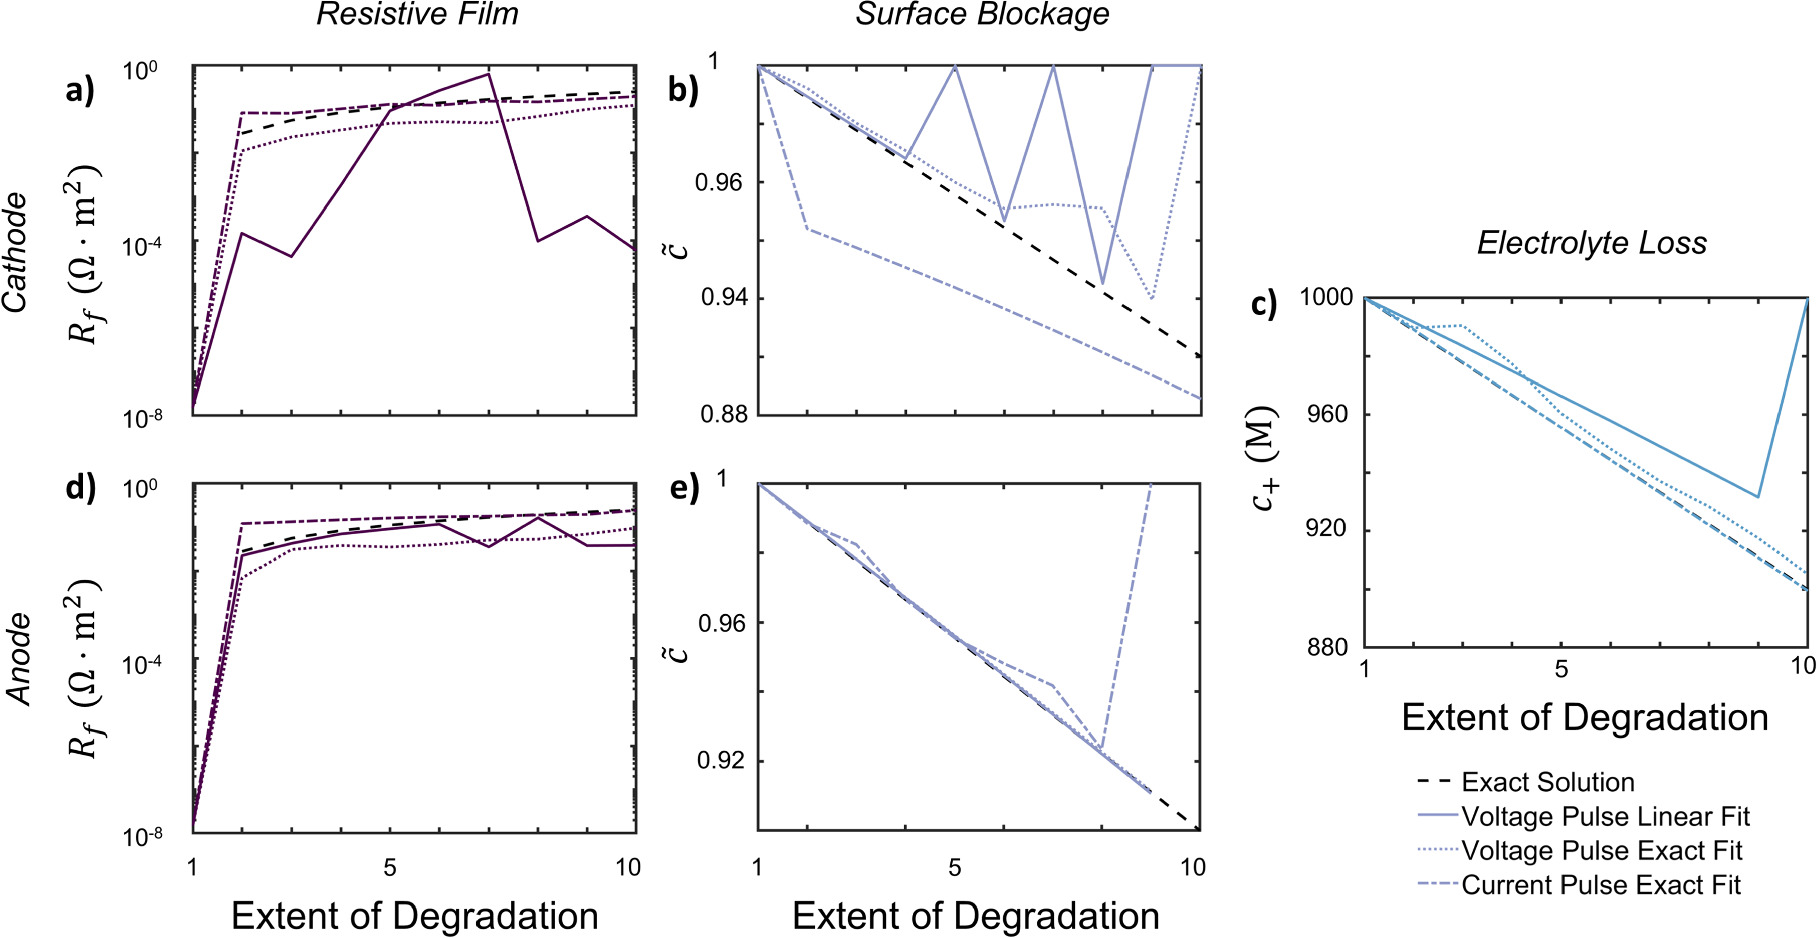
Figure 6. Comparison of fitting linearized or exact objective functions to simulated results for full cell simulation for NMC532-graphite at ten different degradation points for each degradation mechanism for voltage/current pulse HPPC is shown. (a, d) are the film resistance mechanisms for the cathode and anode; (b, e) are the surface blockage mechanisms for the cathode and anode, and (c) is the electrolyte loss mechanism.
Download figure:
Standard image High-resolution imageFor the current pulse results, only optimization results from the exact solution can be obtained. In contrast, for the voltage pulse results, both the exact solution and linearized result are calculated. The linear approximation exhibited a significant advantage in terms of computational efficiency. From the optimization speed, the linear approximation averaged roughly 1s for each degradation state, relative to roughly 100 s per degradation state for the exact solution. For the current pulses, the computational demands are more substantial. A single current pulse took 200 s to solve, since separate cathode and anode potentials are extracted, increasing the number of variables in the system. In summary, optimizing from voltage pulses was more efficient than current pulses. Specifically, the linearized approximation for voltage pulses had a tenfold speed-up relative to the exact solution, which only required a small trade-off in accuracy.
Due to the large number of degradation parameters, a sensitivity analysis was performed on the full cell to understand the dominance of different degradation mechanisms (Fig. 5). Voltage and current pulses using the implicit solutions are used for this analysis. Current pulses appeared extremely insensitive relative to voltage pulses in extracting degradation mechanisms, highlighting a benefit of using voltage pulses. The higher sensitivity of anode degradation parameters can be attributed to the lower exchange current density of graphite, which is approximately two orders of magnitudes lower than that of the nickel-rich material in the model. This causes overpotential dominance at the graphite anode.
In the sensitivity calculations for voltage pulses, we observe asymmetry between the charge and discharge directions for almost all degradation mechanisms. For the overpotential dominant electrode, sensitivity of degradation parameters depends on the fitness of the overpotential dominant electrode since  from Eq. 19, where
  is the fitness of the overpotential dominant electrode. The directionality of intercalation at the overpotential dominant electrode during charge or discharge controls the sensitivity of the cell fitness. In the current cell setup, the overpotential dominant graphite anode deintercalates during discharge and intercalates during charge. Specifically as seen in Fig. 4bc, the magnitudes of differential conductance and reduction current fraction during deintercalation are both larger than the intercalation values. Since these parameters relate the fitness to the degradation parameters, the fitness is more sensitive during discharge, when the anode is deintercalating, compared to charge, as seen in Fig. 5c,d for these two degradation mechanisms. In contrast, since the surface blockage mechanism is not potential dependent, no asymmetry appears between the charge and discharge directions for the anode as seen in Fig. 5e. Overall, when degradation parameters are at the overpotential dominant electrode or affect both electrodes, the sensitivity of cell fitness is dominated by the fitness of the overpotential dominant electrode.
For the degradation parameters at the non overpotential dominant electrode, simplifications lead to

where d indicates overpotential dominant, nd is non overpotential dominant, and  is the fitness at the non overpotential dominant electrode. From the definition of a overpotential dominant electrode, this indicates that the conductance ratio between electrodes is large, meaning that the prefactor
  is necessarily large. Thus, the conductance ratio is more significant on the full cell fitness relative to the fitness of the non overpotential dominant electrode
  . The larger differential conductances during intercalation in the cathode, as seen in Fig. 5a, result in higher sensitivity in the cell fitness when discharging, where the non overpotential dominant cathode is intercalating, relative to charge. Unlike the overpotential dominant electrode, when degradation parameters are at the non overpotential dominant electrode, the cell fitness is dominated by the conductance ratios in the cell and not the fitness of the non overpotential dominant electrode. This elucidates the difficulty in resolving degradation mechanisms at non dominant electrodes.
Overall, a clear distinction between the information gain between charge and discharge pulses is observed. The information gain is asymmetric and depends on both the battery state of charge and overpotential dominance of electrodes. In degradation at both electrodes, the direction where the overpotential dominant electrode deintercalates is more sensitive. This is caused by asymmetry in kinetic factors correlating degradation to fitness for the overpotential dominant electrode, or dominance of the conductance ratio from the non overpotential dominant electrode. When the anode is overpotential dominant, discharge pulses contain more information about degradation, while the opposite is true when the cathode is overpotential dominant.
The results from these optimization procedures highlight the advantages of utilizing voltage pulses in this context. When it comes to learning degradation mechanisms, the necessity for optimization is evident, and mathematically simplifying the optimization problem becomes important. Voltage pulses offer several distinct advantages. Firstly, they are able to quickly and explicitly approximate extent of degradation with the explicit expression, resulting in a significant reduction in fitting time, often by two orders of magnitude. This efficiency can be highly beneficial in practical applications. In addition, the sensitivity of current pulses is much weaker as compared to voltage pulses, as seen in Fig. 5. The stronger sensitivity of voltage pulses makes them a more effective diagnostic tool for capturing degradation behavior. Importantly, compared to current pulses, which introduce much nonlinear behavior from the coupled current control equation, fewer population effects appear from voltage control systems. Furthermore, voltage pulses are physically similar to rate capability and directly related to degradation mechanisms as seen in the explicit approximation. The ability to gain deeper insights into the underlying physical mechanisms makes voltage pulses a superior choice in diagnostics.
Conclusions
The goal of this work has been to enhance the physical understanding of HPPC protocols as a means to diagnose battery degradation behavior. Such detailed physical information transcends the conventional lumped degradation modes, which merely offer insights into the "symptoms" of battery degradation. In this work, models for both current and voltage response during the pulse have been created, generating expressions directly relating physical degradation parameters and the observed response. Furthermore, we have demonstrated the benefits of using voltage pulses instead of current pulses, including stronger sensitivity with respect to degradation, explicit linear extraction of degradation mechanisms, faster optimization, and mitigated population effects relative to current pulses for phase separating materials. Discharge pulses are found to contain more information in cases of anode overpotential dominance, while charge pulses are better for cathode overpotential dominance. We have shown that it is possible to extract the dominant degradation mechanisms from each electrode with a physics-based optimized HPPC protocol. This is key to tying together physics-based modeling 106,107 with degradation diagnostics obtained from battery experiments without the need for "lumped" degradation modes commonly used in battery degradation. 49,108 With these physical degradation parameters, we can diagnose the physical-driven reasons for battery failure and, in turn, design future batteries to mitigate capacity loss.
Our derivations provide some useful general physical insights. The overpotential-dominant electrode with slower kinetics tends to dominate full cell electrochemical responses, which makes it difficult to probe the properties of the other electrode. For pulse schemes, the corresponding fitness variables are directly proportional to the ratio of instantaneous power. This understanding is important, since assessing instantaneous power output is challenging without conducting experiments. These straightforward and explicit linear approximations provide a direct link between physically meaningful degradation parameters and power, offering a simplified pathway for evaluating the state of health of a battery system. Even without experimental validation, the increased physical understanding behind sensitivity and information gain in pulses, as well as pulse design methods in a full cell and the limitations of these techniques, are useful and can be applied to optimal design.
We envision that in the future, these methods could help detect critical transitions in degradation, often referred to as "knees," where it has been predicted that the electrode undergoes major changes in degradation. 109,110 Such transitions are challenging to discern using conventional techniques, but our method allows for the determination of dominant degradation mechanisms for each electrode in operando. This provides a pivotal method of detection and prevention of battery failure. In addition, determination of the failure mechanism can also guide the selection of a second life application of the degraded battery. 111–113 Overall, a simple model that provides tractable analytical methods of extracting degradation mechanisms from single particle level was developed in this work, using approximations in Ref. 51. Some drawbacks of our approach include the fact that the impact of degradation on the kinetics of the electrode material must be physically understood to be included in the model. In addition, mathematical models of the reaction kinetics must be selected before the optimization can be performed, although one can imagine automating this process with inverse learning from data. Chemo-mechanics, microstructural effects, 19 and phase separating dynamics have also been neglected in this model. It is also essential to acknowledge that some degradation mechanisms, such as lithium plating and surface degradation in nickel-rich materials, can have similar electrochemical signatures, posing challenges in their differentiation. In addition, though the theoretical analysis of these experiments has revealed much about the practicality and also limitations of HPPC diagnostics, experimental validation is a crucial step. (Experimental validation of our framework is imperative for our desire to apply diagnostics to real life battery systems. However, this can still be circumvented with proper and informed experimental design, such as avoiding the voltage gap attributed to the spinodal region.) Forthcoming works will be focused on improved design-of-experiments for optimal HPPC and rigorously verifying these methods through experiments.
Acknowledgments
This work was supported by the Toyota Research Institute through D3BATT: Center for Data-Driven Design of Li-Ion Batteries. The authors are grateful to Yash Samantaray, Diego Rivera, Huada Lian, Dimitrios Fraggedakis, Jinwook Rhyu, Shakul Pathak, and Dan A. Cogswell for useful discussions.
Appendix A.: Variable Definitions
For ease of readability, variable definitions are placed in the following table. The subscript a depicts the anode, and the subscript c depicts the cathode. Bars above variables are used to define the value of the variable without any degradation or potential shift (e.g.,  ). Hats are used to define the variables without any voltage shift (e.g.
  ). The real solution is given without any hats or bars (e.g.
  ).
).
| Variable Name | Definition | NMC532 Cathode | Graphite Anode | Units |
|---|---|---|---|---|
| c | lithium concentration in solid | — | – | nondimensionalized |
| i | current density | — | — | A m−2 |
| ired | reduction current contribution to total density | — | — | A m−2 |
| η | overpotential (driving force of reaction) | — | — | kB T |

| exchange current density | 10 60 | 0.2 60 | A m−2 |
| λ | reorganization energy of intercalation solid | 3.78 60 | 5 60 | kB T |
| ε | porosity | 0.4 | 0.4 | nondimensionalized |
| PL | volumetric loading of active material | 0.69 | 0.69 | nondimensionalized |
| L | length of electrode | 5e-5 | 8.7e-5 | m |
| Ap | area of particle p | — | — | m2 |
| Vp | volume of particle p | — | — | m3 |

| mean particle p radius | 1e-7 | 1e-7 | m |
| ThermFac | thermodynamic factor  101
101
| — | — | nondimensionalized |
| Rf | film resistance | — | — | Ω · m2 |

| rescaled capacity | — 20 | — | nondimensionalized |
| c+ | electrolyte concentration | — | — | M |
| W | fitness value  51
51
| — | — | nondimensionalized |
| f | porous electrode rescaling ratio, 
| 626.8 | 1100.6 | nondimensionalized |
| χ | current ratio before and after potential shift i(ϕs + Δϕ)/i(ϕs ) | — | — | nondimensionalized |
Appendix B.: Full Cell Simulation Parameters
In the full cell, 10 volumes were used to discretize the cathode and the anode, while 5 volumes were used to discretize the separator. Both the relative and absolute tolerance were set to 1 × 10⁻⁶. The temperature in the simulations was set to 298 K. It was assumed that there was enough carbon additives in the cell to cause the solid conductivity to have minimal effects. The Bruggeman exponents for the tortuosity were set to 1.5 for the cathode, the anode, and the separator. 114 A Stefan-Maxwell concentrated electrolyte model where the thermodynamic factor, diffusivity, and transference number were from Ref. 103 and the conductivity was from Ref. 56 was used in our parametrization. In the particle scale models, a Cahn-Hilliard reaction-diffusion model 88 was used to describe the solid particles, with spherical shaped particles for both the graphite and the NMC532. The explicit activity contribution for the electrolyte is

analytically integrated from Ref. 103.
Appendix C.: Reference Electrode Fitness
Following the protocols in Ref. 51, we see that for a reference electrode, if the foil reaction is defined with a simple Butler-Volmer reaction as

then the differential conductance is found to be

and

Because material-scale degradation does not generally happen at the reference electrode, the linearized fitness for a half-cell electrode is described as

without any dependencies on film resistance or surface blockage from the cathode.
Appendix D.: Current Pulse Linear Approximation
For a model single particle, a current pulse will lead to a voltage response. The voltage response can be expressed in terms of the overpotential fitness variable U, which is defined as the ratio of the measured overpotential in the degraded state and overpotential in the non-degraded state for a half cell. For a half cell, where the direct measurement of the electrode potential is possible, we can write the fitness variable exactly as
Analogous to the linear approximation of current fitness variable in Eq. 13, we also derive a linear approximation of U in the limit of small degradation variables. We perturb the non-degraded state by the degradation variables independently, and multiply each correction to the fitness variable, such that  :
:

Importantly, this equality constraint in the linear approximation highlights one drawback of doing current pulses, primarily being the extra computational effort needed to get a linear estimate of the degradation parameters from current pulses. In the following, we provide derivations of the individual components of  .
.
A useful derivative for the full derivative which is used in later derivations is

where Y can be any degradation variable of Rf
,  , or c+.
Appendix. Film resistance
To determine  , we can write the Taylor expansion of η with respect to Rf
. In this expression, we can directly evaluate D
η/DRf
= ∂η/∂Rf
since ∂i/∂Rf
= 0.
, we can write the Taylor expansion of η with respect to Rf
. In this expression, we can directly evaluate D
η/DRf
= ∂η/∂Rf
since ∂i/∂Rf
= 0.

By the definition of the overpotential, it is clear that the fitness variable is defined as

Appendix. Rescaled capacity
To determine  , we can write the Taylor expansion of η with respect to
  . Since

we see that
Plugging in the values for the differential conductance gives that

where h(η) is the overpotential-dependent part of the reaction as  .
.
Appendix. Electrolyte loss
To simplify calculations, we use the formal overpotential, since this preemptively removes the electrolyte loss dependence from the model. Since

Since  , we can directly use this derived relationship in the Taylor expansion of the overpotential. To determine
  , write the Taylor expansion of η with respect to c+,

Upon combining these equations, we can determine the fitness variable as an implicit formula to the equation
Though these analyses can be done directly for a half cell, they do not provide any inherent information on degradation of the full cell. The full cell fitness is
Because the intercalation potentials for the solid depend on the reference potential, there is no absolute U value that can be calculated for a full cell. Thus, the linearization only works at at the half cell level and cannot be brought to the full cell level.
Appendix E.: Multiple Degradation Mechanisms
A set of full cell simulations of NMC532-graphite with all degradation mechanisms present is shown in Fig. 7. The function does well at separating the dominant mechanism (the surface blockage mechanism for the anode, and then the electrolyte concentration loss mechanism) and quantitatively performs well in separating each of the degradation mechanisms, but does not perform as well qualitatively. The linear model drifts especially at the non kinetically limiting electrode because, as seen in Fig. 2, the cathode values especially do not capture the implicit contribution and drift at larger degradation amounts.
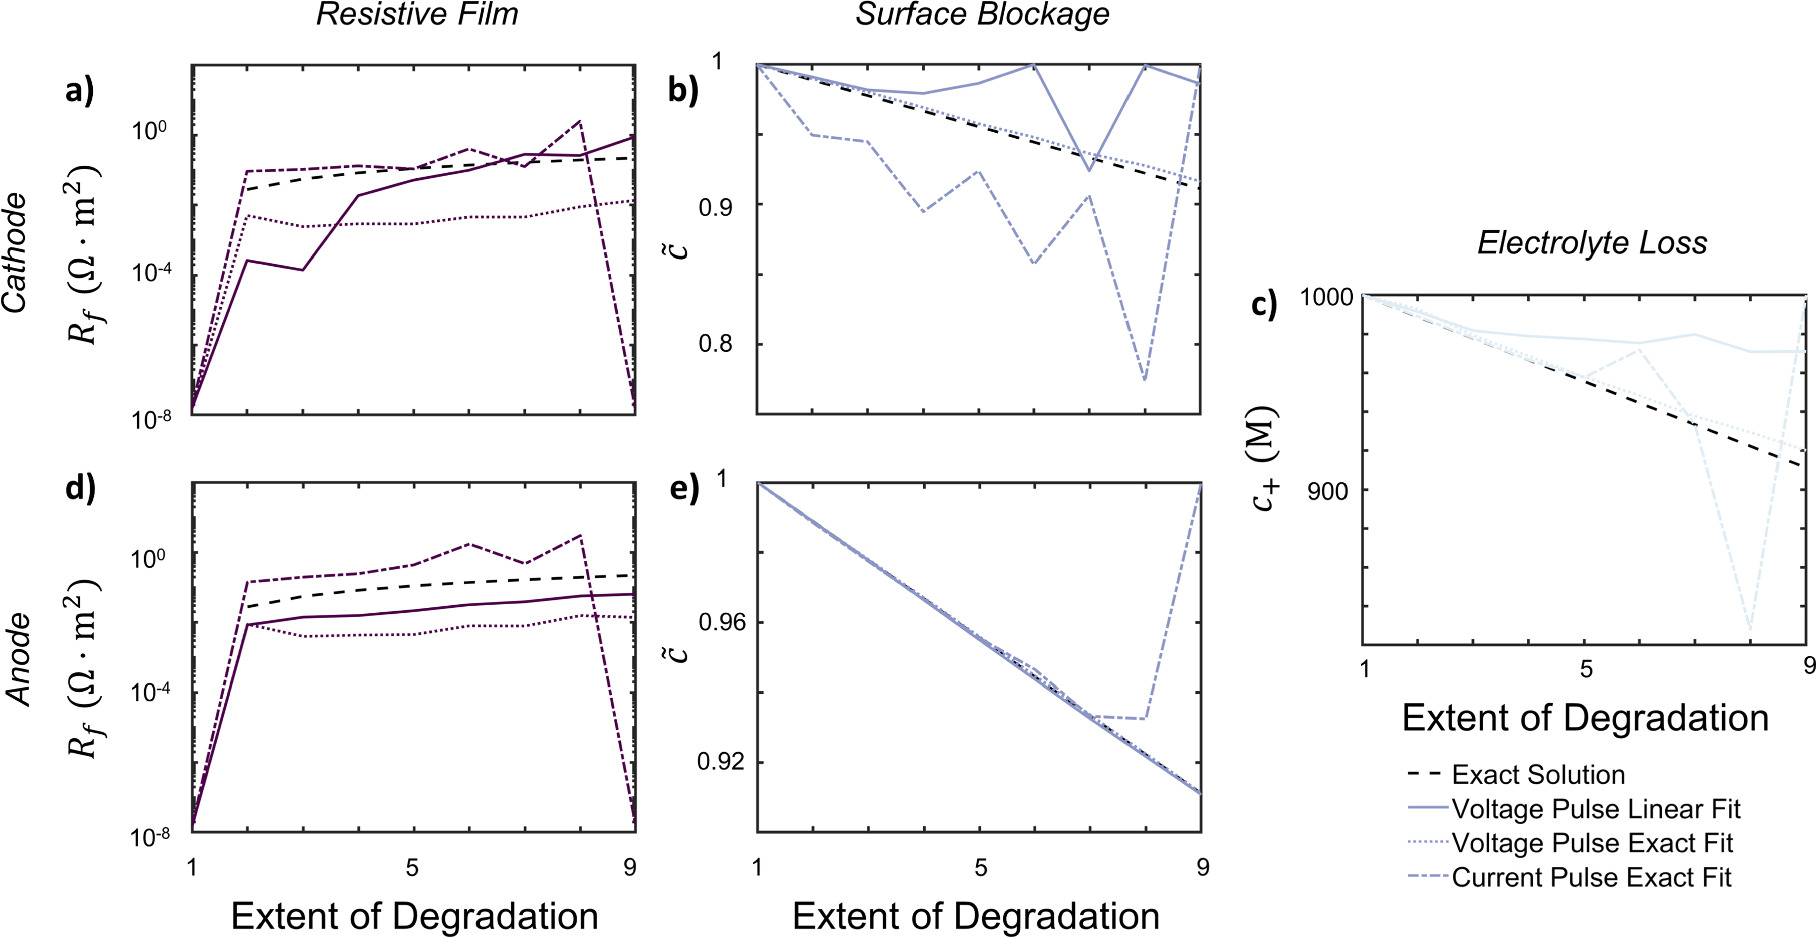
Figure 7. Comparison of fitting linearized objective function to exact results for full cell NMC532-graphite simulation at nine different degradation points for a combined set of simulations with all degradation mechanisms present. (a,d) are the film resistance mechanisms for the cathode and anode, (b,e) are the surface blockage mechanisms for the cathode and anode, and (c) is the electrolyte loss mechanism.
Download figure:
Standard image High-resolution image
Appendix F.: Special Cases of Linearized Fitness
To preferably measure one electrode over the other, special care can be taken to consider the state of charge that the pulse is performed at. Based on the conductance ratio between the electrodes, we can approximate the state of charge dependence on the ratios as  , where the cathode and anode state of charges are related through mass conservation. The approximate weights between the cathode and the anode fitnesses can be tuned by the state of charges used to measure the materials.
A special case is the half cell with a lithium counter electrode. In this scenario, fa
= 1 since the lithium counter electrode is a foil. We also assume there is no degradation at the reference electrode  . As a result, the overall fitness value can be expressed as

In a half cell with a lithium reference electrode, the reference electrode is primarily affected by electrolyte loss and no other degradation mechanisms, as detailed in Appendix C. Due to the fact that the foil only has active area on the surface and not within the electrode, fc /fa ≫ 1, the cathode is always potential dominant. This dominance at the cathode arises from the limited surface area available at the anode, making it difficult to separate the degradation mechanisms at the cathode material. Given this dominance at the cathode, it is not desirable to conduct HPPC pulses on half cells.