

Abstract
Lead-acid battery (LAB) has a huge world market in both energy storage and power supply. However, most LAB failures are caused by the serious corrosion of positive grids. To this, we propose an electrochemical prepassivation strategy to form a compact interphase on the lead-alloy grid surface composed of lead oxides and lead sulfate, exactly the same as lead paste. The results show that the corrosion resistance of pre-passivated lead alloy is improved due to the inhibition of vertical growth of corrosion layer, providing a feasible solution to prolong the service life of LAB.
Export citation and abstract BibTeX RIS
Taking the advantages of intrinsic safety, low cost and high recycling rate, LAB still occupies a huge world market of secondary batteries in both energy storage and power supply. 1,2 LAB employs lead-alloy (Pb-alloy) grids as the current collector and the supporter of electrode active materials. Due to the critical working conditions, e.g., concentrated sulfuric acid (H2SO4) electrolyte environment and high charging/discharging voltage, serious corrosion of positive grids becomes the fatal killer causing the failure of LAB. 3,4 The problem is indeed the random PbO film formed on the Pb-alloy grids when exposed to the air. Because the PbO film is not evenly cover the Pb-alloy grids, corrosion cell will be formed when the lead paste is coated and the H2SO4 electrolyte is injected. The crevice corrosion will be aggravated during the charging and discharging cycles and make the grid broken. 5 On the other hand, the molecular-scaled thickness of PbO film is not sufficient to act as the adhesive inter-layer between the grid and positive active materials (PAM). The volume expansion and contraction of lead paste as well as the gas evolution reaction will make the PAM peeled off from the grid. 6
In order to improve the corrosion resistance of positive grids, noble metals and rare Earth elements 7,8 were doped in the Pb-alloy and, alternatively, additives were added into the sulfuric acid electrolyte. Wu et al. 9 reported that boric acid (H3BO3) could participate in the electrode reactions to form conductive Pbx(BO3)y, which acted as the nucleation sites and facilitated the growth of a dense anti-corrosion oxide layer on the surface of positive grid. Zhong et al. 10 pretreated the Pb-Ag-Nd alloy grid in a fluoride-containing sulfuric acid solution by galvanostatic anodic electrolysis, and found that the obtained PbF2/PbSO4 layer can facilitate PbO2 nucleation during the subsequent formation process and finally form an anti-corrosion layer composed of β-PbO2 and PbSO4. Ngguyen et al. 11 found that Co2+ is helpful to produce homogeneous PbSO4 clusters on the Pb-Ca-Sn alloy in the initial stage of formation and latterly transformed to a thin and dense anti-corrosion film composed of α-PbO2, β-PbO2 and PbSO4. Yang et al. 12 directly electrodeposited a gradient α-PbO2/β-PbO2 oxide layer, which improved the corrosion resistance of positive grids and enhanced the adhesion between the grid and PAM.
Although doping Pb-alloy with noble or rear Earth elements will increase the cost, adding the additives will introduce the impurities and cause the water lose and capacity fading, 13 and electrodepositing PbO2 is time-consuming technologically besides the special equipment, the above work provide an empirical clue on how to improve the corrosion resistance of positive grids, i.e., to grow a thin and dense anti-corrosion interphase on the Pb-alloy grid surface, which has a good affinity to the lead paste, and can participate in the electrode processes just as PAM. In this paper we report a rapid electrochemical prepassivation method to this purpose.
Experimental
All the chemicals and materials used in experiments, including the Pb-Ca-Sn-Al alloy (1.43% Sn, 0.06% Ca, 0.01% Al) and 1.28 g cm−3 H2SO4 solution, were provided by Herou Power Supply Technology Co. Ltd. The Pb-alloy grid was cut into small samples (35 mm × 10 mm × 2 mm) and polished with a series of SiC papers (mesh size: 500, 800, 1000, 1200, 1500) sequentially. The samples were cleaned with alcohol and deionized water alternately and then dried in air. The samples were sealed in epoxy resin leaving a working area of 0.1 cm2 and used as the working electrode. A 2 cm2 Pb plate acted as the counter electrode and a Hg/Hg2SO4 electrode acted as the reference electrode. Prior to each test, the electrochemical system was cathodic polarized at −1.2 V for 20 min to remove the oxides on the working electrodes. Subsequently, the electrochemical prepassivation was performed by fixing the working electrode potential first at 1.6 V for 5 s for the generation of nucleation sites, and then at 1.4 V for 5 s for the growth of passivation layer. Cyclic voltammetry was adopted to test the growth rate of passivation layer, by which the corrosion resistance is evaluated.
Electrochemical experiments were carried out on a CHI760d workstation (Shanghai Chenhua Instrument Co.) at room temperature (25 °C). X-ray photoelectron diffraction (XPS, Thermo Scientific ESCALAB Xi+, Thermo Fisher) and Raman spectrum (InVia Raman Microscope, Renishaw Leica) were adopted to characterize the components of prepassivation film. Scanning electron microscope (SEM, GeminiSEM 500, Zeiss) was used to analyze the surface morphology of the prepassivation film and the cross-sectional structure of corrosion layer, which was prepared by focused ion beam processing system (FIB, Orion Nanofab, Carl Zeiss).
Results and Discussion
The passivation curve of Pb-alloy electrode was obtained by linear sweep voltammetry with a slow scan rate of 5 mV s−1 (Fig. 1a). In the AB segment, the surface of Pb-alloy was electrochemically activated and the current was increased with the applied potential. Since the product is the insulate PbSO4, after achieving a maximum at the defined passivation potential, the anodic current kept decreasing to a minimum and then presented a passivation potential range from −0.8 V to 1.2 V (i.e., the CD segment). Increasing the potential continually, the passivation layer formed in the passivation potential range would be broken, indicating a new surface reaction from insulate PbSO4 through PbO to conductive PbO2 and, simultaneously, the oxygen evolution reaction catalyzed by PbO2 as defined the transpassivation (the DE segment). 14–16
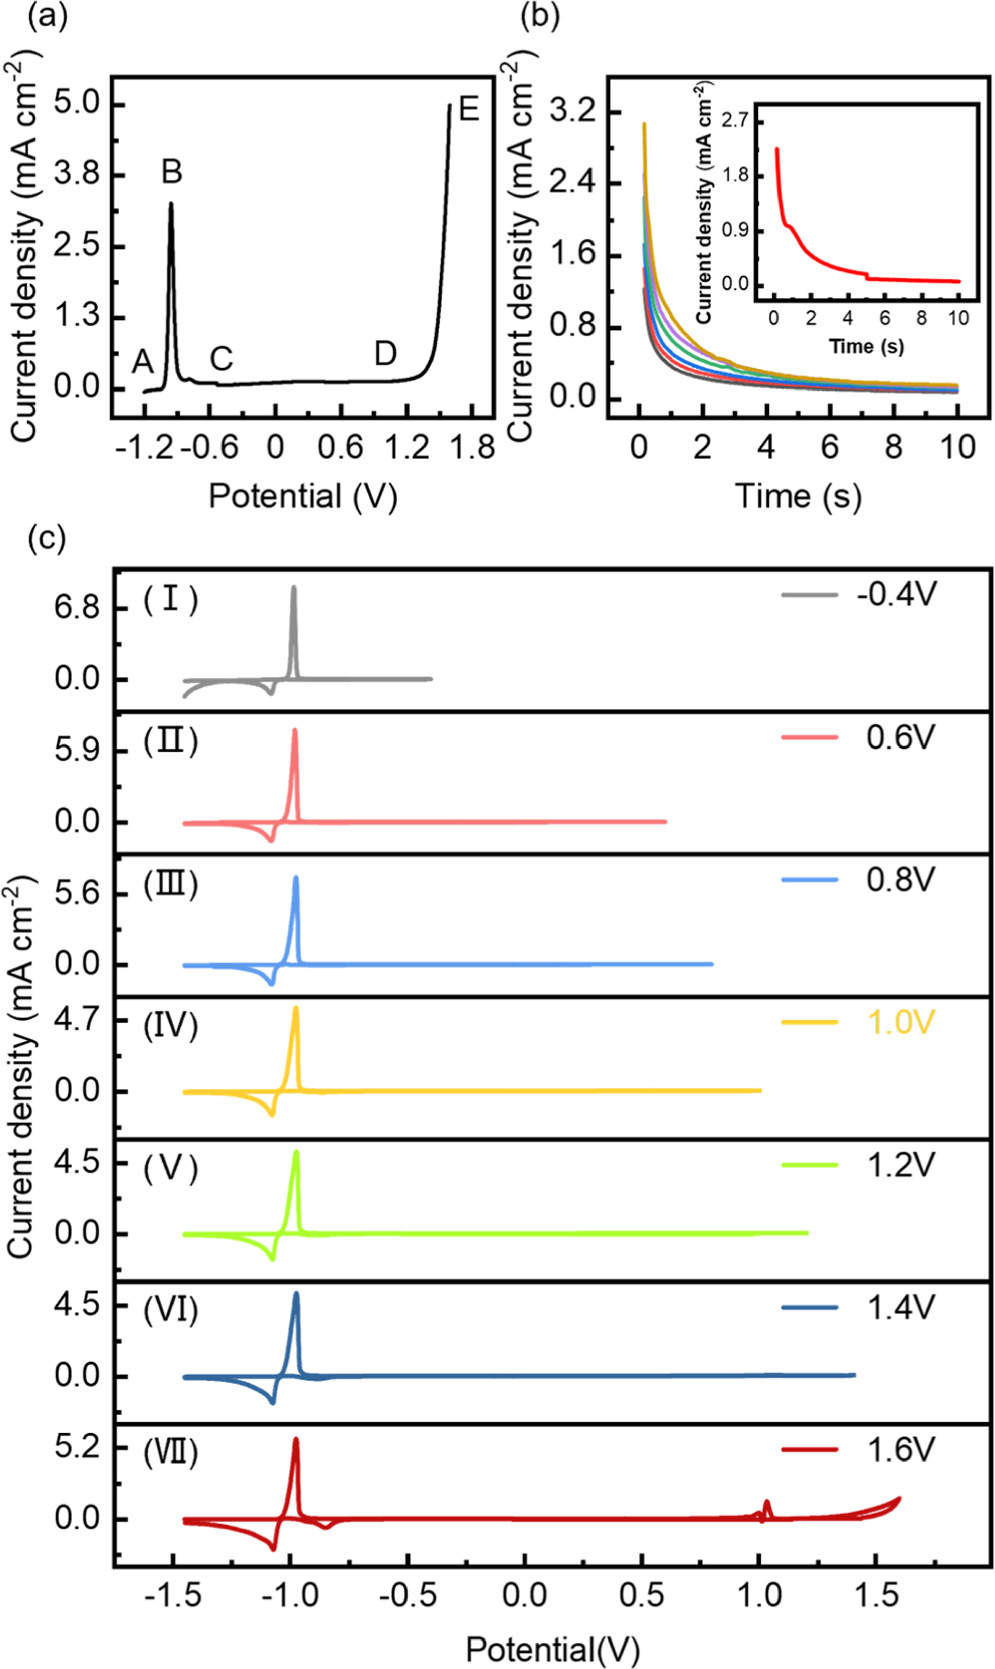
Figure 1. (a) Passivation curve of the Pb-alloy in 1.28 g cm−3 H2SO4 solution, and (b) The chronopotentiometric curves of the Pb-alloy electrode. The initial potential is held at −1.2 V for 20 min and then step to the final potential which from bottom to top are −0.4, 0.6, 0.8, 1.0, 1.2, 1.4, and 1.6 V with a holding time for 10 s. The insert is the chronopotentiometric curve obtained by the pre-passivation protocols. (c) The cyclic voltammograms obtained with the same initial potential at −1.45 V and different inverse potential at (Ⅰ) −0.4 V, (Ⅱ) 0.6 V, (Ⅲ) 0.8 V, (Ⅳ) 1.0 V, (Ⅴ) 1.2 V, (Ⅵ) 1.4 V and (Ⅶ) 1.6 V.
Download figure:
Standard image High-resolution imagePassivation curve provides abundant information on the anti-corrosion parameters, such as the corrosion potential, corrosion current, passivation potential, transpassivation potential, etc, which are relevant to the battery performances. Indeed, the corrosion resistance is determined by the components and compactness of the passivation layer on the Pb-alloy surface. 17,18 Based on these considerations, we optimized a protocol to produce a compact passivation interphase film on Pb-alloy: Firstly, a cathodic potential was fixed at −1.2 V for 20 min to remove the oxides on the working electrodes; Secondly, an anodic potential was fixed at 1.6 V in the transpassivation range for 5 s to generate the oxygen-containing nucleation sites; Thirdly, the anodic potential was immediately stepped to 1.4 V for 5 s for the formation of prepassive layer. The whole prepassivation processes were finished in 10 s. The insert in Fig. 1b shows the chronopotentiometric curve obtained by the pre-passivation protocol. Indeed, an obvious current stage is observed when the potential is stepped to the transpassivation range (i.e., 1.6 V), indicating a complex surface electrode process from PbSO4 to PbOx (x = 1 or 2) mixtures. When the potential is stepped back to 1.4 V, the current falls down indicating the slower growth rate of the prepassivation interphase. This protocol is supported by previous reports, e.g., the potential should be biased higher than the transpassivation potential in order to produce PbO or PbO·PbSO4, 15 and the PbO·PbSO4 interphase will become denser and the grains will become smaller under higher bias potential. 16
Cyclic voltammetric experiments were performed to further demonstrate the necessity that the prepassivation potential should be biased to the transpassivation range in order to form the PbO/PbSO4 interphase. Figure 1c shows the cyclic voltammograms obtained with the same initial potential at −1.45 V and different inverse potentials. From Curve Ⅰ to Curve Ⅴ little change can be observed when the inverse scan potential lies in the passivation potential range. Until the reverse scan potential reach to 1.4 V, i.e., in the beginning of transpassivation potential range, a slight current peak can be observed corresponding to the electroreduction of PbO to Pb at −0.85 V (Curve Ⅵ). When the inverse potential arrives at 1.6 V, a pair of sharp current peaks at ∼1.2 V are observed obviously which corresponding to the PbO/PbO2 conversion; Meanwhile, a dramatically increased cathodic current peak is observed for the electroreduction of PbO to Pb at −0.85 V (Curve Ⅶ). All the results are in harmonious accordance with those of chronopotentiometric, elucidating the reasonability of this protocol for the electrochemical formation of the PbO/PbSO4 prepassivation interphase on the Pb-alloy surface.
X-ray photoelectron spectroscopy (XPS) was adopted to characterize the components of passivation interphase. Figures 2a–2c presented the S2p, Pb4f, and O1s spectra. Comparing the characteristic peak binding energies of Pb4f-7/2 at 136.3, 138.6 and 139.1 eV with the characteristic peak binding energies of O1s at 529.6, 531.4 and 532.4 eV, on the basis of standard binding energy data of lead compounds, 11,19,20 it can be concluded that PbO and PbSO4 are the main components of the passivation interphase. In addition, the appearance of metallic Pb peak at 136.3 eV indicates the prepassivation interphase is a very thin film, and the O1s peak at 532.4 eV indicates the adsorbed H2O molecules on the thin prepassivation film.

Figure 2. XPS spectra of the passivation interphase formed on the Pb-alloy surface after 10-seconds' prepassivation in 1.28 g cm−3 H2SO4 solution: (a) S2p character spectrum, (b) Pb4f character spectrum, (c) O1s character spectrum, and (d) the Raman spectra of the pre-passivation interphase (red) and the un-passivation Pb-alloy surface (black).
Download figure:
Standard image High-resolution imageRaman spectroscopy further verified the XPS results. Figure 2d illustrates the Raman spectra of passivation interphase formed on the surface of Pb-alloy electrode. The Raman peaks at 444 cm−1 and 611 cm−1 correspond to the S-O bond bending vibration, and the one at 981 cm−1 represents the S-O bond stretching vibration. The most intense Raman peak at 137 cm−1 is associated with the Pb-O bond. Based on the literature, 21–23 the peaks at 444 cm−1, 611 cm−1, and 981 cm−1 are ascribed to PbSO4, and the peak at 137 cm−1 belongs to PbO. The results also elucidated that the prepassivation interphase film was successfully formed on the surface of Pb-alloy electrode, and the main components were PbO and PbSO4.
Figures 3a and 3b show the SEM images of the Pb-alloy electrode surface without and with the electrochemical prepassivation. It is observed that the passivation interphase is formed with homogeneously distributed and compact nanoparticles, exhibiting a smoother and tighter surface with a larger specific surface area. Furthermore, in order to elucidate the dynamic evolution of the electrochemical prepassivation interphase, cyclic voltammetry was adopted to mimic the charging/discharging cycles of LAB in the experimental potential range between 0.6 V and 1.6 V (Figs. 4a and 4b). The cross-section SEM morphologies of the interphase were characterized shown in Fig. 3c (without prepassivation) and Fig. 3d (with prepassivation). It is obvious that, with electrochemical prepassivation processes, the interphase is much denser. From Fig. 4c, the integrate charge of the PbO2 electroreduction obtained on the pre-passivation Pb-alloy electrode increases more slowly with the scan cycles than that on the un-passivation one, which indicates a slower growth rate of the interphase and an improved corrosion resistance of the pre-passivation Pb-alloy grids.
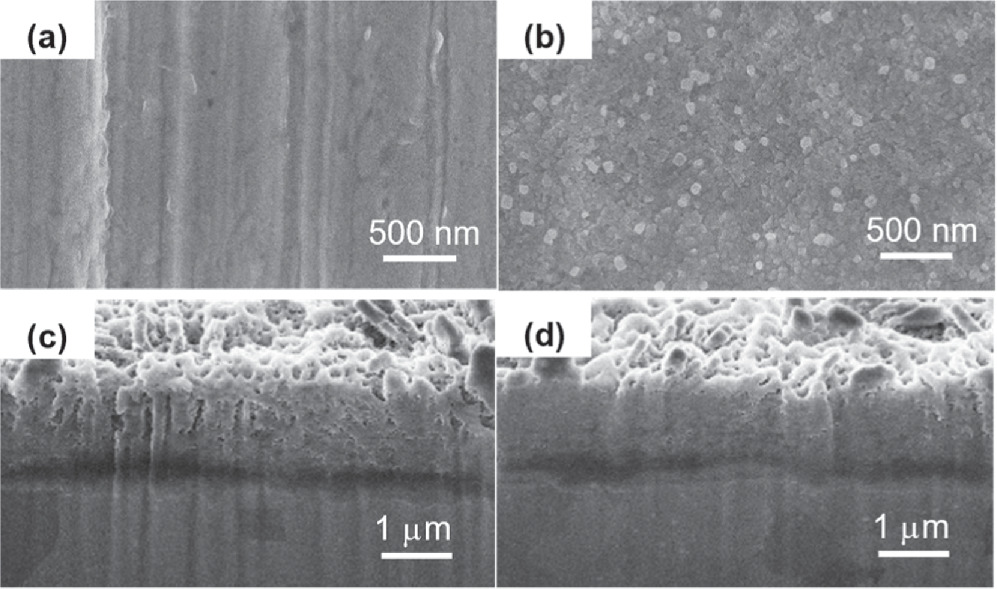
Figure 3. SEM images of (a) the un-passivation electrode surface, and (b) the pre-passivation interphase; the cross-section SEM images of the interphase formed on (c) the un-passivation electrode surface, and (d) the pre-passivation electrode after performing cyclic voltammetry for 50 cycles in 1.28 g cm−3 H2SO4, the scan rate is 5 mV s−1 and the potential range is [0.6 V, 1.6 V].
Download figure:
Standard image High-resolution image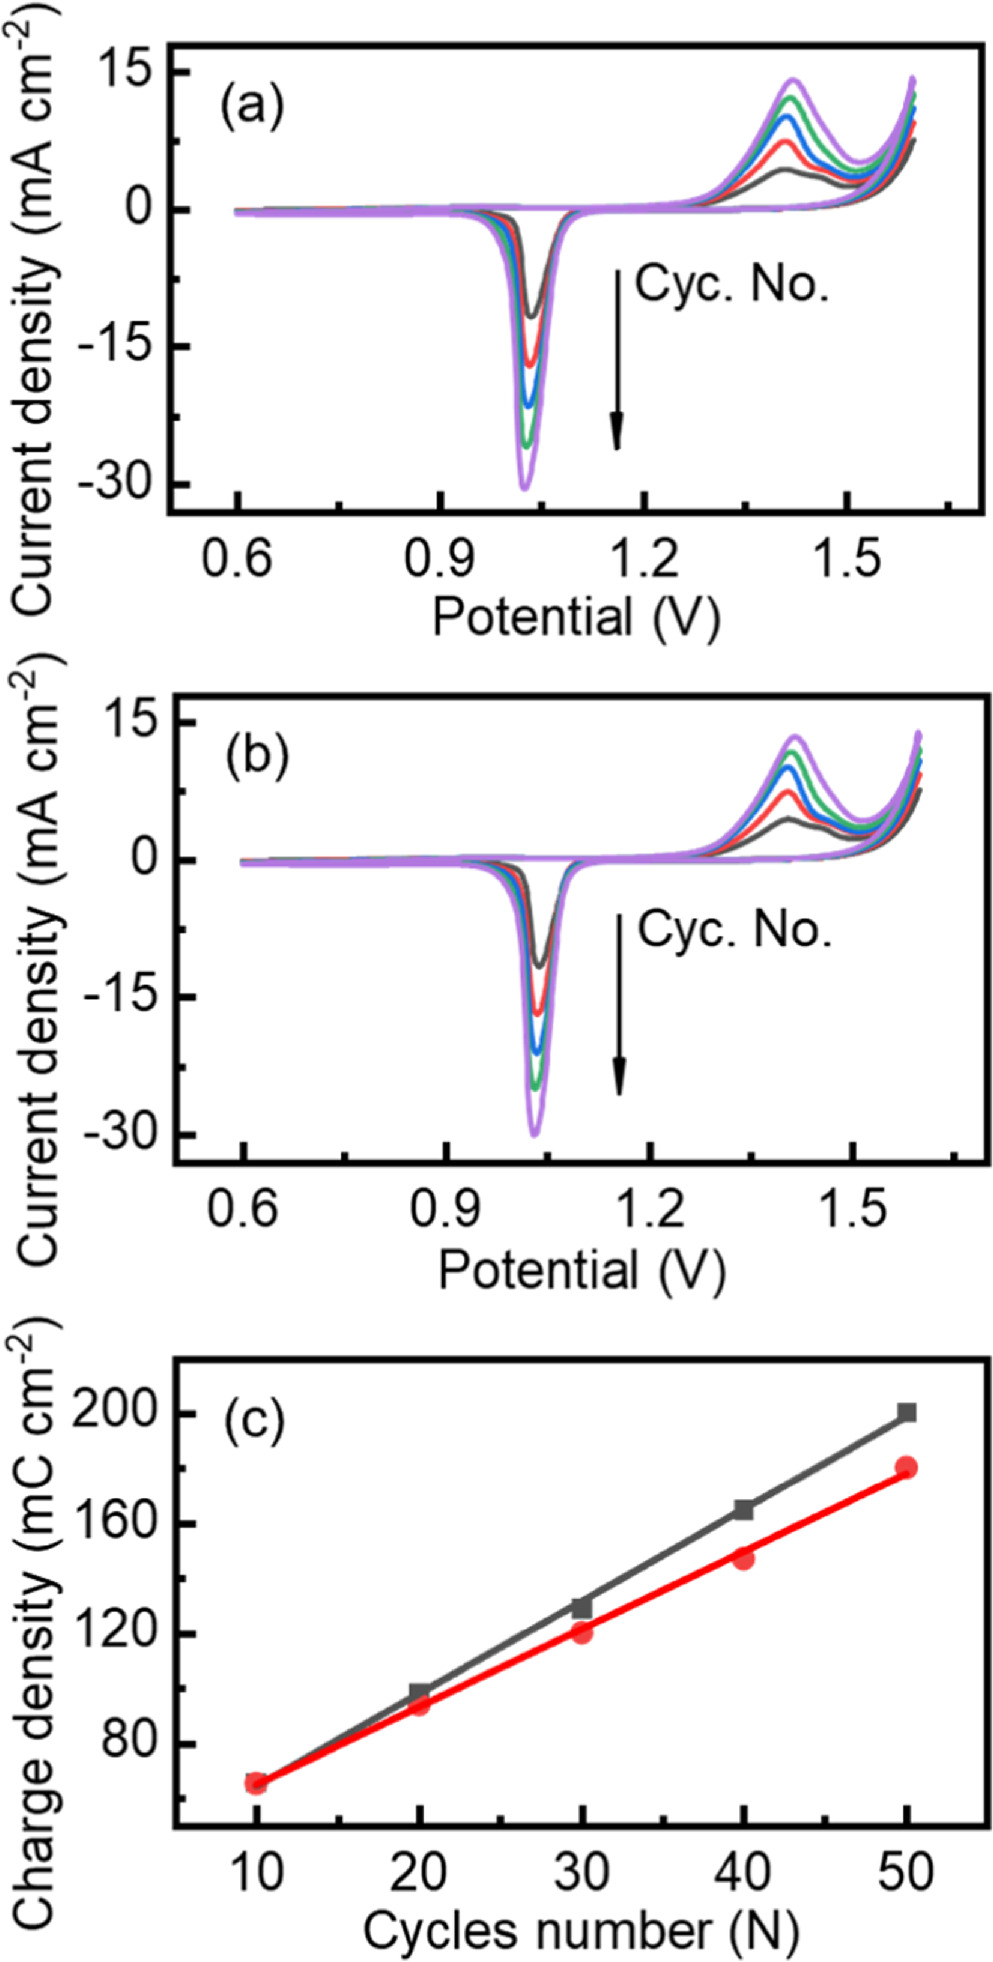
Figure 4. Cyclic voltammograms of (a) the un-passivation electrode and (b) the pre-passivation electrode in 1.28 g cm−3 H2SO4 with a scan rate of 5 mV s−1 and the potential range of [0.6 V, 1.6 V], and (c) the integrate charge of PbO2 electroreduction obtained on the un-passivation electrode (black) and the pre-passivation electrode (red) at the 10th, 20th, 30th, 40th and 50th cycle.
Download figure:
Standard image High-resolution image
Furthermore, because the PbO/PbSO4 prepassivation interphase has the same components as the positive lead paste, it should have an excellent compatibility to both the positive Pb-alloy grid and lead paste. The unique compatibility can facilitate the subsequent electrochemical forming processes, avoid the crevice corrosion of the positive Pb-alloy grids, and play a crucial role in improving the corrosion resistance of the pre-passivation Pb-alloy grid.
Conclusions
The corrosion of positive grids is the fatal factor causing the failure of LAB. To this, we propose a feasible strategy to form a nanostructured PbO/PbSO4 interphase by electrochemical prepassivation. The results show that, comparing to the un-passivation Pb-alloy grid, during the mimic charging/discharging cycles by cyclic voltammetry, the dynamic interphase on the pre-passivation Pb-alloy grid is much denser with a slower growth rate and, thus, presents an improved corrosion resistance.
Acknowledgments
Financial support of the National Natural Science Foundation of China (22202166, 21827802, 22132003 and 22021001), Fundamental Research Funds for the Central Universities (20720230076) and the 111 Project (B08027, B17027) is appreciated. We thank Tan Kah Kee Innovation Laboratory for providing characterization services. The authors declare no competing financial interests.