
Abstract
Thermally regenerative ammonia batteries (TRABs) are an emerging technology that use low temperature heat (T < 150 °C) to recharge a flow battery that produces electrical power on demand. The all-aqueous copper TRAB can provide high power densities and thermal energy efficiencies relative to other devices that harvest energy from waste heat, but its performance is adversely impacted by the crossover of undesired species through the membrane and lower cell voltages compared to conventional batteries. In this work, we developed a numerical model to simulate discharge curves while accounting for crossover inefficiencies without tracking all electrolyte species through the membrane. The model was able to successfully reproduce discharge curves across a diverse range of battery conditions using a single fitting parameter to account for decay of electrode standard potential due to species crossover with minimal error (< 5%). The model was then used to simulate different design scenarios to estimate changes in energy output from alterations to the aspects of the battery electrolyte chemistry. Results from this study are used to identify pathways for improving future TRAB designs with respect to energy capacity and cost-effectiveness of the technology.
Export citation and abstract BibTeX RIS

This is an open access article distributed under the terms of the Creative Commons Attribution 4.0 License (CC BY, http://creativecommons.org/licenses/by/4.0/), which permits unrestricted reuse of the work in any medium, provided the original work is properly cited.
The availability of low-grade thermal energy (T < 150 °C) from industrial waste heat and geothermal energy is widespread throughout the world. For example, in the United States, approximately 1,000,000 EJ 1 of low-grade geothermal energy is available at a depth of 5 km, which is well beyond the 100 EJ currently consumed per year by the United States economy. 2 If even a fraction of this resource can be cost-effectively harnessed for electrical power generation, it could transform the renewable energy industry. Although many technologies are being developed to produce electrical power from this otherwise untapped resource, they still lack the performance metrics needed to compete with conventional power generation systems. 3,4 Thermally regenerative flow batteries can utilize this untapped low-grade heat to produce power and store energy. These batteries rely on the complexation of a metal ion with a ligand that can be thermally separated from the battery electrolyte at low temperature. 5 Copper is the most common and highest performing metal used in a thermally regenerative battery, with acetonitrile and ammonia being the most common and highest performing ligands. 3–6 A thermally regenerative flow battery using acetonitrile and copper uses all three oxidation states of copper (0, 1, and 2) to take advantage of the stable Cu(I)-acetonitrile complex and spontaneous disproportionation of Cu(I) when the complex is heated as the acetonitrile vaporizes. 7 This chemistry performs well with an average power density of ∼10 mW cm–2 and thermal energy efficiency of ∼2%, but some drawbacks associated with it are the need to pump a nanoparticle slurry and relatively high temperature required for thermal separation (∼150 °C). 8 A thermally regenerative flow battery using ammonia and copper performs best when only the aqueous oxidation states of copper are used (henceforth referred to as the Cuaq-TRAB). 9,10 A recent study has shown that the Cuaq-TRAB can produce average power densities of 25 mW cm−2 with thermal energy efficiency of ∼7%, but the battery is limited by fast diffusion of ammonia and comparatively low cell voltages relative to conventional batteries. 11
Previous numerical investigations into thermally regenerative ammonia batteries (TRABs) have covered a range of topics to help guide future experiments and technological improvements. One topic examined is the impact of advective transport through different flow fields and fiber arrangements to improve electrode utilization. 12,13 Simulations have also been used to demonstrate how electrolyte composition impacts battery performance by elucidating diffusive mass transport effects. 14,15 A full cycle analysis was conducted on the metallic-copper TRAB to investigate trade-offs between power density and efficiency to identify the operating conditions to maximize each simultaneously. 16 Recently, a numerical sensitivity analysis was completed on the Cuaq-TRAB which showed that ohmic losses were previously the main contributor to poor battery performance. 17 This led to an experimental investigation of different membranes in the Cuaq-TRAB resulting in very high power and energy densities relative to the previous membrane choices. 11 However, no previous TRAB model has incorporated the parasitic diffusion and reaction of ammonia despite it being a well-known source of energy loss in the battery. In flow battery literature, many numerical models of vanadium redox flow batteries have been constructed that track crossover of each species through the membrane to provide a breakdown of the different sources of diffusive losses. 18–21 Though detailed, these models are complex and computationally expensive. Simpler models have been created that do not account for all diffusing species and parasitic reactions. These models typically give up some accuracy when compared to experimental results, 22 but have significantly less computational time due to fewer degrees of freedom therefore enabling greater utilization of the model for further studies such as sensitivity analyses and optimization problems.
Here, we constructed a time-dependent model of the Cuaq-TRAB to simulate battery discharge curves, then used the model to predict how possible battery electrolyte modifications could impact performance. Given that ammonia diffusion is a known source of loss during battery discharge, we created a simplified model to quantify this loss without simulating the diffusion of all species through the membrane. Once validated, we then used this model to identify pathways for future improvement of the Cuaq-TRAB to address previous concerns of possible methods to improve TRABs. 3,4 We demonstrate how modifications to copper solubility and ligand choice could be made to achieve significant improvements to key system performance metrics relevant to TRAB maturation and discuss potential methods and considerations for these modifications.
Methods
We modified a previous steady-state model to simulate time-dependent discharge curves of the Cuaq-TRAB battery using room temperature parameters from the previous model (Table S1) and compiled the equations with COMSOL Multiphysics. 17 A mesh independent study was conducted and found that there was a 0.5% change in simulated energy output as the number of mesh elements was increased from 13,000 to 16,000, thus the mesh with 16,000 elements was used for this study (Fig. S1). The model used laminar, incompressible Brinkman and continuity equations for solving the flow field,

where ρ is the fluid density, ε is the electrode porosity,  is the velocity vector, t is time, p is the fluid pressure, μ is the fluid viscosity, and Qm
is a source or sink term.
23
The flow path of the electrolyte was simulated independently of the electrochemical and diffusive transport equations because it was assumed that the change in concentration would not change the flow path. Both electrodes and electrolytes were governed by electroneutrality conditions, conservation of mass, and the convection–diffusion equations,
is the velocity vector, t is time, p is the fluid pressure, μ is the fluid viscosity, and Qm
is a source or sink term.
23
The flow path of the electrolyte was simulated independently of the electrochemical and diffusive transport equations because it was assumed that the change in concentration would not change the flow path. Both electrodes and electrolytes were governed by electroneutrality conditions, conservation of mass, and the convection–diffusion equations,


where zi
is charge of the ith ion, ci
is the bulk molar concentration of the ith species,  i
is the flux and Di
is the diffusion coefficient of an individual species, F is Faraday's constant, R is the molar gas constant, T was the temperature of the fluid, and
i
is the flux and Di
is the diffusion coefficient of an individual species, F is Faraday's constant, R is the molar gas constant, T was the temperature of the fluid, and  was the potential of the electrolyte. Electrode reaction kinetics were modelled using the linearized Butler-Volmer equation,

where iloc is the local current density, i0 is the exchange current density of the reaction, αa and αc are the anodic and cathodic transfer coefficients, and η is the overpotential.
Unique to this new work, the model was constructed in 2D with the simulated flow field being a projection of the three-dimensional flow field (Fig. S2). The membrane was modelled as a fixed ohmic drop and acted as a source/sink for the background electrolyte ions (ammonium and bromide) to conserve electroneutrality. To make the model time-dependent and simulate a recirculating electrolyte, we added an ordinary differential equation to calculate the single pass conversion in the flow cell to change the bulk reservoir concentration and update the inlet concentration of all species in both electrolytes with time. The equation was defined using a surface integral as

where V is the volume of the tank (50 mL), L is the length of the electrode (5 cm), ci is the concentration of the ith species, Ni is the molar flux of the ith species, n is the normal vector from the surface, and S is the surface of interest (either the inlet or outlet flow field boundary). The initial copper concentration was 0.5 M to match the experimental setup used for model validation. 11 The molar flux at each inlet and outlet was extrapolated to the full 3D distance using the out-of-plane thickness of the experimental flow field (5 cm).
To account for potential losses from ammonia in the negolyte crossing over to the posolyte, we modified the Nernst equation of the positive electrode reaction by adding an empirical decay rate, E0 pos,decay [V s−1] to the positive electrode standard potential:

where Eeq is the equilibrium potential, E0 pos is the positive electrode standard potential, t is time, R is the ideal gas constant, n is the number of electrons transferred, F is Faraday's constant, and Q is the reaction quotient. This decay rate was used as a fitting parameter to replicate experimental discharge curves and account for the self-discharge that occurs when free ammonia in the posolyte complexes with copper species and reduces the standard potential of the Cu(I/II) reaction. 9,24 By utilizing this decay rate instead of constantly simulating the reaction and diffusion of all the species within the electrolyte, the model becomes significantly simpler while still effectively representing the influence of ammonia crossover, a crucial factor in reproducing Cuaq-TRAB discharge curves. The use of this single, linear decay term can be justified by previous experiments that observed linear changes in ammonia concentration during membrane crossover experiments (see Fig. S3 of Ref. 11).
The energy efficiency of converting waste heat into electrical energy, η, was calculated using a simplified method relating the electrical energy output,  to the thermal energy input, Eheat
(107 Wh l–1),
5,17
to the thermal energy input, Eheat
(107 Wh l–1),
5,17

We also calculate a modified energy efficiency, η* , defined as 3,4

where TH is the hot side temperature (100 °C), 16,17,25,26 TL is the cold side temperature (25 °C), ΔTHE is the heat exchanger temperature difference (5 °C), 3,4 and ΔT* is the temperature difference across a single process of a multi-effect and heat recovery scheme (MEHRS) (75 °C). 3,4
Polarization curves were simulated to validate that the model cell resistance was the same as that of the experimental cell resistance and therefore matched previous experimental data. 11 The conductivity values from the validated model polarization curve were then used in the time dependent discharge curve simulations. All simulations validated against experiments used the same parameters as the previously published model on this work and used the same electrolyte concentration as previous experimental studies: 0.5 M CuBr1/2, 5 M NH4Br, and 4 M NH3 (negolyte only). 17
For simulations of alternative ligands and copper solubility, only the parameters directly relevant to the modification (solubility and electrode standard potential) were changed. Discharge curves were simulated with parameters and decay rate (E0 pos,decay ) matched to experimental data for Selemion CMVN with an applied current density of 50 mA cm–2. To estimate the performance difference between bromide and chloride, only the standard potential of the positive electrode was changed to E0 Cl = 0.543 V from E0 Br = 0.727 V, as this was the previously measured standard potential for chloride at high concentration. 9 We assumed that all other thermodynamic values would be the same, although it's worth noting that variables like solubility and membrane resistance, which are not considered, might exhibit differences. For results demonstrating a larger potential window, it is assumed that thermal energy input for regeneration (Eheat ) is the same as ammonia (107 Wh L–1). If an alternative to ammonia were used to achieve the larger potential difference, the thermal energy requirement would change, but the purpose of the demonstration is to show the improvement of electrical energy output of the battery as a result of the electrolyte modification.
Results
Validating the time-dependent model for the Cuaq-TRAB discharge process
A comparison of simulated discharge curves with and without a crossover term confirmed the importance of ammonia crossover in replicating experimental data. Discharge curves that did not account for ammonia crossover overestimated energy and average power output by ∼20% (Fig. 1). This difference showed the limit to which decreasing ammonia transport can improve the energy and power output of the Cuaq-TRAB. If Selemion CMVN or an alternative membrane could be modified to have significantly slower ammonia flux with the same ohmic resistance, the maximum performance would increase by a maximum of only 20%. Unavoidable polarization losses constitute the rest of the battery performance decrease (approximately 25% compared to the theoretical energy storage density calculated previously 10 ), and therefore either further chemical (i.e., electrolyte) or material (e.g., electrode, membrane) modifications would be needed to increase the energy and power output of the battery. As the decay rate increased, the discharge time and therefore energy output of the battery both decreased, as expected (Fig. 1).
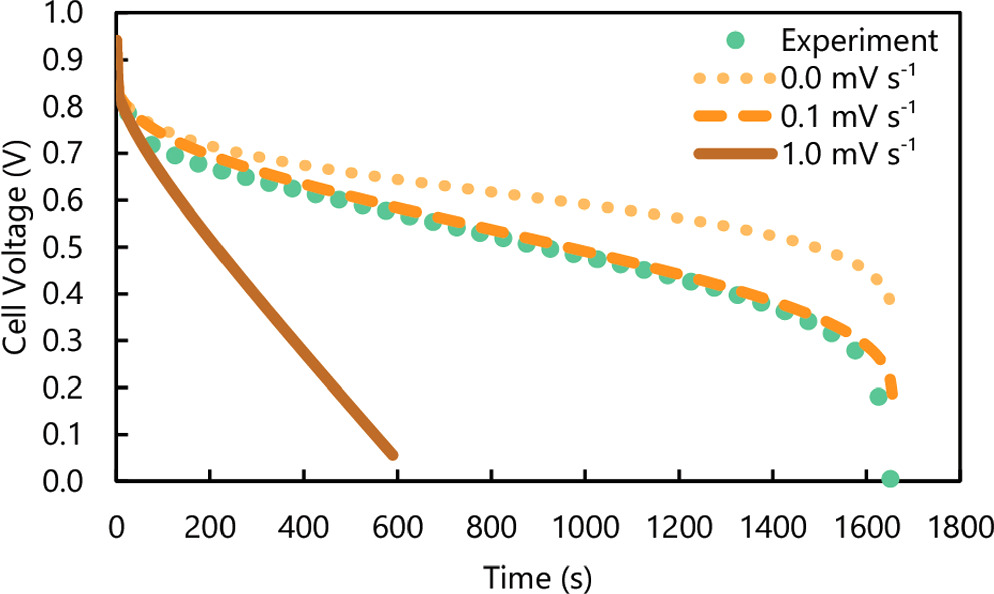
Figure 1. Comparison of experimental, and simulated discharge curves with values of E0 pos,decay of 0, 0.1 and 1 mV s−1 for discharging the Cuaq-TRAB with Selemion CMVN at 50 mA cm−2.
Download figure:
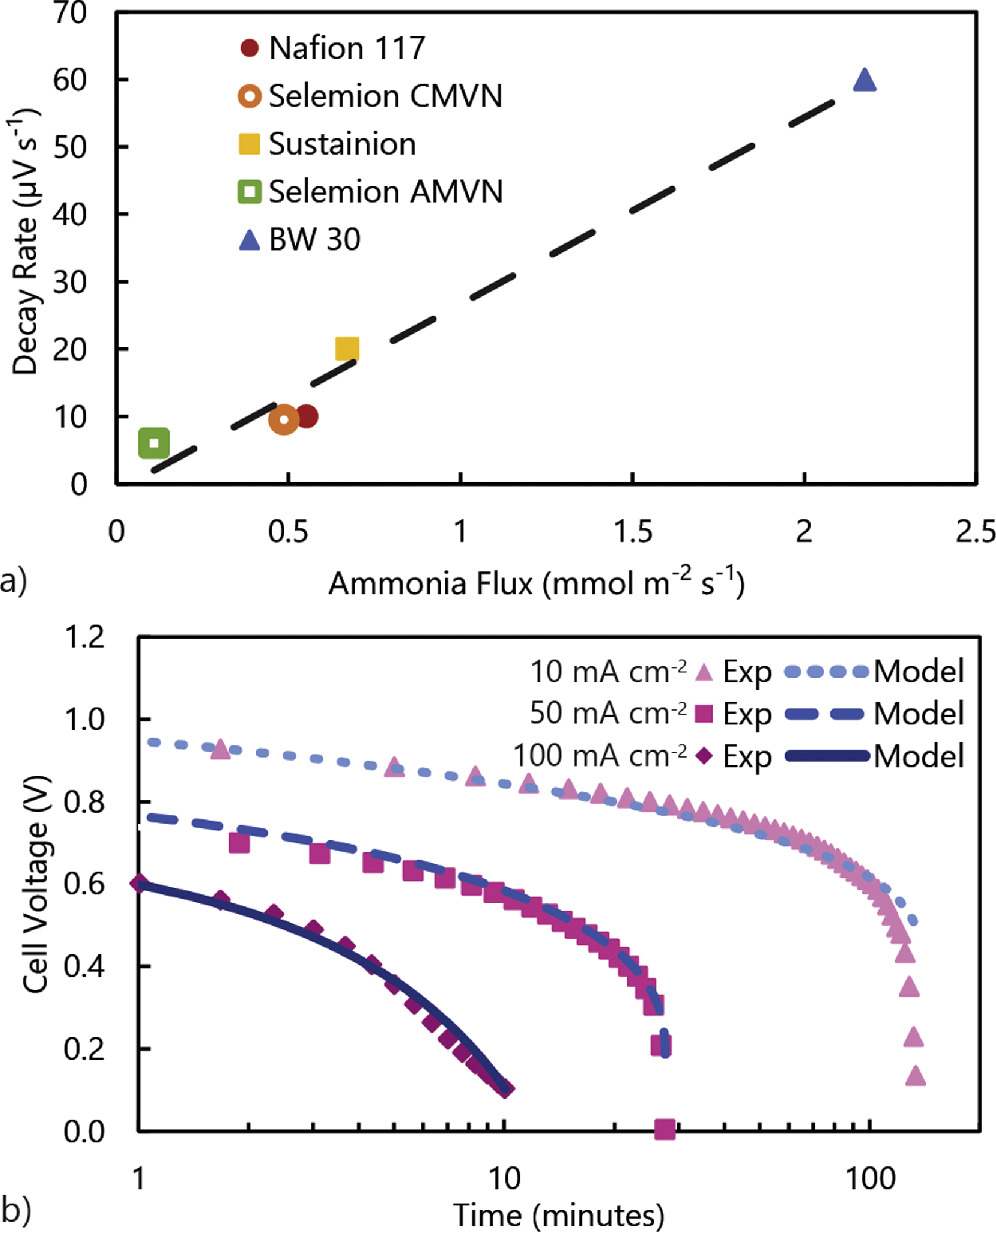
Standard image High-resolution imageThe model was further validated by fitting simulated discharge curves to previous experimental results for different membranes and different applied current densities. The fitted decay rates for each membrane were strongly correlated to previously reported ammonia flux values specific to each membrane (Fig. 2a). The strong correlation was despite large differences in resistance between the different membranes tested, indicating that the ohmic resistance and ammonia diffusion are largely independent of one another. For each membrane modeled, both the energy output and average power density were less than 5% different than the experimental discharge curves (Table S2). In these experiments and simulations, a low current density (10 mA cm–2) was applied to the cell, thus supporting the claim that ammonia crossover is the primary source of energy loss in the system.

Figure 2. (a) Correlation of fitted decay rate and previously measured ammonia flux. 11 Dashed line is a linear regression of the data. (b) Comparison of model and experimental discharge curves 11 for Selemion CMVN at multiple applied current densities.
Download figure:
Standard image High-resolution imageSimulations at higher applied current density (50 and 100 mA cm–2) with Selemion CMVN showed that larger decay rates (values of E0 pos,decay ) were needed as the discharge current density increased (Fig. 2b, Table S3). Larger mass transfer and ohmic losses that occur at higher applied current density caused lower initial cell voltages, but they do not explain the order of magnitude increase in the fitted positive electrode standard potential decay rate. The increase in decay rate with applied current density implies that parasitic crossover increased with current density, but this increase is unlikely to be linked to an increase in ammonia (NH3) crossover because it is uncharged and not as susceptible to electric field changes as the ionic species. Given that Selemion CMVN is a cation exchange membrane, changes in the flux of positively charged species (NH4 + and Cu(NH3)x 1/2+) are most likely to increase with higher applied current. While ammonium (NH4 +) had a much higher flux than the copper-ammonia complex, ammonium is an unlikely source of energy loss since it would primarily result in only small changes in pH. However, increase in the flux of the copper-ammonia complex would have a similar parasitic effect of ammonia (NH3) crossover by creating a mixed potential at the positive electrode while simultaneously decreasing the total copper in the negolyte. Additionally, since the copper-ammonia complex is positively charged, the electric migration to the cathode would increase at higher applied current densities. Therefore, the source of faster decay at high polarization is likely increased Cu(NH3)x 1/2+ flux.
The method of using a single decay term to modify the Nernst equation has been shown to be able to accurately simulate discharge curves for the Cuaq-TRAB and can be extended to other flow battery chemistries as well. The methodology should be applicable to any system where the major contributor to performance decay over time is changes to the electrode thermodynamics. If there are multiple sources of parasitic loss occurring at similar rates, such as changes in surface chemistry or material degradation, then this method is unlikely to model battery discharge as accurately as is shown in this work. However, the method could be modified to non-thermodynamic performance decay in a similar manner such as decreasing exchange current density or membrane conductivity over time.
Examination of methods to improve performance
Given that the model was able to accurately simulate a wide range of materials and operating current densities, we extended the model to quantify the performance impact of different possible electrolyte modifications. First, in a previous technoeconomic analysis, it was demonstrated that the chloride ligand is much cheaper than bromide due to higher abundance and lower molecular weight, 27 so we simulated polarization and discharge curves to estimate the difference in electrochemical performance between these two ligands. Next, since energy efficiency is a key performance metric for TRBs and battery theoretical energy density is linearly related to active species concentration and cell voltage, 10,28,29 we simulated how improvement of these two variables would impact system performance. Last, we discuss potential methods and considerations for increasing copper solubility and cell voltage to help provide guidance for potential future research on Cuaq-TRBs.
Quantifying pathways for improved Cuaq-TRAB performance
Using chloride instead of bromide resulted in a 32% decrease in performance for both polarization and discharge curves (Fig. 3). In the polarization curve, the open circuit potential for chloride was 190 mV lower (1.04 vs. 0.85 V) than bromide due to differences in thermodynamic potential, which resulted in a peak power density of 57 mW cm−2 instead of 88 mW cm−2 (Fig. 3a). For the discharge curve, the average power density when using chloride was 18 compared to 27 mW cm–2 with bromide, and the standard energy efficiency was 3.9% compared to 5.8% (Fig. 3b). The previous economic analysis assumed that the performance losses would be 15%, which our analysis indicates is an underestimation. However, it was reported that the levelized cost of storage of chloride was 80% lower than bromide; 27 therefore, even with a performance decrease of 30% that is predicted here, the chloride ligand would still likelybe economically more favorable.
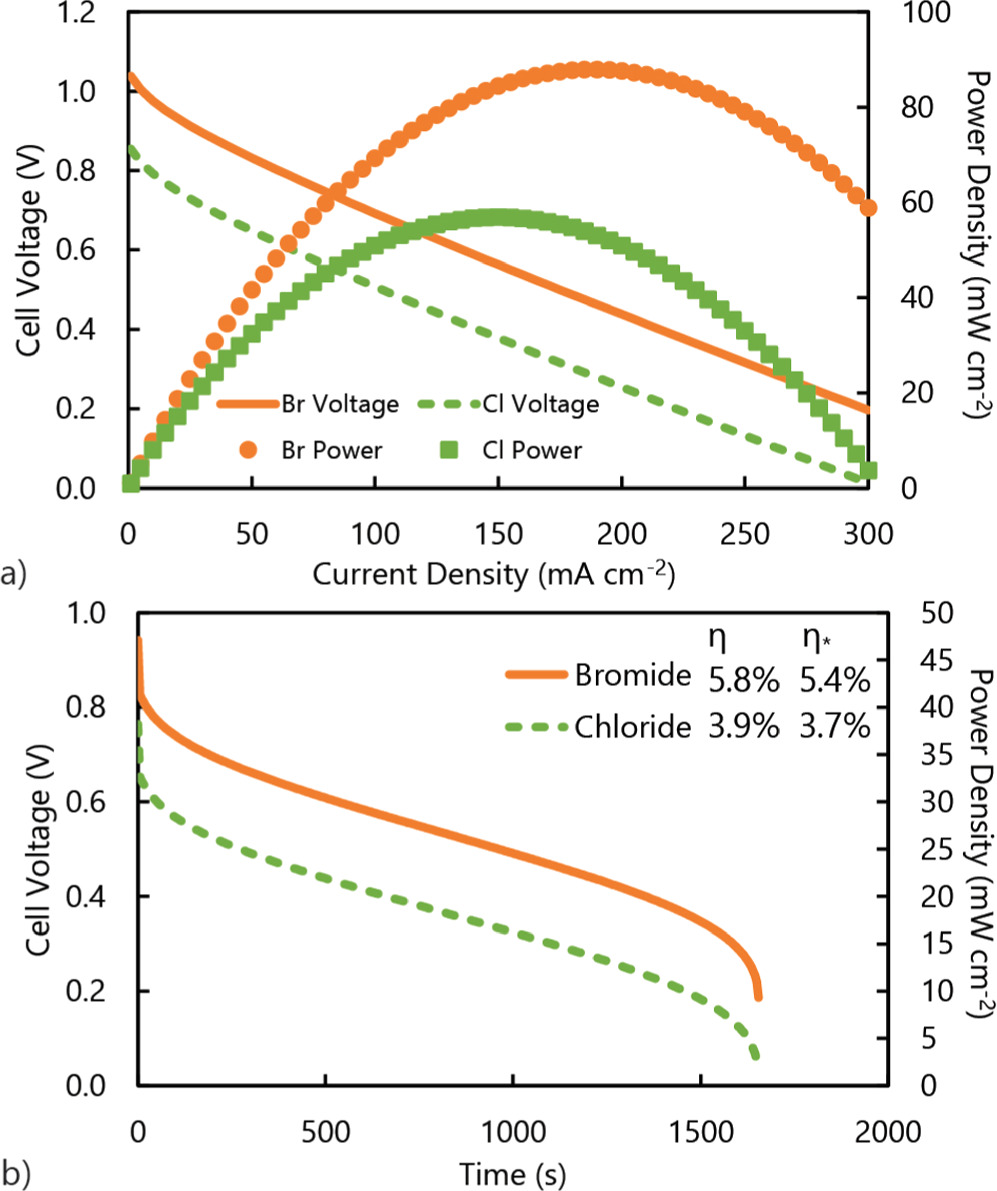
Figure 3. (a) Polarization and power density curves, and (b) discharge curves comparing bromide and chloride ligands with estimated thermal efficiencies.
Download figure:
Standard image High-resolution imageLarger copper concentrations gave diminishing returns on energy output because as the discharge time increased, so did the time for decay of the positive electrode potential (Fig. 4). To achieve twice the energy output compared to the 0.5 M concentration, it was necessary to raise the copper concentration to 1.25 M. However, this change led to an 18% reduction in the average power density, reducing it from 27 to 22 mW cm–2. The use of the 0.5 M copper concentration would reduce crossover issues and would result in a 44% decrease in energy output compared to the 1.25 M solution, but a 10% increase in average power density. Previously it has been shown that larger copper concentrations did not impact the power output of the cell, thus performance changes should be limited to energy output. 10 Lower copper concentration could be used in tandem with lower ammonia concentration, which would result in a slower decay rate due to the ammonia concentration gradient being smaller. Lower ammonia concentration has been previously shown to decrease the thermal energy requirement for regeneration (a 20% decrease when moving from 4 M to 1 M NH3 17 ), which would help increase the energy efficiency at low copper concentrations.

Figure 4. Discharge curves for a range of maximum copper concentrations and corresponding thermal efficiencies.
Download figure:
Standard image High-resolution imageLarger standard potential differences resulted in increases across all performance metrics with an increase of 0.2% per mV increase. At +150 mV, the peak power density increased to 120 mW cm–2, the average power to 35 mW cm–2, and the energy efficiency to 7.6%/5.8% (η/η*) (Fig. 5). There was little difference in the discharge time despite the larger standard potential difference. The current density at which peak power density occurred increased to 220 mA cm–2 from 190 mA cm–2, therefore increasing the possible range of applied current density for discharging the battery. Additionally, the "optimal" current density for discharging would also increase by a similar percentage from 50 to 58 mA cm–2.

Figure 5. (a) Power and (b) discharge curves for larger standard cell potential differences. "Baseline" are the matched curves with experiments using bromide and ammonia ligands.
Download figure:
Standard image High-resolution image
Methods and considerations for increasing copper solubility and cell voltage
Copper solubility can be increased by using a higher ligand concentration, higher temperature, or electrolyte additives such as ionic liquids and deep eutectic solvents. Multiple previous studies have shown that increasing ligand concentration enables higher copper solubility because of the higher degree of complexation of the copper-ligand complex. 10,30–32 Provided that the dissolution reaction of many copper-ligand complexes are endothermic, 33 increasing temperature would also increase the solubility limit. This is in line with past studies on TRABs that have shown that higher temperatures are beneficial for system performance. 17,34,35 There has been extensive research on the use of ionic liquid and deep eutectic solvents for increasing the solubility of metal ions in conventional redox flow batteries as a means to increase their energy density. 36 While many studies have focused on vanadium and zinc chemistries, the limited studies that have investigated copper metal have shown that solubilities up to 3 M are possible, 37–40 but research on solubility of Cu(I) complexes is scarce and has shown that solubility limits tend to be lower. 10,31,41
The standard potential difference between the electrolytes can be increased by further increasing the ligand concentration or by finding alternative ligands to bromide and ammonia. Using higher ligand concentrations has been previously shown to push the reaction potential further away from the standard electrochemical potential, but there are diminishing returns, as the degree of complexation of the copper ions is limited. 9 When considering alternative ligands, it is critical that they stabilize both aqueous oxidation states of copper to match the high coulombic efficiency of the Cuaq-TRAB. Copper (II) is generally stable with most ligands, but copper (I) is more sensitive, and some ligands cause it to disproportionate, which would not be compatible with the Cuaq-TRB. For an alternative to bromide, the only weaker field ligand in the spectrochemical series is iodide, but the copper iodide and ammonium iodide salts have low solubility in water. There are many ligands outside the spectrochemical series that could increase the standard potential higher than that of bromide but are relatively uninvestigated in copper-based electrolytes. 42
For alternative negative ligands, there are multiple stronger field ligands in the spectrochemical series, but not all of them are thermally separable below the boiling point of water. It is imperative that the separation of the negative ligand happens before water vaporization because if the water vaporizes first, then the copper and ammonium salts will solidify within the thermal regeneration unit. Other considerations are less imperative for operation, but vital for maintaining and improving the energy efficiency of the Cuaq-TRB system. Thermal separation between ligand and water should occur in one step. Multi-step separation has previously been shown to have larger thermal energy requirements than single step, 43 resulting in lower system efficiency, higher system footprint, and higher capital costs. While it is possible that these drawbacks will not be true for all ligands, it is highly likely and therefore strongly recommended to avoid azeotropic systems. The ligand and metal-ligand complexes should have high solubility in water. The copper solubility limit of the Cuaq-TRAB is ∼0.6 M, 10 which is well below traditional redox flow battery technologies and significantly limits the theoretical energy density and therefore energy efficiency of the system. Metal-ligand solubility limits should be similar or greater than 0.6 M to not drastically decrease system performance. The ligand should have low production cost. Due to its ubiquity in agricultural use as a fertilizer, ammonia is produced in extremely large quantities and is therefore a cheap reagent. While alternatives do not need to be (and are unlikely to be) as cheap as ammonia, an expensive ligand would have to have far superior performance to keep system capital costs down. The molecular size of the alternative ligand should be larger than ammonia. Due to the small molecular size and neutral charge of ammonia, control of parasitic crossover from negative to positive electrolyte is difficult, resulting in energy density losses. 11 A larger ligand would diffuse slower through the membrane due to steric hindrance and therefore parasitic losses would decrease. The new electrolytes can be modified to have similar pHs. Currently, the background electrolyte salt of the Cuaq-TRAB is ammonium bromide, a weak acid, and the negative ligand is ammonia, a strong base because it comes in the form of ammonium hydroxide. This creates a pH differential between the positive and negative electrolytes of roughly 5–6 pH units. As the battery is discharged and the electrolytes mix, the pH of each electrolyte trends to a more neutral pH, causing issues of thermodynamic stability of the copper species. Changing the ligand such that the positive and negative electrolytes can have similar pHs would avoid this phenomena and lead to less issues with long-duration battery operation.
Conclusions
A time-dependent model of the Cuaq-TRAB was created to simulate discharge curves without direct simulating of species diffusion through the membrane. This model used an empirically-fitted term to represent the decay of the standard potential of the positive electrode and account for the impact of parasitic species crossover. This model was shown to accurately simulate discharge curves for a range of membranes, and the decay rate was strongly correlated to the flux of ammonia, which was previously shown to be a primary source of energy losses in TRABs. At high applied current densities, larger decay rates were required to match discharge curves, and this was attributed to increased crossover of the Cu(NH3)1/2+ species. The model was then used to predict the impact on performance different potential future pathways would have on Cuaq-TRB development. Attractive strategies to further increase the performance of the Cuaq-TRB were identified and discussed. The model results showed that changing from bromide to chloride would likely result in approximately a 30% decrease in performance. However, that decrease could be counteracted by increasing copper solubility or finding new methods to increase the standard potential difference, such as the use of an alternative negative ligand to ammonia.
Acknowledgments
The writing and editorial work of the first author were performed in part under the auspices of the U.S. Department of Energy by Lawrence Livermore National Laboratory under Contract DE-AC52–07NA27344. LLNL release number LLNL-JRNL-859138-DRAFT. This material is based upon work supported by the Department of Energy under Award Number DE-FE0032030.
Supplementary data (0.1 MB DOCX)