
Abstract
Redox Flow Batteries are ideal for grid-scale energy storage but have low energy density. In an effort to resolve this issue, this work presents an H2-vanadium RFB system that operates with the catholyte above the solubility limit of vanadium ions in the supersaturated regime without the use of chemical stabilizers, necessary for the operation of a novel solid/liquid storage concept. Initial charge/discharge testing was performed at constant potential (1.35 V charge and 0.65 V discharge) increasing Vanadium concentrations from 1.5 M to 2.5 M. Coulometric capacity increased 67% (40.2 Ah l−1 to 67.0 Ah l−1) while average current density decreased 35% (48 mA cm−2 to 31 mA cm−2) with charge/discharge limited to SOC (20%–80%). Continuing charge/discharge with a cutoff current of 5.56 mA cm−2 increased coulombic capacity by 43% (36.4 Ah l−1 to 51.9 Ah l−1) while average current density decreased 17% (27.7 mA cm−2 to 22.9 mA cm−2). Additional testing was performed with constant current charge/discharge (75 mA cm−2), limited by cutoff potential (1.35 V charge and 0.60 V discharge). Coulometric capacity increased 73.5% (26.5 Ah l−1 to 46.0 Ah l−1) with higher working potential for the 2.5 M Vanadium solution. Energy capacity increased 79.1% (25.3 Wh l−1 to 45.3 Wh l−1) with minimal change in charge/discharge power (90.7/−70.9 mW cm−2 to 92.1/−72.8 mW cm−2) and efficiency (77.1% to 78.4%).
Export citation and abstract BibTeX RIS

This is an open access article distributed under the terms of the Creative Commons Attribution 4.0 License (CC BY, http://creativecommons.org/licenses/by/4.0/), which permits unrestricted reuse of the work in any medium, provided the original work is properly cited.
Background
Energy demand across the world continues to increase, while our past sources of fossil fuels are causing an ever-growing surge of climate change around the globe. The need for renewable energy is higher than ever, yet there exists a systemic problem with its deployment; renewable energy cannot meet the power grid's unique cyclic demand. At the beginning of 2023, 3.9% of all US electricity production was solar, while an even larger 10.2% was wind power. 1 Overall in 2023, wind and solar accounted for 15.1% of all US electricity generation, and this is expected to increase to 18% in 2024. 2 While renewable, these two technologies do not provide constant power, instead cycling with ambient conditions that are not always predictable or avoidable. With renewable energy continuing to grow, some intermediary is necessary for production to match consumption.
Energy storage is a necessary part of the future electrical grid, and a plethora of storage technologies will be required. One ideally suited for base-load storage is the redox flow battery (RFB).
All RFBs operate by flowing two electrochemically active materials (typically dissolved in an electrolyte) through a battery composed of two porous electrodes and an ion exchange membrane as shown in Fig. 1. Paired redox couples produce a current through an external circuit while the ion exchange membrane allows the transport of spectator ions across the electrolytes to conserve charge balance. This characteristic uncouples power from capacity, allowing any installation to be custom-sized for a given need. Also, unlike a traditional battery pack, one can simply increase the size of the storage tanks to increase capacity without increasing the size of the expensive cell assemblies. 3,4
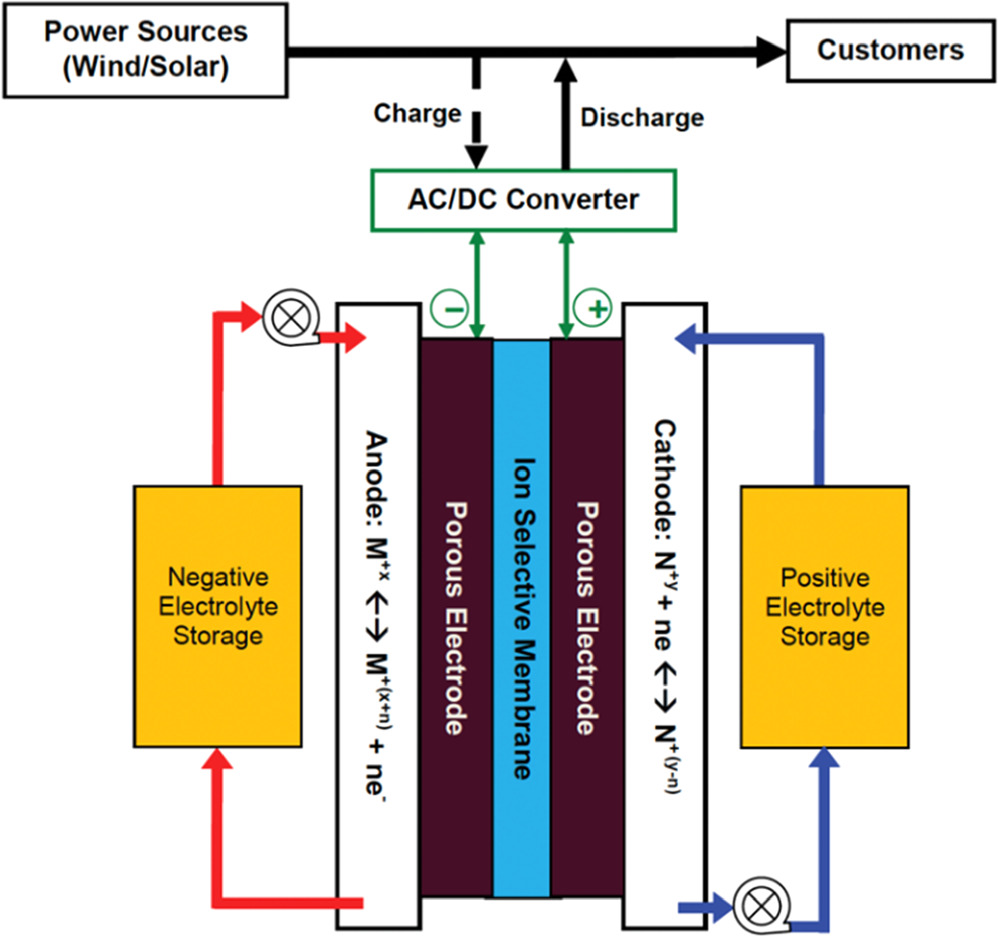
Figure 1. A redox flow battery system. 3
Download figure:
Standard image High-resolution imageMany different chemistries exist for RFBs, but the all-vanadium redox couples (V4+/V5+ and V2+/V3+) have several advantages. As there is only one active element present, any unwanted crossover through the membrane represents only a temporary loss in overall capacity until the sides can be rebalanced. Theoretically, an all-vanadium RFB could operate forever (assuming crossover is the only source of loss), but real systems are designed to last for decades and tens of thousands of charge cycles. 5 As vanadium sulfate, vanadium is easy to work with in an acidic environment, ideal for both RFB and fuel cell operation. There are some significant drawbacks to vanadium RFBs however. 3
Current vanadium RFBs have relatively low energy density (∼20–25 Wh kg−1), 4,6 especially when compared to other battery chemistries like Li-Ion (100–265 Wh kg−1), 4 but they can be used in significantly different ways. As we transition to more renewable energy sources the electrical grid will need to be able to handle significant shifts in power generation capacity alongside unchanged power demand. 7 The uncertainty and intermittent nature of renewable energy sources requires a long-term reliable energy storage system, and RFBs with the ability to uncouple power from capacity offer an ideal solution to this problem while avoiding the potential for material sourcing conflict in Li-Ion batteries such as Cobalt. 8
Acknowledging their limitations, vanadium RFBs can become more attractive if their energy storage capacity is brought closer to the realm of other battery technologies. One such method to achieve this increase is to operate far above "standard" concentrations, and even above the solubility limits (1.8 M at 20 °C). 6 Prior study shows that supersaturated vanadium solutions can remain stable for hours or even days, depending on supersaturation level, temperature, and the presence of stabilizing additives. 4,9,10
Previous works in the field have demonstrated operational vanadium RFBs with 2.5 M and 3.0 M vanadium through the use of chemical stabilizers, both organic and inorganic. 9,10 While performant, such stabilizers are not stable for long-term usage at the voltages utilized in an all-vanadium system. 10 Identifying this issue, our group has proposed a novel system of solid/liquid storage to enable the use of highly concentrated electrolytes in a gel-like solid form to increase overall vanadium concentrations without requiring the usage of chemical stabilizers. This approach utilizes the relatively high molarity of solid vanadium salts, such as the VOSO4·5H2O hydrate at 8.25 M volumetric density, 4 to store the active material. With a small volume of liquid electrolyte to carry this material to the electrodes, overall vanadium concentrations can theoretically approach 8 M, although incorporating more fluid at the expense of decreasing concentration to 4–6 M is in our opinion a more achievable goal. 4
The current methods by our group utilize a temperature swing approach to ensure that no electrolyte above the solubility limit of vanadium ions reaches the electrode surface, increasing temperature in the RFB and cooling the electrolyte before entering the storage tanks. 4 This prevents precipitation in the electrodes, but introduces added complexity, parasitic losses, and the potential for additional failure modes. Ideally this system could operate without the temperature swing, allowing momentary increases in vanadium concentration above the solubility limit to reach the electrode assemblies while greatly increasing energy density of the storage medium. Validation of RFBs with supersaturated electrolyte would allow for in-place replacement of existing installations, as well as higher-capacity future construction with the solid/liquid storage method. 4,11
We have highlighted above that oversaturated vanadium sulfate electrolytes can be stable, even in the presence of a nucleation material, for hours. If stable, the existing solid/liquid system can operate above the solubility limit during charge and discharge. This removes the need for a temperature swing, as the system operates above saturation in the electrode assembly, after which the electrolyte enters the storage tanks to precipitate. An additional benefit of such a system is the potential to increase charge/discharge efficiency. Higher concentrations of active species at the electrodes leads to higher electrochemical activities, increasing discharge and charge potential (and thus potentially increasing efficiency with the same over/under potential).
The objective of this work is to show the operational stability of supersaturated electrolytes in a vanadium redox flow battery (H2-V system) without any stabilizers. One of the largest current drawbacks of redox flow batteries is the low aqueous solubility of active ions in solution, severely limiting charge capacity and imposing high parasitic losses for pumping mostly water through the battery. If demonstrated feasible, redox flow batteries operating under supersaturated conditions could not only greatly increase existing capacity, but potentially allow for a solid/liquid storage concept to operate without a parasitic temperature swing system, increasing capacity even further.
Methodology
Preparation of supersaturated electrolyte
The supersaturated vanadium electrolyte for the positive electrode side of the H2-V system was prepared by the dissolution of vanadyl sulfate hydrate (VOSO4 4H2O ordered from MilliporeSigma at 97% purity), in DI water at 80 °C with applied stirring. Once complete dissolution was accomplished, the appropriate volume of 98% H2SO4 was introduced to reach desired bulk sulfate concentration and the solution is stirred for an additional period to ensure complete dissolution. This solution is allowed to cool to 40 ± 5 °C for safe handling then transferred to an acrylic storage vessel. This storage vessel is then plumbed to the RFB and the solution is allowed to cool to room temperature for immediate use. Prior studies show this preparation method resulted in only dissociated vanadium sulfate ion pairs.
12
At this stage, the solution contains only VO2+ ions, so for testing with VO2
+ ions it is electrochemically oxidized in the flow battery used for capacity testing.
4H2O ordered from MilliporeSigma at 97% purity), in DI water at 80 °C with applied stirring. Once complete dissolution was accomplished, the appropriate volume of 98% H2SO4 was introduced to reach desired bulk sulfate concentration and the solution is stirred for an additional period to ensure complete dissolution. This solution is allowed to cool to 40 ± 5 °C for safe handling then transferred to an acrylic storage vessel. This storage vessel is then plumbed to the RFB and the solution is allowed to cool to room temperature for immediate use. Prior studies show this preparation method resulted in only dissociated vanadium sulfate ion pairs.
12
At this stage, the solution contains only VO2+ ions, so for testing with VO2
+ ions it is electrochemically oxidized in the flow battery used for capacity testing.
Flow cell characteristics
Two H2-V Battery flow systems were assembled similarly to the battery in Fig. 1, the first seen here in Fig. 2. They consist of an electrode assembly, a peristaltic pump (MasterFlex L/S, model 77390–00), and a storage container. For a H2-V battery, the negative electrolyte pumping system is replaced by a pass-through hydrogen gas flow system, providing a minimum excess (enough to form several bubbles per second in a back-flow preventing water bath). The batteries use carbon interdigitated flow fields 1 mm in depth and width, 13 spaced 1 mm apart with an exposed flow area of 4 cm by 4 cm or 16 cm2. The liquid vanadium electrolyte sides use two layers and four layers of SGL-39AA carbon paper as electrode. The gas side uses a gas diffusion electrode (GDE) made of SGL-35BC coated with 0.56 mg cm−2 Pt that was hot-pressed (@ 220 N, 135 °C, for 7 min) onto a Nafion® 212 membrane to form a half membrane-electrode-assembly (MEA). This half-MEA and two to four layers of carbon electrodes on the electrolyte side together form a complete MEA of the H2-V cell. For calculation of areal density values, an active 16 cm2 electrode area will be assumed as there is minimal activity in the electrode outside the established flow area. The flow battery with two layers of carbon electrode was used for the first round of testing, followed by the creation of a new MEA assembly with thicker electrodes (four layers of carbon electrode) to ensure adequate surface area for the chosen charge/discharge current density.
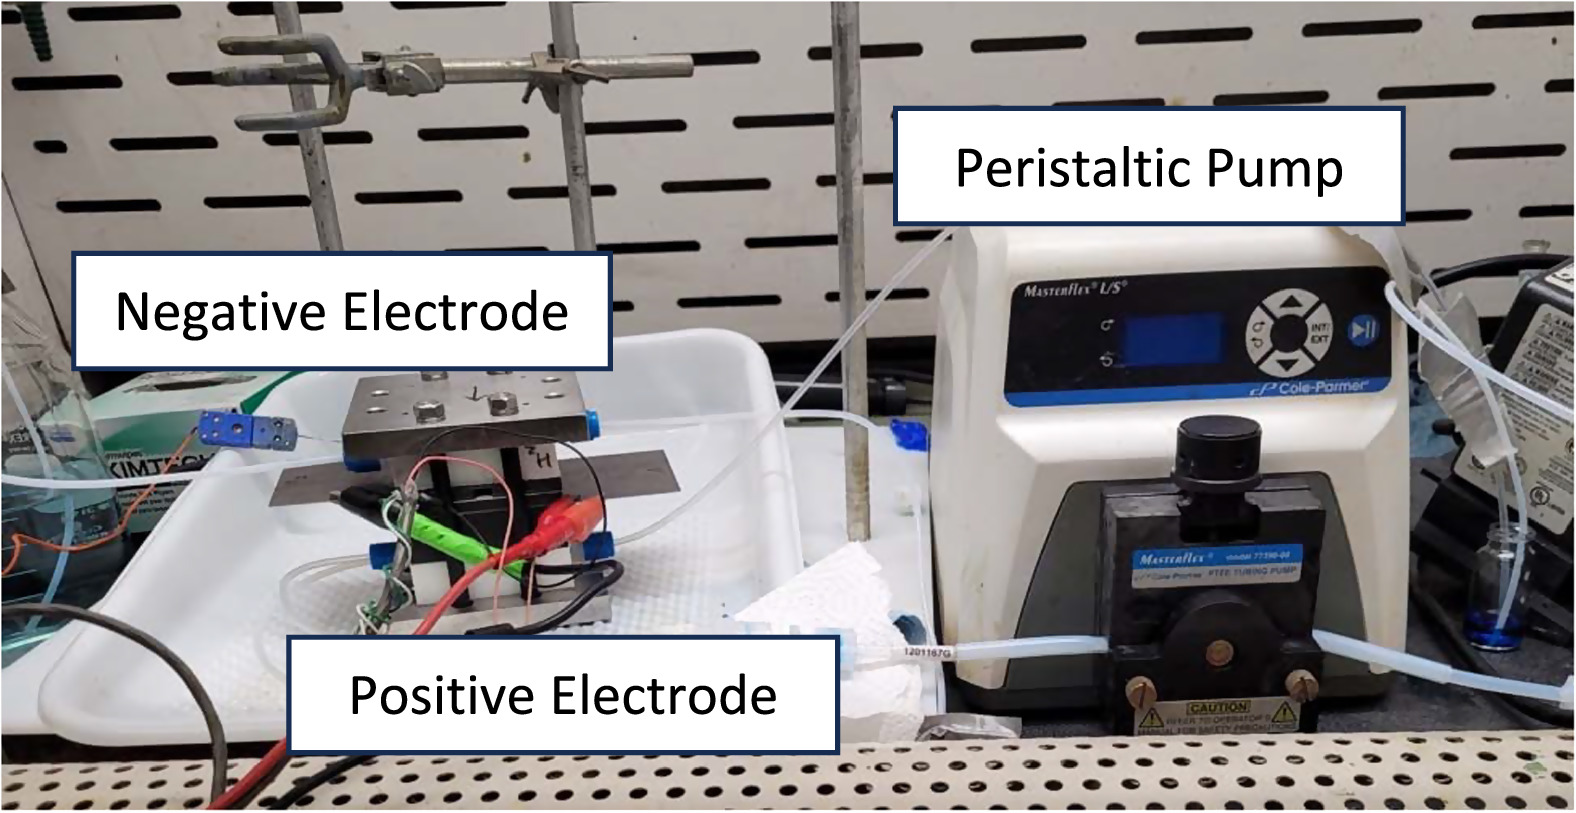
Figure 2. Supersaturated Flow battery, RFB assembly left and peristaltic pump right.
Download figure:
Standard image High-resolution imageOperating and testing conditions
All redox flow battery tests were performed at room temperature (23 ± 2 °C), with a standard liquid electrolyte flow rate of 0.75 ml s−1. This is well above stoichiometric (50–200x) at the discharge rates tested, ensuring uniform concentration of charged species throughout the battery. Two sets of tests were performed with the first flow battery, using 25. ml of 1.5 M VOSO4/3.0 M H2SO4 and 2.5 M VOSO4/3.0 M H2SO4 followed by two tests with the second flow battery, using 50. ml of 1.5 M VOSO4/3.0 M H2SO4 and 2.5 M VOSO4/3.0 M H2SO4. The 1.5 M Vanadium solution represents a conventional electrolyte system, included for performance comparison.
In initial testing all charge and discharge was performed at 1.35 V/0.65 V constant potential. Two distinct regimes were tested in charge/discharge, coulometric limited and current limited. For the 2.5 M vanadium supersaturated electrolyte, the first three cycles were performed between 20% and 80% SOC (excepting the start of cycle 1 at 0% SOC), to represent a conservative "controlled" charge and discharge. A 60% "swing" in SOC at 2.5 M V represents 40.2 Ah l−1 of electrolyte, comparing favorably to a more traditional 1.5 M V electrolyte allowed to cycle from 20% to 80% (24.1 Ah l−1). Once finished, the final five cycles were limited by a cutoff current in place of a coulombic measurement to allow a wider "swing" in SOC to increase overall capacity.
This data was used to test for charge/discharge performance, followed by a more conventional charge/discharge cycle at constant current rather than constant potential. The new battery was designed to support a constant 75 mA cm−2 current density at room temperature. Assuming discharge at ∼1 V discharge power will be roughly 75 mW cm−2, considerably lower than many commercial systems operating currently. Operation is carried out at ambient temperature conditions to avoid the added complexity of a heated circulation system, noting that areal power density increases with temperature by 2.3 mW cm−2 C−1 at a current density of 40 mA cm−2. 14 With an increase to 35 °C this flow battery is expected to support a discharge power of 100 mW cm−2, following a proportional increase with temperature to that observed at lower current densities.
New tests were performed at this 75 mA cm−2 charge and discharge with cutoff potentials of 1.35 V for charge and 0.6 V for discharge to better simulate the constant power mode used in industry. Cycling began after an initial charge to ∼100% SOC (cutoff current of 5.6 mA cm−2), followed by a standard 75 mA cm−2 pre-test discharge to reach typical minimum operating charge conditions. Between each charge and discharge open circuit potential (OCV) was monitored for five minutes. Final electrolyte stability was measured by visual observation. Once all tests were completed, the electrolyte was transferred to a glass vessel and sealed, to prevent water loss. At 3 M initial H2SO4 concentration, the solubility limit of VO2+ ions at room temperature is 1.8 M, significantly below the 2.5 M electrolyte when at 0% SOC.
A separate solution of pure VO2 + ions (2.5 M) was generated for analysis as well. It was stored for 5 days under several different conditions; at room temperature (23 ± 2 °C) and at 40 ± 2 °C, both with and without constant stirring, and in the presence of activated carbon felt.
An Arbin MITS'97 System potentiostat is used for all testing. On the channel used for these tests voltage accuracy is ±5 mV and current accuracy is ±10 mA, with repeatability of ±1 mV and ±2 mA.
Results and Discussion
The constant potential charge and discharge performance of the H2-V cell with 1.5 M and 2.5 M supersaturated vanadium electrolytes under coulombic cut-off limits are shown in Figs. 3, 4. As shown in Figs. 3 and 4 there is a significant impact on performance from the first cycle as the Nafion® membrane fully hydrates and the electrodes saturate. The initial SOC swing of 20% to 80% was chosen as a conservative limit, to establish the feasibility of a supersaturated redox flow battery. Except for the first cycle where activation played a significant role, average charge and discharge performance are 54.2 mA cm−2 and −53.4 mA cm−2 respectively for the 1.5 M electrolyte and 35.3 mA cm−2 and -35.1 mA cm−2 for the 2.5 M electrolyte, respectively. Charge capacity was artificially limited to a 60% change in SOC, representing 24.1 Ah l−1 capacity for 1.5 M and a 40.2 Ah l−1 capacity for 2.5 M. This demonstrates a 34.6% decrease in charge/discharge performance and a 66.7% increase in capacity from 1.5 M to 2.5 M. The decrease in performance observed here is proposed to be caused by a decrease in diffusivity through the boundary layer between bulk electrolyte and the electrode surface from the increase in fluid viscosity from 1.5 M to 2.5 M. 15 There is also significant noise seen in the charge section of these cycles. As charge occurs at a high constant potential of 1.35 V there could be many contributing factors, but we suspect that flooding was occurring in the hydrogen electrode. At this high overpotential, especially at the onset of the applied potential electro-osmotic drag brings a significant amount of water to the hydrogen electrode through the proton exchange membrane, and the low hydrogen flow rate may not be sufficient to flush the electrode. Bubbling of hydrogen increases the local concentration and decreases activity, until they burst and activity resumes. Vibration of the peristaltic pump could also contribute to this effect as well as the creation of non-even flow in the vanadium electrode.
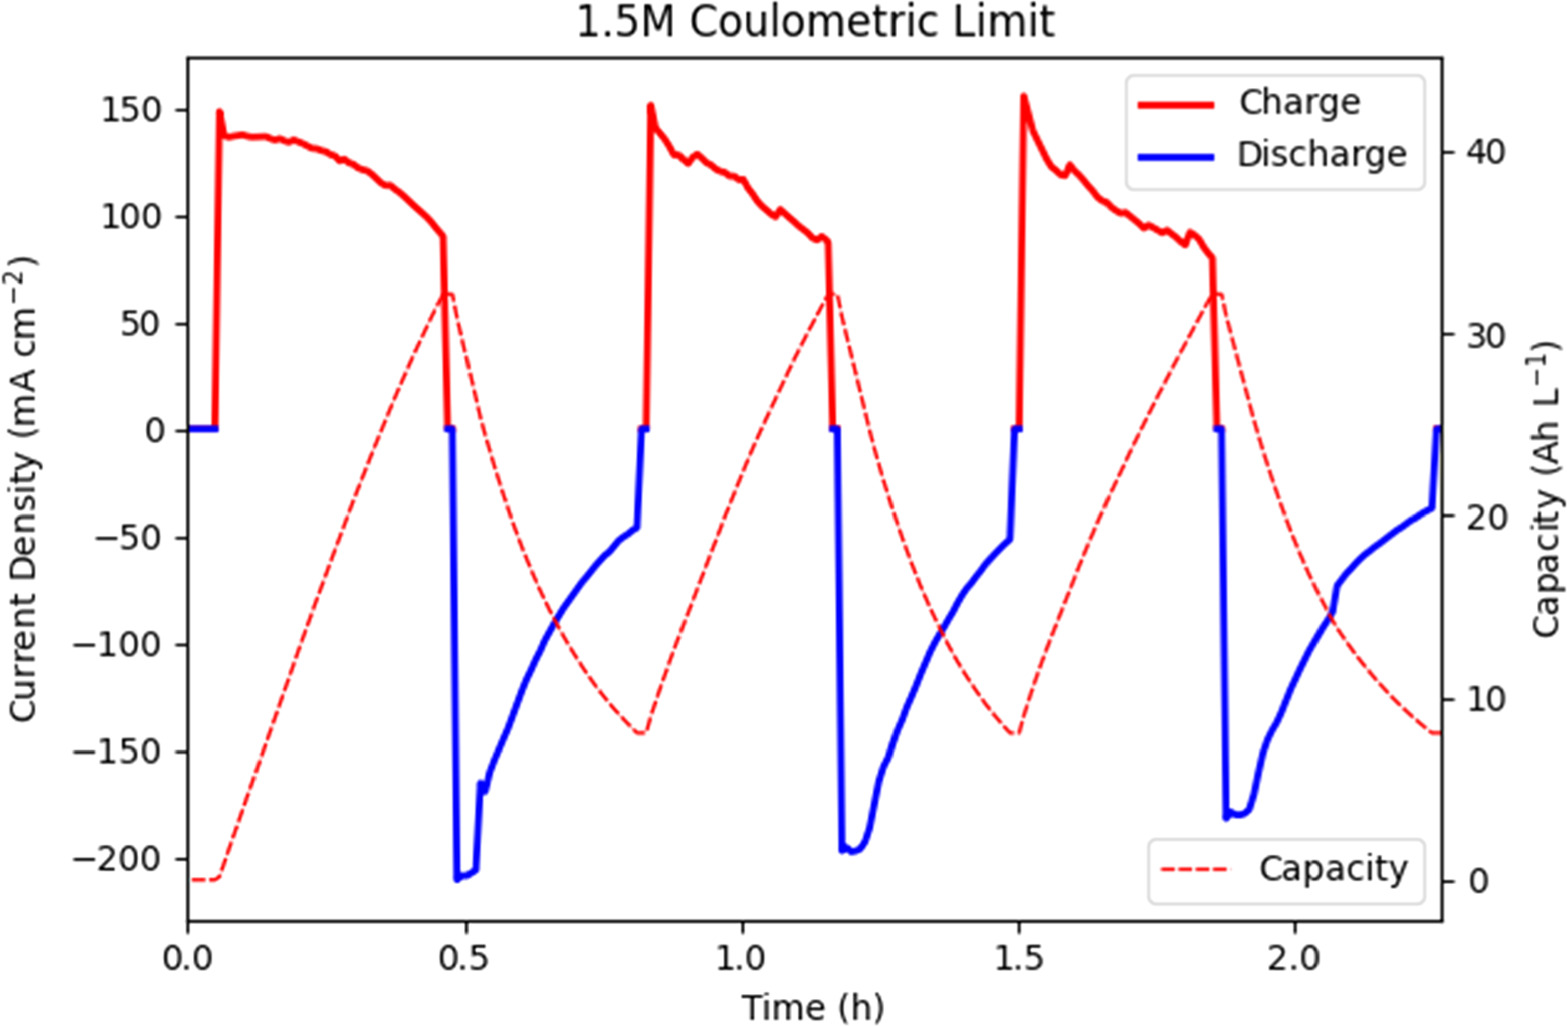
Figure 3. Cycling test of charging and discharging performance at 1.35 V and 0.65 V with 8.0 Ah l−1 and 32.2 Ah l−1 (20% and 80% SOC) lower and upper coulombic cutoff for 1.5 M V electrolyte.
Download figure:
Standard image High-resolution image
Figure 4. Cycling test of charging and discharging performance at 1.35 V and 0.65 V with 13.4 Ah l−1 and 53.6 Ah l−1 (20% and 80%) lower and upper coulombic cutoff for 2.5 M V electrolyte.
Download figure:
Standard image High-resolution imageWith this conservative operation established, the next five constant potential cycles were allowed to "fully" charge and discharge, limited by a cutoff current of 5.6 mA cm−2. Again seen in Figs. 5 and 6, the 1.5 M electrolyte generated higher current densities than the 2.5 M electrolyte, with an average current density of 31.2 mA cm−2 compared to 25.8 mA cm−2. The 1.5 M electrolyte charged to a peak capacity of 43.0 Ah l−1 and the 2.5 M electrolyte charged to 62.6 Ah l−1. Compared to the theoretical capacities of 40.2 Ah l−1 and 67 Ah l−1, SOC reached 107% and 93.5% for the 1.5 M and 2.5 M electrolytes, respectively. The greater than 100% SOC here represents the presence of some side reaction that consumes current during charging, measured during past use of this electrode assembly at <10 mA; as charge capacity is measured cumulatively throughout the experiment, an overestimation of up to 3 Ah l−1 (7.2% theoretical SOC) for the 1.5 M electrolyte is expected, bringing coulombic efficiency down. The absolute value of capacity is less meaningful than the change however, and the electrolytes exhibited peak discharge capacities of 36.4 Ah l−1 and 51.9 Ah l−1 for 1.5 M and 2.5 M, respectively. Side reaction current during discharge was measured to be <1 mA (below accurate potentiostat uncertainty) and was thus deemed insignificant. This represents a 17.3% decrease in charge/discharge performance for a 42.6% increase in charge capacity. Again the charge cycle is unusually noisy, proposed to be cause by the earlier mentioned flooding of the hydrogen electrode and possible uneven electrolyte flow.
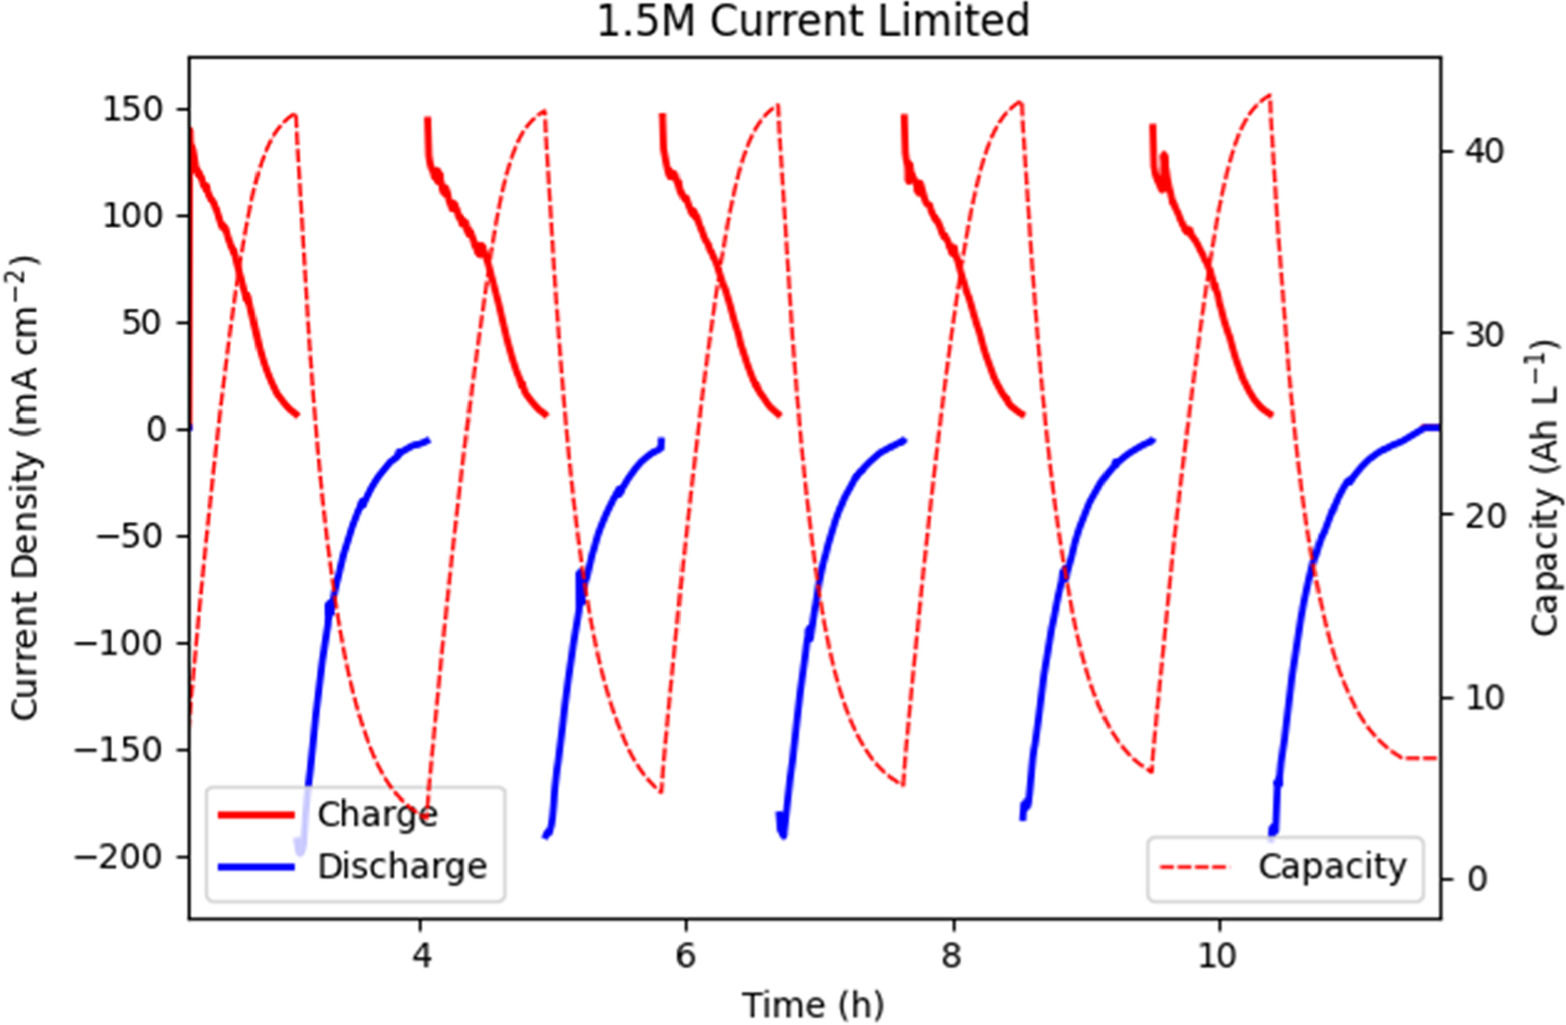
Figure 5. Cycling test of charging and discharging performance at 1.35 V and 0.65 V with 100 mA (5.56 mA cm−2) cutoff current for 1.5 M V electrolyte.
Download figure:
Standard image High-resolution image
Figure 6. Cycling test of charging and discharging performance at 1.35 V and 0.65 V with 100 mA (5.56 mA cm−2) cutoff current for 2.5 M V electrolyte.
Download figure:
Standard image High-resolution imageWhile coulometric efficiency (the ratio of Ah l−1 discharged to charged) is represented within expected error at 93.2% for the 1.5 M solution and 98.0% for the 2.5 M solution, energy efficiency (the ratio of Wh L−1 discharged to charged) is considerably lacking. As seen in Fig. 7, the 1.5 M solution accepted 45.9, 52.5, 51.0, 50.8, and 50.2 Wh l−1 for cycles 4–8 respectively, but at the set charge/discharge potentials of 1.35/0.6 V discharged only 27.1, 26.2, 26.2, 25.8, and 25.5 Wh l−1. This represents an average energy efficiency of only 52.4%, a product of the chosen constant potential charge/discharge method. The 2.5 M solution similarly accepted 66.4, 68.6, 62.5, 68.6, and 67.3 Wh l−1 for cycles 4–8 respectively and discharged only 35.7, 32.3, 36.4, 35.6, and 33.4 Wh l−1. The 2.5 M solution has an average energy efficiency of 52.1%, comparing favorably to the undersaturated 1.5 M solution.
Limiting by current naturally pushes operating conditions towards higher concentrations of VO2 + instead of VO2+ and the faster kinetics of the VO2 + to VO2+ reaction. This natural decrease in performance at low SOC (and higher relative concentrations of highly soluble VO2 + ions that imposes on long-term operation) is not undesirable, as the long-term storage of high concentration VO2+ is susceptible to precipitation. 4 There are some significant variations between cycles as the minimum SOC is reached, possibly affected by varied battery temperature. The battery assembly was measured at 22.0 °C when testing initiated, raising to 24.0 °C during peak discharge current of the first cycle and fluctuating between 21 °C and 25 °C throughout testing.

Figure 7. Cumulative Current capacity measurement of all eight cycles for both 1.5 M and 2.5 M system.
Download figure:
Standard image High-resolution imageWhile supersaturated VO2+ can rapidly precipitate in the presence of a nucleation material, like the carbon surface of tested electrodes, precipitation is not observed during the initial charge (when [VO2+] is 2.5 M). This could be because during charge where VO2+ is converted to VO2 + the supersaturated VO2+ does not have extended contact time with the nucleation material (carbon) surface. Precipitation of VO2+ during cycling is also not observed. As seen in Fig. 8, the solution only exceeds the solubility limit (1.8 M) 16 for times on the order of 1 h, while previous study has shown that low supersaturated solutions (oversaturation level ≤0.7 M) can be stable for 17 h. 4 This same study has shown that near the saturation point and beyond, some of the ions exist as electrochemically inactive non-dissociated ion pairs that are unable to participate in redox reactions. While they readily convert to dissociated ion pairs this creates two separate "species" of ions, potentially decreasing the drive for precipitation by decreasing the local concentration of active ions in solution.
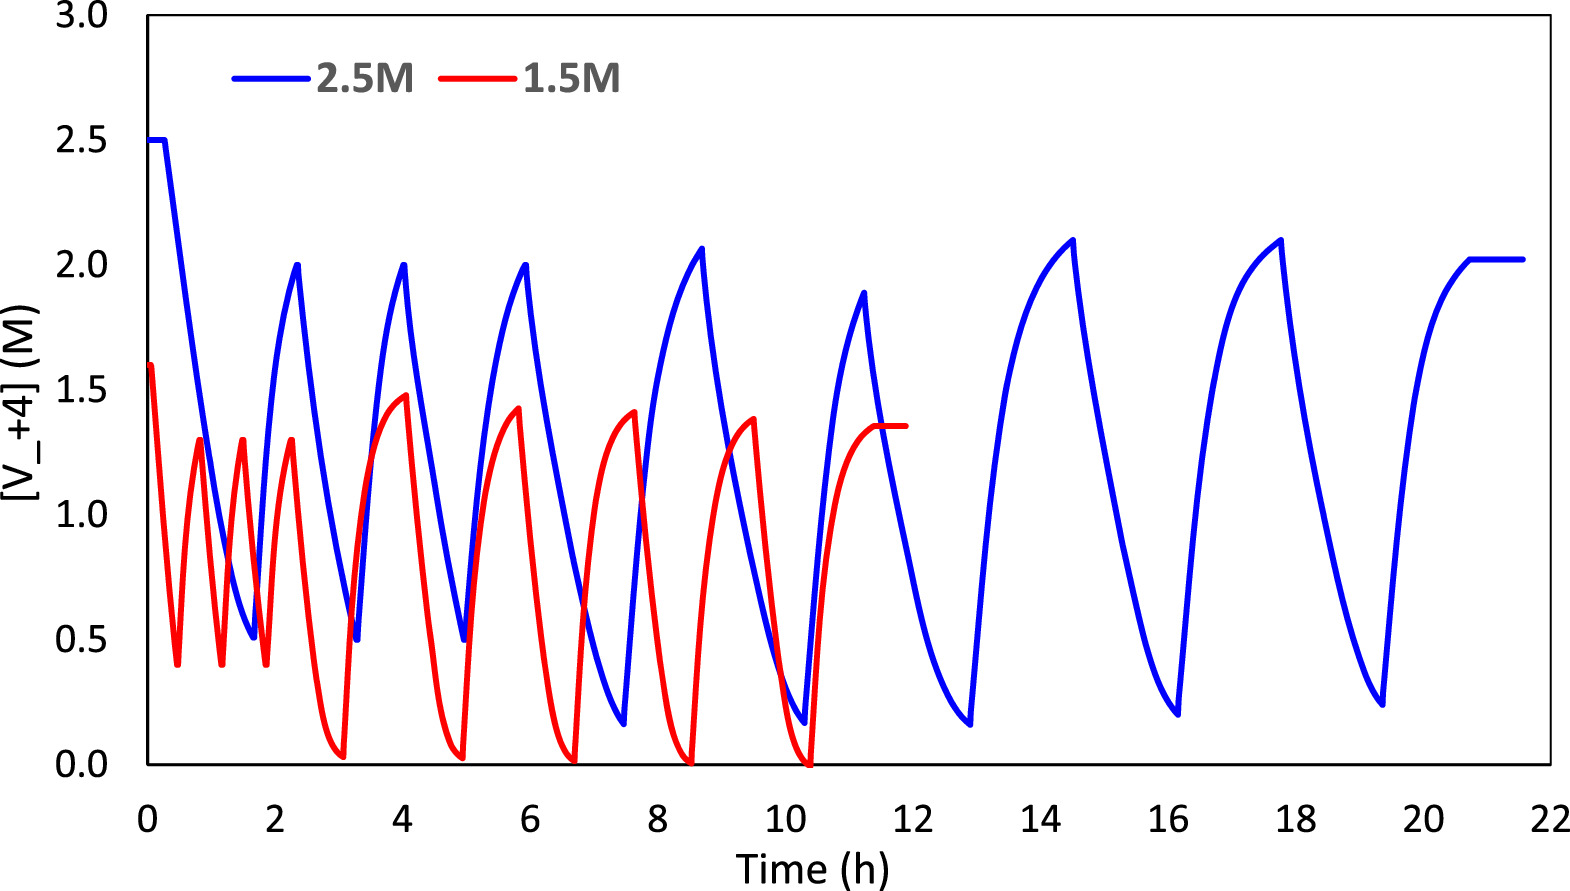
Figure 8. Comparison of Vanadyl Ion [VO2+] in solution over time.
Download figure:
Standard image High-resolution imagePrecipitation of VO2 + at 2.5 M has not been an issue as it seems to be stable at this concentration for a very long time even in the presence of nucleation materials. That being said, the long-term stability of VO2 + ions can be impacted heavily by its thermal stability. At room temperature (23 ± 2 °C), 2.5 M VO2 + is stable in the presence of activated carbon felt nucleation material for at least 5 days with and without agitation. At the elevated temperatures potentially seen in flow batteries (40 ± 2 °C) visual precipitation was observed regardless of any other variables within days.
When the last cycle completed the 2.5 M electrolyte was stored at its final SOC of 19.1%, corresponding to a VO2+ concentration of 2.02 M. At 3 M initial H2SO4 concentration, the solubility limit of VO2+ ions is 1.8 M, 16 significantly less than stored conditions. However, the electrolyte was stored at 2.02 M (0.22 M oversaturation) for two weeks with no sign of precipitation.
The first test done at constant current can be seen in Figs. 9 and 10, comparing coulometric charge to working potential. In comparison to the previously charge limited tests, the constant current operating mode with cutoff potential yields more consistent charge and discharge capacities. Charge capacities for the 1.5 M Vanadium solution averaged 26.5 Ah l−1 over all five cycles, with 26.4 Ah l−1 discharge capacity. Charge capacities for the 2.5 M Vanadium solution averaged 46.0 Ah l−1 over all five cycles, with 46.0 Ah l−1 discharge capacity to match. Coulombic efficiency (the ratio of discharge capacity to charge capacity) was 99.8% for the 1.5 M solution and 100.% for the 2.5 M solution, within error of 100% for both. As shown in Fig. 11, neither solution reached full charge, instead cycling between a state of low charge and high charge representing a total SOC swing of 65.9% for the 1.5 M solution and 65.7% for the 2.5 M solution. Thus, at the same current density of 75 mA cm−2, the 2.5 M solution shows a usable 73.5% increase in coulometric capacity. The slight mis-match of charge to discharge capacity is most likely due to cross-over of vanadium ions through the ion exchange membrane, along with side-reactions such as carbon oxidation. It is notable that we no longer see any significant noise on charge, likely because at constant current the working overpotential is significantly lower, while the total applied potential remains low until the exponential increase at the end of each cycle.
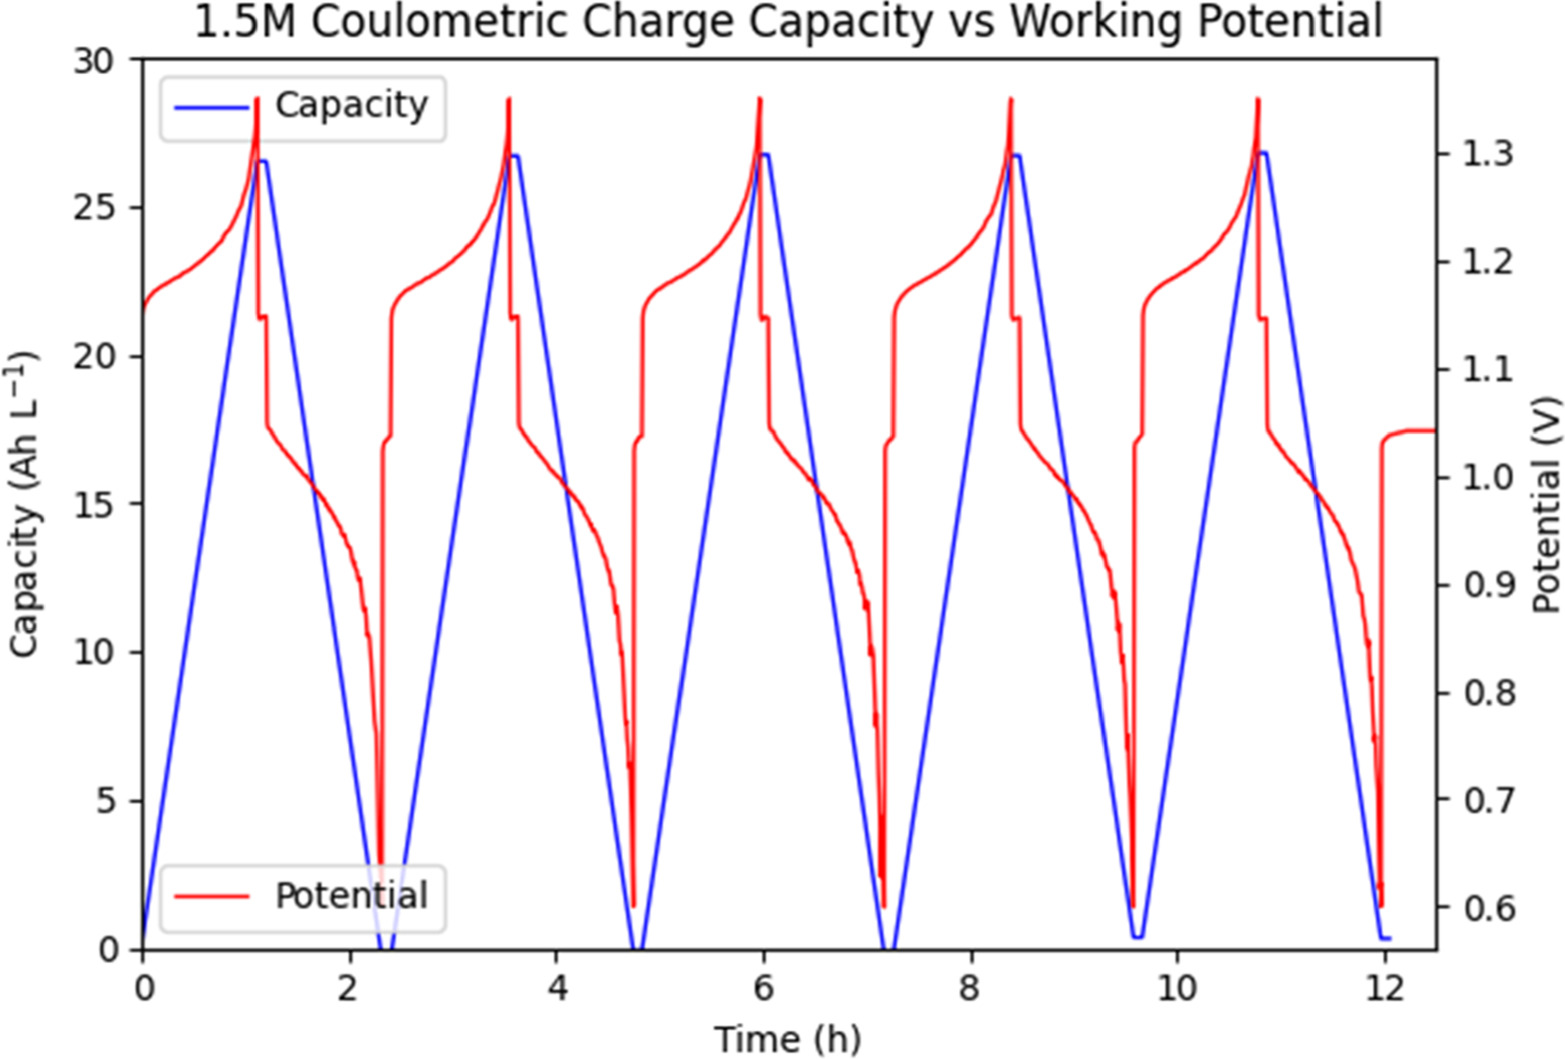
Figure 9. Comparison of coulometric charge vs working potential at constant charge/discharge current of 75 mA cm−2 over time for a 1.5 M Vanadium solution.
Download figure:
Standard image High-resolution image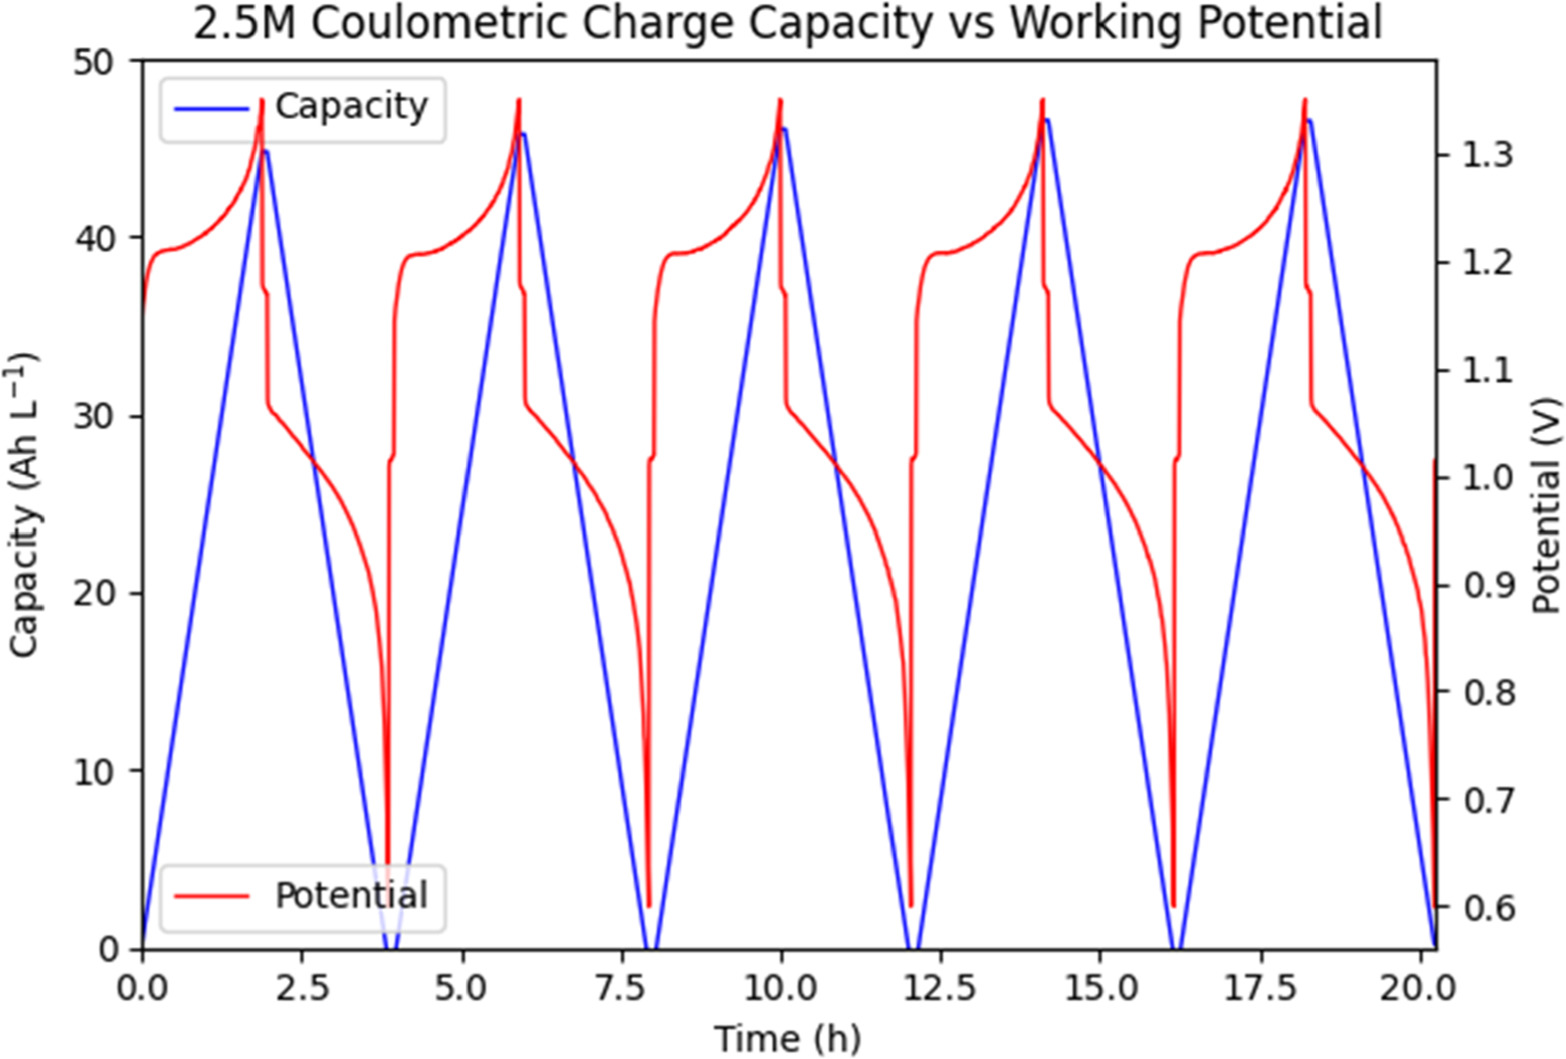
Figure 10. Comparison of coulometric charge vs working potential at constant charge/discharge current of 75 mA cm−2 over time for a 2.5 M Vanadium solution.
Download figure:
Standard image High-resolution image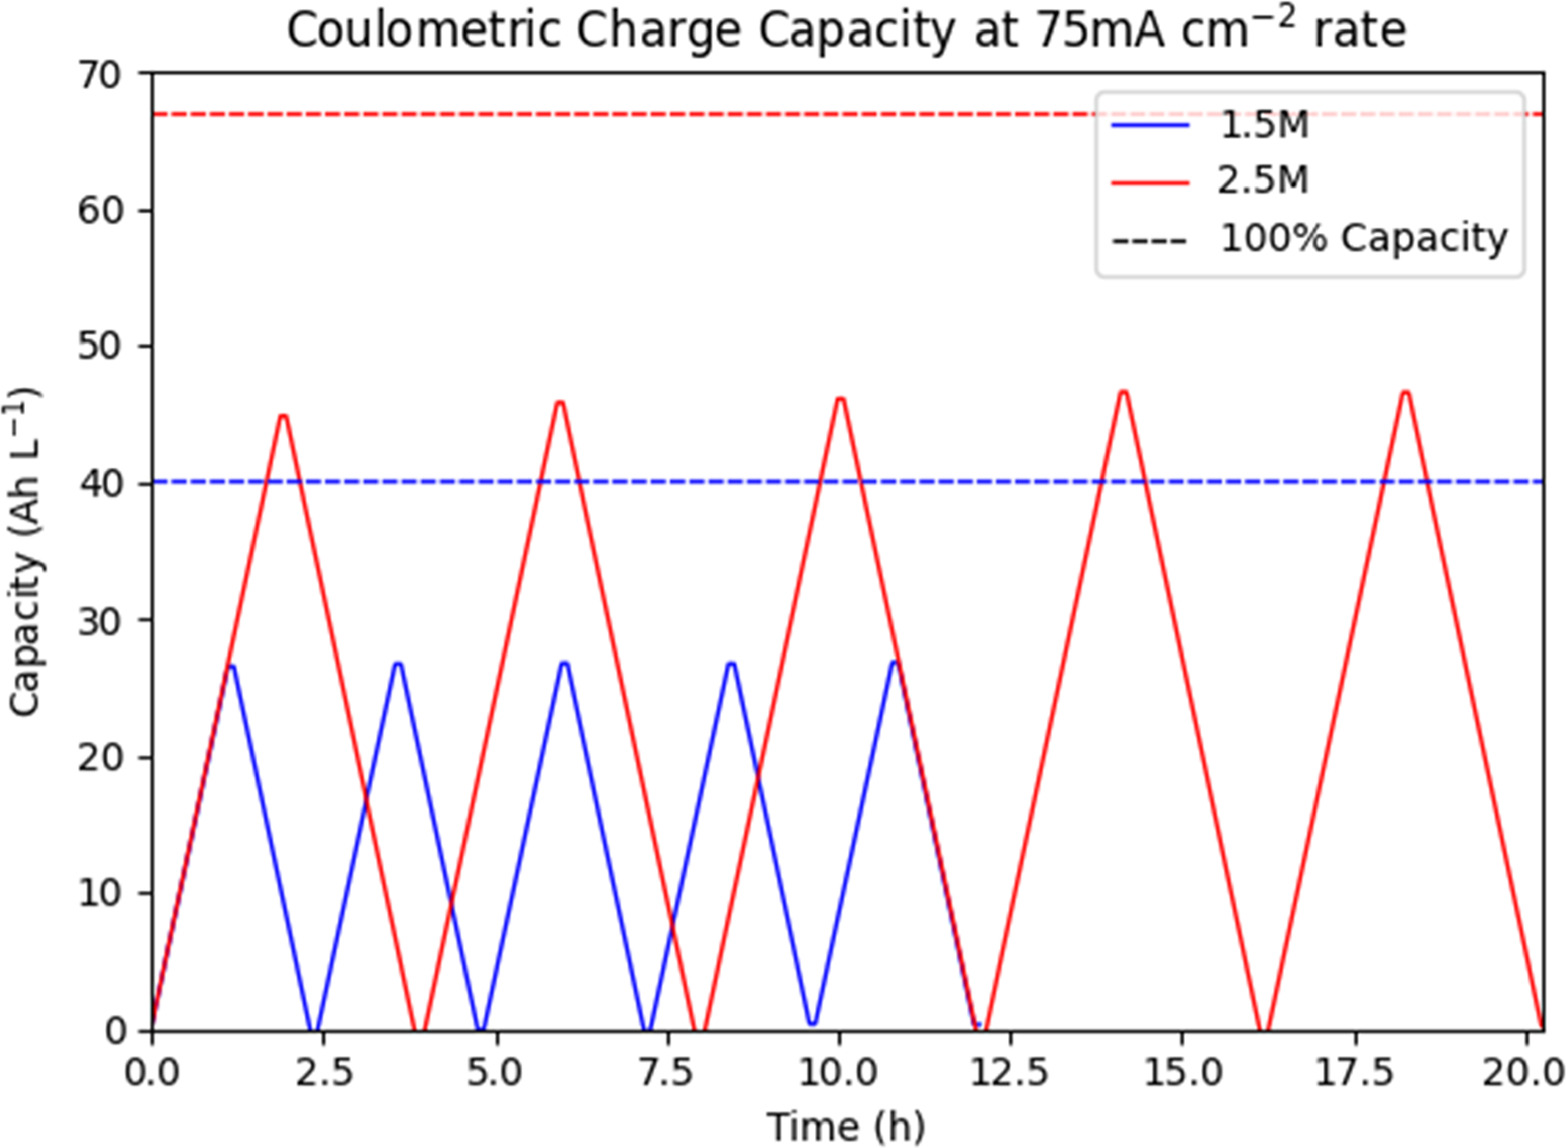
Figure 11. Comparison of coulometric charge capacity of 1.5 M and 2.5 M Vanadium solutions, observed and theoretical maximum, with time.
Download figure:
Standard image High-resolution imageWorking potential for the 1.5 M Vanadium solution shows a typical sharp increase at the beginning of each charge cycle as the activation overpotentials and "equilibrium" conditions are established in the ion exchange membrane and transport boundaries. This is followed by an exponential increase in required potential as the solution OCV increases, following the Nernst equation with changing concentrations of VO2+ and VO2 + ions. This is mimicked by a similar sharp decrease at the beginning of discharge, followed by an exponential decrease in potential. The 2.5 M Vanadium solution follows the same general trend, with the notable addition of a potential plateau at the beginning of each charge cycle. As noted from earlier research, supersaturated solutions of VO2+ ions consist of a mixture of active and inactive electrochemical species. Initially a population of dissociated ions exists alongside one of non-dissociated ion pairs unable to interact electrochemically. Oxidation of VO2+ ions to VO2 + ions decreases the concentration of these active dissociated ions, forcing the conversion of inactive non-dissociated ion pairs to their active dissociated ionic form, significantly delaying the onset of exponential potential increase during charge.
The charge and discharge energy of both solutions is shown in Figs. 12 and 13, comparing power with charge and discharge energy capacity. As can be seen from these figures the constant current operation is a much better approximation of the constant power operation most industrial flow batteries operate. For the 1.5 M solution charge power averaged 90.7 mW cm−2 with an average discharge power of −70.9 mW cm−2. For the 2.5 M solution charge power averaged 92.4 mW cm−2 with an average discharge power of −72.8 mW cm−2. As can be seen from the vertical skewing of power, more energy is required to charge the solutions than is yielded in their discharge. The 1.5 M solution consumed on average 32.9 Wh l−1, while producing 25.3 Wh l−1. The 2.5 M solution consumed on average 57.8 Wh l−1, while producing 45.3 Wh l−1. Defining efficiency as the ratio of energy output to energy input, the 1.5 M solution had an average efficiency of 77.1% while the 2.5 M solution reached 78.4%. Thus, with similar efficiencies, the 2.5 M solution shows a usable 79.1% increase in usable discharge energy capacity.
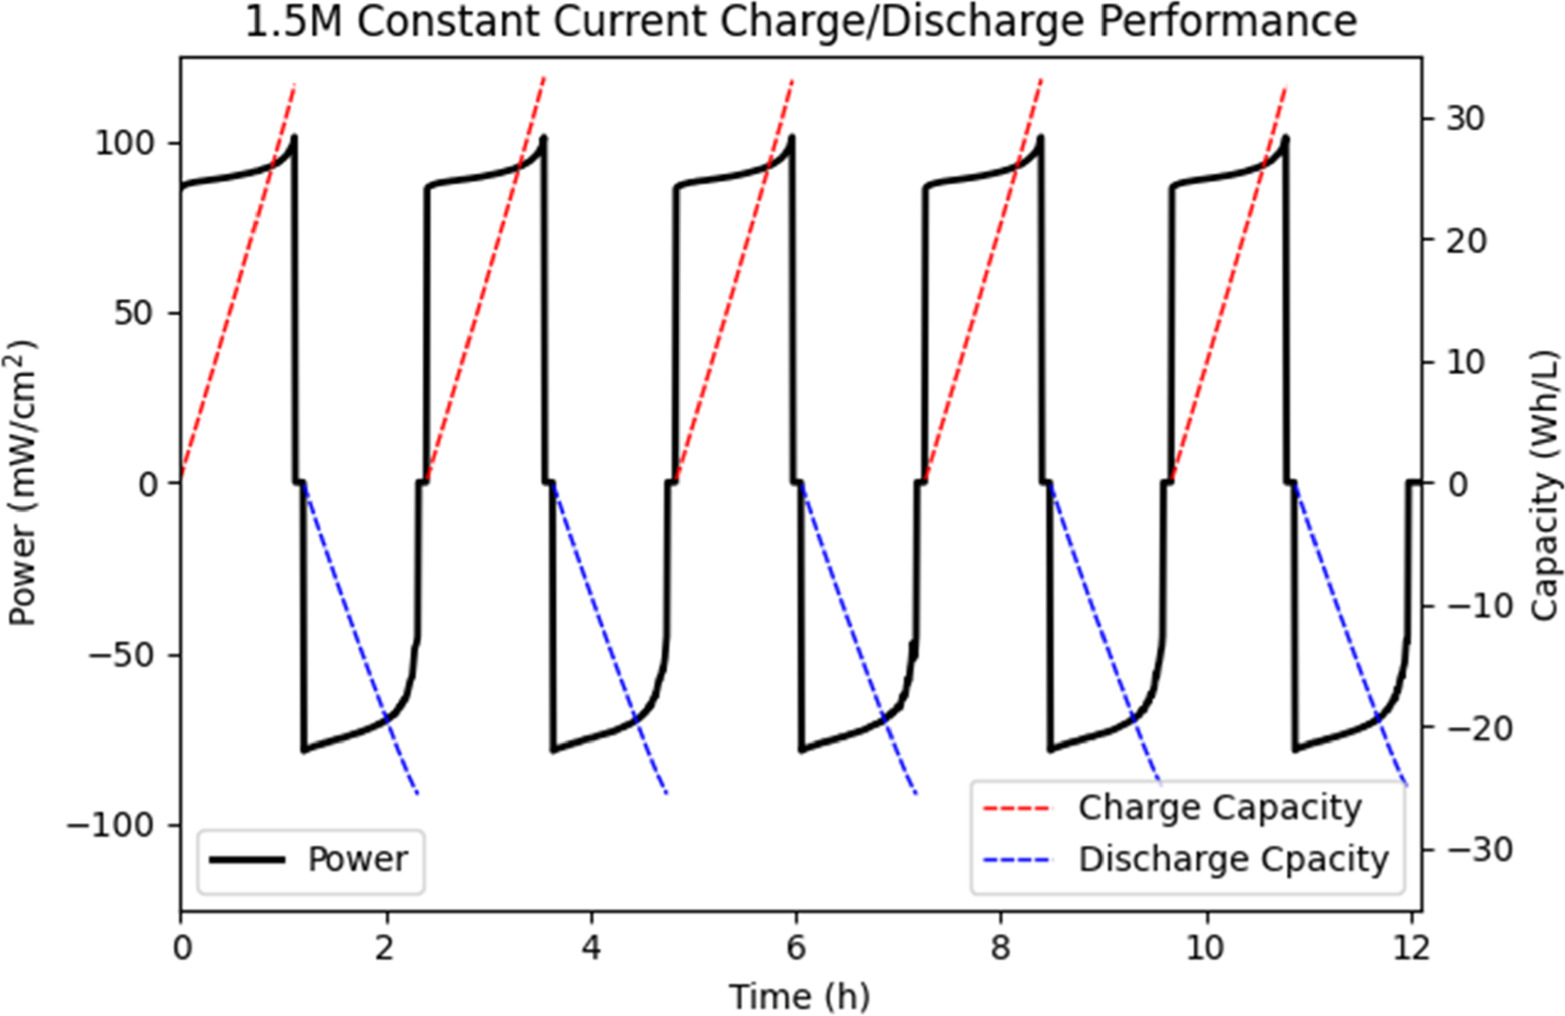
Figure 12. Comparison of charge and discharge energy vs power at constant charge/discharge current of 75 mA cm−2 over time in a 1.5 M Vanadium solution.
Download figure:
Standard image High-resolution image
Figure 13. Comparison of charge and discharge energy vs power at constant charge/discharge current of 75 mA cm−2 over time in a 2.5 M Vanadium solution.
Download figure:
Standard image High-resolution image
Conclusions
An operational supersaturated V-H2 RFB was proposed to address the current low specific capacity of said redox batteries, with the potential to aid in operation of a future solid/liquid storage concept. This was proposed and investigated in three operating modes and compared to a "traditional" undersaturated RFB. It is clear from collected data that a supersaturated vanadium redox flow battery can operate in a continuous mode, and that electrolyte in storage can be stable on the timescale of weeks. With the assumption that a redox flow battery charges and discharges daily, supersaturated operation can be claimed as stable in the lab, with a 79% increase in energy capacity when going from 1.5 M to 2.5 M total vanadium concentration when cycling at industrially viable constant current densities. With minimal modification, an existing 4 h-vanadium flow battery system could be converted to a supersaturated flow system with an increased operating time of 7.16 h.
Continuous and extended circulation of highly supersaturated VO2+ through the cell could, from past experience, result in precipitation on the time scale of ∼20 h. In our tested examples, concentrations of VO2+ ions were in the supersaturated region for less than 2 h per cycle. For deep discharges (i.e., high VO2+ ion concentration) followed by prolonged periods of low energy availability it is not certain that supersaturated conditions could remain stable. Future research will be done to study this case, including the potential for constant low-power charge/discharge cycling to ensure the electrolyte in contact with electrode surfaces remains below saturation during long downtime. The thermal stability of VO2 + is also potentially limiting for long-term use in non-conditioned flow batteries, and further research is required in this area to determine the feasibility of in-cell reconditioning to regenerate degraded ions.
This operating condition has never been attempted, so several different operating parameters have yet to be tested and are not included in this report. We have yet to test variations in electrolyte flow rate, higher surface area electrodes, different electrode surfaces, and different flow patterns in the electrodes. Future work at different temperatures, higher vanadium concentrations, stability and solubility of other vanadium ions, and other redox reactions (i.e., Fe2+/Fe3+ and V2+/V3+ couple) will be reported.