
Abstract
The electrocatalytic activity of silver towards imidacloprid reduction was demonstrated at both macro- and nano-scales. Coupled with the advantages of microscopic electrodes, this has led to the development of a highly-sensitive and selective electrochemical sensor for imidacloprid detection. This sensor utilizes silver nanoparticle-decorated carbon fiber microelectrodes (AgNPs/CF) fabricated through a single-step electrodeposition. Employing AgNPs/CF, the linear range, sensitivity, and limit of detection (3SB/m) were determined to be 0.0–0.40 mM, 2.98 × 10⁻⁸ ± 0.10 × 10⁻⁸ A mM−1, and 60.4 nM, respectively. The sensor was successfully applied to detect imidacloprid directly in various water samples without the need for sample preparation, demonstrating ca. 100% recoveries. Moreover, the sensor was applied to analyze imidacloprid release from contaminated soil samples, revealing Langmuir characteristics of the desorption process.

Export citation and abstract BibTeX RIS

This is an open access article distributed under the terms of the Creative Commons Attribution Non-Commercial No Derivatives 4.0 License (CC BY-NC-ND, http://creativecommons.org/licenses/by-nc-nd/4.0/), which permits non-commercial reuse, distribution, and reproduction in any medium, provided the original work is not changed in any way and is properly cited. For permission for commercial reuse, please email: permissions@ioppublishing.org.
In recent years, the utilization of insecticides in agricultural industry has raised concerns about their potential impacts on the environment and human health. Imidacloprid ((EZ)−1-(6-chloro-3-pyridylmethyl)-N-nitroimidazolidin-2-ylideneamine, refer to Scheme 1), which belongs to the neonicotinoid class, is one of the most widely used insecticides globally. Its mechanism relies on the binding to the nicotinic acetylcholine receptor in the central nervous system of insects, resulting in their paralysis and eventual death. 1 Imidacloprid is highly soluble with the water solubility of 0.58 g l–1 and it maintains remarkable stability in water for over 30 days. 2 Its soil half-life varies, ranging from 40 days in unamended soil to a prolonged duration of up to 124 days in soil amended with organic fertilizers. Consequently, the detection of imidacloprid in various environmental samples is important to indicate its potential ecological implications.
Conventional methods used for determining imidacloprid (IMP), such as high-performance liquid chromatography, 3 enzyme-linked immunosorbent assay, 4 gas chromatography-mass spectrometry, 5 surface plasmon resonance, 6 fluorescence, 7 and terahertz spectrometry, 8 often involve time-consuming procedures, expensive equipment, and skilled personnel. These methods have limitations in terms of cost, portability, and on-site analysis. 9–21 In response to these challenges, electrochemical detection has emerged as a promising alternative for sensitive, selective, and rapid quantification of imidacloprid. Several materials have been used in the modification of macroelectrodes for the electrochemical detection of IMP such as metal nanoparticles, 22,23 carbon nanotubes, 11,24 metal oxides, 25,26 graphene oxides, 27 and polymeric materials. 28,29 These materials can enhance the electrocatalytic activities and facilitate electron transfer, improving the sensitivity and analytical performance of the IMP sensors.
However, electrochemical detection at macroelectrodes requires a large excess of supporting electrolytes to ensure a sufficiently high ionic strength of the solution and a homogeneous electric field. 30–32 In contrast, microelectrodes offer distinct benefits in electrochemical sensors, such as allowing measurements in low ionic strength samples, reducing Ohmic drop, increasing mass transfer flux, lowering background charging current, and achieving higher current density. 33,34 This work therefore employs microscopic electrodes to measure IMP directly in samples without electrolyte addition.
The microelectrodes are further decorated with silver nanoparticles for the electrocatalytic reduction of imidacloprid. Silver nanoparticles are distinguished for their promising catalytic, electronic, and electrochemical properties, 35–37 and can be controllably prepared in a simple one-step synthesis by electrochemical deposition without the need for a reducing agent. 38,39 The developed sensor demonstrates enhanced sensitivity and selectivity in the direct detection of trace levels of imidacloprid in water and soil samples. Furthermore, its rapid response makes it well-suited for studying the adsorption/desorption isotherm of imidacloprid.
Experimental
Chemical reagents
All chemical reagents were used as received without further purification: imidacloprid (C9H10ClN5O2, 98.0%, AK Scientific), potassium chloride (KCl, ≥99.0%, Sigma-Aldrich), potassium sulfate (K2SO4, 99.0%, QRëC), potassium nitrate (KNO3, 99.0%, QRëC), sodium citrate dihydrate (Na3C6H5O7·2H2O, ≥99.0%, Sigma-Aldrich), citric acid (C6H8O7, 99.5%, QRëC), sodium phosphate dibasic (Na2HPO4, ≥99.0%, Sigma-Aldrich), sodium phosphate monobasic (NaH2PO4, ≥99.0%, Sigma-Aldrich), sodium hydrogencarbonate (NaHCO3, 99.7%, QRëC), sodium carbonate (Na2CO3, 99.5%, Kemaus), sodium nitrite (NaNO2, ≥97.0%, Sigma-Aldrich), potassium iodide (KI, ≥99.0%, Sigma-Aldrich), potassium bromide (KBr, ≥99.0%, Sigma-Aldrich), dichlorvos (C4H7Cl2O4P, 50.0%, Extra Agrochemical), paraquat (C12H14C12N3, 98.0%, ACRŌS Organics), and carbaryl (C12H11NO2, 97.0%, Sigma-Aldrich).

Scheme 1. Chemical structure of imidacloprid (IMP).
Download figure:
Standard image High-resolution imageElectrochemical measurements were performed in the presence of phosphate buffer (pH 6.0, pH 7.0, and pH 8.0), carbonate buffer (pH 9.0), or carbonate buffer (pH 11.0). The pH of the electrolyte was determined using a digital pH meter (F20 Five Easy with LE409 pH glass electrode, Mettler Toledo, calibrated at pH 4.01, 7.00, and 10.01) at a temperature of 25.0 °C. The ionic strengths of all solutions were controlled by the addition of 0.10 M potassium chloride (KCl) or potassium sulfate (K2SO4).
Electrochemical studies
Electrochemical experiments were performed with an Autolab PGSTAT302N potentiostat (Metrohm, Netherlands) using a standard three-electrode setup thermostated at 25 °C in a Faraday cage. A bare glassy carbon macroelectrode (GC, 3.0 mm diameter, ItalSens, Netherlands), a silver macroelectrode (Ag, 2.0 mm diameter, CH Instruments, USA), a bare carbon fiber microelectrode (CF, 11 μm diameter, BASi, USA) or a silver nanoparticle-decorated carbon fiber microelectrode (AgNPs/CF) was employed as a working electrode. A silver wire or a Mercury-mercurous sulfate was used as a reference electrode. A platinum sheet was used as a counter electrode.
Fabrication of silver nanoparticle-decorated carbon fiber microelectrode
The silver nanoparticle-decorated carbon fiber microelectrode (AgNPs/CF) was prepared by electrodeposition of silver nanoparticles on carbon fiber microelectrode surface. The microelectrode (obtained from BASi, USA) consists of a carbon fiber wire with a diameter of 11 μm, enclosed within tempered glass housing. The electrode measures approximately 7 cm in length. The outer diameter of the glass housing is 4 mm. Prior to the electrodeposition process, the flattened end of the carbon fiber microelectrode underwent polishing using alumina slurry with three different particle sizes (1.0 μm, 0.3 μm and 0.05 μm, Buehler, USA) on soft lapping pads (Buehler, USA). Following this, the carbon fiber microelectrode was immersed in a solution containing 1.0 mM AgNO3 in 0.10 M KNO3. Subsequently, a constant potential of –0.20 V was applied for 100 s to allow electrodeposition of silver nanoparticles on the electrode surface.
Applications to water and soil samples
The validation and application of the developed IMP sensor were carried out in various water and soil samples. The water samples included tap water from the Suranaree University of Technology Tap Water System, Thailand, and reservoir water from two different sources: Sura reservoir (Suranari Subdistrict, Nakhon Ratchasima, Thailand) and Ang Huai Yang reservoir (Khok Kruat Subdistrict, Nakhon Ratchasima, Thailand). The water samples were tested as collected. Soil samples were collected from cornfields in Nakhon Ratchasima, Thailand. The soil samples were washed with water and dried overnight. Subsequently, 25.0 g of soil sample was sprayed with 10.0 ml of varying imidacloprid (IMP) concentrations ranging from 0.50 to 0.90 mM. After overnight drying, imidacloprid desorption from the soil sample was studied by adding 10.0 ml of deionized water. The soil suspension was then filtered through filter paper (16.0 μM pore size, Whatman, United Kingdom). The liquid portion was retained and subjected to cyclic voltammetry at the AgNPs/CF electrode at a scan rate of 10 mV s‒1 to analyze the amount of IMP released from the soil sample at different times.
Results and Discussion
First, the electrochemical behaviors of IMP were investigated at macroscale electrodes to evaluate the effects of silver's electrocatalytic activity towards IMP reduction. Subsequently, the enhanced electrocatalytic activity of nano-silver and the advantages of microscopic electrodes were demonstrated. This led to the development of silver nanoparticles modified carbon fiber (AgNPs/CF) microelectrodes through electrodeposition. Finally, the developed sensor was applied to analyze IMP in various water and soil samples, with further investigation into the desorption behavior of IMP from soil.
Voltammetry of IMP at GC vs Ag macroelectrodes
Figure 1 shows cyclic voltammograms of IMP in 0.10 M PBS buffer (pH 7.0) at a glassy carbon macroelectrode (GC, black line) and a silver macroelectrode (Ag, red line). At the GC macroelectrode, a single irreversible cathodic peak was observed at the potential of –1.10 V (vs Ag/AgCl). The reduction mechanism of IMP at carbon-based electrodes has been previously reported to be a four-electron four-proton process, converting the –NO2 group to the –NHOH group. 27,40,41

Figure 1. Cyclic voltammograms of 0.60 mM IMP in 0.10 M PBS buffer pH 7.0 at a glassy carbon macroelectrode (GC, black line) and a silver macroelectrode (Ag, red line) at a scan rate of 50 mV s–1.
Download figure:
Standard image High-resolution imageAt the Ag macroelectrode, two distinct cathodic peaks were observed at the potentials of –0.49 V (vs Ag/AgCl, designated as C1) and –0.73 V (vs Ag/AgCl, designated as C2). Similar to GC, no anodic peak was observed in the reverse scan, indicating that the IMP reduction was chemically irreversible. The occurrence of reduction peaks at lower overpotentials at the Ag electrode illustrates the electrocatalytic activity of Ag towards the reduction of IMP. 23 IMP contains NH groups which have been reported to interact with Ag, evidenced by vibrational spectroscopic studies and the evaluation of surface forces between AgNPs. 42,43 Both covalent and non-covalent interactions have been reported, 44,45 facilitated by the electron-donating nature of nitrogen atoms in IMP to the Ag surface. These interactions lower the activation energy required for the conversion of the –NO2 group to –NHOH in the reduction of IMP, therefore decreasing the overpotential required for the reaction.
Note that the reduction peak at –1.33 V (vs Ag/AgCl) at the Ag electrode was attributed to the hydrogen evolution reaction. This reaction was observed both in the absence and presence of IMP and is therefore not considered in the reduction of IMP.
Due to its catalytic activity, silver serves as a superior electrode for IMP analysis. In the subsequent sections, our focus will therefore be directed towards the reduction of IMP at the Ag macroelectrode.
Electroreduction of IMP at Ag macroelectrode
Tafel analysis
Tafel analysis (Eq. 1) was employed to investigate the electrochemical kinetics of the IMP reduction. The currents in the range of 15% to 50% of the C1 peak were considered to avoid the influence of diffusional mass transport (Fig. 2a). The value of  was determined to be 0.41 ± 0.01 at the Ag macroelectrode. The results thus indicated that the first electron transfer was the rate-determining step (
 = 0), in accordance with the previous literature report.
46
= 0), in accordance with the previous literature report.
46

where  is the electrical current,
  is the applied potential,
  is the number of electrons transferred before the rate determining electron transfer step,
  is the cathodic transfer coefficient of the rate determining electron transfer step,
  is the molar gas constant (8.314 J K−1 mol−1),
  is the absolute temperature (K), and
  is the Faraday's constant (96485 C mol−1).

Figure 2. (a) Cyclic voltammogram of 0.60 mM IMP in 0.10 M PBS pH 7.0 at a Ag macroelectrode at a scan rate of 10 mV s‒1 (Inlay: A Tafel analysis plot of ln  vs E). (b) Cyclic voltammograms of 0.60 mM IMP in 0.10 M PBS pH 7.0 at a Ag macroelectrode at various scan rates (Inlay: A plot of peak C1 currents vs square root of scan rates).
Download figure:
Standard image High-resolution imageEffect of scan rates
Figure 2b demonstrates the voltammograms of 0.60 mM IMP in 0.10 M PBS pH 7.0 at varied scan rates at a Ag macroelectrode. The C1 peak currents increase linearly with the square root of scan rates, indicating a diffusion-controlled process. The diffusion coefficient ( ) of IMP was determined by the Randles-Sevcik equation (Eq. 2) to be 3.97 × 10‒10 ± 0.01 × 10‒10 m2 s‒1.

where  represents the peak current, determined by subtracting the current at peak position from the capacitive background current, employing linear regression analysis of the front baseline.
  is the overall number of electrons transferred (n = 4),
47
is the overall number of electrons transferred (n = 4),
47
 is the Faraday's constant (96485 C mol−1),
  is the electrode surface area,
  is the diffusion coefficient,
  is the bulk concentration of IMP,
  is the potential scan rate,
  is the molar gas constant (8.314 J K−1 mol−1), and
  is the absolute temperature (K).
Effect of pH
The effect of electrolyte's pH on the voltammetric response to IMP reduction at the Ag macroelectrode was investigated in the pH range of 6 to 11 (Fig. 3). The C1 peaks exhibited a shift towards more negative potentials as the pH increased, with a slope of 55.5 ± 4.5 mV pH‒1. These findings suggest that the IMP reduction process involves an equal number of electron(s) and proton(s) transfer. 41 The C1 peak currents increase when increasing the pH from 6.0 to 7.0 and reach a maximum at pH 7.0. However, the C1 peak current decreases when the pH exceeds 7.0. Therefore, pH 7.0 was chosen for the electrochemical detection of IMP.

Figure 3. Cyclic voltammograms of 0.60 mM IMP under various pH conditions at a Ag macroelectrode using a scan rate of 50 mV s‒1 (Inlay: A plot of C1 peak potentials (Ep) against pH).
Download figure:
Standard image High-resolution imageIMP reduction mechanism
Overall, the voltammetry of IMP at the Ag macroelectrode exhibit two distinct cathodic peaks (C1 and C2, as denoted in Fig. 1). Tafel analysis reveals the first electron transfer to be the rate-determining step, while studies of scan rates show that the process is diffusion-controlled, i.e., the relevant chemical species remain in the solution phase. Studies of pH effects indicate that the IMP reduction process involves an equal number of electron(s) and proton(s) transfer. These results suggest that the electroreduction of IMP converts its nitro group (R ̶ NO2) to hydroxylamine (R ̶ NHOH) in two steps (Scheme

Scheme 2. The mechanism of electrochemical reduction of imidacloprid (IMP).
Download figure:
Standard image High-resolution imageVoltammetry of IMP at AgNPs/CF microelectrode
The previous sections demonstrated the electrocatalytic activity of silver towards the reduction of IMP at the macroscale electrode. However, the introduction of excess supporting electrolyte is necessary for measurements at macroelectrodes. 31,32,50 To overcome this limitation, microscale electrodes decorated with silver nanoparticles will be employed in the following sections to further enhance the electrocatalytic activity, increase current density, minimize Ohmic drop, lower capacitive current, and alter the mass transport regime to radial diffusion, which facilitates IMP analysis in samples with low ionic strength.
Figure 4a compares the voltammetric responses of IMP at bare carbon macro- vs micro-electrodes. At the carbon fiber microelectrode (CF), a steady-state response was observed due to the characteristics of radial diffusion. 51 The current density at the microelectrode was significantly higher than at a macroelectrode, and solvent breakdown was observed at more negative potentials, making it favorable for sensing applications.

Figure 4. Cyclic voltammograms of 0.50 mM IMP in 0.10 M PBS pH 7.0 at a scan rate of 10 mV s‒1 at (a) GC macroelectrode vs CF microelectrode and (b) bare CF microelectrode vs AgNPs/CF microelectrode.
Download figure:
Standard image High-resolution imageFor the analysis of IMP, the CF microelectrode was next modified with silver nanoparticles (AgNPs). Figure 4b shows the voltammogram of IMP reduction at the AgNPs-modified CF microelectrode (AgNPs/CF), compared with that of a bare CF microelectrode. In the presence of AgNPs, IMP reduction occurred at significantly lower overpotentials and showed steady-state responses in two steps, similar to the two-step responses reported for the Ag macroelectrode in the previous section. While voltammetric responses at nanoparticle-modified electrodes are highly complex and subject to diffusion regimes influenced by nanoparticle size and separation distances, the two-step responses likely suggest that the reduction of IMP at AgNPs/CF follows the same mechanism as that at the Ag macroelectrode, as depicted in Scheme
The steady-state current at the AgNPs-modified electrodes was enhanced by >300% compared with bare CF, demonstrating the advantages of both the electrocatalytic activity and the large electroactive surface area of AgNPs.
Subsequently, optimization of AgNP deposition parameters, including deposition potentials and times, was conducted for the fabrication of AgNPs/CF electrode aimed at IMP analysis. Following this, the AgNPs/CF electrode underwent characterization, which involves examining its morphology, size distribution, and electroactive surface area.
First, the effect of deposition potential was investigated. The electrodeposition of AgNPs on CF was carried out at various constant potentials in 1.00 mM AgNO3 in the presence of 0.10 M KNO3 for 30 s. The formation of AgNPs was then analyzed by anodic striping voltammetry in 0.10 M KNO3. Figure 5 demonstrates that the deposition of silver occurs at E < 0 V with the optimized potential at for AgNPs deposition at E = −0.20 V.

Figure 5. Anodic stripping voltammograms of the AgNPs/CF prepared using different deposition potentials in 0.10 M KNO3 at a scan rate of 10 mV s−1 (Inlay: A plot of stripping charges vs the deposition potentials).
Download figure:
Standard image High-resolution imageThe amount of AgNPs deposited at the potential of −0.20 V under the employed condition was determined using the Faraday's law (Eq. 3) to be 0.60 ± 0.02 pmol of Ag.

where  is the amount of deposited silver (mol),
  is the number of electron transferred per atom of silver (
 = 1), F is the Faraday's constant (96485 C mol‒1), and
  is the total charge transferred during the anodic stripping, which in turn can be determined using Eq. 4.

where  is the measured current (A), E is the applied potential (V), and
  is the potential scan rate (V s−1).
Subsequently, the fabricated AgNPs/CF microelectrodes were utilized in the voltammetric analysis of IMP. Figure 6a showed that the highest steady-state current for IMP reduction was achieved at the AgNPs/CF electrode prepared with E = −0.20 V, consistent with the largest amount of AgNPs deposited.
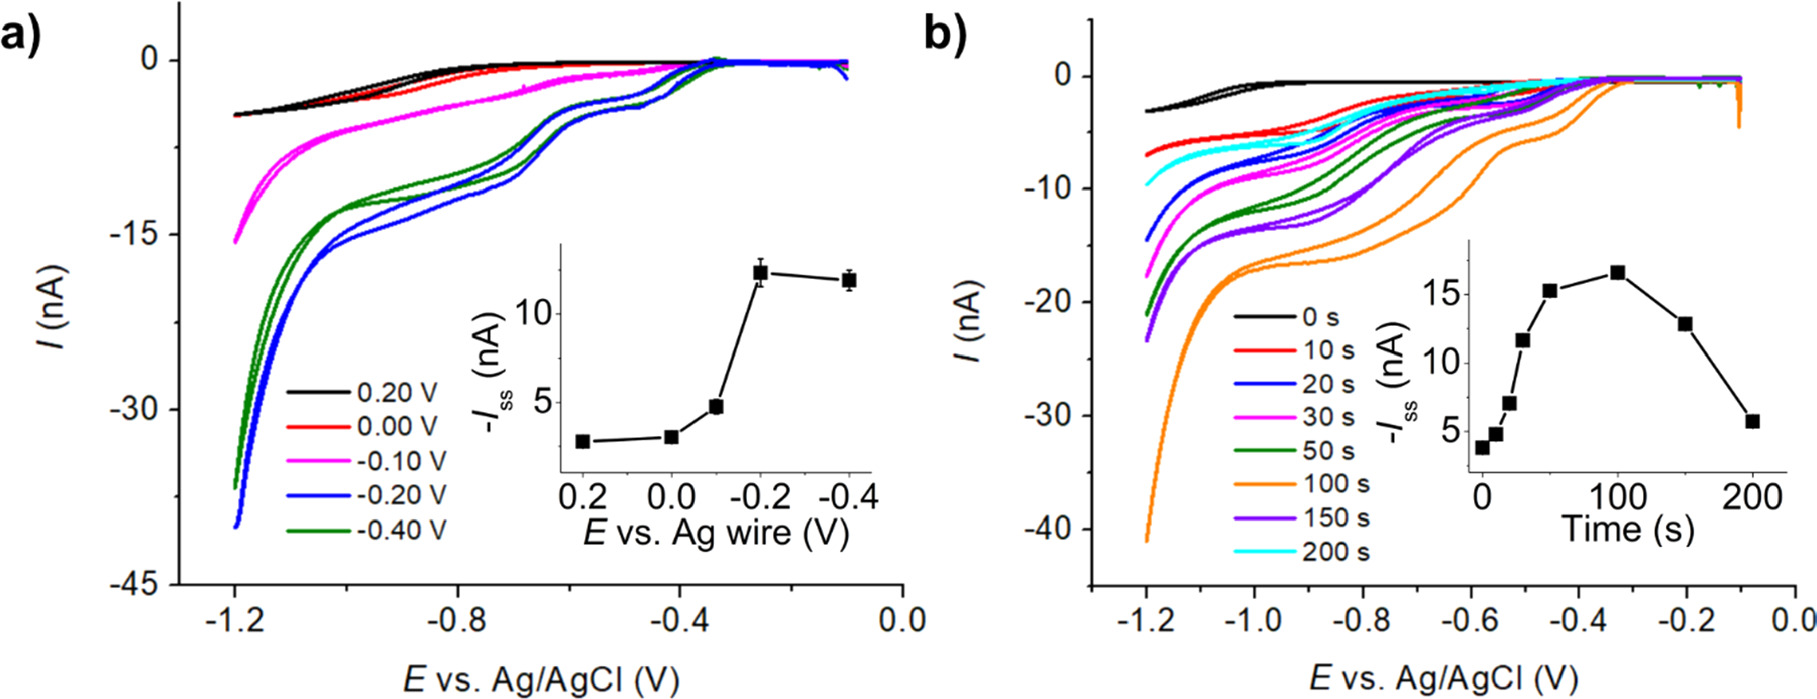
Figure 6. Cyclic voltammograms of 0.50 mM IMP in 0.10 M PBS pH 7.0 at the AgNPs/CF using (a) varied deposition potentials (Inlay: A plot of steady-state currents vs the deposition potentials) and (b) varied deposition times (Inlay: A plot of steady-state currents vs the deposition times).
Download figure:
Standard image High-resolution imageThe investigation then focused on studying the effect of AgNPs deposition time. In this experiment, electrodeposition involved depositing AgNPs onto CF at E = −0.20 V in a solution containing 1.00 mM AgNO3 and 0.10 M KNO3 for varying time intervals. Figure 6b illustrates that the steady-state current of IMP reduction increased with deposition time, and reached a maximum at t = 100 s. At t > 100 s, the steady-state currents of IMP reduction gradually declined. This decrease may be attributed to the high density of AgNPs on the surface and the diminishing separation distances between AgNPs, which are no longer large enough to prevent the overlap of adjacent diffusion zones, leading to a loss of nanoparticle characteristics and resembling bulk silver. 52
The deposition potential of −0.20 V and the deposition time of 100 s were therefore selected for fabricating AgNPs/CF microelectrodes for IMP analysis.
Figure 7a presents the size distribution of the deposited AgNPs (E = –0.20 V, t = 100 s), as determined through SEM imaging analysis, revealing an average diameter of 11.7 ± 1.9 nm. The electroactive surface area of the CF and AgNPs/CF electrodes were then determined by cyclic voltammetry in the solution of 1.0 mM hexaammineruthenium(III) ([Ru(NH3)6]3+), which is a standard outer-sphere redox probe, in the presence of 0.10 M K2SO4 supporting electrolyte at a scan rate of 10 mV s–1 (Fig. 7b). The electroactive surface areas were then analyzed according to the steady-state equation (Eq. 5) to be 3.66 × 10‒11 ± 0.15 × 10‒11 m2 and 9.10 × 10‒9 ± 0.31 × 10‒9 m2 for the bare CF and AgNPs/CF (deposition p otential: −0.20 V, deposition time: 100 s), respectively.

where  is the steady-state current,
  is the number of electrons transfer,
  is the Faraday's constant (96485 C mol−1),
  is the bulk concentration of [Ru(NH3)6]3+,
  is the diffusion coefficient of [Ru(NH3)6]3+ (D = 8.61 × 10‒10 ± 0.06 × 10‒10 m2 s‒1),
53
and
is the diffusion coefficient of [Ru(NH3)6]3+ (D = 8.61 × 10‒10 ± 0.06 × 10‒10 m2 s‒1),
53
and  is the radius of the electrode.

Figure 7. (a) Electrodeposited AgNPs size distribution. The inlay shows the SEM image of the deposited AgNPs. (b) Cyclic voltammograms of 1.0 mM [Ru(NH3)6]3+ in 0.10 M K2SO4 at bare CF (red) and AgNPs/CF (blue) at a scan rate of 10 mV s–1.
Download figure:
Standard image High-resolution imageCalibration curve of IMP at AgNPs/CF microelectrode
Figure 8a demonstrates the voltammetric responses of different concentrations of IMP at the AgNPs/CF electrode, employing a scan rate of 10 mV s−1. The steady-state currents exhibited a linear relationship with IMP concentrations within the range of 0.0–0.40 mM. The sensitivity and limit of detection (3SB/m) were determined to be 2.98 × 10⁻⁸ ± 0.10 × 10⁻⁸ A mM−1 and 60.4 nM, respectively.

Figure 8. Cyclic voltammograms of various concentrations of IMP at AgNPs/CF in (a) the presence and (b) the absence of 0.10 M PBS pH 7.0 and 0.10 M K2SO4 supporting electrolytes at a scan rate of 10 mV s‒1 (Inlay: Calibration plots of steady-state currents vs IMP concentrations).
Download figure:
Standard image High-resolution imageIn Fig. 8b, it is further illustrated that the utilization of the AgNPs/CF electrode enables IMP detection without the need for supporting electrolytes. The linear range, sensitivity, and limit of detection of IMP detection in the absence of supporting electrolytes were determined to be 0.0–0.50 mM, 2.88 × 10⁻⁸ ± 9.39 × 10⁻¹⁰ A mM−1, and 68.3 nM (3Sb/m), respectively.
Interference and reproducibility studies
The selectivity of the developed sensor against potential interfering species was next evaluated. The assessed potential interfering insecticides and ions included dichlorvos, paraquat, carbaryl, as well as Na+, K+, Mg2+, Br−, I−, and SO4 2−. 11,23,41 The sensor was applied to measure 0.20 mM IMP in the absence and presence of ≥5-fold concentrations of dichlorvos, paraquat, carbaryl, Na+, K+, Mg2+, Br−, I−, and SO4 2− interferences. Less than 8% changes in the peak currents were observed upon the addition of all the tested interferences, indicating the adequate selectivity of the developed sensor for IMP detection.
The reproducibility of the developed sensor was subsequently examined. Three replicate measurements of IMP within the range of 0.0–0.40 mM resulted in relative standard deviations (RSD) of the steady-state currents <5% (n = 3), indicating a high level of reproducibility for IMP detection.
The analytical performance of the developed sensor compared to other existing electrochemical methods for determining IMP is summarized in Table I.
Table I. Comparison of electrochemical sensors for imidacloprid detection.
| Electrode | Method | Linear range (μM) | LOD (μM) | References |
|---|---|---|---|---|
| Cu/rGO/GC | AMP | 0–0.5 | 0.003 | 22 |
| MnPc/rGO/GC | CV | 25−250 | 6.5 | 47 |
| AgNDs/GNs/GC | DPV | 1−100 | 0.814 | 9 |
| Ag-Nafion/TiO2-nafion/GC | DPV | 0.5–3.5 | 0.25 | 23 |
| β-CD/MWCNTs/MEA | DPV | 5.0–100 | 0.629 | 28 |
| GQDs/IL/MWCNTs/PANI/GC | DPV | 0.030–12 | 0.009 | 54 |
| MC/SPE | DPV | 0.00–1000 | 2.54 | 41 |
| FTO/WO3/MoS2/MIP | EIS | 0.50–70 | 0.10 | 55 |
| MWCNTs/GC | SWV | 0.24–3.50 | 0.415 | 24 |
| Ag | SWV | 50–1000 | 6.90 | 46 |
| BDD | SWV | 30–200 | 8.60 | 56 |
| AgNPs/CF | CV | 0–400 | 0.0604 | This work |
AgNDs: Ag nanodendrimers, AMP: amperometry, BDD: boron doped diamond, β-CD: β-cyclodextrin, CV: cyclic voltammetry, DPV: differential pulse voltammetry, EIS: electrochemical impedance spectroscopy, FTO: fluorine-doped tin oxide, GNs: graphene nanosheets, GQDs: graphene quantum dots, IL: ionic liquid, MEA: microelectrode array, MnPc: manganese(II) phthalocyanine, MC: microporous carbon, MoS2: molybdenum disulfide, MIP: molecular imprinted polymer, MWCNTs: multiwalled carbon nanotubes, PANI: polyaniline, rGO: reduce graphene oxide, SPE: screen printed electrode, SWV: square wave voltammetry, and WO3: tungsten trioxide.
Application to water samples
The AgNPs/CF sensor was employed to directly detect IMP in tap water and reservoir water samples from Sura reservoir and Ang Huai Yang reservoir, without requiring dilution or the addition of supporting electrolyte. The samples were spiked with 50.0 μM IMP and subjected to cyclic voltammetry at the AgNPs/CF electrode with a scan rate of 10 mV s‒1. The concentration of the spiked IMP was then determined using a standard addition method. The percentage recoveries of 95.9%, 101.6%, and 99.0% were obtained for tap water, Sura reservoir water, and Ang Huai Yang reservoir water, respectively. These achieved recoveries indicate the sensor's high accuracy, precision, and selectivity in IMP detection.
Application to soil samples: IMP desorption isotherm
The AgNPs/CF sensor was further applied to analyze the amounts of IMP released from soil samples. Initially, the soil samples were treated with varying concentrations of IMP. After overnight drying, the soil samples were exposed to deionized water for different time periods. Subsequently, the amounts of IMP desorbed from the soil were analyzed using the developed sensor.
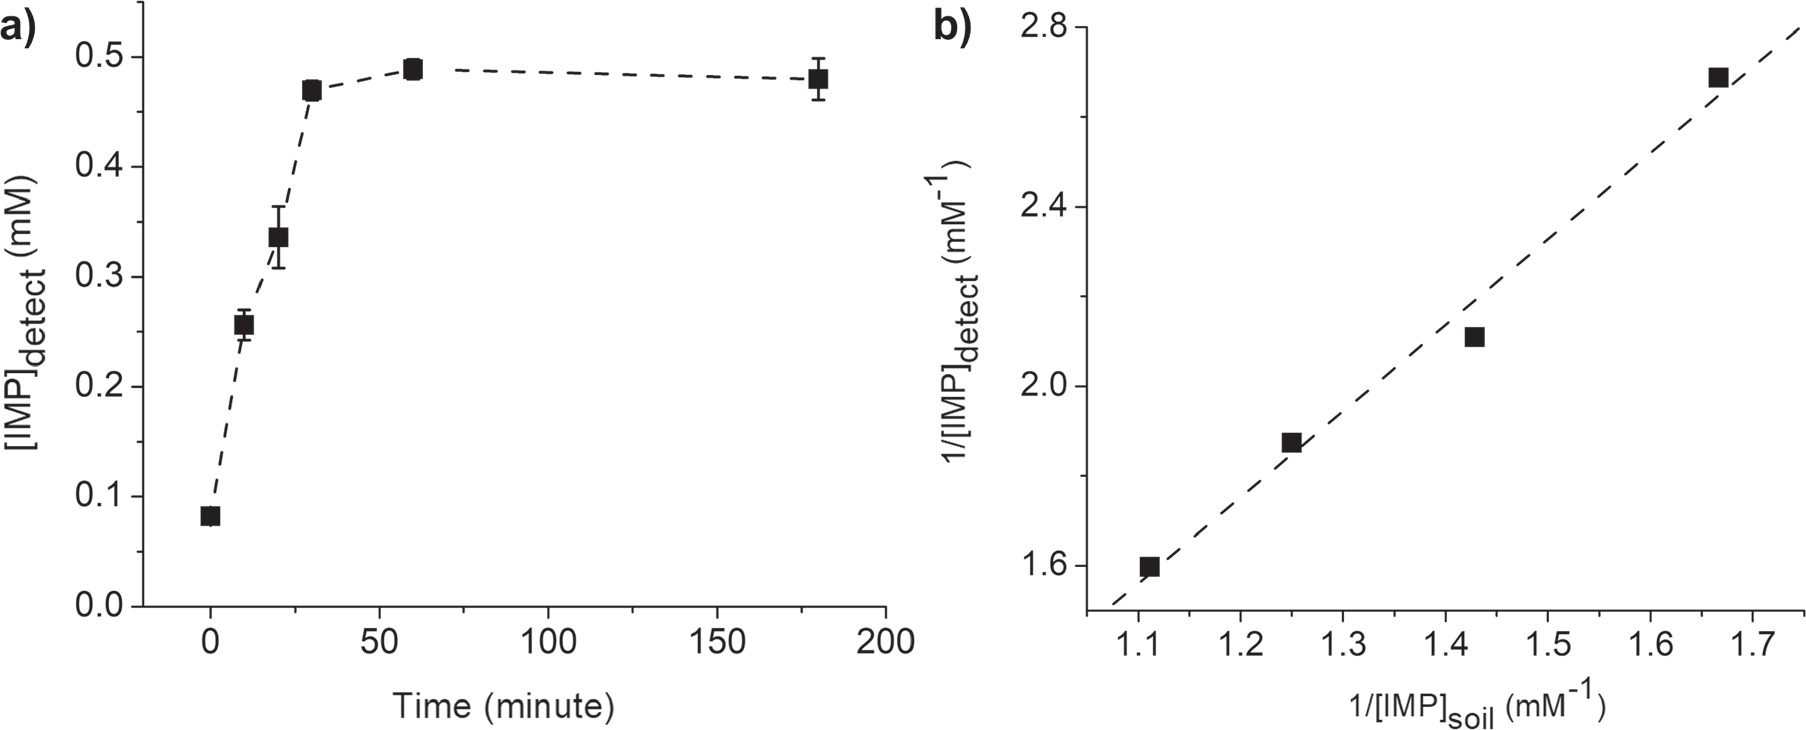
Figure 9a illustrates an increase in the amount of IMP desorbed from soil over time. Desorption equilibrium was reached approximately 30 min after the soil was exposed to water (for the soil sample treated with 0.50 mM IMP in Fig. 9a). To evaluate the desorption isotherm, the equilibrium concentrations of IMP were measured for soil samples treated with various concentrations of IMP. These measurements were taken 60 min after the soil was exposed to water to ensure equilibrium conditions.
Figure 9. (a) A plot of ![${[\text{IMP}]}_{\text{detect}}$](https://content.cld.iop.org/journals/1945-7111/171/4/047506/revision2/jesad3a23ieqn33.gif) at different times after the IMP-contaminated soil is exposed to water. (b) A plot of 1/
at different times after the IMP-contaminated soil is exposed to water. (b) A plot of 1/![${[\text{IMP}]}_{\text{detect}}$](https://content.cld.iop.org/journals/1945-7111/171/4/047506/revision2/jesad3a23ieqn34.gif) at equilibrium (t = 60 min) against 1/
at equilibrium (t = 60 min) against 1/![${[\text{IMP}]}_{\text{soil}}.$](https://content.cld.iop.org/journals/1945-7111/171/4/047506/revision2/jesad3a23ieqn35.gif) .
.
Download figure:
Standard image High-resolution image
Figure 9b demonstrates a linear relationship between 1/![${[\text{IMP}]}_{\text{detect}}$](https://content.cld.iop.org/journals/1945-7111/171/4/047506/revision2/jesad3a23ieqn36.gif) and 1/
and 1/![${[\text{IMP}]}_{\text{soil}},$](https://content.cld.iop.org/journals/1945-7111/171/4/047506/revision2/jesad3a23ieqn37.gif) where
where ![${[\text{IMP}]}_{\text{detect}}$](https://content.cld.iop.org/journals/1945-7111/171/4/047506/revision2/jesad3a23ieqn38.gif) represents the equilibrium aqueous-phase concentration of IMP desorbed from soil into water, and
represents the equilibrium aqueous-phase concentration of IMP desorbed from soil into water, and ![${[\text{IMP}]}_{\text{soil}}$](https://content.cld.iop.org/journals/1945-7111/171/4/047506/revision2/jesad3a23ieqn39.gif) represents the initial concentration of IMP adsorbed on soil. This linear relationship suggests that the desorption of IMP on the soil surface follows the Langmuir isotherm model (Eq. 6), where the rate of desorption is proportional to the amount of IMP adsorbed as a monolayer.
57,58
represents the initial concentration of IMP adsorbed on soil. This linear relationship suggests that the desorption of IMP on the soil surface follows the Langmuir isotherm model (Eq. 6), where the rate of desorption is proportional to the amount of IMP adsorbed as a monolayer.
57,58
where B is the equilibrium constant and ![${[\text{IMP}]}_{\max }$](https://content.cld.iop.org/journals/1945-7111/171/4/047506/revision2/jesad3a23ieqn40.gif) is the maximum concentration when the soil surface is saturated with IMP.
is the maximum concentration when the soil surface is saturated with IMP.
Conclusions
In conclusion, the development of silver nanoparticle-decorated carbon fiber microelectrodes (AgNPs/CF) for the electrochemical detection of imidacloprid insecticide has yielded a highly sensitive, selective, and reproducible sensing platform. Exploiting the electrocatalytic activity of nano-silver, coupled with the advantages of microscopic electrodes, we have successfully demonstrated the effectiveness of this method for accurate imidacloprid determination across a wide linear range, with a low limit of detection. The sensor's applicability extends to direct detection in various water samples without the need for additional electrolytes or sample preparation, demonstrating its practical use. Additionally, its capability to analyze imidacloprid release from contaminated soil samples highlights its potential for environmental monitoring and agricultural applications.
Acknowledgments
This work is financially supported by Suranaree University of Technology Research and Development Fund [Grant number: IRD1–102–67–12–14].