
Abstract
Anion exchange membrane water electrolysis (AEMWE) provides the advantages of conventional alkaline water electrolysis and proton exchange membrane water electrolysis for low-temperature hydrogen production. This study investigates the effect of ionic strength in low hydroxide concentration anolyte on AEMWE performance. The anolyte was recirculated at the anode, and the cathode was operated dry. Different alkali cations in the high ionic strength anolyte improved the cathode overpotential by increasing the water transport from the anode to the cathode. Li+, Na+, K+, and Cs+ cations were tested with K+ providing the lowest electrolysis overpotential among the cations tested. The transference number of the alkali cations was measured by a modified Bruce-Vincent method using a membrane electrode assembly, composed of a hydrogen-evolving cathode and oxygen-evolving anode and anion exchange polymer membrane. The result shows that the cathode overpotential is influenced by the cation mobility, which is related to the hydration shell width. The electrolysis overpotential trend with different alkali cations in the anolyte scaled with the alkali dynamic ionic radius. Durable electrolysis was performed in 1,000 h test at 60 °C and 1 A cm−2.

This is an open access article distributed under the terms of the Creative Commons Attribution 4.0 License (CC BY, http://creativecommons.org/licenses/by/4.0/), which permits unrestricted reuse of the work in any medium, provided the original work is properly cited.
Renewable hydrogen can contribute to lowering global climate change by lowering the use of hydrocarbon-based energy sources. Green hydrogen is of particular interest for storing energy for use in chemical synthesis and transportation without carbon byproducts. 1,2 Water electrolysis has been suggested as an economical route to produce green hydrogen, especially when coupled with renewable energy sources. 3
Anion exchange membrane water electrolysis (AEMWE) is an evolving technology, combining the advantages of alkaline water electrolysis and proton exchange membrane water electrolysis (PEMWE). 4 The high pH enables the use of non-platinum group metal (PGM) catalysts for the oxygen evolution reaction (OER). 5 A thin hydroxide conducting solid polymer membrane provides the electrolyte for high current density electrolysis (i.e., >1 A cm−2). 6 Commercial PEMWEs rely on the use of perfluorinated polymer membranes which have environmental and economic issues. Hydrocarbon-based anion exchange membranes (AEM) are more cost-effective and have been shown to be stable at high pH. 7–10
In AEMWE, the anode (i.e., positive electrode) oxidizes hydroxyl ions which are produced at the cathode (i.e., negative electrode) during the reduction of water to produce hydrogen. In one configuration, a liquid electrolyte is supplied only to the anode (i.e., anolyte) so that the system does not need an additional separation method to produce hydrogen gas. 10,11 In this dry-cathode configuration, water is supplied to the cathode by a transport across the AEM from the water-fed anode. It is important to control the water uptake and ion exchange capacity (IEC) of AEM and electrode ionomer at both electrodes so that neither water flooding nor dry-out occur. 12,13 It was found that AEMWE performance improved with an adhesive hydrophobic ionomer in the anode and an adhesive hydrophilic ionomer in the cathode. 13,14 Although there are multiple reports about the improvement in transient electrolysis performance (i.e. polarization curves) or at low current density (e.g., <0.5 A cm−2) for short times (e.g., 100 h), there is a relatively low number of reports concerning long-term, low-voltage electrolysis durability at high current density. 15–17
High hydroxide concentration in the anolyte is a corrosion and hydrolysis concern, especially at elevated temperature. Minimizing the hydroxide concentration is desirable for long-term durability, however the OER performance and anolyte conductivity depend on local hydroxide concentration. 18 In addition, issues of water delivery to the dry cathode cell have been posed in recent reports. 19,20 Logan et al. found that increasing the salinity of the neutral pH anolyte is a cost-effective approach to improving the performance of dry-cathode AEMWE. They obtained improved water electrolysis voltage from 2.77 V to 2.58 V at 0.5 A cm−2. However, they only investigated the overall cell overpotential. The neutral salt concentration effect on the separate overpotential of the anode and cathode was not explored. 21
It was recently demonstrated that a lower hydroxide concentration in the anolyte with added neutral salt can significantly lower the electrolysis overpotential, especially of the cathode. 20 This was due to improved water transport from the anode to the cathode by cation migration in the AEM. Non-electroactive sodium nitrate formed a high ionic strength electrolyte. The optimal concentration of the neutral salt did not increase the anode overpotential significantly. Surprisingly, the cell voltage with a pH 12 anolyte with 0.15 M NaNO3 was lower than the cell voltage with a pH 13 anolyte at 1 A cm−2. The short-term steady-state voltage profile at 1 A cm−2 was stable. 22 Thus, the effect of alkali cation mobility on the cathode electrolysis performance is of importance in understanding and optimizing the cathode water delivery mechanism and cell performance.
This work investigates the effect of different alkali metal cations (i.e., Li+, Na+, K+, and Cs+) in a low hydroxide concentration anolyte by use of a pseudo-reference electrode (pRE). As the size of cation changed, the cathode overpotential changed, while the anode overpotential remained essentially constant because the hydroxide concentration was constant. K+ was shown to be the optimal alkali cation, showing the lowest cell voltage. This work also presents a measurement of the mobile cation transference number within the solid polymer electrolyte by modifying the Bruce-Vincent method. 23 The alkali cation transference number was correlated to the ion mobility. The dynamic ionic radius of the cation determined the optimal alkali cation for the highest water transport leading to improved cathode electrolysis performance.
Experimental
Self-adhesive anion-conducting ionomer preparation
Poly(norbornene) terpolymer anion-conducting ionomers and membranes were synthesized as previously described by Mandal et al. 8 The ionomer was named with the ratio of the three monomers (i.e., X:Y:Z being butyl norbornene (BuNB):bromobutyl norbornene (BrBuNB):norbornene propionic acid ethyl ester(NBPAEE)) in the ionomer. The ester was converted to a pendant carboxylic acid by a reaction with the concentrated HCl to form a covalent bond between bis-phenyl-A-diglycidyl ether (BPADGE) adhesive via an esterification reaction. 50:30:20 and 4:90:6 ionomers were used in the oxygen evolution reaction (OER) anode and hydrogen evolution reaction (HER) cathode, respectively. The ion exchange capacity (IEC), average molecular weight (Mn), and polydispersity (Ð) of both ionomers were found by NMR. 14 The 50:30:20 OER ionomer was 1.64 meq g−1, and 4:90:6 HER ionomer was 4.0 meq g−1.
OER and HER electrodes preparation
The OER anode and HER cathode electrodes were prepared by the solvent-cast method using a spray coater (Eclipse HP-CS, Iwata) according to a previous report. 13 The anode contained 0.5 mg cm−2, 0.12 mg cm−2, and 0.6 mg cm−2 of NiFe2O4 catalyst (Pajarito Powder), 50:30:20 OER ionomer, and BPADGE adhesive. The cathode contained 1.2 mg cm−2, 0.6 mg cm−2, and 0.25 mg cm−2 of Pt3Ni catalyst (ECS-3701, Pajarito Powder), 4:90:6 HER ionomer, and BPADGE adhesive. The anode slurry was coated on Ni felt porous transport layer (PTL) (Technetics group). The cathode slurry was coated on non-wet proofed carbon paper PTL. Both electrodes were cured at 160 °C under vacuum for 1 h to complete the esterification reaction between BPADGE and the ionomeric carboxylic acid pendent group. The electrodes were aminated in aqueous TMA solution for 24 h at room temperature before use.
Membrane electrode assembly (MEA) preparation
The electrode area in the MEA was 4 cm2. The poly(norbornene) membrane was 40 m thick with 75 mol% BrBuNB and 25 mol% BuNB (Promerus, LLC). The ion exchange capacity (IEC) of the membrane was 3.5 meq/g. The anodes, cathodes, and AEMs were ion-exchanged in 0.1 M NaOH for 1 h before use. A 0.5 mm diameter platinum wire (Alfa Aesar) was integrated into the MEA with Tefzel gaskets for use as a pseudo-reference electrode (pRE). The wire was placed in direct contact with the membrane near the cathode but displaced 2 mm from the cathode PTL. The RE was exposed to hydrogen gas but is considered a pseudo-reference because the exact partial pressure of hydrogen in the humid cathode gas and pH of the AEM could vary slightly during the electrolysis. The MEA was sandwiched between a pair of 316 L stainless-steel serpentine flow-pattern plates with 25 in-lb of torque in the cell hardware.

Electrolysis testing
The cell configuration and electrolysis testing protocol followed a previous report. 20 The current-voltage curves in this study are not iR corrected. Testing of the same cells was conducted several times and the reproducibility was less than 10 mV difference between cell repetitions, < 1%. The electrochemical impedance spectrum (EIS) of the cell was obtained galvanostatically at 1 A/cm2 using SP-300 (BioLogic) after stabilizing the cells at 1 A cm−2 for 5 min. The interfacial capacitance (Cint) was calculated with Eq. 1.


In Eq. 1, Cint is the interfacial capacitance (F/cm2), f is frequency (Hz), Rint is the interfacial resistance (Ω cm2).
The polarization curves were recorded with a DC power supply (N5742A, Keysight) and a voltmeter. Each data point in the polarization curves was recorded by holding at a specific current density for 3 min to achieve steady-state mass transport of reactants and products.
The total cell potential () was obtained from the polarization curve and was analyzed based on reversible cell potential (), activation overpotential (), ohmic overpotential (), and mass transport overpotential (), according to Eq. 2.


was calculated using the empirical temperature dependent expression, Eq. 3. 24


In Eq. 3, T is the absolute temperature (K). was calculated using an extrapolated Tafel plot fitted in low current density region (5 to 50 mA cm−2) where there were no significant ohmic and mass transport losses using the Tafel relationship Eq. 4.


In Eq. 4, b is the Tafel slope (mV/dec), is the current density (A/cm2), and is the exchange current density (A/cm2). was calculated from the high frequency resistance (HFR) in the EIS spectrum using Ohm's law, Eq. 5.


was calculated by subtracting from


Cation transference number measurement
The cation transference number in the solid polymer electrolyte was evaluated by a modified Bruce-Vincent method. 23 The drop in current from its initial value to a steady-state value was recorded. Hydroxide ions are formed at the cathode by water reduction and oxidized at the anode by the oxidation of hydroxide to oxygen. Thus, a steady state gradient in hydroxide ions was formed where all other ions are electro-inactive. The anion conductive membranes contained mainly immobilized quaternary ammonium cations tethered to the solid polymer electrolyte, however, there are mobile cations due to salt permeation from the electrolyte. A perturbation in the cell voltage causes gaseous products produced at the electrodes by electrolysis. The cation transference number, can be calculated by Eq. 6.


In Eq. 6, is the anion transference number, is the initial current (A), is the steady-state current (A), is the initial interfacial resistance (), is the steady-state interfacial resistance (), and is the modified perturbation voltage, which is equal to the applied voltage subtracted by (V).


Results and Discussion
It has been previously shown that an alkaline electrolysis using a low hydroxide concentration anolyte (pH ∼ 12) suffers significant ohmic and mass transport losses at the cathode. 20 Increasing the anolyte cation concentration (independent of the hydroxide concentration) assisted in water delivery to the cathode through an AEM. The cathode overpotential was lowered when the anolyte ionic strength increased, at constant anolyte pH. The improvement in performance was likely due to the improvement in water transport from the anode to the cathode. It was also shown that the salt rejection of the AEM is not perfect and a measurable amount of NaNO3 from the anolyte was found in the AEM. Only sodium cations were used (0.05 M to 1.0 M) in the previous study. The present study investigates the effect of different anolyte cations and transport through the AEM on cathodic electrolysis performance.
AEM electrolysis with different anolyte cations was investigated. Figure 1 shows the effect of Li+, Na+, K+, and Cs+ in the anolyte on the electrolysis overpotential. It was previously found that 0.15 M Na+ provided a near optimum electrolysis performance when 0.01 M NaOH was also contained in the anolyte. The cathode overpotential decreased with the addition of any alkali cation, compared to only 0.01 M NaOH, as shown in Fig. 1a. At high current density, K+ was the highest performing alkali cation and Li+ was the lowest with the order of performance: K+ > Na+ > Cs+ > Li+. In Fig. 1a, there is a small change in the activation overpotential at low current density (i.e., < 0.1 A cm−2). This shows that the overpotential with K+ was also the lowest at low current density (<0.1 A cm−2). Huang et al. analyzed the effect of different alkali cations on the HER exchange current density for the hydrogen oxidation reaction (HOR) through rotating disk electrode (RDE) experiments. 25 It was found that the HER/HOR exchange current density was cation-dependent, showing that Li+ had the highest exchange current density, followed by Na+, K+, and Cs+. When the interfacial water molecules were replaced by a bulkier cation, the reorganization energy and entropy of the hydrogen-bonded water structure increased resulting in a change of the solvation configuration at the interface. However, in this study, K+ had the smallest activation overpotential, indicating that in the dry HER cathode water content is also involved but may be a limiting reagent. It is also noted that the 0.01 NaOH anolyte has the lowest (most favorable) anode overpotential and the overpotential became worse as a nitrate salt was added to the anolyte. This is reasonable because at least some of the anode catalyst is covered with ionomer. A majority of the anions in that ionomer would be nitrate which lowers the hydroxide concentration in the ionomer and shifts the equilibrium anode potential to more positive (less favorable) values.

Figure 1. Electrolysis performance of 0.01 M NaOH with 0.15 M LiNO3, NaNO3, KNO3, and CsNO3. (a) 2-electrode cell polarization curves. (b) 3-electrode polarization curves using pRE. (c) Nyquist plot measured at 1 A cm−2.
Download figure:
Standard image High-resolution imageThe overpotential with K+ was also the lowest at high current density (1 A cm−2), compared to other cations tested (Fig. 1a). The overpotential at high current density includes the effect of ohmic and mass transport resistances. In this study, the anode and cathode overpotentials were investigated separately because the anolyte affects both electrolysis performance. 20 Figure 1b shows the anode potential (top four curves) and cathode potential (bottom four curves) vs pRE as a function of current density. The potential difference between the anode and cathode in Fig. 1b corresponds to the full cell potential in Fig. 1a. The anode potential remained nearly constant vs current density for each anolyte because the pH in each electrolyte was the same. An expanded scale graph of Fig. 1b is shown in Fig. s2. The largest single change in the half-cell potentials occurs at the cathode where there was a decrease in cathode overpotential with the addition of anolyte salt, even though the anolyte is in contact with the anode only. Further, there is a significant improvement in cathode overpotential (i.e., lower overpotential) when the ionic strength of the anolyte was increased. This is likely due to improved water transport to the cathode with high cation concentration in the anolyte. 20 Water diffuses to the cathode catalyst, and ions migrate away from the cathode. Unlike the anode ionomer, the cathode ionomer plays a critical role in ion and water transport because the electrode is operated dry (i.e., the ionomer is the only pathway for water and ions between the membrane and catalyst surface). Of the four alkali cations tested, K+ shows the lowest cathode overpotential at high current density (i.e., 1 A cm−2). It is noted that the alkali ion trend correlates with the mobility of the ions.
Figure 1c shows the Nyquist plots for the different anolytes. The extracted impedance values are summarized in Table I. A single out-of-phase component (near semi-circle interfacial impedance) was observed for the 0.01 M NaOH anolyte. The difference between the low frequency x-intercept and high-frequency x-intercept is called the interfacial impedance here. When the salt was added to the 0.01 NaOH electrolyte, the out-of-phase component is broken into two contributions composed of a cathode (higher frequency loop) and an anode (lower frequency loop) interfacial impedance. 20,26 The ohmic series resistance, high frequency resistance (HFR), decreased with added anolyte salt due to the improved ionic conductivity. The HFR for the five anolytes were in the following order (smaller is better): Cs+ < K+ < Na+ < Li+ < none. The bulkier cations have a smaller water solvation shell and weaker interaction with water which leads to higher ionic mobility and water diffusivity. Notably, the anolyte with K+ showed the lowest overall cell voltage.
Table I. Impedance analysis of 0.01 M NaOH and high ionic strength electrolytes with 0.15 M of LiNO3, NaNO3, KNO3, and CsNO3.
| HFR ( cm2) | Rint ( cm2) | Cint (F/cm2) | @ 1 A cm−2 (V) | |
|---|---|---|---|---|
| 0.01 M NaOH | 0.263 | 0.205 | 0.011 | 2.11 |
| 0.01 M NaOH + 0.15 M LiNO3 | 0.215 | 0.165 | 0.061 | 1.88 |
| 0.01 M NaOH + 0.15 M NaNO3 | 0.198 | 0.182 | 0.055 | 1.854 |
| 0.01 M NaOH + 0.15 M KNO3 | 0.186 | 0.136 | 0.066 | 1.802 |
| 0.01 M NaOH + 0.15 M CsNO3 | 0.177 | 0.173 | 0.033 | 1.876 |


The interfacial resistance (Rint) decreased (i.e., smaller is better) in a slightly different sequence than the HFR: K+ < Li+ < Cs+ < Na+ < none. Rint consists of the charge transfer and mass transfer resistances. The interfacial capacitance (Cint) is related to the total effective catalyst surface area (i.e., bigger is usually better): none < Cs+ < Na+ < Li+ < K+. A greater water flux delivered by the cation via migration increases the effective electroactive surface area of the catalyst. This leads to a decrease in the charge and mass transfer resistance at the three-dimensional cathode because the catalyst is more effectively used. 27 The trend of Rint and Cint shows that the cation and water mass transfer improvement and HER electroactive surface area are improved with addition of a more mobile anolyte cation.
A graphical summary of the activation, ohmic and mass transfer overpotentials of cells with 0.01 M KOH (left side) and 0.01 M KOH + 0.15 M KNO3 (right side) are shown in Fig. 2. The use of additional K+ in the anolyte improves the ohmic, activation, and mass transport overpotential compared to only use of 0.01 M KOH. Other cations also show results consistent with the K+ results in Fig. 2 (see Fig. S1). Notably, most of the anolyte improvements are derived from the mass transport enhancement due to the augmented water delivery. 20 These improvements all appear tied to the mobility of the hydrated.

Figure 2. Reversible, activation, ohmic, and mass transport overpotential fitting of (a) 0.01 NaOH and (b) 0.01 M NaOH + 0.15 M KNO3 polarization curves used in Fig. 1. 0.01 M NaOH with 0.15 M of LiNO3, NaNO3, and CsNO3 results are listed in Fig. S1.
Download figure:
Standard image High-resolution imageThe mobile cation concentration in the AEM is small due to salt incorporation from the anolyte. The quaternary ammonium cations within the solid polymer electrolyte are tethered to the cross-linked polymer backbone, however, anion exchange membranes do not perfectly reject other cations. In this case, the Na+ concentration in the AEM was found to be 0.147 meq g−1. 20,28 If there were no mobile alkali cations within the AEM, only tethered quaternary ammonium chain segment mobility would contribute to cation transport within the polymer. The cation transference number was measured in this study by using the Bruce-Vincent method to investigate the trend in transference number with cation type. 23
The methodology here is analogous to the original Bruce-Vincent method except for using electroactive hydroxide. Figure 3 shows the measurement protocol with 0.01 M KOH. First, linear sweep voltammetry was used to check the applied voltage needed to induce both OER and HER in the cell, Fig. 3a. The current initiated at 1.4 V generates hydroxide at the cathode and consumes hydroxide at the anode. Figure 3b shows chronoamperometry (CA) data (see inset) and Nyquist plots at the beginning and steady state portion of the CA at 1.5 V. The Nyquist plots show an out-of-phase element at 1.5 V, which incorporates the HER and OER. The characteristic time constant () was calculated by an equation ( ∼ /(2D+), where L is the thickness of electroactive layer and AEM, and D+ is the cation diffusivity) to determine the time period needed to approach a steady-state for to determine the cation transference number. Using the K+ diffusivity of 1.96 × 10⁻⁹ m2/s in water and 150 m AEM thickness yields a time constant of about 10 s. 13 In the CA experiments, the current approached a steady state value in several seconds.


Figure 3. Potentiostatic measurement of 0.01 M KOH in alkaline water electrolysis cell. (a) linear sweep voltammogram measured at 5 mV s−1. (b) Nyquist plots of initial (black squares) and steady state (red circles) of cell at 1.5 V with 10 mV amplitude. Inset is chronoamperometry data obtained at 1.5 V for 60 min.
Download figure:
Standard image High-resolution imageThe transference number for each alkali cation in the anolyte at 0.01 M and 0.1 M concentration was obtained by the Bruce-Vincent method (Table II). 23 When the anolyte concentration was 0.01 M, the cation transference number was 0.13 to 0.16. When the anolyte concentration was increased to 0.1 M, the cation transference number increased to 0.20 to 0.23. The higher concentration of alkali ion in the anolyte increases the alkali cation concentration in the AEM, leading to a higher cation transference number because the ratio of mobile alkali cations to immobilized cations (i.e., pendant quaternary ammonium) increases as the anolyte concentration increases. It was previously reported that the IEC of Na+ in AEMs after soaking it in DI water increased after soaking it in 0.01 M NaOH + 1.0 M NaNO3 electrolytes. In DI water, there were no sodium ions detected in the AEM. The IEC of sodium ions in the AEM when soaked in 0.01 M NaOH + 1.0 M NaNO3 was 0.147 meq g−1. There was also a measurable sodium ion concentration in DI water after soaking an AEM tested in an electrolysis with 0.1 M NaOH anolyte for 40 h at 1 A cm−2. 20 This previous result and the cation transference numbers in Table II show that an AEM does absorb salt from the anolyte (i.e., AEM salt rejection is not perfect), and cation migration and diffusion occur in the AEM during electrolysis. Cs+ shows the highest cation transference number, however, the electrolysis voltage (i.e., cathode overpotential) of the cell with Cs+ was not the lowest. This result shows that water transport is not only related to the cation mobility, but also affected by the cation hydration number.
Table II. Cation transference number calculated with alkaline water electrolysis by modified Bruce-Vincent method. 1.5 V was applied to cells.
| Concentration | Electrolyte | tOH− | tM+ |
|---|---|---|---|
| 0.01 M | LiOH | 0.869 | 0.131 |
| NaOH | 0.855 | 0.145 | |
| KOH | 0.840 | 0.160 | |
| CsOH | 0.827 | 0.173 | |
| 0.1 M | LiOH | 0.799 | 0.201 |
| NaOH | 0.786 | 0.214 | |
| KOH | 0.779 | 0.221 | |
| CsOH | 0.770 | 0.230 |
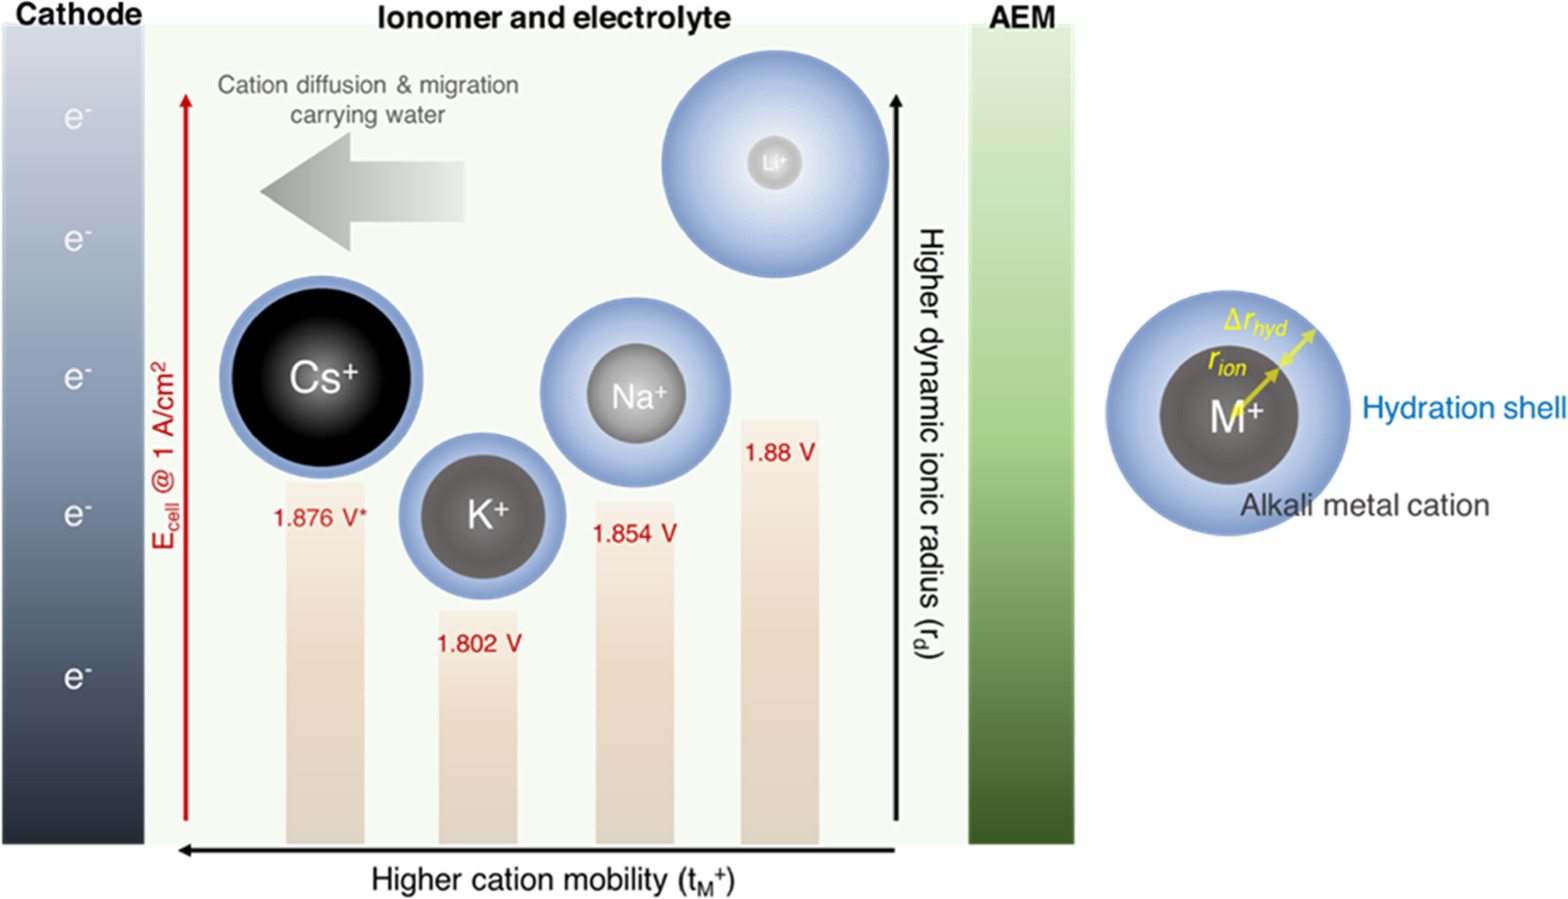
The size of the hydrated alkali ions is tabulated in Table III. The small ionic radius for lithium ions results in a larger hydration shell and larger overall dynamic radius, which lowers its ionic mobility compared to the other alkali ions. Potassium ions have the smallest radius resulting in a relatively high ionic mobility, compared to other alkali ions shown. A pictorial representation of the ionic radius and solvent shell is shown in Fig. 4. Although all four alkali ions improve the cathode performance, as shown in Fig. 1b, potassium ions show the best performance, which correlates with the smallest dynamic ionic radius and high mobility.

Figure 4. Graphical summary (left) of relationship between overall electrolysis voltage at 1 A cm−2, trend of cation mobility (tM +), and trend of dynamic ionic radius (rdyn). rdyn is overall diameter of hydrated alkali cation including rion and rhyd (right).

Download figure:
Standard image High-resolution imageLower pH (∼12) water electrolysis may contribute to improved AEM durability by suppressing metal corrosion and polymer hydrolysis. Using the optimal electrolyte with additional K+ (i.e., 0.01 M NaOH + 0.15 M KNO3), the long-term electrolysis durability was investigated at 1 A cm−2 (Fig. 5). Electrolysis with 0.01 M NaOH + 0.15 M KNO3 shows a very small increase in voltage during 100 h of electrolysis. Once a voltage plateau was developed, the cell voltage was very stable and maintained a value of 1.732 V for 800 h. This corresponds to 46.4 kWh/kgH2 of energy input and ∼85%HHV energy efficiency. The voltage slightly increases after 800 h with a marginal degradation slope of ∼40 V/hr. Thus, an alkaline water electrolysis with low pH high ionic strength electrolyte and optimal K+ salt concentration may be beneficial for the long-term electrolysis durability due to the better chemical stability at lower hydroxide concentration electrolyte, while preserving low electrolysis overpotential from the alkali ion water delivery mechanism from the anode to the cathode.


Figure 5. 1,000 h steady-state voltage profile of cell with 0.01 M KOH + 0.15 M KNO3 operated at 1 A cm−2 and 60 °C.
Download figure:
Standard image High-resolution imageTable III. Ionic radius (rion) a), hydration shell width ( rhyd) a), and dynamic ionic radius (rdyn) of alkali cation. Dynamic ionic radius is sum of ionic radius and hydration shell width (rdyn = rion + rhyd).


| Alkali cation | Ionic radius, rion (nm) | Hydration shell width, rhyd (nm) | Dynamic ionic radius, rdyn (nm) |
|---|---|---|---|
| Li+ | 0.069 | 0.172 | 0.241 |
| Na+ | 0.102 | 0.116 | 0.218 |
| K+ | 0.138 | 0.074 | 0.212 |
| Cs+ | 0.170 | 0.049 | 0.219 |

a)Ionic radius and hydration shell width were found in Ref. 27.
Conclusions
AEM alkaline water electrolysis performance with high ionic strength electrolytes comprising different alkali cation was investigated. The anode and cathode overpotential were examined in a three-electrode electrolysis cell using a pRE. The cathode overpotential was significantly improved when an additional 0.15 M of alkali cation was added into the 0.01 M NaOH anolyte. Cathode overpotential significantly changed while the anode overpotential remained relatively constant. The high ionic strength electrolyte with K+ (i.e., 0.01 M NaOH + 0.15 M KNO3) had the lowest overall electrolysis overpotential among the tested cations. The alkali cation transference number was measured with an AEM alkaline water electrolysis cell to investigate the effect of mobile cation mobility on electrolysis performance. The cation transference number increased for the more mobile cations. Cs+ had the highest cation transference number among the ones tested. K+ had the smallest dynamic ionic radius resulting in the high mobility and most effective water transport. The optimal high ionic strength electrolyte (i.e., 0.01 M NaOH + 0.15 M KNO3) had very good alkaline water electrolysis durability likely due to the more moderate pH in the high ionic strength electrolyte.