
Abstract
Battery research depends upon up-to-date information on the cell characteristics found in current electric vehicles, which is exacerbated by the deployment of novel formats and architectures. This necessitates open access to cell characterization data. Therefore, this study examines the architecture and performance of first-generation Tesla 4680 cells in detail, both by electrical characterization and thermal investigations at cell-level and by disassembling one cell down to the material level including a three-electrode analysis. The cell teardown reveals the complex cell architecture with electrode disks of hexagonal symmetry as well as an electrode winding consisting of a double-sided and homogeneously coated cathode and anode, two separators and no mandrel. A solvent-free anode fabrication and coating process can be derived. Energy-dispersive X-ray spectroscopy as well as differential voltage, incremental capacity and three-electrode analysis confirm a NMC811 cathode and a pure graphite anode without silicon. On cell-level, energy densities of 622.4 Wh/L and 232.5 Wh/kg were determined while characteristic state-of-charge dependencies regarding resistance and impedance behavior are revealed using hybrid pulse power characterization and electrochemical impedance spectroscopy. A comparatively high surface temperature of ∼70 °C is observed when charging at 2C without active cooling. All measurement data of this characterization study are provided as open source.
Export citation and abstract BibTeX RIS

This is an open access article distributed under the terms of the Creative Commons Attribution 4.0 License (CC BY, http://creativecommons.org/licenses/by/4.0/), which permits unrestricted reuse of the work in any medium, provided the original work is properly cited.
Since its commercialization by Sony in 1991, lithium-ion battery technology has undergone a development with significant advances. 1,2 Due to their high energy density, robustness and efficiency, the global electric vehicle stock consisted in 2022 of more than 26 million vehicles, marking an increase of 60 % compared to the previous year. 3 However, a diverse set of possible approaches regarding lithium-ion battery technology, consisting of different battery chemistries, formats and implementation concepts, exists. These range from common 18650 cylindrical cells with around 3 Ah to large-format pouch or prismatic cells with capacities upwards of 100 Ah. 4 Depending on the utilized concept, different advantages and disadvantages arise with regard to cycle life, thermal properties, gravimetric and volumetric energy density as well as safety.
The 4680 cell format (46 mm diameter, 80 mm axial length) was introduced for the Model Y electric vehicle at Tesla's Battery Day 2020 5,6 and promises higher energy content and power capability due to the larger format compared to frequently used 18650 or 21700 cylindrical cells 7 and a "tabless" design. Compared to a 21700 cell, the new format increases volume by a factor of 5.5. 8 Large-format cylindrical cells are expected to reduce production costs in pack assembly, as fewer individual cells need to be assembled and interconnected to achieve the same battery pack characteristics. In addition to Tesla, the manufacturer BMW announced the launch of its new electric vehicle platform called "Neue Klasse", also utilizing cylindrical cells with a diameter of 46 mm (with two different axial lengths). 9
Battery cell manufacturers usually only provide limited information about cell characteristics and do not disclose their highly complex, interdependent manufacturing processes. 8,10–12 In addition, cell chemistry and cell design vary depending on the cell and original equipment manufacturers as well as customer requirements, which leads to manufacturer-specific production chains. 13,14 In contrast, academic lithium-ion battery (LIB) research is typically conducted on a laboratory scale or utilizing pilot production lines using smaller cell formats, easy-to-make cell designs, and manual or semi-manual production processes. 15 Therefore, research-grade LIBs inherently differ from commercially produced battery cells and can thus only serve as a reference for few properties. 15–18
The described trend toward larger cell formats and the precarious situation regarding the availability of LIB production data substantiates the scientific community's interest in studying the characteristics of large-format cylindrical cells. Previously published articles highlighting and characterizing state-of-the-art cells further demonstrate the great appeal of such scientific manuscripts, as the data can be used, e.g. for battery modeling and further research. 11,15,18–20 Since the combination of a novel cell format and a tabless architecture governs the actual cell behavior, this study provides the basis for a improved understanding of these characteristics.
Previous research
Due to the short period of availability and limited procurement options from series-production vehicles, only comparatively few studies on the 4680 cylindrical cell format have been published to date. Frank et al. 21 used an experimentally validated multidimensional multiphysics model describing a high energy NMC811/Si-C cylindrical lithium-ion battery to evaluate the effects of tabless design and cooling topologies for, among others, 4680 cell formats under varying charging protocols. The results show that a tabless design contributes to improving the charging performance by reducing polarization and ohmic heating with an improved cell homogeneity and thus enables format-independent scalability of fast-charging performance with a tab-cooling topology. However, these results were obtained purely by simulation and using hypothetical layouts. Mayer et al. 22 used data from Frank et al. 21 to identify a processing strategy for high repetition ultrafast laser ablation scenarios. Tranter et al. 23 numerically explored the electrochemical and thermal behavior of a 4680 cylindrical cell and revealed a mitigation of ohmic losses occurring around the jelly-roll current collectors, which are considerable in the common tabbed case, thus resulting in higher efficiency and capacity as well as lower heat generation. As with Frank et al., 21 this study presented entirely simulative results. Pegel et al. 24 developed geometrical models describing the properties of the cells' structural components with regard to certain loadcases and explore the volumetric efficiency and energy density as a function of cell dimensions and housing material choices. Once again, no actual cell with a diameter of 46 mm was investigated in the study, with the models being based on a 10 Ah cylindrical reference cell. Shen et al. 25 used a distributed 3D coupled electro-thermal equivalent circuit network model of a 4680 cell to study different thermal management options and demonstrate that there does not need to be a trade-off between cell size and thermal performance, as long as cylindrical cells are designed tabless. To the best of the authors' knowledge, the first academic article with actual 4680 cells from Tesla was presented by Baazouzi et al., 8 in which the authors investigated 19 cylindrical lithium-ion battery cells from four cell manufacturers in four formats (18650, 20700, 21700, 4680) with respect to their design features, such as tab design and quality parameters. The results show that the Tesla 4680 cell architecture is not fully tabless since only the jelly roll design is engineered in a tabless manner. Approx. 25 % of the cathode and 30 % of the anode feature no notches, thus resulting in long thermal and electrical transport paths. However, the authors focus on the comparison with additional cells of different formats and not on an extensive characterization of the 4680 cell or its production processes. According to communication with the authors, the investigated cell appears to be from the identical vehicle as most test specimens investigated in this paper, allowing for comparative observations.
This teardown study ties in methodically with the characterization research of Günter et al. 11 as well as Stock et al., 15 who examined an automotive 78 Ah pouch cell from the Volkswagen ID.3 and a 161.5 Ah prismatic hardcase lithium iron phosphate (LFP) cell from a Tesla Model 3 (Standard Range), respectively.
Contributions
This characterization article extensively analyzes cylindrical 4680 lithium-ion cells from the so-called "first generation" that were extracted from a state-of-the-art Tesla Model Y (model year 2022, manufactured in Austin, USA). The following contributions are particularly noteworthy:
In-depth cell architecture and electrode material analysis: Detailed exploration of the cell architecture, analysis of the material composition using scanning electron microscopy (SEM) and energy-dispersive X-ray spectroscopy (EDX) and investigation of electrode properties over the full length of the anode and cathode sheet.
Three-electrode analysis: Assembly of 1/2'' T-cells with gold wire as a reference electrode and subsequent investigation of anode and cathode characteristics using pseudo open-circuit voltage (pOCV) and galvanostatic electrochemical impedance spectroscopy (EIS).
Thermal investigation during charging: Analysis of the heat generation at cap, center and bottom of one cell's can during charging rates of up to 2C utilizing a thermal imaging camera.
Electrical characterization of several cells: Extensive performance characterization at the cell level using constant current (CC) charges/discharges and galvanostatic electrochemical impedance spectroscopy (EIS) measurements of multiple cells.
Hybrid pulse power characterization of one cell: Investigation of the resistance behavior of one cell using a hybrid pulse power characterization (HPPC) measurement employing 10 s charge and discharge pulses at C-rates of 0.5C to 1.5C in 10 % state-of-charge (SOC) increments from 10 % to 90 % SOC.
Open source provision of all measurement data: All raw measurement data, including cell teardown images, SEM/EDX recordings, and test procedures are provided as open source alongside the article.
Experimental
The cells under study and the experimental procedures of cell teardown as well as electrical characterization and thermal investigation are described hereinafter.
Overview of tested cells
All cells under investigation in this study originate from a Tesla Model Y (year of manufacture 2022) and were procured in late 2022 and early 2023, thus belonging to the first generation of 4680 cells. Eight of the nine cells were obtained via an engineering and manufacturing consulting firm in the United States (Munro & Associates, USA), with an additional cell (herein titled as ID xxx/828) made available by industry which still was attached to parts of the side cooling system. No precise exposure history is available for any of the cells, but in the case of the cell from a different source in particular, previous investigations are to be assumed, which is why this cell is excluded from any further examinations and thus only serves as a visual comparator. Upon receipt of the goods, all cells were first visually inspected revealing several dents near the top assembly on four of the cells, presumably resulting from the forceful disassembly process from the vehicle. All residual structural foam was removed using acetone. An overview of the cells under study and their condition at incoming inspection is given in Fig. 1. The Figure also provides an overview of the assignment of the cells to the experimental test procedures performed in each case, since the different characterizations were performed in parallel. The cell ID nomenclature was adopted from the supplier and refers to the number of the cell in the Tesla Model Y battery pack. According to the supplier, there are 828 cells arranged in four modules. 26,27 No official data sheet was provided upon delivery by the manufacturer or supplier.

Figure 1. Overview of the lithium-ion cells examined, their cell ID, condition upon arrival and classification as well as tests conducted.
Download figure:
Standard image High-resolution imageCell teardown and material extraction
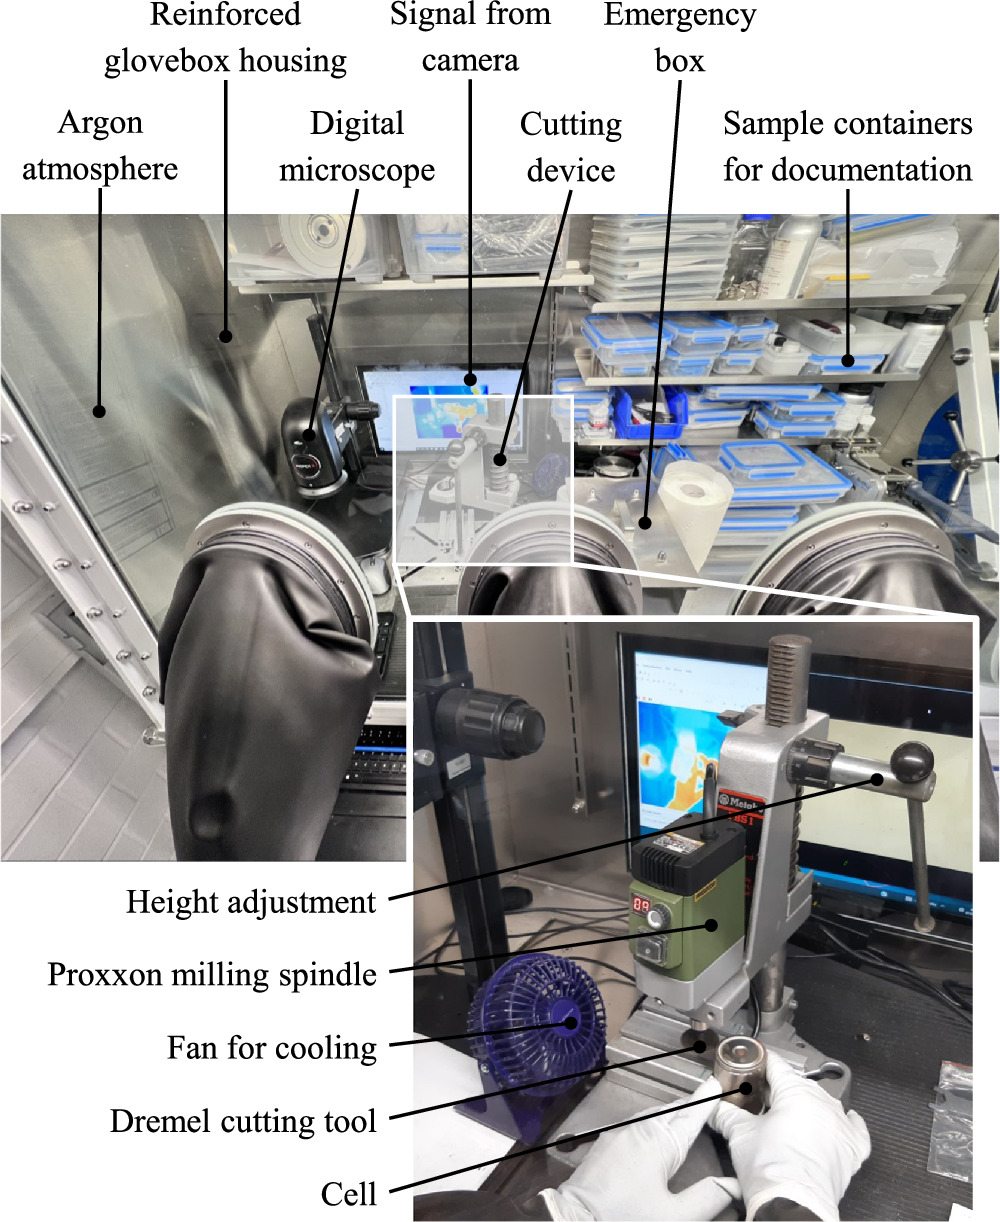
One cell (ID 083/828) was selected for teardown, discharged completely to 2.5 V, and brought into a glove box specially designed for teardown analysis (MBraun, Germany). Filled with an argon atmosphere, the values for H2O and O2 were constantly monitored and regulated to below 0.1 parts per million (ppm). The setup has been used for previous cell teardown studies 11,28 and is illustrated in Fig. 2.

Figure 2. Overview of the test setup for cell teardown.
Download figure:
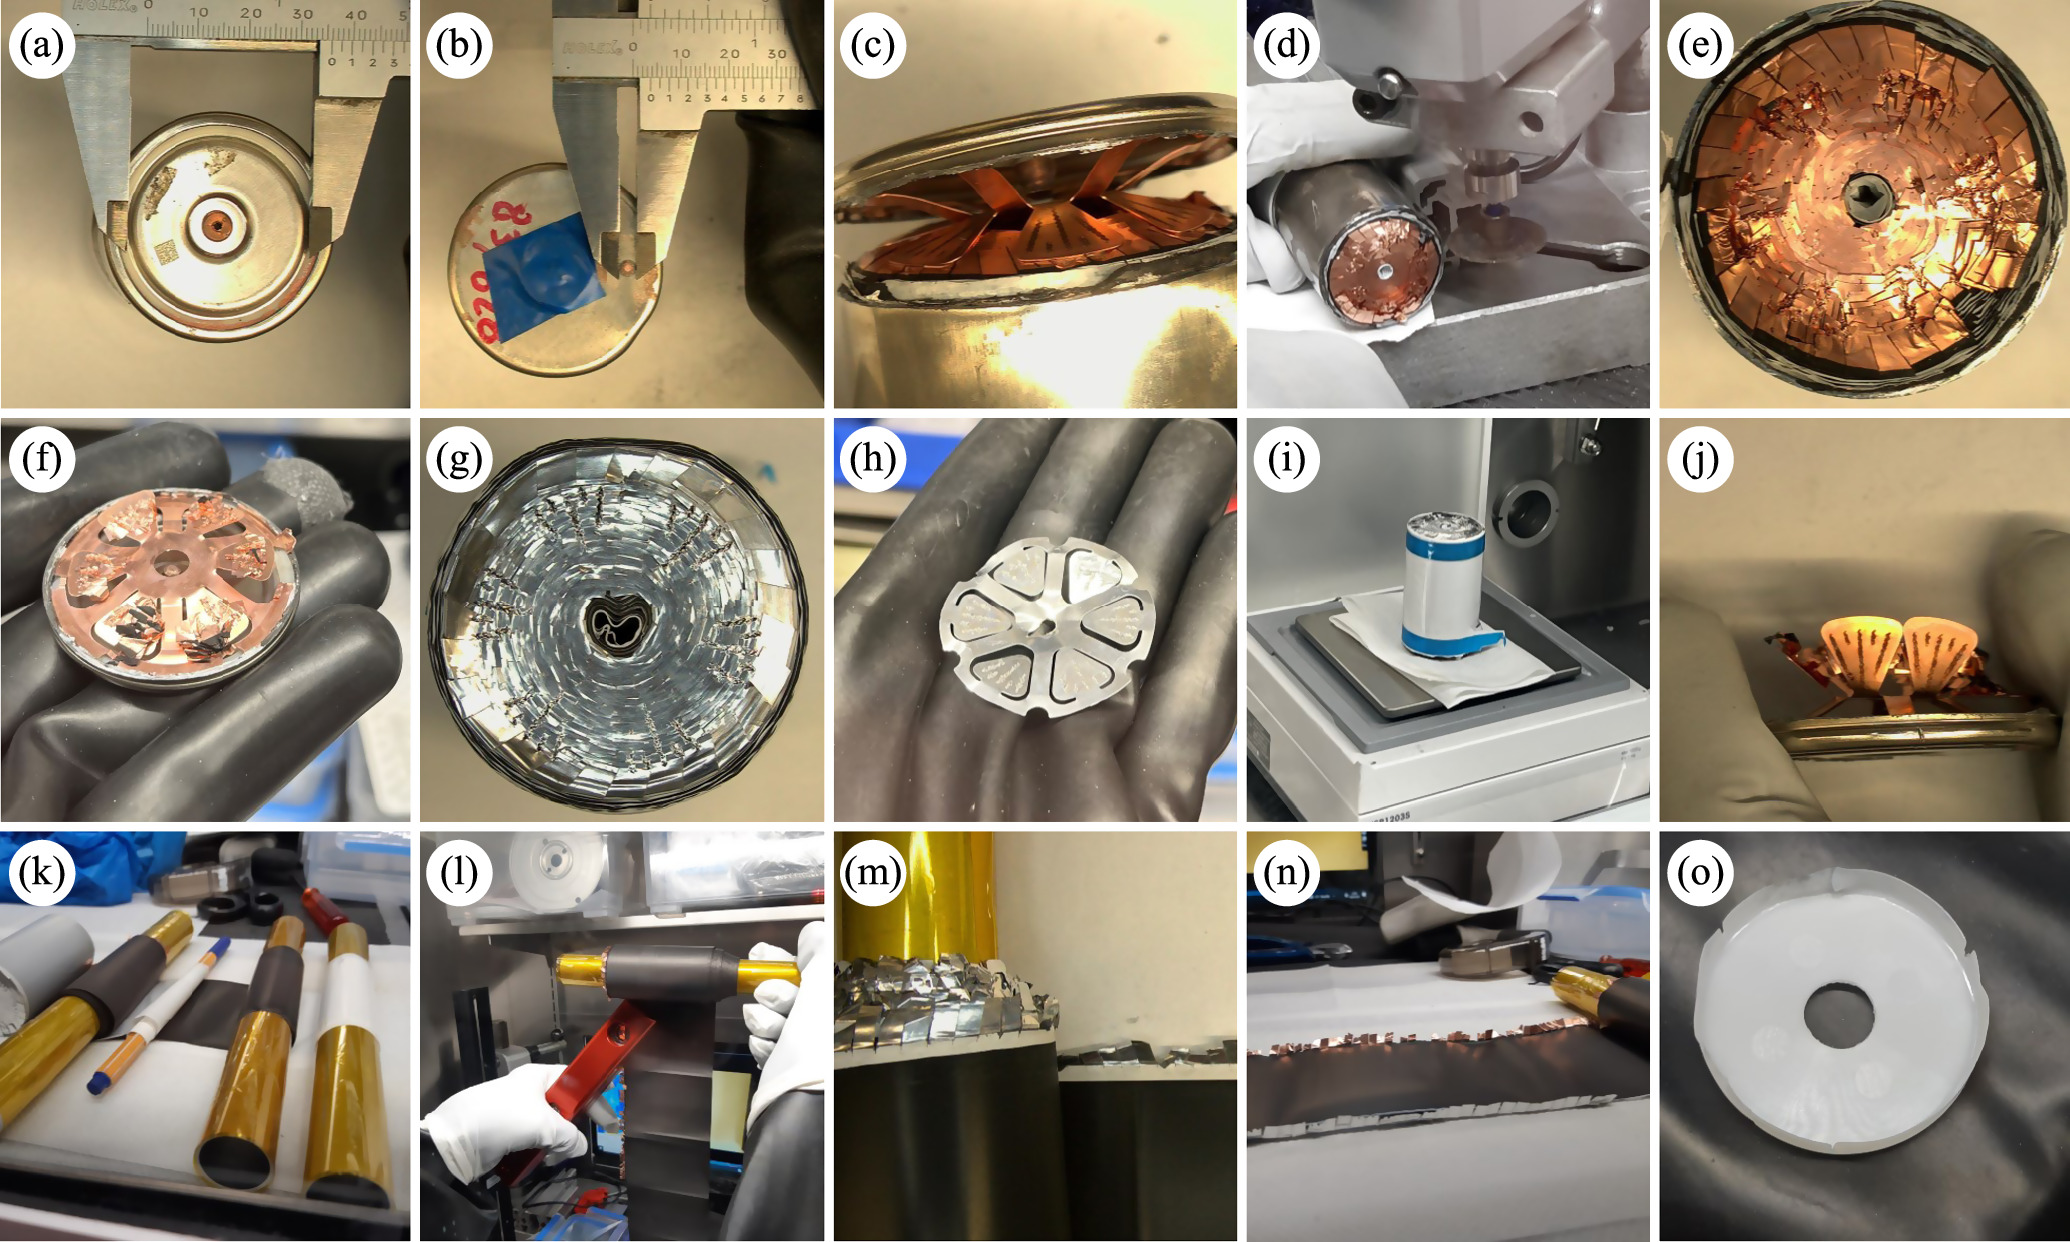
Standard image High-resolution imageTo open the casing of the cell, a milling spindle (Proxxon, Germany) with a cutting disc with a diameter of 32 mm (Dremel, USA) was used within the glove box, ensuring that the cutting disc would only penetrate the casing and not the electrodes. First, a cut was performed around the perimeter of the top of the cell, so that the lid could be removed. Since at this point, the lid was still attached to the anode current collector, it was removed by applying a slight force with pliers thus exposing the jelly roll. Due to the radial pressure of the jelly roll acting on the cell housing, it is not possible to remove the jelly roll simply by pulling on it. It was therefore necessary to perform an additional vertical incision on the side wall of the casing. Then, the metal casing was peeled back using a needle nose plier and the jelly roll was freed from the casing for further analysis. Upon extraction of the jelly roll, no surplus electrolyte was extractable for analysis. Measurements of the cell and all of its components in combination with images were taken throughout the entire teardown process and are used throughout this work. Additionally, the DataMatrix code located on the bottom side of the cell can could be read using a handheld scanner (DS3608, Zebra Technologies, USA). Cell teardown images can be found in the supplementary material. The teardown process of the cell is illustrated in Fig. 3.

Figure 3. Display of the teardown process of one cell (ID 083/828) as well as depiction of partial measurements on the opened cell. (a)–(d) Outer cell measurements and cell opening, with weld spot of the housing visible in (b); (e) Notched and folded anode tabs (f) Anode disk; (g) Notched and folded cathode tabs; (h) Cathode disk; (i) Dismanteled jelly roll; (j)–(o) Inner cell architecture and component measurements. Additional cell teardown images can be found in the supplementary material.
Download figure:
Standard image High-resolution imageStructural and elemental analysis
After opening the cell (ID 083/828), the electrode assembly was entirely removed from the casing and geometrically measured. The current collector discs were removed from both the cathode and anode sides of the jelly roll, and their dimensions along with the assembly structure were measured (cf. Fig. 3). Subsequently, the adhesive tapes of the jelly roll were removed, and the electrode assembly was unwound, resulting in separate cathode, anode, and the two separators. The thickness of all components was measured using a Micromar 40 EWRi (Mahr, Germany). Lengths and widths of the components were measured using calipers and a folding rule. To determine the areal mass loading of the electrodes, samples were extracted using Nogami punches (Nogami, Japan) with a diameter of 14 mm for cathodes and 15 mm for anodes. These samples were then weighed using a high-precision scale. Starting from the core of the roll, samples were taken and measured every 50 cm up to the ends. For determining the current collector thickness, the coating was removed from both sides of the electrode using isopropanol and a scalpel, after which the substrate was measured. The density of the electrodes' active material was calculated by subtracting the current collector foil, based on the areal mass loading and the thickness of the electrodes. Scanning Electron Microscopy (SEM) was conducted utilizing a JEOL IT-200 instrument (JEOL, Japan) operating at 15 kV, equipped with a Low Energy Ionization (LEI) detector, and varying magnifications were employed (as depicted in the images). The identical apparatus was also employed for energy-dispersive X-ray spectroscopy (EDX) measurements. For the SEM and EDX analysis, one sample each of the cathode and the anode were also taken with the punch.
Three-electrode analysis
A three-electrode setup consisting of two original electrodes and an additional gold wire as a reference electrode enables the investigation of single-sided electrodes. 15,29 In this case, T-cells (1/2", Swagelok, USA) were used for the three-electrode setup of the disassembled cell (ID 083/828). The electrodes were delaminated on one side using acetone and isopropanol for the cathode and anode, respectively. The anode in particular required intensive delamination due to the primer needed for dry coating. The electrodes were washed with diethyl carbonate (DEC) for 24 h, leading to delithiation of the anode and potential removal of parts of the solid electrolyte interphase (SEI). 30 Electrodes with a diameter of 10.95 mm were used for the T-cells, which were taken with a hand punch (Nogami, Japan). In the assembly, the gold wire (Goodfellow, England) with a diameter of 50 μm and an insulation of 7 μm of polyimide was placed between two separators. These separators (type 691, VWR International, USA) measure 250 μm in thickness and 11 mm in diameter. Before assembling the cell, all components were vacuum dried at 100 °C for 24 h to remove residual water, which could cause damage to the cells. An argon-filled glove box (MBraun, Germany) was used for assembly. For the electrolyte, 60 μL of LP572 (BASF, Germany) was used. All subsequent activation and test protocols were carried out in a climate chamber at 25 °C using a potentiostat (VSP-3e, Bio-Logic, France). After assembly, the gold wire was lithiated with the cathode using a current of 150 nA for one hour. In addition, an open circuit phase of 2 h allowed complete wetting of the electrodes. To reform the SEI after the washing process, three activation cycles with C/10 were carried out. Based on the determined capacity of the full cell and the measured cathode area, the specific capacity is calculated to be 4.9 mAh/cm2 (used for determining all test currents). A pOCV measurement at C/50 in a constrained voltage range of 2.9 V to 4.2 V and a galvanostatic electrochemical impedance spectroscopy (EIS) measurement from 100 kHz to 100 mHz (10 mV excitation amplitude (potential), 6 points per decade (ppd), 3 average measures per frequency (amf)) at 50 % SOC were carried out. A total of six cells were built to exclude outliers due to manufacturing defects. The raw measurement data and the activation and test protocol can be found in the supplementary material, while the electrical test protocol is provided in Table A·I.
Electrical characterization
To evaluate the resistance of the full cell under test at different SOCs, a HPPC measurement was performed. For this purpose, the cell (ID 186/828) was subjected to 10 s charge and discharge pulses at C-rates of 0.5 C, 1 C and 1.5 C after 1 h of relaxation, each. The analysis was performed in 10 % SOC steps from 10 % to 90 % SOC. After each pulse, a pause of 300 s was added, before the charge was reset using coulomb counting and the cell was relaxed for 1 h before the next pulse. The HPPC test protocol is presented in Table A·II.
Capacity characterization protocols, which included a C/3 CC discharge capacitance determination and C/20 pOCV measurements in charge and discharge direction, were applied to eight cells (ID 083/828, 131/828, 186/828, 444/828, 536/828, 549/828, 550/828, 601/828) and are presented in Table A·III.
Three cells (ID 131/828, 186/828, 549/828) were subsequently subjected to galvanostatic EIS (10 kHz to 10 mHz, 10 ppd (logarithmic spacing), 500 mA excitation amplitude, 5 amf, drift correction) at 80 %, 50 % and 20 % SOC in a separate test setup optimized for impedance measurements (no adjacent experiments, twisted pair cable feed, shielding in separate test chamber). The corresponding test protocol is provided in Table A·IV.
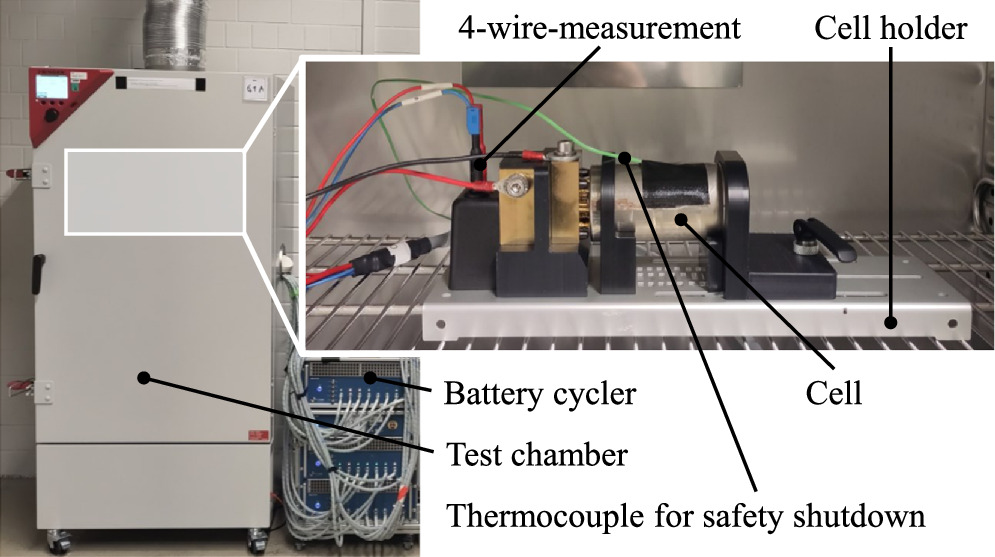
For all test procedures at cell level a lower cutoff voltage of 2.5 V was selected, with 4.2 V as the upper limit (voltage range based on Baazouzi et al. 8 and publicly available battery characteristics 31 ). A high precision battery cycler (BCS-815, Bio-Logic SAS, France) was used to perform the electrical capacity characterization procedures and the galvanostatic EIS measurements, with cell holders model KSR-150-OS (Voltavision, Germany) to constrain and connect the cells using a 4-wire-measurement. The HPPC measurement was performed using a separate test system (XCTS50, Basytec, Germany) to allow for the required higher currents. The HPPC tests and the galvanostatic EIS measurements were performed in a IPP110 climate chamber (Memmert, Germany) at a constant temperature of 25 °C ± 0.2 °C, while all other electrical tests on cell level were performed in a test chamber model KB400 (BINDER, Germany) at identical setpoint temperature. Furthermore, the capacity determinations of the cells with ID 083/828 and 601/828 were performed using a similar test setup (BCS-815 cycler and KB400 test chamber), whereby however another cell holder (Battery Holder 60A—Universal Cylindrical Cell, ARBIN Instruments, USA) was utilized due to logistical reasons. The raw measurement data as well as all corresponding test protocols of the electrical characterizations can be found in the supplementary material. The general test setup for the electrical characterizations is shown in Fig. 4.

Figure 4. Overview of the test setup for electrical characterization (except where noted otherwise).
Download figure:
Standard image High-resolution imageTo gain deeper insights for revealing transition phases of the cell chemistry, non-invasive electro-chemical voltage spectroscopy methods such as differential voltage analysis (DVA) and incremental capacity analysis (ICA) were calculated. Hereby, the peaks in the DVA and ICA provide information about e.g. phase transitions in the electrodes. 32–35 The DVA is extracted by the ratio of the derived voltage and capacity signal and is plotted against the capacity. In this work, the DVA was normalized by the nominal capacity converting the unit to Volts and shifting the regime of the data to around 1 V. Forming the derivative of a measured discrete signal induces noise, so that both the voltage and capacity signal were smoothed by a mean filter with the window size of 73 points before derivation. The DVA was again filtered by a mean filter with window size of 363 from the left to the right, and vice versa, to compensate for induced shifts. Generally, care must be taken when filtering the DVA, as information can be lost or misinterpreted. 36,37
Thermal investigation
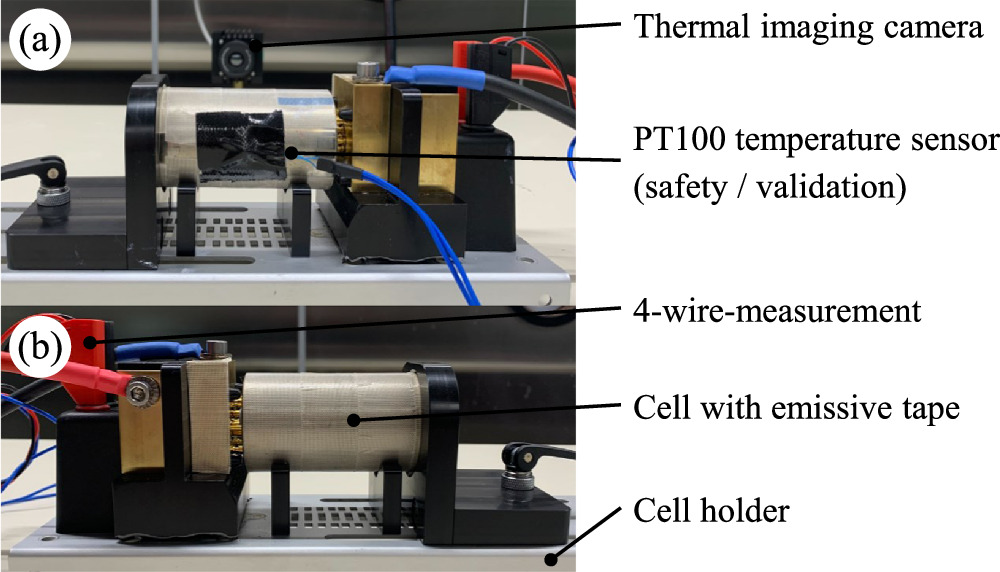
One cell (ID 536/828) was selected for the evaluation of heat generation during charging. The cell was cycled with an XCTS50 test system (Basytec, Germany) starting from a discharged state with a CC charge profile with charge rates of 1C and 2C up to the upper cutoff voltage of 4.2 V. The charging phase was followed by a  rest period to observe the subsequent cooling behavior. The cell was then discharged to the cutoff voltage of 2.5 V at a discharge rate of C/3. The test protocol is provided in Table A·V. Analogously to the electrical characterization, the cell was secured in a KSR-150-OS cell holder (Voltavision, Germany). A thermal imaging camera (A70, FLIR Systems, USA) was used to record the axial temperature distribution at the cell can. This camera has a measurement range of −20 °C to 175 °C with a measurement accuracy of ±2 % and a resolution of 640 × 480 pixels at a frame rate of 30 Hz. The focus of the camera was set to 1.2 m and the camera was placed at the same distance from the cell surface. The cell can was covered with an emissive tape (
 = 0.95) to avoid measurement inaccuracies due to reflective surfaces and unknown emissivity. Temperature data was recorded and analyzed using FLIR Research Studio version 2.1.0 software. The measurement points in the temperature profile at the cap, center, and bottom of the cell were evaluated in order to evaluate the temperature spread across the cell can during the charging process. In addition, the temperature measurement at the center was validated with a PT100 temperature sensor at the same location to exclude deviations compared to other temperature measurement methods. The experimental setup was placed in an EBU-3EA0PT-40 temperature chamber (ESPEC, Japan), and the ambient temperature was kept constant at 25 ± 0.5 °C throughout all of the tests. No active cooling of the cell was conducted. The raw measurement data and the corresponding test protocols of the thermal investigation can be found in the supplementary material. The test setup for the thermal investigation is depicted in Fig. 5.

Figure 5. Overview of test setup for thermal investigations. (a) View in the direction of the thermal imaging camera; (b) View from thermal imaging camera.
Download figure:
Standard image High-resolution imageResults and Discussion
The results of the experiments are presented hereinafter. Particular attention is paid to the cells' characteristics and architecture.
Cell and jelly roll architecture
Figure 6 shows an exploded view of all relevant parts within the cell. The cylindrical part of the cell has an outer diameter of 46 mm and a height of 80 mm. The positive terminal with a diameter of 16 mm adds another 1 mm to the total height of 81 mm. On the negative terminal side, a copper rivet which seals the filling hole is placed in the center. The thickness of the housing is measured to be 0.5 mm which leads to a cylindrical inner volume of 125.6 cm3 (sealings and three-dimensional form on the anode side not considered). The wall thickness is increased compared to common commercial cells in 18650 or 21700 format, which may be due to the alleged structural use of the cells in the vehicle design, yet it reduces the energy density. 38,39 After removing the cathode and anode disks, the jelly roll has a height of 71 mm and a diameter of 44.5 mm. There is no winding mandrel in the core of the roll, but rather an empty space with a diameter of 5 mm. The roll is secured and held together at both ends with two 10 mm wide blue tapes. For the internal connection of the cell poles a disk tab design with notched and folded electrode tabs is utilized. 8 The cathode disk is made out of aluminum and the anode disk out of copper with both having a thickness of 0.2 mm. The dimensions of the two disks are depicted in Fig. 7. Both disks exhibit hexagonal symmetry, but differ in the position of the joint to the leaf-shaped connector. The connector of the cathode disk is joined at the outer ring whereas the connector of the anode disk is joined toward the center. The outer ring of the anode disk is connected to the cell housing, whereas for the cathode disk the center is ultrasonically welded to the positive terminal of the cell. Therefore, the two disks can act like compensating elements or springs when attaching the jelly roll with the housing. Each connector is joined to the notched and folded electrodes via five laser-welded zig-zag seams with a width of about 0.5 mm. The lengths of the seams are depicted in Fig. 7. Furthermore, a plastic disk, measuring 0.65 mm in thickness, serves as an insulating barrier between the cathode disk and the cell housing, which is at anode potential. This arrangement facilitates a connection solely to the positive terminal.

Figure 6. Exploded view of the parts of the 4680 cell. The components are drawn based on the measured dimensions of the cell, current collector disks, and the jelly roll.
Download figure:
Standard image High-resolution imageThe manufacturing process of the cell can be reconstructed as follows. The jelly roll with the folded electrode tabs are produced. On the anode side, the copper disk is laser-welded to the copper foils. On the cathode side, the aluminum disk with a previously ultrasonically welded cell tab is laser-welded to the aluminum foils. The plastic disk is placed onto the cathode disk and afterwards the assembly is inserted with the cathode side first into the cell can. On the anode side a cap with the filling hole is placed on top and the cell can is crimped and sealed. After the filling process, the filling hole is sealed with a copper rivet. The DataMatrix code on the bottom side of this cell can contains the information P1551370-10-D:STRR221370808AK. It is assumed to be a unique identification for this specific cell, used for tracking and tracing applications in the manufacturing process and in vehicle deployment. 40 The traceability of battery cells offers a crucial means to ensure quality, safety, and efficiency in battery production and usage.
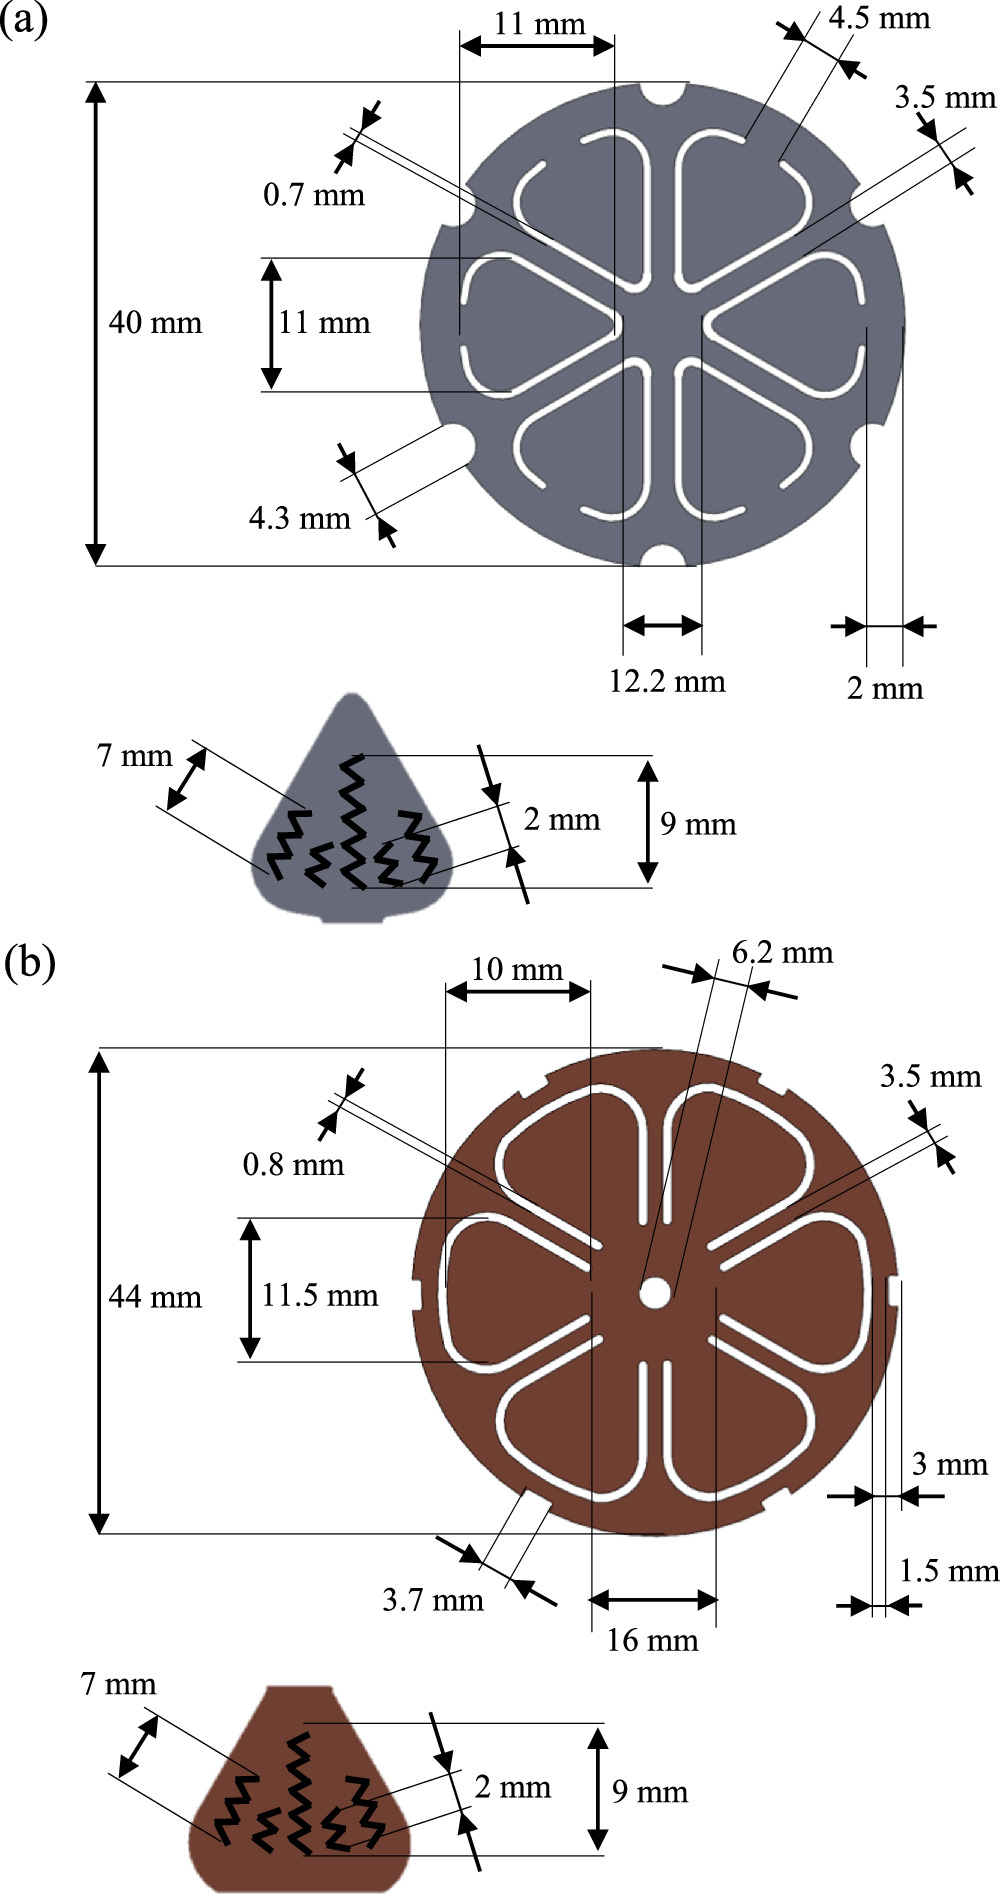
Figure 7. Dimensions of (a) cathode and (b) anode disk including a close-up of the leaf-shaped connectors with length and shape of the laser weldings. Drawings are not to scale.
Download figure:
Standard image High-resolution imageElectrode design
The electrode winding consists of a double-sided coated cathode and anode, as well as two separators. The lengths and widths of these components can be seen in Fig. 8. Since the component widths are different in size, they are depicted in an enlarged form.
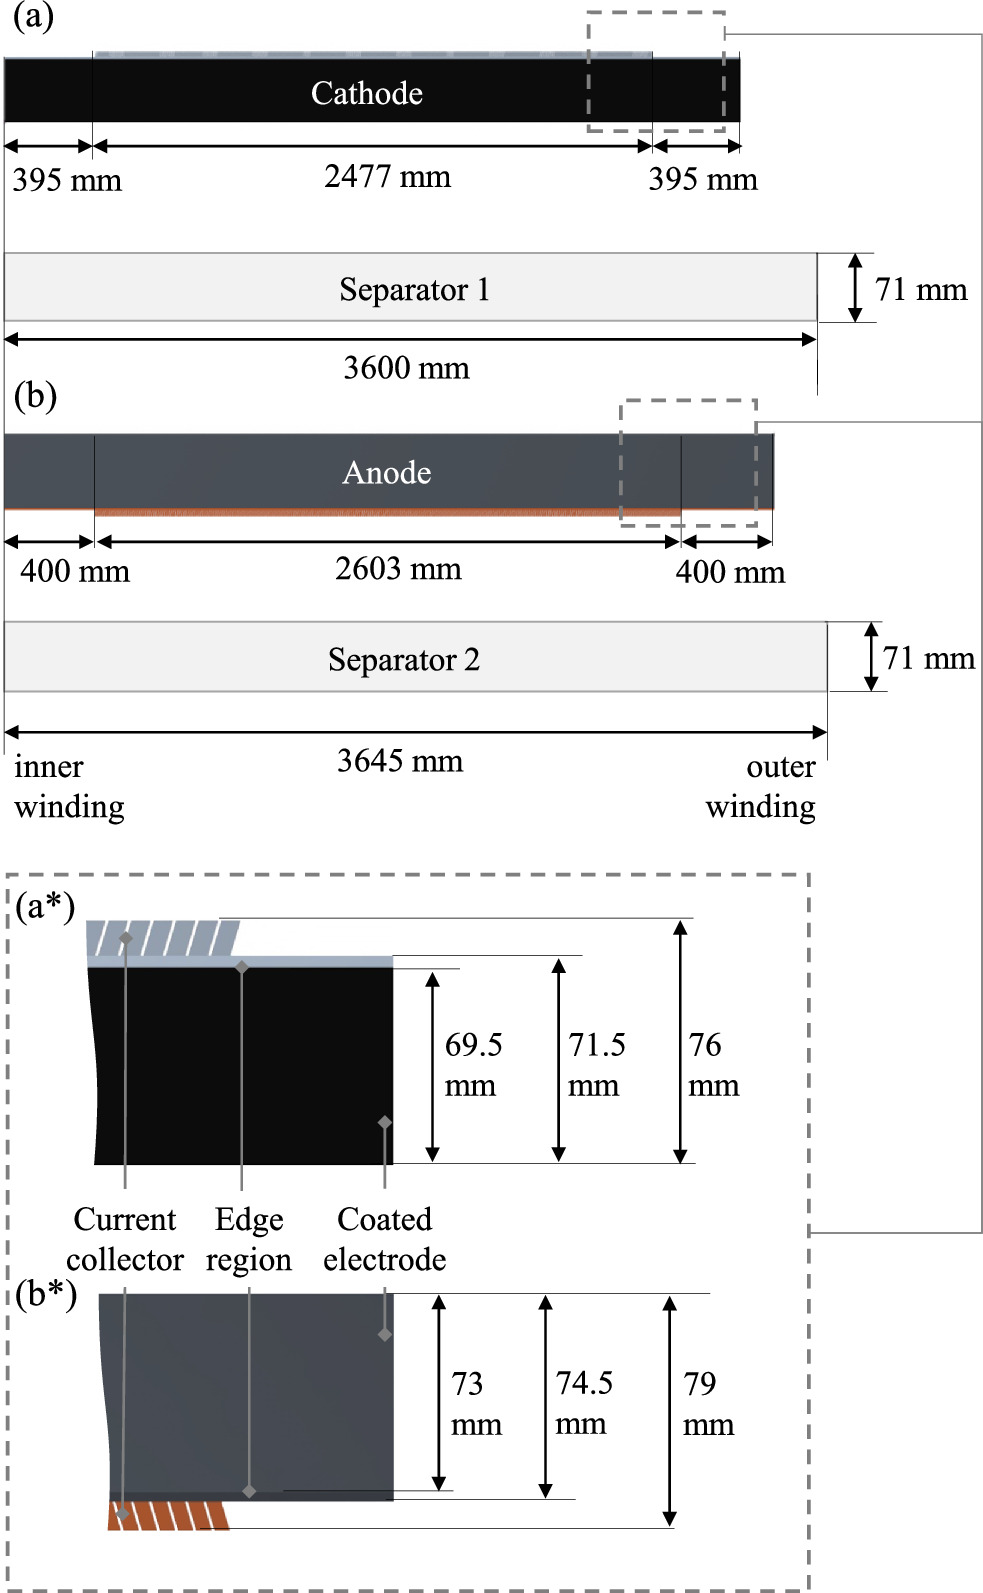
Figure 8. Dimensions of the electrodes and separators. The schematic enlargement of the cathode (a) can be seen in (a*) and of the anode (b) in (b*).
Download figure:
Standard image High-resolution imageThe structure of the electrodes resembles that of conventional round cell designs. 8 The total length of the anode is 3403 mm, which is 136 mm longer than the cathode. In the assembled state, the cathode is completely wrapped by the anode. Furthermore, the two separators are longer than the electrodes, with the longer separator 2, in the assembled state, completely wrapping the electrode assembly of cathode, anode, and separator 1 once again and being secured with blue tape. The current collector flags, which enable internal cell contact, are not located along the entire length of the electrode but are symmetrically positioned relative to the center of the electrode length. In Fig. 9, the measured thicknesses and the calculated areal mass loadings along the electrodes are displayed. A length of 0 corresponds to the electrode position at the core of the inner winding.

Figure 9. Electrode properties over the full length of the anode and cathode sheet. (a) Electrode thickness; (b) Loadings; (c) Density. Loadings were determined by punching out coins and thicknesses by a micrometer screw using measurement points every 50 cm. The density was derived from the electrode thickness and loading.
Download figure:
Standard image High-resolution imageIt can be observed that, at both the cathode and anode, the electrode thickness at the beginning of the winding is highest at the core and then decreases significantly. Beyond a 1 m electrode length, the electrode thickness increases again. In contrast, the electrode loadings weighed from the electrode samples remain almost constant throughout their length. The non-uniform electrode thickness can be explained by the following approach: Since the cell to be opened was already in operation, the electrodes underwent volume changes due to charging and discharging processes. Because the electrodes are differently compressed due to the jelly roll winding structure, this results in subsequent and varying changes in thickness. As no mandrel was used in the core of the cell, it is plausible to assume that the electrodes toward the center (length = 0) have more space for volume change and resulting thickness changes than those in the middle of the winding.
Material characterization
For a more in-depth analysis of the electrodes, SEM images were captured, with Fig. 10 displaying both top and side profile views of the cathode and anode.
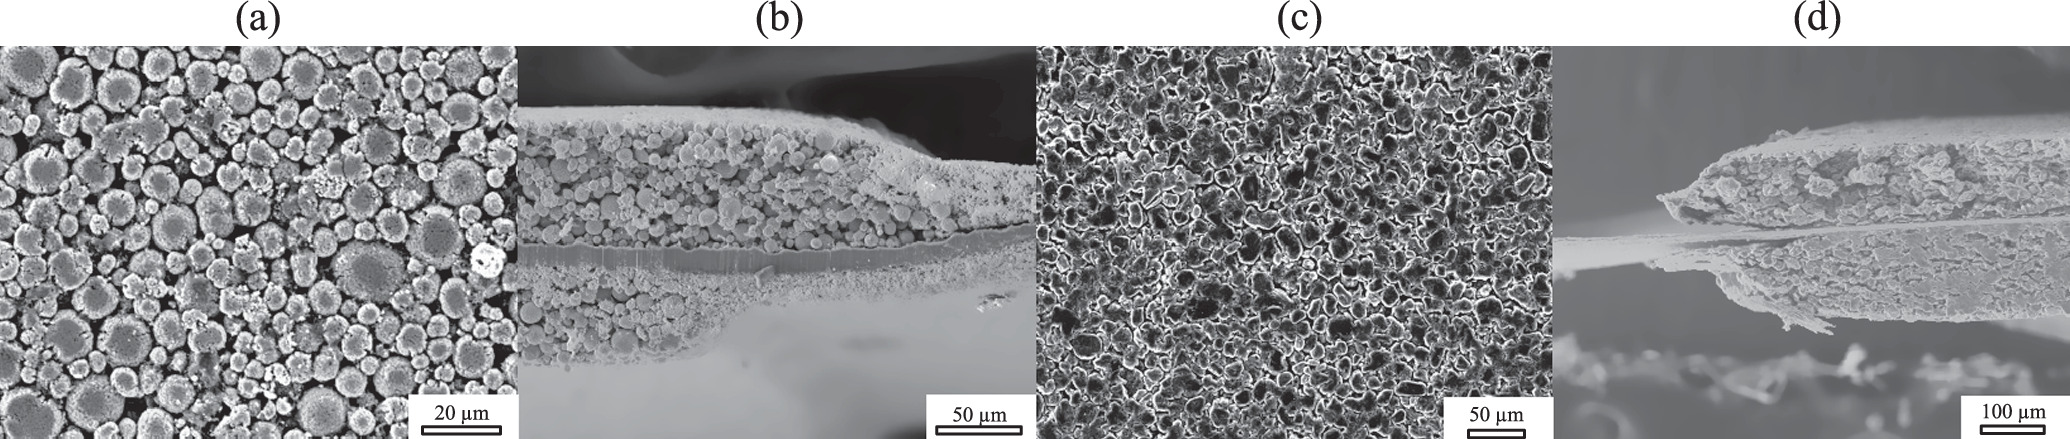
Figure 10. SEM images of the cathode from the (a) top and (b) side view, and the anode from the (c) top and (d) side view. The one-sided delamination of the coating visible in (d) was presumably caused by the punching process. Additional SEM images can be found in the supplementary material.
Download figure:
Standard image High-resolution imageOn the cathode side, spherical active material particles were found. They have diameters ranging from 3 μm to 16 μm. These characteristics are typical for NMC materials, which can be confirmed by EDX measurements available in the supplementary material. The element distribution was taken from an EDX measurement taken from the surface of the cathode. NMC was used as the active material, featuring a mass ratio of 81.8 % nickel, 12.1 % cobalt, and 6.1 % manganese, considering only the mass ratios of the three elements. The EDX analysis of fluorine showed accumulations between the active material particles and a total amount of 7.9 %. This led to the conclusion that polyvinylidene fluoride (PVdF) was used as a binder as it is one of the most commonly used binders in cathodes. 41 Small traces (<0.5 % each) of phosphorus and sulfur were also detected by the EDX which are residues of lithium salts used in the electrolyte. Examples for commonly used lithium salts containing phosphorus and sulfur are lithium hexafluorophosphate (LiPF6) and lithium bis(fluorosulfonyl)imide (LiTFSI). 41 The presence of minor cracks on the sides of larger particles may indicate the application of substantial forces during the calendaring step. 42 However, only the particles in the top layer are affected by this phenomenon as can be seen in the side profile. The side profile also shows the aluminum current collector and that the two sides of the double-sided coating have a horizontal offset of approx. 140 μm. No elevation of the edge can be seen. On the edge of the cathode coating, an extra coating layer can be identified. It consists of a finer, crystal-like structure. The EDX analysis revealed that aluminum and oxygen make up the extra layer which lead to the conclusion that an Al2O3 was used. Given that it partially covers a portion of the cathode coating, it can be inferred that it was applied subsequently to the primary coating process and serves as an electrically insulating or protective layer.
The anode consists of flake graphite particles. 43 The image shows that the particles have diameters of up to 35 μm, and the EDX analysis confirms the exclusive use of graphite as the active material, with no detectable presence of silicon in the measurements. A dominant carbon content of 90.5 % was detected, consistent with graphite's composition, and also consistent with the typical composition of electrically conductive additives such as carbon black and most binders. Furthermore, fluorine is present at a significant quantity of 7.9 %, which may suggest the presence of a binder containing fluorine, such as PVdF as found in the cathode, or polytetrafluoroethylene (PTFE). The utilization of PTFE could indicate a solvent-free anode fabrication method. 44 Similarly to the cathode, trace amounts of phosphorous and sulfur are detected (<0.5 % each), supporting the hypothesis that they originate from lithium salts in the electrolyte. Although copper, as a heavy metal element used in the current collector foil, is evident throughout the coating and appears in the EDX measurements, its quantity is minimal, constituting less than 1 %. Between the coating and the copper collector, a black primer coating was observable. It exhibited a notably distinct structure from the actual anode coating and extended approximately 1.5 mm beneath the coating. EDX analysis revealed that it primarily comprises carbon and fluorine, leading to the inference that the same binder as in the coating, along with carbon black for electrical conductivity, was used. This primer coating strongly suggests the utilization of a solvent-free coating process. The advantage here is the elimination of the need for harmful solvents and the avoidance of the energy-intensive production step of drying the anodes. 44
Three-electrode analysis
Using the three-electrode setup, the pOCV for the full cell, anode, and cathode can be extracted with a current of C/50, shown in Fig. 11a. During the C/50 cycle, all cells achieved coulombic efficiencies above 99 %, indicating representative results. As can be seen in Fig. 11, the anode potential shows characteristic staging behavior during the lithiation at around 0 V vs Li/Li+, which is also reported by Nitta et al. 45 Considering the potential of the gold wire after lithiation, three distinct potential plateaus are visible at 210 mV, 120 mV, and 85 mV. Through the steps, the phase transition of the graphite is visible with LiC24, LiC12, and LiC6, respectively. During the transition, the potentials are almost constant. This behavior is characteristic of a pure graphite anode, which leads also to the conclusion that the anode does not contain any silicon. In addition, the measured cathode potential shows the characteristic pattern of the NMC chemistry. As shown in Fig. 11a, the charging and discharging curves reveal overpotentials of around 0.5 V even at a small current of C/50, indicating a high internal cell resistance. This can be caused by the three-electrode setup, were two separators are being used.

Figure 11. Measurement data of the T-cells. (a) pOCV curves of full cell, anode, and cathode at C/50 as well as charge and discharge curves of full cell potential in the constrained voltage range of 2.9 V to 4.2 V; (b) Half cell and full cell impedance spectra of a T-cell setup measured at 50 % SOC. The frequencies were sampled identically for all measurements.
Download figure:
Standard image High-resolution imageThe results of the galvanostatic EIS measurement are shown at 50 % SOC. In Fig. 11b, overall, a higher impedance of the anode can be seen in comparison to the cathode. Therefore, the spectrum of the full cell is dominated by the anode (in accordance with 15 ). This kinetical limitation is either due to material properties, degradation or interdependencies with the dissassembly and washing procedure. In addition, the charge transfer resistance RCT and the contact resistance RCont. between the anode and the current collector can be extracted according to the model from Landesfeind et al. 46 In the anode EIS measurement, two semi-circles representing these overlapping resistances can be seen. By fitting two semi-circles to the anode spectrum, the according values can be defined. RCont. is exceptionally high at 109 Ω, which could be due to the existing primer in the anode or due to the fact that PTFE is not stable at this anode potential and therefore the anode lost mechanical and electrical integrity during handling. 47,48 This can also lead to higher overpotentials, as visible in Fig. 11a. In addition, RCT is remarkably high with a value of 32.2 Ω, which can be explained through the aging of the cell prior to teardown. 49 Despite the utmost care, the washing and delamination processes cannot be excluded from influencing the T-cell measurements. Due to the high resistance values and the complex washing process, the transferability of the results of the impedance measurements from T-cells to full cells is only possible to a limited extent. One approach to determine the half-cell impedance with as little intervention as possible would be to insert a reference electrode without prior disassembly. 50
Electrical cell-level characterization
The results of the electrically characterized cells are presented below, categorized by the measurement methodology.
Capacity and impedance
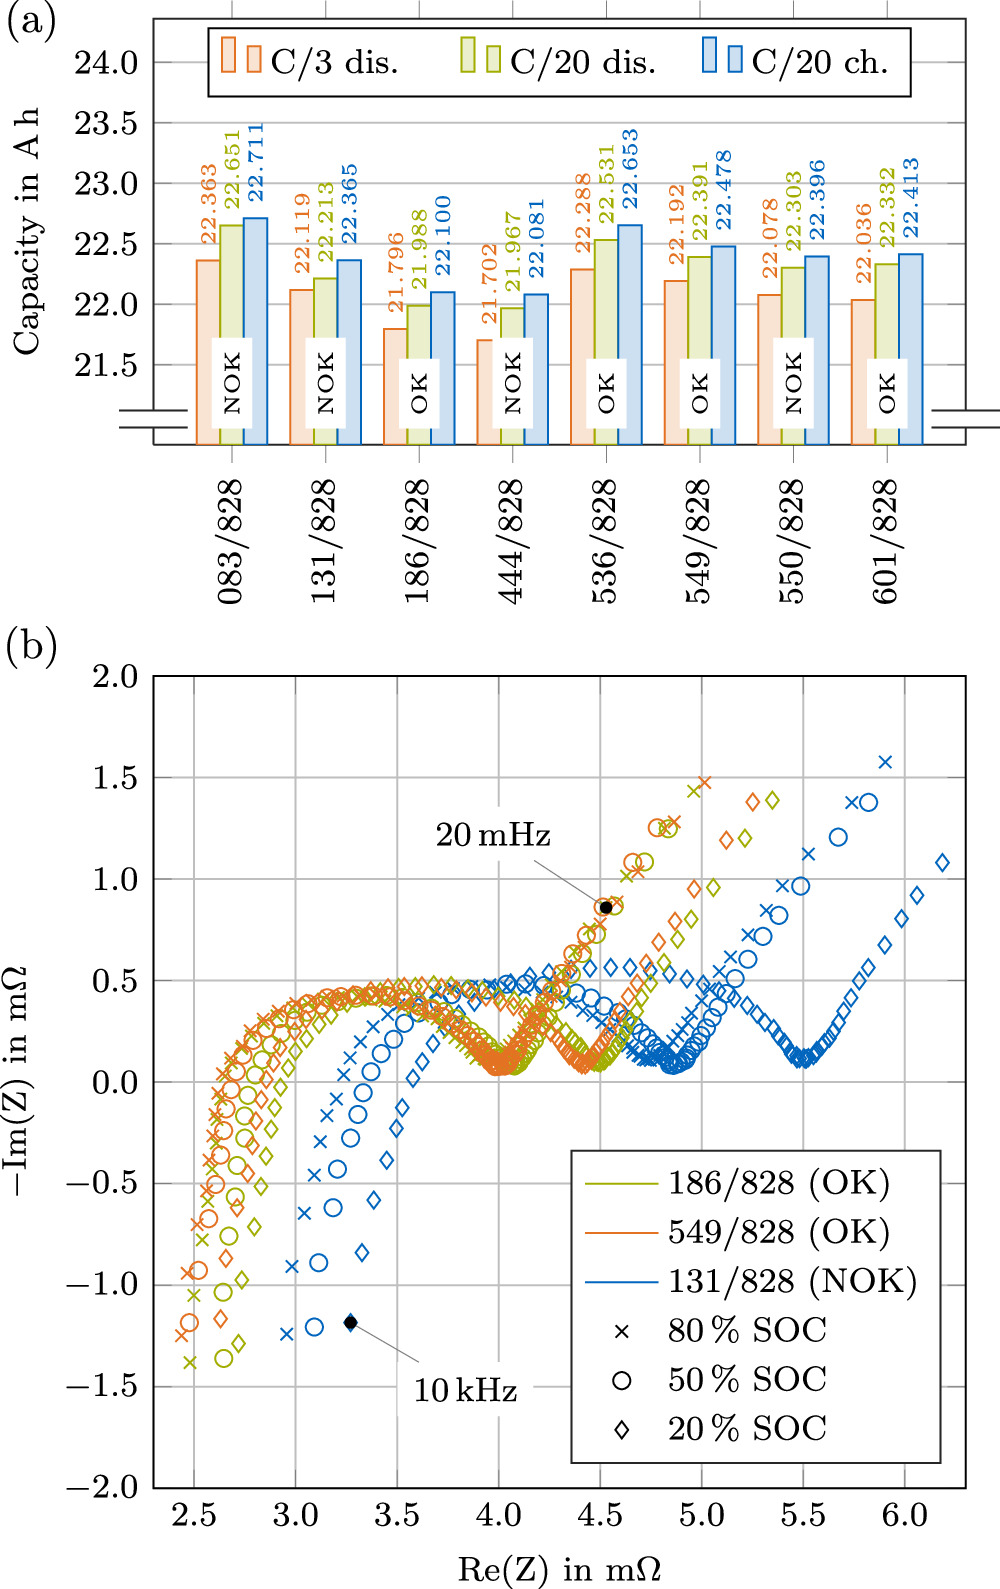
The capacities of the individually measured full cells at different C-rates are shown in Fig. 12a. A mean value of 22.078 Ah with a standard deviation of σ = 186.2 mAh is obtained at a C-rate of C/3 in the discharge direction among the cells considered to be OK (Fig. 1). At C/20, mean capacities of 22.411 Ah (σ = 199.9 mAh) in the charging direction and 22.311 Ah (σ = 199.7 mAh) in the discharging direction are obtained among the measured cells labeled as OK. The depicted NOK cells vary more in all capacity measurements (standard deviations of 236.5 mAh at C/3, 245.2 mAh at C/20 discharge and 223.1 mAh at C/20 charge), but do not show pronounced abnormalities in the overall values.

Figure 12. Electrical properties of the measured cells. (a) Measured capacity values at C/3 (discharge) and C/20 (charge and discharge) with cell condition specified from Fig. 1; (b) Impedance spectra at a constant 25°C ± 0.2°C at 80 % SOC, 50 % SOC and 20 % SOC of cells with ID 131/828, 186/828 and 549/828. The frequencies were sampled identically for all measurements.
Download figure:
Standard image High-resolution imageBased on the volumetric cell data of the cell with ID 083/828 (as shown above), a mean cell voltage of 3.7 V, the capacity value from the C/3 discharge test and a measured weight of 355.9 g (residual foam on the cell was removed), energy densities of 622.4 Wh/L and 232.5 Wh/kg are calculated. The comparatively low energy density values compared to cylindrical cells of smaller formats optimized over several years (see 8,38 ), indicate a conservative design of this first-generation 4680 cells, still awaiting optimizations in e.g. electrode chemistry, cell architecture and package structure. A calculated dead volume of 16.7 cm3 (approx. 13.3 %; comprising the cell-internal contacting) of the internal volume, the measured wall thickness and the conventional cell chemistry (as shown above) underline this assumption. However, note that the cells are used in a so-called "structural battery" and could therefore be a structural component in the battery system, requiring a more robust design compared to conventional cylindrical cells. In addition, the tabless design is apparently not trimmed for energy density, but rather for power capability.
The impedance spectra of three cells (ID 131/828, 186/828, 549/828) are shown superimposed in Fig. 12b at three different SOC levels. The impedance trend of all three investigated cells with decreasing SOC is in good agreement with published literature 51–54 —with a shift in the positive Re(Z) direction with decreasing SOC and an increase of the dominant semi-circle especially at 20 % SOC. The shift of the Nyquist plot in the positive Re(Z) direction of the cell with ID 131/828—equivalent to a higher internal resistance of the cell—might be the result of internal damages impeding electron and ion transportation. 55 The visible dent in the upper part of the casing (therefore classified as NOK in Fig. 1) reinforces this hypothesis. The calculated parameters of a simple equivalent circuit model (ECM) (R0, R1, C1) fitted to the three measured cells behavior are provided in the supplementary material.
Pseudo OCV, DVA and ICA
The C/20 pOCV curve of one cell (ID 536/828) in the charging direction is presented in Fig. 13a. The cell could be charged with 22.65 Ah before the upper cutoff voltage condition of 4.2 V was met. No constant voltage (CV) phase was applied.
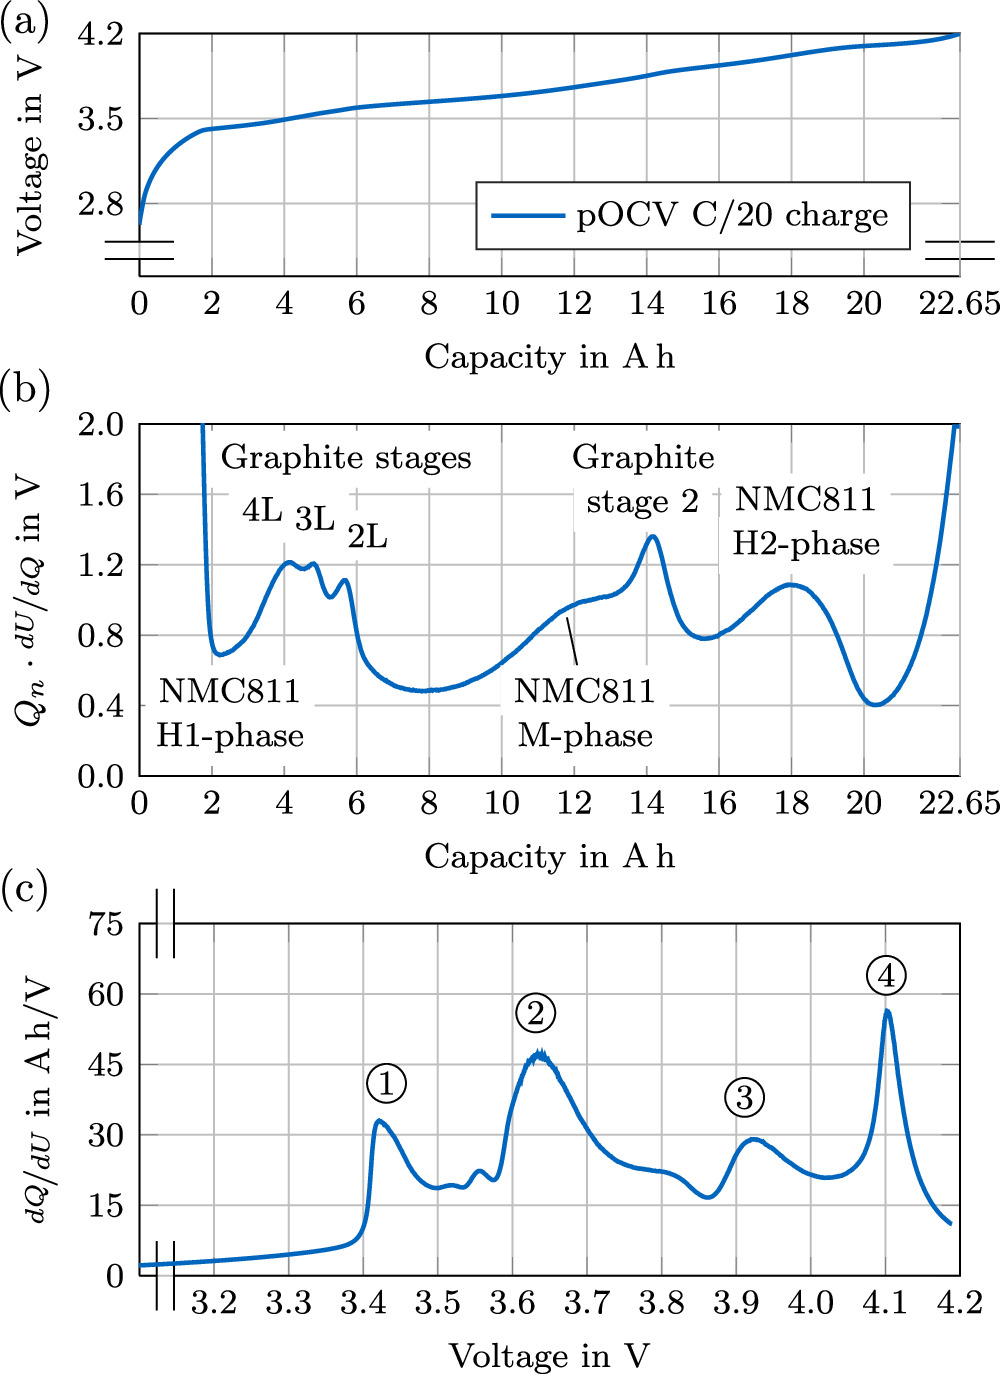
Figure 13. pOCV, DVA and ICA investigations of one cell (ID 536/828). (a) C/20 pOCV measurement in charging direction; (b) Derived DVA normalized by the nominal capacity; (c) ICA.
Download figure:
Standard image High-resolution imageThe calculated DVA is presented in Fig. 13b, with the corresponding ICA plotted in Fig. 13c. By investigating the half-cell data shown above, the inheritance of most of the peaks can unambiguously be assigned to either the cathode or anode. This enables more conclusive insights of the underlying electrode compositions. On the anode side the closely spaced local maxima in the low SOC area are distinct for graphite anodes, respectively resembling LiC24 in the liquid-like (L) lithiation stages 4L, 3L and 2L, which are assumed to have no in-plane order. 56 Hereby, the number represents empty graphene layers, between two full layers. The peak at around 14 Ah depicts a graphite stage 2 peak with a phase transition from LiC12 to LiC6 composition and in-plane order. 56–60 There is no evidence for the characteristic silicon peak in the low SOC area 61 in accordance with the findings from the anode half cell potential (see Fig. 11). For the cathode, the local minima in the low SOC area presumably depicts the H1-phase, the saddle point (at around 12 Ah) the monolithic M-phase and the local maximum at around 18 Ah the H2-phase of a NMC811 cell chemistry. 60,62,63
The ICA is defined as the inverse of the DVA and is plotted against the voltage. The same filtering configuration was applied to the ICA as for the DVA. Following Jung et al., 63 the phase transitions can be interpreted as follows: Peak ① defines the transition in the anode from C6 → LiCx , peak ② the transition from H1 → M and peak ③ from M → H2. Strong evidence for an assumed NMC811 in the cathode can be given due to peak ④, which only occurs in this cell chemistry, showing the phase-transitions from H2 → H3. 63
In summary, the peaks in the DVA and ICA of the cell propose a NMC811 chemistry at the cathode and pure graphite without any silicone in the anode. This is in accordance with the material characterization shown above.
HPPC
The resulting resistances of one cell (ID 186/828) as calculated according to Ohm's law are shown in Fig. 14. Similarly to other battery cells, a characteristic SOC dependency can be observed, showing increases in the low SOC region, as well as an SOC region between 50 % and 70 %, which coincides with the graphite stage transitions as seen in Fig. 13. 64,65 Only a small dependency of the resistance on the C-rate can be observed, leading to decreasing values for higher currents in charge and discharge direction. This matches previous observations, except for the low SOC region in discharge direction, which shows increasing resistances for higher C-rates. 64 While previous literature has seldom examined the impact of current rate on battery impedance, the relationship is most likely driven by the nonlinear behavior of the charge transfer reaction. 66 Previous cell teardown analyses indicate this effect being especially pronounced in low SOC regions. 67

Figure 14. Pulse resistances (evaluated in 10 s pulses) of one cell (ID 186/828) at different C-rates and SOCs in charge and discharge direction.
Download figure:
Standard image High-resolution imageThermal cell-level investigation
The measurement points extracted from the thermal imaging data used to evaluate the temperature spread at the cell can during the charging process are depicted in Fig. 15, while Fig. 16a shows the applied charging and discharging profiles.

Figure 15. Extraction of the temperatures at the cap, center and bottom of the cell can from the thermal imaging data.
Download figure:
Standard image High-resolution imageFrom the analysis of the overvoltages, the irreversible losses during 2C charging can be calculated up to 15 W (low SOC region) as a function of SOC and cell temperature. As can be seen in Fig. 16b, this leads to an average surface temperature of the cell (ID 536/828) of ∼70 °C for 2C charging at a climate chamber temperature of 25 °C. In comparison with data from literature, the Samsung INR21700-50E or LG INR18650-MJ1 reach surface temperatures of only around 42 °C during a 2C discharge in a climate chamber at 22 °C, while the latter reaches an inside temperature of 57.6 °C. 8 This clearly shows the challenge of cooling large-format cylindrical cells due to the lower surface-to-volume ratio.

Figure 16. Heat generation of the cell (ID 536/828) during 1C and 2C CC charges at a constant ambient temperature of 25 °C. (a) Current profile; (b) Absolute temperatures at the cap, center and bottom of the cell can; (c) Temperature gradient between Tcap and Tbottom . Temperature values during discharges are hidden. The data was filtered with moving-average filter, unfiltered data is displayed in gray in the background.
Download figure:
Standard image High-resolution image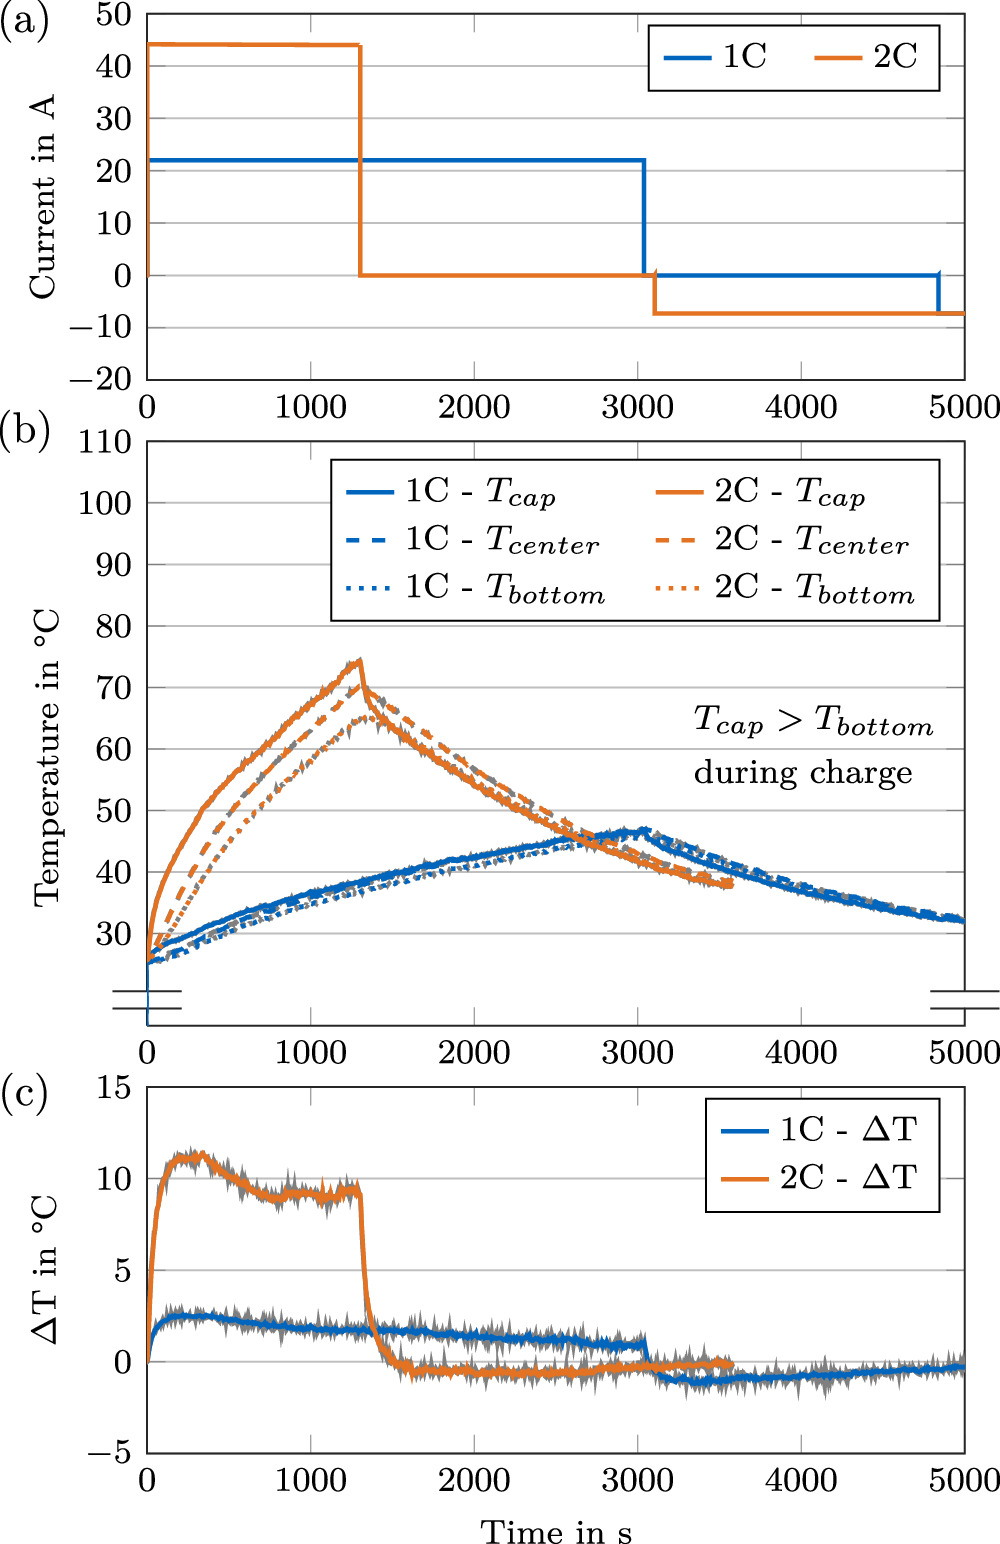
As shown in Fig. 16c, a temperature gradient of about 10 K between Tcap and Tbottom is observed in axial direction at a charge rate of 2C. This could be caused by the one-sided electrical contacting of both the anode and the cathode on the cap. Wassiliadis et al. 68 showed that the electrical contact resistance of the cell holder can generate a significant heat input, particularly at high currents. For example, an assumed contact resistance of 0.5 mΩ per terminal at a current of 44 A would result in an ohmic power loss of approx. 2 W. These contact resistances may be lower in the vehicle depending on the selected welding process, but due to the one-sided contacting they can provide a significant heat input and thus lead to an inhomogeneous current distribution in the cell's axial direction.
Conclusions
This characterization study comprehensively examines the first-generation Tesla 4680 cylindrical lithium-ion cells from a state-of-the-art Tesla Model Y both at the cell level using electrical and thermal investigations and at the component level by means of a cell teardown to address the dearth of transparency in automotive lithium-ion cell development and production. Several cells were electrically characterized using pOCV, EIS and HPPC methods. One of the cells was studied with respect to its temperature development during charging rates of up to 2C. Additionally, one cell was subjected to a complex cell teardown involving the determination of the material composition using SEM and EDX, the analysis of the cell architecture and the subsequent evaluation of three-electrode cells. The key findings in the respective domains can be summarized as follows:
Cell teardown: The anode and cathode disks of hexagonal symmetry of the tabless design can act like compensating elements or springs when connecting the jelly roll with the housing. The thickness of the casing is high in comparison to conventional cylindrical cells, which are not used as a structural component. The electrode winding consists of a double-sided coated cathode and anode as well as two separators, while no mandrel is present in the cell core. The electrode loadings remain almost constant across the electrodes, but the electrode thickness varies. Spherical active material particles were found for the cathode side, while the anode consists of flake graphite particles. EDX confirms the exclusive use of graphite as the active material, with no detectable presence of silicon. The utilization of PTFE could indicate a solvent-free anode fabrication method, while the primer between the coating and the copper collector coating strongly suggests the utilization of a solvent-free coating process. The three-electrode analysis reveals characteristic potentials for the identified cell chemistry and a full cell impedance spectra dominated by the anode.
Characterization at cell level: Using data of one cell, energy densities of 622.4 Wh/L and 232.5 Wh/kg are calculated, indicating a conservative design of this first-generation 4680 cells. The pOCV analysis (DVA and ICA) confirm a NMC811 chemistry and a pure graphite anode. HPPC measurements reveal a characteristic SOC dependency with resistance increases both in the low and mid SOC region. A relatively high surface temperature is observed during a 2C charge in a free convection setup—requiring an adequate cooling system in the battery pack assembly.
Overall, this characterization study highlights current developments regarding large-format cylindrical lithium-ion cells for electric vehicles and provides a fundamental basis for future industrial and academic research toward the optimization of lithium-ion battery performance.
Acknowledgments
This research received funding by the German Federal Ministry of Education and Research (BMBF) within the projects "OptiPro" under grant number 03XP0364B as part of the competence cluster "InZePro" and "TUBE" under grant number 03XP0425. Furthermore, this work was partly funded by the Bavarian Ministry of Economic Affairs, Regional Development and Energy within the project "charge.COM" under the grant number DIK-0262/02 and by the German Federal Ministry for Economic Affairs and Climate Action (BMWK) within the project "ultraBatt" under grant number 01MV21015D. We would like to thank Jannis Wachter for support with the measurements at the Institute for Machine Tools and Industrial Management. Furthermore, we would like to thank Florian Biechl and the staff of the electric lab of the Institute of Automotive Technology for their support.
Appendix:: Test Procedures
The test protocols for the T-cells, the electrical characterization and the thermal investigation are provided in Tables A·I to A·V.
Table A·I. Activation and test protocol of the T-cells.
| # | Command | Parameter | Skip crit. | Registration |
|---|---|---|---|---|
| 1 | Pause | — | t > 1800 s | t = 10 s |
| 2 | Charge | CC @ C/10 | U > 4.2 V | t = 10 s |
| 3 | Discharge | CC @ C/10 | U < 2.9 V | t = 10 s |
| 4 | Loop | to # 2 | 2 times | |
| 5 | Charge | CC @ C/50 | U > 4.2 V | t = 32 s |
| 6 | Discharge | CC @ C/50 | U < 2.9 V | t = 32 s |
| 7 | Charge | CC @ C/10 | t > 5 h | t = 16 s |
| 8 | EIS | 100 kHz–100 mHz, 10 mV excitation ∪ | ||
| 9 | Charge | CC @ C/10 | U > 4.2 V | t = 16 s |
| 10 | Discharge | CC @ C/10 | U < 2.9 V | t = 16 s |
C-rates are based on a specific capacity of 4.9 mAh/cm2 ∪ galvanostatic EIS, 6 ppd, 3 amf
Table A·II. Hybrid pulse power characterization test protocol.
| # | Command | Parameter | Skip crit. | Registration |
|---|---|---|---|---|
| Start of protocol in discharged state of the cell | ||||
| 1 | Pause | — | t > 3600 s | t = 10 s |
| 2 | Charge | CC @ C/3 | Q > 0.1C | t = 30 s∪ |
| 3 | Pause | — | t > 3600 s | t = 10 s |
| 4 | Set | Qpulse = 0 | ||
| 5 | Pause | — | t > 5 s | t = 20 ms |
| 6 | Charge | CC @ C/2 | t > 10 s | t = 20 ms |
| 7 | Pause | — | t > 300 s | t = 20 ms |
| 8 | Discharge | CC @ C/3 | Q > Qpulse | t = 10 s |
| 9 | Pause | — | t > 3600 s | t = 10 s |
| 10 | Set | Qpulse = 0 | ||
| 11 | Pause | — | t > 5 s | t = 20 ms |
| 12 | Discharge | CC @ C/2 | t > 10 s | t = 20 ms |
| 13 | Pause | — | t > 300 s | t = 20 ms |
| 14 | Charge | CC @ C/3 | Q > Qpulse | t = 10 s |
| 15 | Pause | — | t > 3600 s | t = 10 s |
| 16 | Set | Qpulse = 0 | ||
| 17 | Pause | — | t > 5 s | t = 20 ms |
| 18 | Charge | CC @ 1C | t > 10 s | t = 20 ms |
| 19 | Pause | — | t > 300 s | t = 20 ms |
| 20 | Discharge | CC @ C/3 | Q > Qpulse | t = 10 s |
| 21 | Pause | — | t > 3600 s | t = 10 s |
| 22 | Set | Qpulse = 0 | ||
| 23 | Pause | — | t > 5 s | t = 20 ms |
| 24 | Discharge | CC @ 1C | t > 10 s | t = 20 ms |
| 25 | Pause | — | t > 300 s | t = 20 ms |
| 26 | Charge | CC @ C/3 | Q > Qpulse | t = 10 s |
| 27 | Pause | — | t > 3600 s | t = 10 s |
| 28 | Set | Qpulse = 0 | ||
| 29 | Pause | — | t > 5 s | t = 20 ms |
| 30 | Charge | CC @ 1.5C | t > 10 s | t = 20 ms |
| 31 | Pause | — | t > 300 s | t = 20 ms |
| 32 | Discharge | CC @ C/3 | Q > Qpulse | t = 10 s |
| 33 | Pause | — | t > 3600 s | t = 10 s |
| 34 | Set | Qpulse = 0 | ||
| 35 | Pause | — | t > 5 s | t = 20 ms |
| 36 | Discharge | CC @ 1.5C | t > 10 s | t = 20 ms |
| 37 | Pause | — | t > 300 s | t = 20 ms |
| 38 | Charge | CC @ C/3 | Q > Qpulse | t = 10 s |
| 39 | Pause | — | t > 3600 s | t = 10 s |
| 40 | Set | Qpulse = 0 | ||
| 41 | Charge | CC @ C/3∩ | Q > 0.1C | t = 30 s∪ |
| 42 | Pause | — | t > 3600 s | |
| 43 | Loop | to # 4 | 9 times | |
C-rates are based on a nominal capacity of 22 Ah ∪ and U = 5 mV
∩ and CV @ 4.2 V with I < C/20 if U = 4.2 V reached
Table A·III. Capacity determination test protocol.
| # | Command | Parameter | Skip crit. | Registration |
|---|---|---|---|---|
| Start of protocol in fully charged state of the cell | ||||
| 1 | Pause | — | t > 1800 s∩ | t = 1 s |
| 2 | Discharge | CC @ C/20 | U < 2.5 V | t = 1 s∪ |
| 3 | Pause | — | t > 1800 s∩ | t = 1 s |
| 4 | Charge | CC @ C/20 | U > 4.2 V | t = 1 s∪ |
| 5 | Pause | — | t > 1800 s∩ | t = 1 s |
| 6 | Discharge | CC @ C/3 | U < 2.5 V | t = 1 s∪ |
| 7 | Discharge | CV @ 2.5 V | I < C/50 | t = 1 s∪ |
| 8 | Pause | — | t > 600 s∩ | t = 1 s |
C-rates are based on individually determined C/3 disch. cap. ∩ or alternatively ∣dU/dt∣ < 0.2 mVmin−1 ∪ and U = 2 mV
Table A·IV. Electrochemical impedance spectroscopy test protocol.
| # | Command | Parameter | Skip crit. | Registration |
|---|---|---|---|---|
| Start of protocol in fully charged state of the cell | ||||
| 1 | Pause | — | t > 600 s | t = 1 s |
| 2 | Discharge | CC @ C/3 | Q > 0.2C | t = 1 s |
| 3 | Pause | — | t > 3600 s | t = 1 s |
| 4 | EIS | 10 kHz–10 mHz, 500 mA excitation ∪ | ||
| 5 | Pause | — | t > 600 s | t = 1 s |
| 6 | Charge | CC @ C/3 | U > 4.2 V | t = 1 s |
| 7 | Charge | CV @ 4.2 V | I < C/20 | t = 1 s |
| 8 | Pause | — | t > 600 s | t = 1 s |
| 9 | Discharge | CC @ C/3 | Q > 0.5C | t = 1 s |
| 10 | Pause | — | t > 3600 s | t = 1 s |
| 11 | EIS | 10 kHz–10 mHz, 500 mA excitation ∪ | ||
| 12 | Pause | — | t > 600 s | t = 1 s |
| 13 | Charge | CC @ C/3 | U > 4.2 V | t = 1 s |
| 14 | Charge | CV @ 4.2 V | I < C/20 | t = 1 s |
| 15 | Pause | — | t > 600 s | t = 1 s |
| 16 | Discharge | CC @ C/3 | Q > 0.8C | t = 1 s |
| 17 | Pause | — | t > 3600 s | t = 1 s |
| 18 | EIS | 10 kHz–10 mHz, 500 mA excitation ∪ | ||
C-rates are based on a nominal capacity of 22 Ah ∪ galvanostatic EIS, 10 ppd, 5 amf, drift correction ∩ or alternatively ∣dU/dt∣ < 0.2 mV min−1
Table A·V. Test protocol for 1C (α = 1) and 2C (α = 2) charging investigations.
| # | Command | Parameter | Skip crit. | Registration |
|---|---|---|---|---|
| Start of protocol in discharged state of the cell | ||||
| 1 | Pause | — | t > 3 h | t = 10 s |
| 2 | Charge | CC @ αC | U > 4.2 V | t = 30 s∪ |
| 3 | Pause | — | t > 1800 s | t = 10 s∩ |
| 4 | Discharge | CC @ C/3 | U < 2.5 V | t = 30 s∪ |
| 5 | Discharge | CV @ 2.5 V | I < C/20 | t = 30 s∪ |
| 6 | Pause | — | t > 3600 s | t = 10 s |
C-rates are based on a nominal capacity of 22 Ah
∪ and U = 5 mV; ∩ and U = 2 mV
: Authors' Contributions
Manuel Ank: Conceptualization, Methodology, Formal analysis, Investigation, Software, Validation, Data curation, Writing—original draft, Writing—review & editing, Visualization; Alessandro Sommer: Methodology, Formal analysis, Investigation, Validation, Data curation, Writing—original draft, Writing—review & editing, Visualization; Kareem Abo Gamra: Methodology, Formal analysis, Investigation, Writing—original draft , Writing—review & editing; Jan Schöberl: Methodology, Formal analysis, Investigation, Writing—original draft , Writing—review & editing; Matthias Leeb: Methodology, Formal analysis, Investigation, Writing—original draft, Writing—review & editing, Visualization; Johannes Schachtl: Methodology, Formal analysis, Investigation, Writing—original draft, Writing—review & editing, Visualization; Noah Streidel: Methodology, Formal analysis, Investigation, Writing—original draft, Writing—review & editing, Visualization; Sandro Stock: Methodology, Formal analysis, Investigation, Writing—original draft, Writing—review & editing, Visualization;Markus Schreiber: Formal analysis, Investigation, Writing—original draft , Writing—review & editing; Philip Bilfinger: Methodology, Formal analysis, Investigation, Writing—original draft , Writing—review & editing; Christian Allgäuer: Investigation, Writing—original draft , Writing—review & editing; Philipp Rosner: Validation, Writing—review & editing; Jan Hagemeister: Methodology, Investigation, Writing—review & editing, Visualization; Matti Röle: Methodology, Investigation, Software, Validation, Writing—review & editing; Rüdiger Daub: Supervision, Resources, Writing—review & editing; Markus Lienkamp: Supervision, Resources, Writing—review & editing.
: Declaration of Competing Interest
The authors declare that they have no known competing financial interests or personal relationships that could have appeared to influence the work reported in this paper.
: Supplementary Material
Data Availability. We want to give any researcher access to our results without any limits. The raw measurement data of the cell characterization of the individual experiments, cell teardown images as well as additional SEM/EDX recordings and processing scripts are therefore provided as open source alongside the article at https://doi.org/10.14459/2023mp1725661, provided by mediaTUM.