
Abstract
A major degradation mechanism of polymer electrolyte membrane fuel cells (PEMFCs) in transportation applications is the loss of the electrochemically active surface area (ECSA) of platinum cathode catalysts upon dynamic load cycling (resulting in cathode potential cycles). This is commonly investigated by accelerated stress tests (ASTs), cycling the cell voltage under H2/N2 (anode/cathode). Here we examine the degradation of membrane electrode assemblies with Vulcan carbon supported Pt catalysts over extended square-wave voltage cycles between 0.6-1.0 VRHE at 80 °C and 30%-100% RH under either H2/N2 or H2/Air; for the latter case, differential reactant flows were used, and the lower potential limit is controlled to correspond to the high-frequency resistance corrected cell voltage, assuring comparable aging conditions. Over the course of the ASTs, changes of the ECSA, the hydrogen crossover current, the proton conduction resistance and the oxygen transport resistance of the cathode electrode, as well as the differential-flow H2/O2 and H2/Air performance at 80 °C/100% RH were monitored. While the ECSA loss decreases with decreasing RH, it is independent of the gas feeds. Furthermore, the H2/Air performance loss only depends on the ECSA loss. ASTs under H2/N2 versus H2/Air only differ with regards to the chemical/mechanical degradation of the membrane.
Export citation and abstract BibTeX RIS

This is an open access article distributed under the terms of the Creative Commons Attribution Non-Commercial No Derivatives 4.0 License (CC BY-NC-ND, http://creativecommons.org/licenses/by-nc-nd/4.0/), which permits non-commercial reuse, distribution, and reproduction in any medium, provided the original work is not changed in any way and is properly cited. For permission for commercial reuse, please email: permissions@ioppublishing.org.
During the last decades, durability has been a main focus in polymer electrolyte membrane fuel cell (PEMFC) research, leading to a substantially increased PEMFC system lifetime, particularly by devising improved control strategies which reduce MEA degradation phenomena (e.g., significantly reducing the number of unmitigated start/stop events and avoiding high cathode potentials via powertrain hybridization). Due to the generally demanded extensive power transients for automotive applications, load cycling (i.e., transitions between low and high power) induced degradation of the cathode catalyst strongly affects PEMFC durability. It is now widely accepted that the associated loss of the electrochemically active surface area (ECSA) of platinum-based, carbon-supported cathode catalysts (Pt/C or Pt-alloy/C) is one of the main degradation mechanism. To compensate for load cycling induced Pt ECSA losses over time, larger platinum loadings of the PEMFC cathode could be used, which, however, would lead to larger costs. For this reason, the effect of PEMFC operating conditions on Pt ECSA loss must be understood. Loss of the cathode catalyst ECSA occurs via the dissolution of Pt at high cathode potentials or during cathode potential transients, yielding mobile Pt ions that can either redeposit in the ionomer phase (particularly within the membrane), or result in Pt particle growth (Ostwald ripening) and particle coalescence. 1,2 Based on fundamental studies and PEMFC field data, the most damaging stressors associated with load cycling induced degradation have been determined, thus facilitating the study of mitigation strategies by either system design/control or catalyst material selection.
Numerous research groups have developed accelerated stress tests (ASTs) to mimic the catalyst degradation observed in load cycling, mostly represented by so-called voltage cycling tests, since the Pt ECSA loss is a potential-driven mechanism. In these, the cathode electrode of the membrane electrode assembly (MEA) is polarized in a PEMFC single-cell between an upper potential limit (UPL), aimed to resemble the cathode potential during idle or low-power operation, and a lower potential limit (LPL), aimed to resemble the cathode potential during peak power. 1,3 Alternatively, the voltage cycling degradation of PEMFC catalysts has also been studied extensively by rotating disk electrode (RDE) measurements 4 as well as by using an electrochemical scanning flow cell (SFC) coupled to an ICP-MS. 5,6 However, while these tests conducted in liquid acidic electrolytes provide valuable insights into catalyst durability particularly when conducted at PEMFC relevant temperatures, 7 the transport conditions in an actual MEA are different from those in the thin-film catalyst layers used for RDE or flow cell experiments, so that MEA based measurements are generally considered to more closely represent PEMFC system field data. 8
In MEAs, voltage cycling ASTs are most commonly conducted with H2/N2 feeds (at anode/cathode),
9
whereby the cathode potential (Ecath) is essentially identical with the cell voltage (Ecell), since the potential of the Pt/C based H2 anode remains at the reversible hydrogen electrode reference potential (RHE) due to its fast hydrogen oxidation/evolution kinetics
10
and since ohmic resistances are negligible at the small current densities during H2/N2 voltage cycling. This way, the cathode potential can be cycled between selected UPL and LPL values by cycling the H2/N2 cell voltage between these limits at a given cell temperature and relative humidity (RH) of the H2/N2 feeds. On the other hand, system relevant load cycling experiments with H2/Air feeds are commonly employed (i.e., cycling between high current density and either open circuit voltage (OCV) or a very low current density), as they can be conducted also with short-stacks containing multiple cells.
11
In this case, however, the actual cathode potential at the high current density is not identical with the measured cell voltage, owing to the significant ohmic resistance, so that the effective cathode electrode LPL is higher than the cell voltage (note that the H2 anode potential nevertheless corresponds to 0 V versus RHE due to its negligible kinetic overpotential even at 3.0  ).
12
Compared to voltage cycling under H2/N2, the high current density operation during load cycling under H2/Air may result in an anisotropic current distribution across the MEA (along the flow-field and also across the cathode electrode), and the fluctuation of the relative humidity at the membrane when switching between high and low current density can result in an accelerated mechanical degradation of the membrane. Furthermore, the chemical degradation of the ionomer may become significant for a H2/Air based AST, which is not the case for an AST with H2/N2 feeds.
13
Because of these considerations, the experimental parameters are more well-defined for H2/N2 based voltage cycling ASTs, and the upper/lower cathode potentials can be kept constant over the AST.
).
12
Compared to voltage cycling under H2/N2, the high current density operation during load cycling under H2/Air may result in an anisotropic current distribution across the MEA (along the flow-field and also across the cathode electrode), and the fluctuation of the relative humidity at the membrane when switching between high and low current density can result in an accelerated mechanical degradation of the membrane. Furthermore, the chemical degradation of the ionomer may become significant for a H2/Air based AST, which is not the case for an AST with H2/N2 feeds.
13
Because of these considerations, the experimental parameters are more well-defined for H2/N2 based voltage cycling ASTs, and the upper/lower cathode potentials can be kept constant over the AST.
Among the plethora of studies that examine the voltage cycling based H2/Air performance loss of MEAs, 1,14,15 a recent study by Ahluwalia et al. 16 sheds light into the effect of the various stressors on the ECSA loss. Here, MEAs with a PtCo/C cathode catalyst were subjected to voltage cycling in a single-cell PEMFC, studying the effect of the UPL, the relative humidity, and the cell temperature. Consistent with previous work, 15,17,18 the ECSA degradation rate increased with increasing UPL, RH, and temperature, whereby the UPL is shown as the most detrimental stressor. For voltage cycling ASTs conducted under H2/Air with a Pt/C cathode catalyst and additionally examining the effect of the LPL, Kneer et al. 15 reported similar findings and furthermore suggested that the loss of ECSA follows a first order kinetic model. In their study, where the voltage was cycled between 0.6 V and OCV, they observed that the OCV would decrease over the course of their voltage cycling AST, so that the UPL is not constant over the AST; as the UPL very strongly affects the ECSA loss, the decrease in the OCV must be taken into consideration in the interpretation of the data. They also observed that the high frequency resistance (RHFR) of the cell decreased by only ∼10% between beginning-of-test (BOT) and end-of-test (EOT), while the current density (igeo) at the LPL of the cell voltage decreased significantly between BOT and EOT. This implies that the cathode potential at the LPL significantly decreases over the course of their H2/Air voltage cycling AST (based on Ecath ≈ Ecell + igeo · RHFR; see Eq. 1). Therefore, when trying to compare results from voltage cycling AST conducted either with H2/N2 or H2/Air, the following must be considered: a) to assure similar cathode potentials at the LPL, the LPL cell voltage needs to be corrected by igeo · RHFR, i.e., the LPL cell voltage must be adapted over the course of the AST; b) for H2/Air voltage cycling, it is preferable to use a fixed UPL value, rather than the OCV; c) performance degradation due to the chemical and mechanical degradation of the ionomer/membrane is likely to occur during H2/Air voltage cycling, while it should be negligible in H2/N2 voltage cycling.
In this study, we conducted H2/N2 and H2/Air voltage cycling ASTs with Pt/V (Pt on Vulcan carbon) based MEAs at different relative humidities, tested in a 5 cm2 single-cell PEMFC setup. A square-wave voltage profile was applied with an UPL of 1.0 VRHE and an LPL of 0.6 VRHE, whereby in the case of H2/Air voltage cycling the UPL and LPL were corrected by the ohmic potential drop (i.e., by igeo · RHFR) using an iR-compensation mode. We will compare the H2/N2 and H2/Air voltage cycling induced degradation of the ECSA, of the ORR mass activity, of the proton conduction and the oxygen mass transport resistance of the cathode electrode, of the hydrogen crossover through the membrane, as well as of the differential-flow H2/O2 and H2/Air performance. The ECSA was determined by cyclic voltammetry and CO-stripping voltammetry, while the mass activity was determined from H2/O2 polarization curves using a Tafel analysis. SEM cross-sectional images of EOT MEAs were analyzed to investigate the possible thinning of the cathode electrode (due to carbon corrosion) and membrane thinning (due to chemical degradation). Finally, we will compare the H2/Air performance degradation as a function of the electrode roughness factor (rf; in units of  ) MEAs subjected to voltage cycling ASTs conducted with differently humidified H2/N2 or H2/Air feeds.
Experimental
Experimental details on MEA preparation and fuel cell diagnostics/testing can be found in a previous publication from our group, 17 but the most pertinent information is given in the following.
MEA preparation
The here used 5 cm2 MEAs were prepared via the decal transfer method. Cathode catalyst inks were made by mixing the 47.8 wt% Pt/C catalyst (TEC10V50E, Tanaka Kikinzoku Kogyo K.K.) with a 700 EW perfluorosulfonic acid (PFSA) ionomer (24.5 wt% ionomer in water, Asahi Kasei, Japan), ultra-pure water, and 1−propanol; anode catalyst inks were prepared analogously but using a 19.8 wt% Pt/C catalyst (TEC10V20E, Tanaka Kikinzoku Kogyo K.K., Japan). The as-prepared inks had a water content of ∼12 wt%, a carbon content of 30 mgC mL−1
ink, and an ionomer to carbon weight ratio (I/C) of 0.65. The inks were added to a 15 ml HDPE bottle filled with 25.5 g of 5 mm ZrO2 beads (Glenn Mills, USA) as grinding medium, and then placed onto a roller mill (60 rpm) for 18 h at room temperature. Afterwards, the inks were coated onto virgin PTFE sheets using a Meyer rod and after drying at room temperature, 5 cm2 electrode decals were cut. MEAs were prepared by sandwiching a 15 μm reinforced PFSA membrane (700 EW, Asahi Kasei, Japan) between an anode and a cathode decal, and further hot-pressing this assembly at 155 °C for 5 min. The catalyst loadings were determined by weighing the decal before and after decal transfer; by considering the Pt content of the catalysts and the electrode's I/C ratio of 0.65, the resulting anode/cathode loadings are 0.1/0.4  (with a maximum loading variation of ±10%).
Hardware and cell assembly
All fuel cell testing was performed with a fully automatized, custom-made G60 test station (Greenlight Innovation Corp., Canada), equipped with a Gamry 3000 potentiostat and a Gamry 30 K booster (Gamry Instruments, USA) for electrochemical impedance measurements (EIS) and voltage cycling experiments. The MEAs were sandwiched between commercial gas diffusion layers (GDLs) with a microporous layer (MPL) and a total nominal thickness of 170 μm (H14C7 from Freudenberg Performance Materials GmbH & Co. Kg, Germany), and then assembled in between custom-made 5 cm2 active area graphite flow-fields (Poco Graphite, USA) with 7 parallel channels arranged in one serpentine (0.5 mm land/channel width and 0.8 mm channel depth; for details see Ref. 19). In the final cell assembly, the GDLs were compressed by 20 ± 1% of their initial thickness using PTFE-coated fiber glass hard-stop gaskets (experimentally shown to have a maximum compression of 7% 20 ), applying a torque of 12 Nm to the bolts in the endplates (Fuel Cell Technologies, USA). Cells were connected to the test station with anode and cathode in counter-flow configuration.
Fuel cell characterization and testing procedures
The MEA testing sequence is depicted in Fig. 1. It starts with a voltage-controlled activation procedure under H2/Air (1394/3323 nccm, referenced to 0 °C/1 atm) at 80 °C/100% RH and 150 kPaabs (all cell pressures are given as absolute pressure at the cell inlet), conducting the following sequence 10 times: 45 min at 0.6 V, 5 min at 0.95 V, and 10 min at 0.85 V. Subsequently, a recovery step with H2/Air at 0.3 V for 2 h (40 °C/100% RH, 270 kPaabs) was conducted, followed by a series of diagnostics tests (cyclic voltammetry, CO-stripping voltammetry, H2 crossover measurements), a quantification of the proton conduction resistance in the cathode electrode RH+, cath), differential-flow polarization curves with H2/O2, H2/Air, and H2/10% O2 (rest N2), as well as cathode oxygen transport resistance measurements (via the limiting current density method). Parts of this sequence are repeated after each segment of the voltage cycling AST (i.e., after 100, 1k, 3k, 10k, 20k, and 30k cycles): (i) black boxes indicate the measurements that were conducted at BOT, after each AST segment, and at EOT (30k cycles), except for the activation that is only done when starting with a fresh MEA; (ii) yellow boxes indicate measurements conducted at BOT, after 10k and 20k cycles, and at EOT; (iii) the red box indicates measurements that were only conducted at BOT and EOT. The recovery step was performed prior to each AST diagnostic to eliminate all possible sources of reversible losses (e.g., membrane dry-out).

Figure 1. Experimental testing sequence for MEA diagnostic/performance measurements and the voltage cycling AST. The latter is divided into different voltage cycling segments, after 100, 1k, 3k, 10k, 20k, and 30k (≡ EOT) cumulative cycles. The differently colored boxes indicate the AST segments after which these measurements were conducted: black boxes: at BOT, after each AST segment, and at EOT (except for the activation, which was only done with a fresh MEA); yellow boxes: at BOT, after 10k and 20k cycles, and at EOT (30k); red box: only at BOT and EOT.
Download figure:
Standard image High-resolution imageCyclic voltammograms (CVs) of the cathode electrode to determine the H-adsorption/desorption charge were recorded at a scan rate of 150 mV s−1 between 0.05-0.95 VRHE at 40 °C and ambient pressure (3 cycles), whereby the Pt ECSA was evaluated from the last of 3 subsequent CVs conducted between 0.05-0.55 VRHE, averaging the H-adsorption/desorption charge and converting it into a Pt surface area using a specific charge of 210 μC cm−2 Pt. For the CVs, the anode was fed with 200 nccm of fully humidified 5% H2 (rest N2) in order to minimize the effect of crossover H2, and the cathode was fed with 5 nccm of dry N2.
CO-stripping voltammograms were recorded at 40 °C and 150 kPaabs as described previously. 17 Initially, the cathode was fed with 100 nccm of dry 10% CO (rest N2) while polarizing it to 0.1 VRHE; the anode was fed with fully humidified 5% H2 (rest N2) to minimize H2 crossover, which has been shown to add significant experimental artifacts to the data. 21 This was followed by a ∼1.5 h N2 purge of the cathode (ramping between low and high flows and fully humidified conditions) to remove any residual CO; after this, the cathode potential was scanned to 0.95 VRHE at 100 mV s−1, followed by three subsequent scans (between 0.07 and 0.95 VRHE) which were used as a baseline and to verify that the adsorbed CO had been completely oxidized. The integration between the first anodic scan and the second one (baseline) was used to obtain the Pt ECSA at fully humidified conditions, using a specific charge of 420 μC cmPt −2.
The H2 crossover was measured as previously described in the literature. 22 The measurements were carried out at 80 °C with fully humidified H2/N2 mixtures at the anode (600 nccm) and with dry N2 (150 nccm) at the cathode, initially setting anode/cathode pressures to 170 kPaabs. Starting with 60% H2 (rest N2), the cell was left to equilibrate for 120 s; then the cell voltage was set to 0.35 V for 120 s, whereby the oxidative current due to H2 crossover was averaged over the last 30 s. This measurement sequence was repeated with four more H2 concentrations down to 10% H2 (rest N2). A linear fit of these five data points provides the H2 crossover current density at 100% H2 (from the slope) as well as the MEA shorting current density (ishort, from the y-axis intercept). As anode and cathode pressures were set to be equal, this corresponds to the diffusion-driven H2 permeation, which we will denote as iH2, diff. Repeating these experiments with the same anode pressure (i.e., 170 kPaabs) but a decreased cathode pressure of 140 kPaabs, the resulting H2 crossover current density obtained from the slope corresponds to the sum of the diffusion- and convection-driven H2 crossover current density (iH2, diff + iH2, conv). If the latter is the same as the value of iH2, diff, an increase of the H2 crossover over the course of an AST would indicate membrane thinning; on the other hand, if over the course of an AST the value of (iH2, diff + iH2, conv) becomes significantly larger than iH2, diff, this would indicate the formation of membrane pinholes.
The proton conduction resistance across the cathode electrode (RH+, cath) was determined from potentiostatic electrochemical impedance spectroscopy (PEIS) measurements recorded at 80 °C with H2 and N2 flows of 1000 nccm at anode and cathode, respectively, humidified at various RH values. The cell voltage was set to 0.2 V, and the impedance spectrum was acquired with a voltage perturbation of 3.5 mV rms, varying the frequency from either 500 kHz (operation with the Gamry 3000 potentiostat) or 300 kHz (operation with the potentiostat and the Gamry 30 K booster) and a low frequency of 0.2 Hz (recording 20 points per decade). The selected RH values were 30%, 50%, 70%, and 100%, and to ensure reproducibility three consecutive measurements were carried out at each RH; for these measurements, the cell pressure was adjusted to result in H2/N2 partial pressure of ∼220 kPa. The obtained Nyquist plots were fitted to a transmission line model (TLM) as described in the literature. 23
Differential-flow polarization curves were recorded in current-controlled mode at 80 °C/100% RH and 170 kPaabs. Constant flows of 2000 nccm of H2 on the anode were used, while 5000 nccm of either O2, air, or 10% O2 (rest N2) where used on the cathode (at this operating conditions, the maximum pressure drop across anode and cathode were 2 kPa and 22 kPa, respectively). Prior to recording a polarization curve, the cell potential was set to 0.75 V for 15 min; followed by a sequence of current-controlled steps from low to high current density. Each of the applied currents was held for 5 min, and the measured cell voltages were averaged over the last 30 s; the OCV was recorded at the end of this sequence. The ORR kinetic parameters of the cathode catalyst (namely, mass and specific activity) were determined from H2/O2 polarization curves, corrected by: (i) the ohmic resistance loss (i.e., igeo · RHFR), with RHFR obtained from galvanostatic electrochemical impedance spectroscopy (GEIS) measurements at each current step (from 100 kHz to 10 Hz, with a current perturbation of 10% of the DC current, restricted to min/max values of 0.1/3.0 A); (ii) the effective cathode proton conduction resistance ( ) according to the method presented by Neyerlin et al.,
24
with the RH+, cath value [in
) according to the method presented by Neyerlin et al.,
24
with the RH+, cath value [in  ] obtained from the above described PEIS measurements corrected by a current density-dependent utilization factor.
Limiting current density measurements were performed to quantify the O2 transport resistance ( ) in the cathode electrode, as described in the literature.
17,20,25
For this, voltage-controlled polarization curves were recorded at 80 °C/100% RH and differential flows of 2000 nccm of H2 at the anode and 5000 nccm of O2/N2 mixtures at the cathode, whereby the dry mole fraction of O2 was varied from 0.5% to 24%. Limiting current densities were determined at cell voltages of 0.3 V, 0.15 V, 0.10 V, and 0.05 V (each held for 2 min). To separate the pressure-dependent (
) in the cathode electrode, as described in the literature.
17,20,25
For this, voltage-controlled polarization curves were recorded at 80 °C/100% RH and differential flows of 2000 nccm of H2 at the anode and 5000 nccm of O2/N2 mixtures at the cathode, whereby the dry mole fraction of O2 was varied from 0.5% to 24%. Limiting current densities were determined at cell voltages of 0.3 V, 0.15 V, 0.10 V, and 0.05 V (each held for 2 min). To separate the pressure-dependent ( ) and the pressure-independent (
 ) components of
  the polarization curves were measured at 170, 270, 350,and 500 kPaabs.
20
the polarization curves were measured at 170, 270, 350,and 500 kPaabs.
20
Voltage cycling AST under H2/N2 ("H2/N2 V-cycling")
The voltage cycling experiments conducted in this work were conducted either with H2/N2 (anode/cathode) or with H2/Air (anode/cathode) flows, which will further on be referred to as H2/N2 V-cycling and H2/Air V-cycling, respectively. As only very low currents are flowing during the voltage cycling under H2/N2 (i.e., capacitive and H2 crossover currents), the applied cell voltage is essentially identical with the cathode potential measured versusthe reversible hydrogen electrode (RHE) potential, and temperature/RH are constant along (i.e., in-plane) and normal to the MEA (i.e., through-plane, across the electrode thickness). In the here applied H2/N2 V-cycling protocol, the cell voltage (and thus the cathode potential) was modulated according to a square-wave profile, with an UPL of 1.0 VRHE and a LPL of 0.6 VRHE, whereby the dwell times at each potential were set to 8 s and the potential transient was less than 0.1 s (i.e., >4 V s−1). H2/N2 flows of 200/75 nccm (anode/cathode) were used during the voltage cycling segments of the overall test procedure (see Fig. 1), with the cell being operated at ambient pressure and 80 °C, selecting different gas inlet RH values (30, 50, 70, and 100%).
Voltage cycling AST under H2/Air ("H2/Air V-cycling")
In order to compare the Pt ECSA loss and the MEA performance degradation when conducting voltage cycling experiments under either H2/N2 or H2/Air at 80 °C and a given cell RH, obviously the same voltage profile must be applied. While this is easily achieved with regards to the profile shape/duration, the question about the proper correspondence between the UPL and LPL values of the cell voltage (Ecell) versus that of the cathode potential (Ecath) must be addressed. In contrast to H2/N2 V-cycling, the current densities at the lower potential limit are orders of magnitude larger during H2/Air V-cycling, so that the cathode potential in this case is higher than the cell voltage at the LPL, to a good approximation described by the HFR-corrected cell voltage (Ecell, HFR−free), ignoring the potential drop across the cathode electrode:

Since the Pt ECSA loss during voltage cycling is a strong function of the cathode potential rather than the cell voltage, a meaningful comparison between the Pt ECSA loss over the course of H2/N2 versus H2/Air V-cycling ASTs requires that the cell voltage must be continuously adapted to maintain a constant cathode potential, particularly at the high current density at the LPL in H2/Air V-cycling. In order to achieve this, a potentiostatic electrochemical impedance spectroscopy (PEIS) analysis was carried out at the beginning and at the end of each AST sequence at the same operating conditions at which the H2/Air V-cycling was conducted, determining the RHFR value at a cell voltage of 0.6 V (with a voltage perturbation of 5 mV rms, conducted between 1-300 kHz and with 20 points per decade). From the obtained Nyquist plots, RHFR was extracted from the x-intercepts. The RHFR value obtained before starting a new AST segment, multiplied by a factor between 0.85 and 0.95 (i.e., 85% to 95% iR-compensation) was used for the positive feedback iR-compensation control mode of the Gamry potentiostat (Gamry Frameworks 3.23). This way, the lower potential limit of the cell voltage was continuously adapted, so that the desired cathode LPL of 0.6 VRHE (i.e., Ecell, HFR−free ≈ 0.6 V) could be closely maintained throughout the AST.
Using the above approach, H2/Air V-cycling ASTs at 80 °C were conducted with cathode UPL and LPL values of 1.0 VRHE and very close to 0.6 VRHE, respectively (square-wave, with 8 s at each potential, with >4 V s−1 transients), controlled via a Gamry 30 K Booster. The gas flow rates were also set to 2000 nccm of H2 and 5000 nccm of air, corresponding to a minimum stoichiometry of 18 for the largest measured current density, so that RH gradients along (in-plane) the MEA are negligible; the inlet RH values of the gas feeds were either 50, 70, or 100%.
The consequence of the iR-compensation mode on the cell voltage and the calculated HFR-free cell voltage (acc. to Eq. 1), and roughly corresponding to Ecath) for H2/Air V-cycling ASTs conducted at 100% and 70% RH are shown in Figs. 2a and 2b, respectively. Here, the green lines depict the actually applied cell voltages (Ecell) set by the iR-compensation mode, the orange lines depict the resulting current densities (igeo), and the red lines depict the calculated HFR-free cell voltage (Ecell, HFR−free) determined by Eq. 1. Clearly, the iR-compensation makes no difference in the UPL values due to the essentially zero currents. On the contrary, large variations between Ecell, HFR−free (red line, Fig. 2) and Ecell (green line, Fig. 2) are seen at LPL. However, as desired, the value of Ecell, HFR−free that roughly corresponds to Ecath remains very close to the desired cathode LPL of 0.6 VRHE at both 100% RH (within ∼10 mV, see Fig. 2a) and 70% RH (within ∼25 mV, see Fig. 2b); this difference becomes smaller towards the end of the 30k voltage cycles due to the decrease in current density over the AST. This demonstrates that the selected iR-compensation mode achieves a reasonably close agreement between the desired and the actual cathode LPL. This is critical when trying to compare H2/N2 V- versus H2/Air V-cycling, since it has been shown that an increase in the LPL leads to a decrease in the Pt ECSA loss during voltage cycling, particularly if it approaches the onset potential for platinum oxide formation (above 0.7 VRHE). 26 Furthermore, Stariha et al. have determined differences arising from a LPL value that is not constant over the course of a cycling AST under H2/Air voltage cycling AST. 27

Figure 2. Exemplary BOT (cycles 1-3) and EOT (cycles 29998-30000) voltage (left y-axes) and current density (right y-axes) profiles during H2/Air V-cycling ASTs (2000/5000 nccm H2/Air) at 80 °C and 170 kPaabs, using an iR-compensation mode to achieve a cathode UPL of 1.0 VRHE and a cathode LPL of ∼0.6 VRHE: (a) conducted at 100% RH; (b) conducted at 70% RH. The green lines depict the cell voltages (Ecell) controlled by the potentiostat, the yellow lines depict the resulting and current densities (igeo), and the red lines depict the HFR-free cell voltages (Ecell, HFR-free, calculated according to Eq. 1) which approximately correspond to the cathode potential. The RHFR values used to calculate Ecell, HFR-free were measured prior to each AST segment: at 100% RH, they were 24 (BOT) and 25 mΩ cm2 (EOT), while at the lower RH of 70% RH, they were 44 (BOT) and 45 mΩ cm2 (EOT). MEAs: 15 μm reinforced membrane with Pt loadings of 0.1/0.4  (anode/cathode).
Download figure:
Standard image High-resolution imageIn summary, using the iR-compensation mode, the LPL of the cathode electrode can be closely controlled to 0.6 VRHE (within ∼20-30 mV), so that the here conducted H2/N2 and H2/Air V-cycling ASTs have very similar cathode LPL values (owing to the negligible current at 1.0 V, the cathode UPL values are identical). In addition, the high stoichiometric flows during our H2/Air V-cycling ASTs ensure the absence of temperature and RH gradients along (in-plane) the MEA, which have previously been shown to result in inhomogeneous degradation. 28 Therefore, any differences arising between these tests would be due to differences that arise from membrane degradation and/or cyclic variations of the local temperature/RH at/across the cathode electrode.
Cross-sectional SEM imaging of MEAs
Pristine and aged MEA cross-sections were prepared with a cross section polisher (Jeol IB-19530CP, Japan). For this, the GDLs were carefully removed from the aged MEAs and small sections of an MEA were punched out and placed between two copper foils. This assembly was then milled for a total of 4 h (3 h at an acceleration voltage of 6 kV and 1 h at 4 kV) at −90 °C to reduce MEA damage and to improve spatial resolution. The SEM images were taken with a JEOL SEM (JSMIT 200, Japan) at an acceleration voltage of 15 kV with an SE (secondary electron) detector. From each MEA, two samples were taken, one at the anode inlet and one at the anode outlet, and from each sample five images were obtained. The thicknesses of the catalyst layers and of the membrane were determined using imageJ, whereby the areas of selected segments of the electrodes and the membrane were determined by integration of the images and then divided by their respective lengths, yielding an average thickness and its standard deviation. One MEA per AST was taken, together with a BOT sample that was subjected to a modified activation procedure (i.e., assembling the MEA in a cell, and then holding it at 80 °C/100% RH under 1000 nccm N2 flows anode and cathode at ambient pressure for 24 h).
Results
Pt ECSA loss over the course of H2/N2 and H2/Air V-cycling ASTs
Figure 3 shows the Pt ECSA versus the cycle number of V-cycling ASTs conducted at 80 °C as a function of inlet RH and cathode gas composition. Here, the Pt ECSA at BOT, after 10k and 20k cycles, and at EOT (30k cycles) was determined from CO-stripping voltammetry (ECSACO), while at 100, 1k, and 3k cycles the ECSA was obtained from the CV-based H-adsorption/desorption area (ECSAH-UPD) multiplied by the BOT ratio of ECSACO/ECSAH-UPD (∼1.1).

Figure 3. Cathode Pt ECSA versuscycle number for H2/N2 (solid symbols, acquired at ambient pressure) and H2/Air (open symbols, acquired at 170 kPaabs) V-cycling ASTs (square-wave with 1.0/0.6 VRHE UPL/LPL, with 8 s hold time each) conducted at 80 °C and different RH conditions (marked in the figure). The ECSA values at BOT, 10k, 20k, and 30k were determined by CO-stripping voltammetry (ECSACO); at 100, 1k, and 3k the ECSA values were obtained from CV-based H-adsorption/desorption areas (ECSAH-UPD) multiplied by the BOT ratio of ECSACO/ECSAH-UPD (∼1.1). Error bars represent the mean absolute deviation between two independent experiments. MEAs: 15 μm reinforced membrane with Pt loadings of 0.1/0.4  (anode/cathode).
Download figure:
Standard image High-resolution imageAs observed in the H2/Air V-cycling study by Kneer et al. 15 and in the H2/N2 V-cycling study by Harzer et al., 17 Fig. 3 shows an initially rather rapid ECSA loss over the early stages of the AST, amounting to ∼20% over the first 100 cycles, independent of the RH during the voltage cycling AST. This fast initial degradation is generally rationalized by considering that very small Pt nanoparticles are particularly prone to dissolution and coalescence, so that they are lost in the early stages of voltage cycling, concomitant with a loss of Pt ECSA. This is consistent with the observation by Makharia et al. 3 that heat-treated Pt/C catalysts, exhibiting larger Pt particle sizes, have a reduced ECSA loss rate when normalized to the catalyst's ECSA at BOT. In a later study by Shao-Horn et al., 14 the authors emphasized that the particle size distribution has to be considered when analyzing the voltage cycling stability of Pt/C catalysts in order to account for the effect of smaller Pt nanoparticles.
While the effect of RH is relatively minor over the first 100 cycles, over the further course of the V-cycling ASTs the ECSA loss is the stronger the higher the RH, which had also been observed in the H2/Air V-cycling experiments by Kneer et al. 15 and in the H2/N2 and H2/Air V-cycling experiments by Bi et al. 29 Consistent with the latter study and with that by Uchimura et al., 30 no differences in ECSA loss between H2/N2 and H2/Air V-cycling are observed in our study (compare open and solid symbols in Fig. 3). Here, it should be mentioned that no complete H2/Air V-cycling test could be conducted at 50% RH due to the premature formation of membrane pinholes, which we ascribe to the cyclic mechanical stress of the membrane caused by the local RH differences between the UPL (quasi zero current) and at the LPL (very high current densities, see Fig. 2) during voltage cycling under H2/Air 22 (further discussed in the next section). The identical ECSA loss when cycling under H2/N2 and H2/Air suggests that for reasonably well-controlled cathode UPL and LPL values, the current density during cycling (low in the former and high in the latter) does not play a significant role, at least as far as the ECSA loss is concerned.
As stated above, the higher ECSA retention at low RH has already been reported in several studies. 15,26,29,31 In general, the lower ECSA loss at low RH has been ascribed to two effects:
- (1)The low water activity (
 ) at low RH shifts the onset of the platinum oxide formation to higher potentials,
32
so that the change of platinum oxide coverage between a given LPL and UPL, considered to trigger platinum dissolution, is less at low RH. The effect of RH on the platinum oxide coverage in the context of voltage-cycling ASTs has been analyzed by Bi et al.,
29
who however concluded that it is minor compared to the effect of RH on platinum diffusivity.
) at low RH shifts the onset of the platinum oxide formation to higher potentials,
32
so that the change of platinum oxide coverage between a given LPL and UPL, considered to trigger platinum dissolution, is less at low RH. The effect of RH on the platinum oxide coverage in the context of voltage-cycling ASTs has been analyzed by Bi et al.,
29
who however concluded that it is minor compared to the effect of RH on platinum diffusivity. - (2)At low RH, the water content of the ionomer in the cathode catalyst layer is reduced, which substantially decreases the diffusivity of dissolved platinum ions, so that the loss of platinum into the membrane phase (via the reaction with crossover H2) is reduced. The latter leads to the well-known Pt-band formation in the membrane, which is observed after voltage cycling ASTs 1,2,29 and extended OCV holds. 33 Values for the Pt mass loss from the cathode electrode into the membrane phase over extended V-cycling at 100% RH were reported in several studies: ∼20%-25% after 10k voltage cycles (0.6-1.0 V) under H2/N2 at 80 °C (for an overall ECSA loss of ∼60%), 1 ∼15% after 30k voltage cycles (0.6-0.95 V) under H2/N2 at 80 °C (for an overall ECSA loss of ∼75%), 2 and ∼30% after 3.3k voltage cycles (0.87-1.2 V) under H2/Air at 60 °C (for an overall ECSA loss of ∼75%). 29 The latter study also examined the Pt mass loss into the membrane phase at a lower RH of 50%, where it was reduced to ∼10% (3.3k voltage cycles (0.87-1.2 V) under H2/Air at 60 °C, with an overall ECSA loss of ∼50%), indicating the importance of RH on this mechanism.
To our knowledge, there are only two publications with experimental values for the platinum diffusion coefficient (DPt) in a PFSA ionomer, namely for a Nafion® membrane equilibrated in liquid water/electrolyte at room temperature: 0.14 × 10⁻¹¹ m2 s−1 34 (measured for (PtCl6)2− ions) and 4 × 10⁻¹¹ m2 s−1 35 (determined by online mass spectrometry). As outlined in our previous work, 36 these can be used to estimate the effective Pt diffusion coefficients (DPt,eff) in the ionomer phase of the cathode electrode by considering its ionomer volume fraction of ∼20 vol% and the ∼5-fold increase of cationic diffusion coefficients from 25 to 80 °C (measured for Ce3+ and Co2+ ions), an estimate that yields similar values of (0.14-4) × 10−11 m2 s−1 (i.e., the volume fraction and the temperature gain factor roughly compensate each other). For the here used 8 s hold time (thold) at UPL/LPL, these DPt,eff values would result in a diffusion length (δ) of ∼3-18 μm (based on δ ≈ (DPt,eff × thold)0.5), which is on the same order as the cathode electrode thickness of ∼9 μm (determined from the later shown SEM cross-sections). This suggests that a significant fraction of the platinum ions released during voltage cycling at 80 °C/100% RH would in principle be able to reach the membrane phase, where they could redeposit via reaction with crossover H2. However, as Pt ions diffusing towards the membrane can also deposit within the cathode electrode on larger Pt particles on the carbon support via Ostwald ripening, only a fraction of the dissolved Pt ions are expected to reach the membrane phase where they would redeposit, as suggested by the above discussed studies, which report an overall loss of Pt into the membrane phase of only ∼15%-30% at 100% RH. 1,2,29
While there are no data on the platinum diffusion coefficient at low RH, Coms and LaLonde reported a ∼36-fold decrease of the diffusion coefficient of Ce3+ in a Nafion® NR211 membrane between the liquid water saturated membrane and the membrane at 40% RH
37
a factor which may serve as a rough estimate also for the platinum ion diffusion coefficient. Applying this factor to the above range of DPt,eff values at 80 °C/100% RH, the diffusion length of the platinum ions during the 8 s hold time would equate to δ ≈ 0.6-3 μm at 80 °C/40% RH, which indeed would indicate that the mechanism of platinum redeposition in the membrane phase would become less effective at very low RH values (no data are shown for lower RH values, but the decrease of the Ce3+ diffusion coefficient with decreasing RH becomes the stronger the lower the RH). This suggests that the significantly lower ECSA loss observed during voltage cycling at 30% RH (see blue symbols in Fig. 3) is at least in part due to the much reduced effective platinum diffusion coefficient, which substantially reduces the Pt loss into the membrane phase, in agreement with the modeling-based conclusions drawn by Bi et al.
29
That this assumption is reasonable can be seen by comparing the ECSA at EOT for V-cycling under H2/N2 at 100% RH ( ; red solid symbols) with that at 30% RH (
 ; blue solid symbols) shown in Fig. 3. If the Pt loss into the membrane phase at 100% RH would amount to ∼15%-30% as reported in the literature,
1,2,29
this would correspond to
; blue solid symbols) shown in Fig. 3. If the Pt loss into the membrane phase at 100% RH would amount to ∼15%-30% as reported in the literature,
1,2,29
this would correspond to  based on an initial ECSA of
  so that a complete suppression of Pt diffusion into the membrane phase at 30% RH would suggest an ECSA loss at 30% RH of
  which is reasonably close to the observed value of
  shown in Fig. 3. In summary, while we do not claim that the diffusion of Pt ions into the membrane phase is completely suppressed at 30% RH, this is likely a significant contribution to the substantially lower ECSA loss at 30% versus 100% RH.
One aspect to discuss in view of the data shown in Fig. 3 is the essentially identical ECSA loss for H2/N2 and H2/Air V-cycling (solid and open symbols in Fig. 3). For our experimental procedure, the cathode UPL/LPL values are identical at the UPL and very similar at the LPL, while the RH gradient along the flow-field is at most 10% during the H2/Air V-cycling due to the high reactant stoichiometry (calculated for an air stoichiometry at the highest measured current density and the pressure drop in the flow-field). However, in the case of H2/Air V-cycling, the temperature gradient between the MEA and the flow-field is significant at high current densities, and the resulting higher MEA temperature would lead to a lower RH at the MEA compared to the reactant RH in the flow-field. In fact, it has been estimated on the basis of thermal conductivity data for a similar Freudenberg GDL as used here that the MEA temperature is ∼6 °C higher than the flow-field temperature at a current density of ∼3.0  and 0.6 V;
38
this would translate into a local RH at the membrane of ∼80% RH at the LPL for the H2/Air V-cycling at 80 °C/100% RH and of 40% RH at the LPL for the H2/Air V-cycling at 80 °C/50% RH. In this case, the local RH at the membrane between UPL and LPL would vary by ∼20% in the former case (i.e., between ∼100 and ∼80% RH) and by ∼10% in the latter case (i.e., between ∼50 and ∼40% RH). While these RH fluctuations are not very large, they are the likely explanation for the perhaps slightly lower ECSA losses of the H2/Air versus the H2/N2 V-cycling ASTs, particularly for the AST conducted at 100% RH (open versus solid symbols in Fig. 3).
and 0.6 V;
38
this would translate into a local RH at the membrane of ∼80% RH at the LPL for the H2/Air V-cycling at 80 °C/100% RH and of 40% RH at the LPL for the H2/Air V-cycling at 80 °C/50% RH. In this case, the local RH at the membrane between UPL and LPL would vary by ∼20% in the former case (i.e., between ∼100 and ∼80% RH) and by ∼10% in the latter case (i.e., between ∼50 and ∼40% RH). While these RH fluctuations are not very large, they are the likely explanation for the perhaps slightly lower ECSA losses of the H2/Air versus the H2/N2 V-cycling ASTs, particularly for the AST conducted at 100% RH (open versus solid symbols in Fig. 3).
Membrane and cathode electrode ionomer degradation during H2/N2 and H2/Air V-Cycling
While the ECSA loss is essentially identical for the H2/N2 and H2/Air V-cycling ASTs, operation under H2/Air might additionally lead to the chemical degradation of the membrane and the ionomer in the cathode catalyst layer, 13 while the above discussed local RH variation at the membrane between low and high current density (at the UPL and LPL, respectively) may also lead to mechanical membrane degradation. 22 This will be examined in the following, conducting H2 crossover measurements as well as measurements of the proton conduction resistance of the cathode electrode (RH+, cath) over the course of the V-cycling ASTs.
The H2 crossover current densities were measured at two different conditions at 80 °C/100% RH: (i) at equal anode and cathode pressures of 170 kPaabs to determine the diffusion-controlled H2 crossover current density through the membrane (iH2, diff), which would increase with decreasing membrane thickness and would thus be a measure for membrane thinning due to chemical degradation (shown in Fig. 4a); (ii) at a reduced cathode pressure, so that the anode pressure is higher than the cathode pressure (170 versus 140 kPaabs, respectively; shown in Fig. 4b), which in case of membrane pinholes would lead to an increased H2 crossover current density due to an additional convection-driven H2 flux (iH2, diff + iH2, conv). For the H2/N2 V-cycling ASTs, the iH2, diff values remain constant over 30k cycles (see solid symbols in Fig. 4a) and the H2 crossover current densities also remain at the same value when the cathode pressure is reduced (data not shown), indicating that there is neither membrane thinning nor pinhole formation over the course of the H2/N2 V-cycling ASTs, irrespective of the RH condition. The same behavior is observed for the H2/Air V-cycling AST conducted at 100% RH (see open red symbols in Fig. 4a). However, for the H2/Air V-cycling ASTs conducted at 70 and 50% RH, the iH2, diff values increase substantially after 30k and 20k cycles, respectively (open yellow and green symbols in Fig. 4a), accompanied by an even stronger increase of the iH2, diff + iH2, conv values (see Fig. 4b). This suggests that in addition to a possible thinning caused by chemical degradation, the membranes have also formed pinholes at these points in the ASTs (note that in the case of significant pinhole formation, measurements at nominally identical anode and cathode pressure can also show an increased H2 crossover, even in the absence of an overall membrane thinning). This must be due to the fact that the chemical degradation of PFSA membranes strongly increases with decreasing RH, 39,40 so that the combination of chemical degradation and mechanical stress due to the above discussed local RH cycles leads to membrane pinhole formation. For this reason, the H2/Air V-cycling AST at 50% RH had to be terminated after 20k cycles due to excessive H2 crossover.

Figure 4. MEA H2 crossover measurements versus cycle number over the course of the H2/N2 (solid symbols) and H2/Air (open symbols) V-cycling ASTs shown in Fig. 3, conducted at 80 °C and different RH conditions (marked in the figure): (a) diffusive H2 crossover current densities (iH2, diff), determined at 80 °C/100% RH at equal anode and cathode pressures (170 kPaabs); (b) diffusive and convective H2 crossover current densities (iH2, diff + iH2, conv), determined at 80 °C/100% RH with a lower cathode pressure (i.e., 140 kPaabs versus 170 kPaabs on the anode). Error bars represent the mean absolute deviation between two independent experiments.
Download figure:
Standard image High-resolution imageIn order to evaluate whether there has also been any degradation of the ionomer in the cathode catalyst layer and an associated increase of its proton conduction resistance (RH+, cath) after the various V-cycling ASTs, the values of RH+, cath were determined at BOT as well as at EOT (i.e., after the 30k voltage cycles shown in Fig. 3). Figure 5 shows the RH+, cath values obtained at 80 °C/50% RH (hatched bars) and 80 °C/100% RH (solid bars). Compared to the BOT RH+, cath values under these conditions (gray bars in Fig. 5, no significant changes can be observed after 30k H2/N2 V-cycling ASTs (EOT) conducted at 30%-100% RH (colored bars, middle segment). The same can be observed for the EOT RH+, cath values after the H2/Air V-cycling ASTs, even though previous reports suggest that extended operation under H2/Air can lead to ionomer morphological changes 41 and dehydration, 42 and that dry OCV periods can induce ionomer chemical degradation. 13 Therefore, an irreversible mechanical/chemical degradation of the ionomer in the cathode catalyst layers over the course of the here conducted voltage cycling ASTs can be excluded, even though ∼65%-93% of the ECSA were lost (see Fig. 3); a constant RH+, cath over similarly large ECSA losses during H2/N2 V-cycling ASTs was also observed by Della Bella et al. 36 For the present study, however, it should be noted that the RH+, cath measurements were carried out after a recovery step (see Fig. 1), designed to recover reversible degradation effects, 43,44 which may mask the possible presence of reversible RH+, cath changes (e.g., by ionomer dehydration). Nevertheless, the data shown in Fig. 5 indicate that no irreversible losses in the cathode proton conduction resistance have occurred over the here conducted H2/N2 and H2/Air V-cycling ASTs, even under very low RH conditions.

Figure 5. Cathode catalyst layer proton transport resistances (RH+, cath) at BOT (left segment, gray bars) and at EOT (colored bars), i.e., after the H2/N2 (middle segment) and H2/Air (right segment) V-cycling ASTs shown in Fig. 3. The RH+, cath values were determined at 80 °C at either 50% RH (solid bars) or 100% RH (hatched bars). The colors of the bars mark the RH condition under which the voltage cycling ASTs were conducted (same as in Fig. 3): blue for 30% RH ASTs, green for 50% RH ASTs, orange for 70% RH ASTs, and red for 100% RH ASTs. The error bars for the BOT data represent the standard deviation for all tested MEAs; for the EOT data, the error bars represent the mean absolute deviation between two independent experiments.
Download figure:
Standard image High-resolution imageCross-sectional SEM images of BOT and H2/Air V-cycled MEAs
In order to determine whether the above discussed increase of the H2 crossover currents over the course of the H2/Air V-cycling ASTs is accompanied by membrane thinning, cross-sectional SEM images of an MEA at BOT and of MEAs after 30k H2/Air V-cycles (EOT) at either 80 °C/70% RH or 80 °C/100% RH were analyzed. Furthermore, the images were analyzed to determine whether there was any thinning of the cathode electrodes due to carbon-support corrosion at the high cathode UPL of 1.0 VRHE. While in our previous work for identically conducted V-cycling tests under H2/N2 between 0.6-1.0 VRHE at 80 °C/100% RH no cathode thinning was observed after 30 cycles, 17 voltage cycling under H2/Air with UPLs of 0.95 V or less were reported to exhibit significant carbon-support corrosion and noticeable cathode thinning. 45
Figure 6a shows an SEM cross-section image of a BOT MEA subjected to a modified conditioning sequence (see Experimental section), while Figs. 6b and 6c show images of MEAs after 30k H2/Air V-cycles at either 80 °C/70% RH or 80 °C/100% RH, respectively. Here, the centrally located membrane reinforcement (bright feature), the extension of the membrane above/below the reinforcement (dark gray regions), and the cathode (top) and anode (bottom) cathode catalyst layers can be clearly distinguished. The average thicknesses of the cathode, anode, and the membrane determined from these and additional images are presented in Table I. This analysis shows that there is no thinning of the cathode catalyst layer; i.e., that 30k voltage cycles to an UPL of 1.0 VRHE are not accompanied by a significant carbon-support corrosion even under H2/Air (as mentioned above, none was observed for an identical AST protocol under H2/N2 17 ), suggesting that the presence of oxygen does not significantly enhance the carbon oxidation kinetics. Table I also shows that no membrane thinning occurs over the course of the H2/Air V-cycling ASTs (note that the membrane thickness of ∼13 μm, measured in vacuum, is less than the 15 μm specification from the supplier, measured at ambient air, which is due to the differences in water content). Therefore, the observed increase of the iH2, diff values of the MEAs cycled under H2/Air at 80 °C/70% RH (yellow open symbols in Fig. 4a) must be caused entirely by the presence of membrane pinholes.

Figure 6. Cross-sectional SEM images of MEAs, with the cathode catalyst layer on top, followed by the reinforced PFSA membrane and the anode catalyst layer at the bottom, showing exemplary images for: (a) an MEA at BOT, (b) an MEA after 30k cycles (EOT) of the H2/Air V-cycling AST conducted at 80 °C/70% RH, and (c) an MEA after 30k cycles (EOT) of the H2/Air V-cycling AST conducted at 80 °C/100% RH.
Download figure:
Standard image High-resolution imageTable I. Cathode, anode, and membrane thicknesses determined from cross-sectional SEM images of BOT MEAs as well as of MEAs after 30k (EOT) H2/Air V-cycles (square-wave with 1.0/0.6 VRHE UPL/LPL, with 8 s hold time each) conducted at either 80 °C/70% RH or 80 °C/100% RH. For each MEA, one sample was cut from each the anode inlet and the anode outlet region, taking five SEM images of each.
| MEA samples | Cathode thickness [μm] | Anode thickness [μm] | Membrane thickness [μm] |
|---|---|---|---|
| BOT | 9.3 ± 0.5 | 8.7 ± 0.3 | 12.9 ± 0.8 |
| 30k H2/Air V-cycles at 80 °C/70% RH | 9.0 ± 0.7 | 8.1 ± 0.2 | 13.4 ± 0.7 |
| 30k H2/Air V-cycles at 80 °C/100% RH | 8.9 ± 0.7 | 8.2 ± 0.5 | 13.1 ± 1.4 |
Another feature that can be observed in the cross-sectional SEM images is the presence of a Pt-band close to the cathode/membrane interface. This has been previously observed in experiments for MEAs subjected to extended OCV holds at different H2/O2 concentrations at anode/cathode 33 or to extended voltage cycling (under H2/Air, H2/O2, or H2/N2). 1,29 Zhang et al. showed that the location of the Pt-band depends predominantly on the partial pressures of H2 and O2 in the cell, which in the case of H2/Air operation resulted in a Pt-band in the membrane that was located ∼20% of the membrane thickness away from the cathode electrode, 33 consistent with the Pt-band location observed in Figs. 6b and 6c.
When more closely inspecting the cathode catalyst layer in the SEM images, one can discern the presence of a "platinum depletion zone" near the membrane/cathode interface for the MEA cycled at 80 °C/70% RH (Fig. 6b), indicated by the gray-scale gradient in the electrode (brighter regions corresponding a higher platinum density) that is absent in the image of the BOT MEA (Fig. 6a). This suggests that near the membrane/cathode interface the platinum loss by Pt ion diffusion and redeposition in the membrane is a dominant loss mechanism, as first shown by Ferreira et al., 1 leading to a Pt depletion zone in the cathode electrode that was also observed in H2/N2 V-cycling ASTs by Della Bella et al. 36 and modelled for V-cycling ASTs by Jahnke et al. 46 The extension of the Pt depletion zone further into the cathode electrode can be noted in the SEM image of the MEA cycled at 80 °C/100% RH (Fig. 6c), which we ascribe to the enhanced Pt ion diffusivity at high RH (see above discussion). In summary, the observations with regards to the Pt distribution across the MEA, to carbon-support corrosion, and to membrane thinning for MEAs subjected to H2/Air V-cycling are very similar to those reported for MEAs subjected to H2/N2 V-cycling under otherwise identical conditions. 17,36
Analysis of the H2/O2 performance after H2/N2 V-cycling ASTs
Differential-flow H2/O2 performance curves at 80 °C/100% RH and 170 kPaabs for BOT MEAs and MEAs after 30k (EOT) H2/N2 V-cycling ASTs are depicted in Fig. 7a. The BOT performance (black symbols/line) of all tested MEAs is very consistent, showing a maximum standard deviation of ±8 mV at 2.0 A cm−2
MEA (based on 14 independently measured MEAs). At EOT, the H2/O2 performance follows the same trend as the absolute ECSA value at EOT (see Fig. 3), with the poorest performance for the MEAs that had been subjected to H2/N2 V-cycling at 80 °C/100% RH (red symbols/line) and have a remaining ECSA of only  .
.

Figure 7. Differential-flow H2/O2 (2000/5000 nccm) polarization curves at 80 °C/100% RH and 170 kPaabs, measured at BOT (black symbols/lines) and after 30k cycles (EOT) of H2/N2 V-cycling ASTs (square-wave with 1.0/0.6 VRHE UPL/LPL, with 8 s hold time each) conducted at 80 °C/30% RH (blue symbols/lines), 80 °C/50% RH (green symbols/lines), 80 °C/70% RH (yellow symbols/lines), and 80 °C/100% RH (red symbols/lines). (a) Cell voltage (Ecell) versus current density (igeo). (b) Tafel plot representation of the RHFR and  corrected cell voltage (
 see Eq. 2) versus the logarithm of the specific current density (current density normalized by the electrode Pt loading and the ECSA (from Fig. 3), corrected by iH2, diff (from Fig. 4a) and ishort); the gray line in the figure marks a Tafel slope of 70 mV dec−1. The error bars of the BOT data correspond to the standard deviation of all tested MEAs, while those of the EOT data correspond to the mean absolute deviation between two independent experiments. MEAs: 15 μm reinforced membrane with Pt loadings of 0.1/0.4
  (anode/cathode).
Download figure:
Standard image High-resolution imageIn order to examine the relationship between the H2/O2 performance and the cathode ECSA, we conducted the analysis approach presented by Owejan et al.
47
and Harzer et al.,
17
assuming negligible overpotentials for the hydrogen oxidation reaction (HOR) and negligible O2 transport resistance losses. In this case, the cell voltage corrected by the voltage losses caused by the ohmic resistance (igeo · RHFR) and by the effective proton conduction resistance in the cathode catalyst layer (igeo
 acc. to Neyerlin et al.
24
) should be proportional to the ORR overpotential described by simple Tafel kinetics (see Neyerlin et al.
48
). The thus corrected cell voltage (
acc. to Neyerlin et al.
24
) should be proportional to the ORR overpotential described by simple Tafel kinetics (see Neyerlin et al.
48
). The thus corrected cell voltage ( ) should then be proportional to the logarithm of the geometric current density divided by the Pt loading (
 ) and the Pt ECSA, which corresponds to the specific, i.e., Pt surface area normalized current density (
 ):
):

Here, TS is the ORR Tafel slope (in mV dec−1),  is the ORR exchange current density (in
  ), and the term
  corresponds to the cathode electrode roughness factor (rf, which generally is given in units of
  ; note that the geometric current density has to also be corrected for the H2 crossover current density (iH2, diff) and the shorting current density (ishort).
The analysis according to Eq. 2 is shown in Fig. 7b, plotting  versus the logarithm of
  The data for the BOT MEAs (black symbols/line) closely follow a Tafel behavior, with an apparent Tafel slope of ∼78 ± 1 mV dec−1, close to the theoretical slope of 70 mV dec−1 (see gray line). For the lower specific current densities, this is also true for the EOT MEAs that had undergone 30k cycles of the H2/N2 V-cycling AST, even though they are offset by ∼20 mV to higher potentials, which we ascribe to an increased exchange current density of larger (i.e., Ostwald ripened) Pt particles. At higher specific current densities, starting at ∼0.05
  , the EOT MEA data in Fig. 7b deviate from Tafel behavior. The same phenomenon, setting in at essentially the same specific current density, has also been reported for the BOT performance of MEAs with varying cathode Pt loadings for a given catalyst
47
(thus varying electrode rf while keeping the same catalyst ECSA) as well as for H2/N2 V-cycling ASTs at 80 °C/100% RH with different voltage profiles and different UPL/LPL values (thus varying electrode rf and catalyst ECSA).
17
This deviation from Tafel behavior has been ascribed to the so-called Pt-specific oxygen transport resistances which become the more pronounced the lower the electrode roughness factor becomes. However, the striking observation from Fig. 7b is that the data of all EOT MEAs fall onto the same "master" curve, indicating that the H2/O2 performance loss seen in Fig. 7a only depends on the specific current density and thus on the cathode ECSA, no matter at which RH condition the H2/N2 V-cycling ASTs were conducted.
, the EOT MEA data in Fig. 7b deviate from Tafel behavior. The same phenomenon, setting in at essentially the same specific current density, has also been reported for the BOT performance of MEAs with varying cathode Pt loadings for a given catalyst
47
(thus varying electrode rf while keeping the same catalyst ECSA) as well as for H2/N2 V-cycling ASTs at 80 °C/100% RH with different voltage profiles and different UPL/LPL values (thus varying electrode rf and catalyst ECSA).
17
This deviation from Tafel behavior has been ascribed to the so-called Pt-specific oxygen transport resistances which become the more pronounced the lower the electrode roughness factor becomes. However, the striking observation from Fig. 7b is that the data of all EOT MEAs fall onto the same "master" curve, indicating that the H2/O2 performance loss seen in Fig. 7a only depends on the specific current density and thus on the cathode ECSA, no matter at which RH condition the H2/N2 V-cycling ASTs were conducted.
Comparison of the H2/O2 performance after H2/N2 versus H2/Air V-cycling ASTs
As shown above, the only difference between H2/N2 and H2/Air V-cycling ASTs so far has been that the latter lead to membrane pinhole formation (Fig. 4a), while for both AST types the ECSA loss is essentially identical for a given RH condition (see Fig. 3) and RH+, cath remains constant over all ASTs (see Fig. 5). This suggests that also the H2/O2 performance might be unaffected by the AST type, which indeed is more or less the case, as shown in Fig. 8a for the EOT MEAs after H2/N2 and H2/Air V-cycling ASTs conducted at both 80 °C/70% RH (yellow symbols/lines) and 80 °C/100% RH (red symbols/lines). The ∼25 mV lower EOT performance at 2.0  of the MEAs subjected to the H2/Air V-cycling AST at 80 °C/100% RH compared to those cycled under H2/N2 is likely within the error of the measurement for such strongly degraded MEAs (only
  remaining ECSA, see Fig. 3), where the deviation between two repeat measurements is up to ∼30 mV (corresponding to the width of the error bars). This is supported by the fact that one would also expect less chemical membrane/ionomer degradation in H2/Air at 100% RH compared to 70% RH, whereby the H2/O2 performance curves for both the H2/N2 and the H2/Air V-cycling ASTs are identical. However, it cannot be excluded that there are minor differences in the Pt distribution across the cathode electrode between the two types of ASTs. As a matter of fact, one would expect a wider Pt depletion zone in the H2/N2 case where the Pt-band is at the very membrane/cathode interface,
1,2,29,33
which should actually lead to a larger ECSA loss (as the Pt-band location marks the point where the crossover H2 concentration is expected to be zero, Pt ions need to diffuse a shorter distance in the H2/N2 case), which is not observed within the error of the measurement (see Fig. 3). The Tafel analysis in Fig. 8b (i.e., acc. to Eq. 2) leads to the same conclusions, namely that the H2/O2 performance of the EOT MEAs is essentially independent of whether the MEAs were subjected to H2/N2 and H2/Air V-cycling ASTs and that the H2/O2 performance depends predominantly on the cathode ECSA. In this case, however,
remaining ECSA, see Fig. 3), where the deviation between two repeat measurements is up to ∼30 mV (corresponding to the width of the error bars). This is supported by the fact that one would also expect less chemical membrane/ionomer degradation in H2/Air at 100% RH compared to 70% RH, whereby the H2/O2 performance curves for both the H2/N2 and the H2/Air V-cycling ASTs are identical. However, it cannot be excluded that there are minor differences in the Pt distribution across the cathode electrode between the two types of ASTs. As a matter of fact, one would expect a wider Pt depletion zone in the H2/N2 case where the Pt-band is at the very membrane/cathode interface,
1,2,29,33
which should actually lead to a larger ECSA loss (as the Pt-band location marks the point where the crossover H2 concentration is expected to be zero, Pt ions need to diffuse a shorter distance in the H2/N2 case), which is not observed within the error of the measurement (see Fig. 3). The Tafel analysis in Fig. 8b (i.e., acc. to Eq. 2) leads to the same conclusions, namely that the H2/O2 performance of the EOT MEAs is essentially independent of whether the MEAs were subjected to H2/N2 and H2/Air V-cycling ASTs and that the H2/O2 performance depends predominantly on the cathode ECSA. In this case, however,  at 2.0
  is now ∼50 mV lower for the EOT MEAs cycled under H2/Air at 80 °C/100% RH compared to those cycled under H2/N2, which we ascribe to the inaccuracy of the ECSA measurements (thus an inaccuracy of the value of
  ) when the ECSA is only
  , even when using CO-stripping voltammetry.
36
, even when using CO-stripping voltammetry.
36

Figure 8. Differential-flow H2/O2 (2000/5000 nccm) polarization curves at 80 °C/100% RH and 170 kPaabs, measured at BOT (black symbols/lines) and after 30k (EOT) voltage cycles (square-wave with 1.0/0.6 VRHE UPL/LPL, with 8 s hold time each) conducted at 80 °C/70% RH (yellow symbols/lines) or 80 °C/100% RH (red symbols/lines), comparing data from H2/N2 (solid symbols) and H2/Air V-cycling ASTs. (a) Cell voltage (Ecell) versus current density (igeo). (b) Tafel plot representation of the RHFR and  corrected cell voltage (
 see Eq. 2) versus the logarithm of the specific current density (current density normalized by the electrode Pt loading and ECSA (from Fig. 3), corrected by iH2, diff (from Fig. 4a) and ishort); the gray line in the figure marks a Tafel slope of 70 mV dec-1. The error bars of the BOT data correspond to the standard deviation of all tested MEAs, while those of the EOT data correspond to the mean absolute deviation between two independent experiments. MEAs: 15 μm reinforced membrane with Pt loadings of 0.1/0.4
  (anode/cathode).
Download figure:
Standard image High-resolution imageIn order to quantify the evolution of the cathode catalyst ORR activity over the course of the V-cycling ASTs, the ORR activity of the cathode catalyst was determined from differential-flow H2/O2 polarization curves at 80 °C/100% RH and 170 kPaabs at each AST segment. For this,  was plotted versus the logarithm of the current density (corrected by the H2 crossover and MEA shorting current densities) and fitted by a linear regression line between 50 and 500
  (kinetically limited region), which was extrapolated to determine the current density at an
  value of 0.9 V. Dividing this current density by the platinum loading then yields the ORR mass activity of the cathode catalyst at a resistance-corrected voltage of 0.9 V and at H2/O2 partial pressures of 120 kPaabs (
 ),
17
which is plotted versus AST cycle number in Fig. 9a. For clarity, only the
),
17
which is plotted versus AST cycle number in Fig. 9a. For clarity, only the  values for H2/N2 and H2/Air ASTs conducted at the same conditions, namely 80 °C/70% RH (yellow symbols/lines) and 80 °C/100% RH (red symbols/lines) are shown. The BOT
  values are in very good agreement with a previous study with the same type of catalyst (blue lines in Fig. 4 of Ref. 17). As one would expect on the basis of Fig. 3, the decrease of the ORR mass activity over the course of the V-cycling ASTs is faster at higher RH values (see Fig. 9a). Here it should be noted that a minor change of our characterization sequence (see Fig. 1) compared to that by Harzer et al.
17
eliminated the initial increase of
values are in very good agreement with a previous study with the same type of catalyst (blue lines in Fig. 4 of Ref. 17). As one would expect on the basis of Fig. 3, the decrease of the ORR mass activity over the course of the V-cycling ASTs is faster at higher RH values (see Fig. 9a). Here it should be noted that a minor change of our characterization sequence (see Fig. 1) compared to that by Harzer et al.
17
eliminated the initial increase of  over the first 100 AST cycles that was observed in their study, namely by acquiring the H2/O2 polarization curve more closely after the recovery step. A comparison of Fig. 9a with Fig. 3 shows that while
  decreases with decreasing Pt ECSA, there is no significant difference between H2/N2 (solid symbols) and H2/Air (open symbols) V-cycling ASTs, indicating essentially identical degradation mechanisms for both ASTs.

Figure 9. Evolution of the ORR activity at 0.9 V, 80 °C, and 120 kPa H2/O2 partial pressures of the cathode catalyst versus cycle number for the H2/N2 (solid symbols) and the H2/Air (open symbols) V-cycling ASTs conducted at 80 °C/70% RH (yellow symbols/lines) and at 80 °C/100% RH (red symbols/lines), extracted from differential-flow H2/O2 polarization curves (80 °C/100% RH, 170 kPaabs). (a) ORR mass activity (in  ) at 0.9 V (
 ); (b) ORR specific activity (in
  ) at 0.9 V (
 ). The current density at 0.9 V was obtained by a linear regression (and further extrapolation) of
  versus the logarithm of the current density between 50 and 500
  after correction of the current density by the H2 crossover current density and the MEA shorting current density; the ECSA values were obtained from Fig. 3. Error bars represent the mean absolute deviation between two independent experiments.
Download figure:
Standard image High-resolution imageBy dividing the  data in Fig. 9a by the ECSA data in Fig. 3, the specific ORR activity (
 ) was obtained and is shown in Fig. 9b. The
  values increase gradually from ∼0.2 at BOT to ∼0.3 over the first 3000 cycles for all four ASTs. Afterwards, the
  values for the MEAs subjected to V-cycling ASTs at 100% RH increase more rapidly, reaching a ∼2-fold higher value after 30 k cycles compared to those cycled at 70% RH. The
  differences between the H2/N2 and the H2/Air cycled MEAs at 10 k and 20 k are not reflected in the
  values (Fig. 9a) and are likely an experimental artefact, as
  is obtained by dividing
  by the ECSA, which both have larger errors when the ECSA and thus the current density are very low. In general, however, the observed increase of the
  values with decreasing ECSA is what one would expect for an increase of the Pt particle size
49
that occurs over the course of V-cycling ASTs.
1,7
values with decreasing ECSA is what one would expect for an increase of the Pt particle size
49
that occurs over the course of V-cycling ASTs.
1,7
Comparison of the H2/Air performance after H2/N2 versus H2/Air V-cycling ASTs
Figure 10 shows the BOT differential-flow H2/Air (2000/5000 nccm) performance of all tested MEAs at 80 °C/100% RH and 170 kPaabs (black symbols/line). After 30 k (EOT) cycles of the H2/N2 (solid symbols) and H2/Air (open symbols) V-cycling ASTs conducted at 80 °C and different RH conditions (marked in the figure), the trend in the H2/Air performance losses follows the above observed losses of the Pt ECSA (Fig. 3 and of the H2/O2 performance losses (Fig. 8a), indicating again a small difference between the H2/Air performance losses for MEAs subjected to H2/N2 or H2/Air V-cycling ASTs (as discussed for the H2/O2 polarization curves, the differences between the MEAs cycled under H2/N2 versus H2/Air at 80 °C/100% RH (red symbols/lines) are likely insignificant for such strongly degraded MEAs). However, the H2/Air performance losses are substantially larger than those measured under H2/O2: for example, for the V-cycling ASTs conducted at 80 °C/70% RH (with an EOT ECSA of  ), the EOT H2/Air versus H2/O2 performance losses are ∼150 mV (Fig. 10) versus ∼70 mV (Fig. 8a), respectively, and for ASTs conducted at 80 °C/100% RH (with an EOT ECSA of
  ), the EOT H2/Air versus H2/O2 performance losses are ∼400 mV versus ∼150 mV; respectively. This can be ascribed to the additional effect of the oxygen mass-transport resistance that is most relevant under H2/Air and that increases with decreasing cathode electrode roughness factor (rf; in units of
  ), i.e., with decreasing ECSA when identical cathode platinum loadings are used.
17,36,47
Consistent with this, the performance losses get even larger for differential-flow H2/10%O2 (rest N2) performance curves (not shown), as reported also by Harzer et al.
17
), i.e., with decreasing ECSA when identical cathode platinum loadings are used.
17,36,47
Consistent with this, the performance losses get even larger for differential-flow H2/10%O2 (rest N2) performance curves (not shown), as reported also by Harzer et al.
17

Figure 10. Differential-flow H2/Air (2000/5000 nccm) polarization curves at 80 °C/100% RH and 170 kPaabs, measured at BOT (black symbols/lines) and after 30k (EOT) voltage cycles (square-wave with 1.0/0.6 VRHE UPL/LPL, with 8 s hold time each) conducted at 80 °C/30% RH (blue symbols/lines), 80 °C/50% RH (green symbols/lines), 80 °C/70% RH (yellow symbols/lines), and 80 °C/100% RH (red symbols/lines) under either H2/N2 (solid symbols) or H2/Air (open symbols). Note that owing to membrane pinhole formation, no H2/Air V-cycling ASTs could be completed at 50% RH. The error bars of the BOT data correspond to the standard deviation of all tested MEAs, while those of the EOT data correspond to the mean absolute deviation between two independent experiments. MEAs: 15 μm reinforced membrane with Pt loadings of 0.1/0.4  (anode/cathode).
Download figure:
Standard image High-resolution imageTo determine the oxygen transport resistance ( ), limiting current density measurements were conducted with differential flows of H2 and O2/N2 mixtures at 80 °C/100% RH and pressures between 170-500 kPaabs, following previously described procedures.
36
By measuring limiting current densities at different pressures,
), limiting current density measurements were conducted with differential flows of H2 and O2/N2 mixtures at 80 °C/100% RH and pressures between 170-500 kPaabs, following previously described procedures.
36
By measuring limiting current densities at different pressures,  can be deconvoluted into a pressure dependent component (
 ) that represents the Fickian O2 transport resistance in the flow-field and in the GDL substrate and in a pressure independent component (
 ) that represents the non-Fickian O2 transport resistance in the very small pores in the MPL (
 ) and the cathode catalyst layer (
 ) as well as the cathode rf-dependent local oxygen transport resistance in the region close to the Pt surface (
 ).
50
Figure 11 shows the measured
).
50
Figure 11 shows the measured  values at BOT (left-most bars of each group of bars) as well after 10k, 20k, and 30k cycles (subsequent bars of each group of bars) of the different V-cycling ASTs (marked by the x-axis labels), whereby the colored segments of the bars correspond to
  and the upper gray parts of the bars correspond to
  The BOT values of
  (0.68 ± 0.06 s cm−1) agree within ∼10%, and the BOT values of
  (0.36 ± 0.05 s cm−1) and
  (0.32 ± 0.02 s cm−1) for each set of two MEAs are also reasonably similar, even though their quantification is more error prone (note that for clarity the BOT values were evaluated separately for each set of two MEAs). Furthermore, as one would expect, the
  values (colored bars), representing the O2 transport resistance in the GDL and the flow-field, remain reasonably constant over the course of the V-cycling ASTs, consistent with the expectation that the GDL should not degrade in these tests.

Figure 11. Evolution of the total O2 mass transport resistance ( ), as well as of the pressure dependent (
 colored bars) and pressure independent terms (
 upper gray bars), over the course of the different V-cycling ASTs, determined from limiting current density measurements with differential flows of H2 and O2/N2 mixtures (0.5%-28% O2) at 80 °C/100% RH and pressures between 170-500 kPaabs. Each group of bars represents a different V-cycling test; from left to right for each group of bars are the values at BOT, at 10k, at 20k, and at 30k cycles (EOT). Error bars represent the mean absolute deviation between two independent experiments for
  (lower set of error bars) and for
  (upper set of error bars).
Download figure:
Standard image High-resolution imageOn the other hand, while the  values also remain roughly constant over the course of the V-cycling AST at 80 °C/30% RH (left-most gray bars in Fig. 11), they increase more strongly for the V-cycling ASTs when they are conducted at increasingly higher RH. This can be ascribed to the more pronounced Pt ECSA loss as the RH during the V-cycling ASTs is increased (see Fig. 3), which leads to an increase of
  an observation that was also reported by others over the course of V-cycling ASTs.
17,36,51
The increase of
an observation that was also reported by others over the course of V-cycling ASTs.
17,36,51
The increase of  with decreasing cathode rf had first been observed by Greszler et al.,
52
who varied the cathode electrode roughness factor by varying the Pt cathode loading. They, as well as Kongkanand and Mathias,
50
showed that the relationship between
with decreasing cathode rf had first been observed by Greszler et al.,
52
who varied the cathode electrode roughness factor by varying the Pt cathode loading. They, as well as Kongkanand and Mathias,
50
showed that the relationship between  and the cathode roughness factor can be described by Eq. 3, predicting an
  increase with decreasing roughness factor due to the growing effect of the local oxygen transport resistance (
 ):
):


Figure 12. Total O2 mass transport resistance ( ) versus the inverse of the cathode electrode roughness factor (rf−1
) over the course of the various H2/N2 and H2/Air V-cycling ASTs (marked in the figure). Error bars represent the mean absolute deviation between two independent experiments. The dashed black line is a linear regression fit of the data according to Eq. 4. The data from Harzer et al. are added for comparison (taken from Fig. 12 in Ref. 17) and are excluded from the linear regression analysis.
) versus the inverse of the cathode electrode roughness factor (rf−1
) over the course of the various H2/N2 and H2/Air V-cycling ASTs (marked in the figure). Error bars represent the mean absolute deviation between two independent experiments. The dashed black line is a linear regression fit of the data according to Eq. 4. The data from Harzer et al. are added for comparison (taken from Fig. 12 in Ref. 17) and are excluded from the linear regression analysis.
Download figure:
Standard image High-resolution imageIn terms of the total O2 transport resistance, Eq. 3 can be rewritten as:

Here, the first three terms on the right-hand-side are considered to be approximately independent of the cathode electrode roughness factor, so that a plot of  versus 1/rf should lead a straight line with a slope corresponding to
  As seen in Fig. 12,
  over the course of the V-cycling ASTs (data taken from Fig. 11) versus the inverse of the cathode electrode roughness factor (calculated from the MEA loadings and the Pt ECSA values given in Fig. 3) can indeed be described reasonably well by a linear regression line (black dashed line in Fig. 12), independent of whether the MEAs were subjected to H2/N2 or H2/Air V-cycling ASTs. Also added to the plot for comparison are the
  data of Harzer et al.
17
(blue stars; note that these are not included in the regression analysis), which were obtained over the course of a H2/N2 V-cycling AST at 80 °C/100% RH, using the same cycling protocol and the same cathode catalyst type/loading. According to Eq. 4, the slope of this line corresponds to
data of Harzer et al.
17
(blue stars; note that these are not included in the regression analysis), which were obtained over the course of a H2/N2 V-cycling AST at 80 °C/100% RH, using the same cycling protocol and the same cathode catalyst type/loading. According to Eq. 4, the slope of this line corresponds to  which based on the linear regression analysis has a value of 13.4 ± 0.8 s cm−1 at 80 °C/100% RH. This may be compared to other studies that used MEAs with cathode layers made with similar Vulcan carbon supported Pt catalysts, namely with ∼12 s cm−1 (at 80 °C/62% RH) reported by Greszler et al.,
52
with ∼10 s cm−1 (at 80 °C/∼70% RH) reported by Yarlagadda et al.,
53
and with ∼8.5 s cm−1 (80 °C/95% RH) reported by Della Bella et al.
36
The rather high value obtained in the present study is likely due to having conducted the limiting current density measurements at 100% RH, which within the experimental accuracy of the dewpoint control may have resulted in the presence of liquid water in the cathode electrodes and thus to larger oxygen transport resistances. However, the overall conclusion that we can draw from Figs. 10–12 is that the loss of H2/Air performance and the increase of oxygen transport resistances are essentially identical for the here conducted H2/N2 and H2/Air V-cycling ASTs and predominantly depend on the cathode roughness factor.
which based on the linear regression analysis has a value of 13.4 ± 0.8 s cm−1 at 80 °C/100% RH. This may be compared to other studies that used MEAs with cathode layers made with similar Vulcan carbon supported Pt catalysts, namely with ∼12 s cm−1 (at 80 °C/62% RH) reported by Greszler et al.,
52
with ∼10 s cm−1 (at 80 °C/∼70% RH) reported by Yarlagadda et al.,
53
and with ∼8.5 s cm−1 (80 °C/95% RH) reported by Della Bella et al.
36
The rather high value obtained in the present study is likely due to having conducted the limiting current density measurements at 100% RH, which within the experimental accuracy of the dewpoint control may have resulted in the presence of liquid water in the cathode electrodes and thus to larger oxygen transport resistances. However, the overall conclusion that we can draw from Figs. 10–12 is that the loss of H2/Air performance and the increase of oxygen transport resistances are essentially identical for the here conducted H2/N2 and H2/Air V-cycling ASTs and predominantly depend on the cathode roughness factor.
Voltage loss analysis of the H2/Air polarization curves
Similar to the voltage loss analysis carried out for the differential-flow H2/O2 polarization curves shown in Figs. 7b and 8b, an analogous analysis was applied to the differential-flow H2/Air polarization curves (see Fig. 10) over the course of the V-cycling ASTs. This is done by adding a term to Eq. 5 that considers the effect of  on the H2/Air voltage loss (
 ):
):


As for the H2/O2 curves, RHFR was measured directly during the acquisition of the H2/Air polarization curves,  was determined from the RH+, cath values shown in Fig. 5 (acc. to Neyerlin et al.
24
), and
was determined from the RH+, cath values shown in Fig. 5 (acc. to Neyerlin et al.
24
), and  was determined from the
  values shown in Fig. 11, using the following relationship given by Zihrul et al.:
18
values shown in Fig. 11, using the following relationship given by Zihrul et al.:
18


Here, R is the gas constant (8.314 J mol-1 K-1), T is the temperature in Kelvin, F is the Faraday constant,  is the ORR reaction order with respect to the oxygen partial pressure (using
  = 0.54, as reported by Neyerlin et al.
48
), α is the effective transfer coefficient for the ORR (using a value of α = 1, corresponding to a Tafel slope of 70 mV dec-1), and pO2,channel is the oxygen partial pressure in the flow-field channel. Figure 13 shows the thus derived
= 0.54, as reported by Neyerlin et al.
48
), α is the effective transfer coefficient for the ORR (using a value of α = 1, corresponding to a Tafel slope of 70 mV dec-1), and pO2,channel is the oxygen partial pressure in the flow-field channel. Figure 13 shows the thus derived  values for the H2/Air polarization curves shown in Fig. 10 plotted versus the logarithm of
  (based on the ECSA data in Fig. 3 and corrected by H2 crossover and shorting currents).
Analogous to the transport resistance corrected H2/O2 polarization curves (Figs. 7b and 8b), the transport resistance corrected H2/Air polarization curves (Fig. 13) essentially overlap for all MEAs subjected to the different V-cycling ASTs, independent of the RH condition and of whether the ASTs were conducted under H2/N2 or H2/Air. Thus, consistent with the transport resistance corrected H2/O2 polarization curves, all of the transport resistance corrected H2/Air polarization curves follow a single "master" curve, indicating again that the ECSA loss uniquely describes the H2/Air performance when corrected for the HFR, the cathode proton conduction resistance, and the overall oxygen transport resistance. However, in the absence of any other transport resistances and for simple Tafel kinetics, the  versus log(
 ) data should follow a straight line (a Tafel line with an ideal slope of 70 mV dec-1 is marked by the gray line in Fig. 13), which is only the case up to ∼0.01
  , indicating the presence of other, unassigned voltage losses. This phenomenon was first reported by Owejan et al.
47
or MEAs with very low cathode Pt loadings and then later on by Harzer et al.
17
and Zihrul et al.
18
for MEAs aged over the course of V-cycling ASTs (in both reports, deviations from a straight Tafel line were observed at specific current densities higher than ∼0.02
, indicating the presence of other, unassigned voltage losses. This phenomenon was first reported by Owejan et al.
47
or MEAs with very low cathode Pt loadings and then later on by Harzer et al.
17
and Zihrul et al.
18
for MEAs aged over the course of V-cycling ASTs (in both reports, deviations from a straight Tafel line were observed at specific current densities higher than ∼0.02  ). The origin of these unassigned losses are still under debate, but there is growing evidence that they may at least in part be due to an incorrect assessment of the
  values by the commonly used steady-state limiting current (SLC) approach
25
(also used in the present study). In contrast, for the more recently developed transient limiting current (TLC) method first proposed by Göbel et al.,
54
the unassigned mass transport resistances are substantially minimized or even eliminated,
54,55
as the TLC method is believed to determine
values by the commonly used steady-state limiting current (SLC) approach
25
(also used in the present study). In contrast, for the more recently developed transient limiting current (TLC) method first proposed by Göbel et al.,
54
the unassigned mass transport resistances are substantially minimized or even eliminated,
54,55
as the TLC method is believed to determine  under conditions that more closely reflect those during the acquisition of a polarization curve. Nevertheless, even though the here used SLC method results in large unassigned voltage losses at higher specific current densities (i.e., a deviation from a straight Tafel line beyond ∼0.01
  ), the resistance corrected H2/Air polarization curves all clearly scale with
  independent of the AST conditions.

Figure 13. Tafel plot representation of the differential-flow H2/Air polarization curves at 80 °C/100% RH at 170 kPaabs (shown in Fig. 10), plotting the RHFR,  and
and  corrected H2/Air cell voltage (
 see Eq. 5 versus the logarithm of the specific current density (current density normalized by the electrode Pt loading and ECSA (from Fig. 3), corrected by iH2, diff (from Fig. 4a) and ishort); the gray line in the figure marks a Tafel slope of 70 mV dec-1. The error bars of the BOT data correspond to the standard deviation of all tested MEAs, while those of the EOT data correspond to the mean absolute deviation between two independent experiments. MEAs: 15 μm reinforced membrane with Pt loadings of 0.1/0.4
  (anode/cathode).
Download figure:
Standard image High-resolution imageBased on the above observations, one would expect that the degradation of the differential-flow H2/Air cell voltage over the course of the H2/N2 and H2/Air V-cycling ASTs at different RH conditions also only depends on the cathode electrode roughness factor (or on the cathode ECSA, since all MEAs have identical Pt cathode loadings of 0.4  ). This is indeed confirmed in Fig. 14, where the differential-flow H2/Air cell voltages (recorded at 80 °C/100% RH and 170 kPaabs) are plotted for four different current densities (0.2, 0.5, 1.0, and 2.0
  ) versus the cathode electrode roughness factor at BOT (black diamonds) as well as after 10k, 20k, and 30k voltage cycles (differently colored symbols). Quite clearly, for each current density, the data of all the H2/N2 (solid symbols) and H2/Air (open symbols) V-cycling ASTs follow an identical trend (marked by the gray dashed guide-to-the-eye lines), indicating that the H2/Air performance is a unique function of the cathode electrode roughness factor, independent of the RH condition of the V-cycling ASTs and of whether they were conducted under H2/N2 or H2/Air. Such a phenomenon was first reported by Della Bella et al.,
36
who showed that the H2/Air cell voltages at a given current density over the course of H2/N2 V-cycling ASTs (conducted at 80 °C/100% RH) with different UPLs and different UPL hold times followed an identical trend line, suggesting that within their examined parameter space (UPLs from 0.85-1.0 VRHE and hold times from 1-8 s) the performance loss of the MEAs would only depend on the cathode electrode roughness factor (or ECSA, as all their MEAs had the same Pt cathode loadings of 0.1
) versus the cathode electrode roughness factor at BOT (black diamonds) as well as after 10k, 20k, and 30k voltage cycles (differently colored symbols). Quite clearly, for each current density, the data of all the H2/N2 (solid symbols) and H2/Air (open symbols) V-cycling ASTs follow an identical trend (marked by the gray dashed guide-to-the-eye lines), indicating that the H2/Air performance is a unique function of the cathode electrode roughness factor, independent of the RH condition of the V-cycling ASTs and of whether they were conducted under H2/N2 or H2/Air. Such a phenomenon was first reported by Della Bella et al.,
36
who showed that the H2/Air cell voltages at a given current density over the course of H2/N2 V-cycling ASTs (conducted at 80 °C/100% RH) with different UPLs and different UPL hold times followed an identical trend line, suggesting that within their examined parameter space (UPLs from 0.85-1.0 VRHE and hold times from 1-8 s) the performance loss of the MEAs would only depend on the cathode electrode roughness factor (or ECSA, as all their MEAs had the same Pt cathode loadings of 0.1  ). At the low current density of 0.2
  (see uppermost data set in Fig. 14), the H2/Air performance losses appear to be solely due to ORR kinetic losses, as a 10-fold loss in cathode electrode roughness factor results in a cell voltage loss of ∼70 mV, as one would expect based on simple Tafel kinetics; the analogous behavior was also observed by Della Bella et al.
36
On the other hand, at a large current density of 2.0
(see uppermost data set in Fig. 14), the H2/Air performance losses appear to be solely due to ORR kinetic losses, as a 10-fold loss in cathode electrode roughness factor results in a cell voltage loss of ∼70 mV, as one would expect based on simple Tafel kinetics; the analogous behavior was also observed by Della Bella et al.
36
On the other hand, at a large current density of 2.0  (lowermost data set in Fig. 14), the H2/Air performance decreases much more rapidly with decreasing rf once the cathode electrode rf goes below ∼80 , where local oxygen transport resistances becoming increasingly, consistent again with the observations by Della Bella et al.
36
(lowermost data set in Fig. 14), the H2/Air performance decreases much more rapidly with decreasing rf once the cathode electrode rf goes below ∼80 , where local oxygen transport resistances becoming increasingly, consistent again with the observations by Della Bella et al.
36

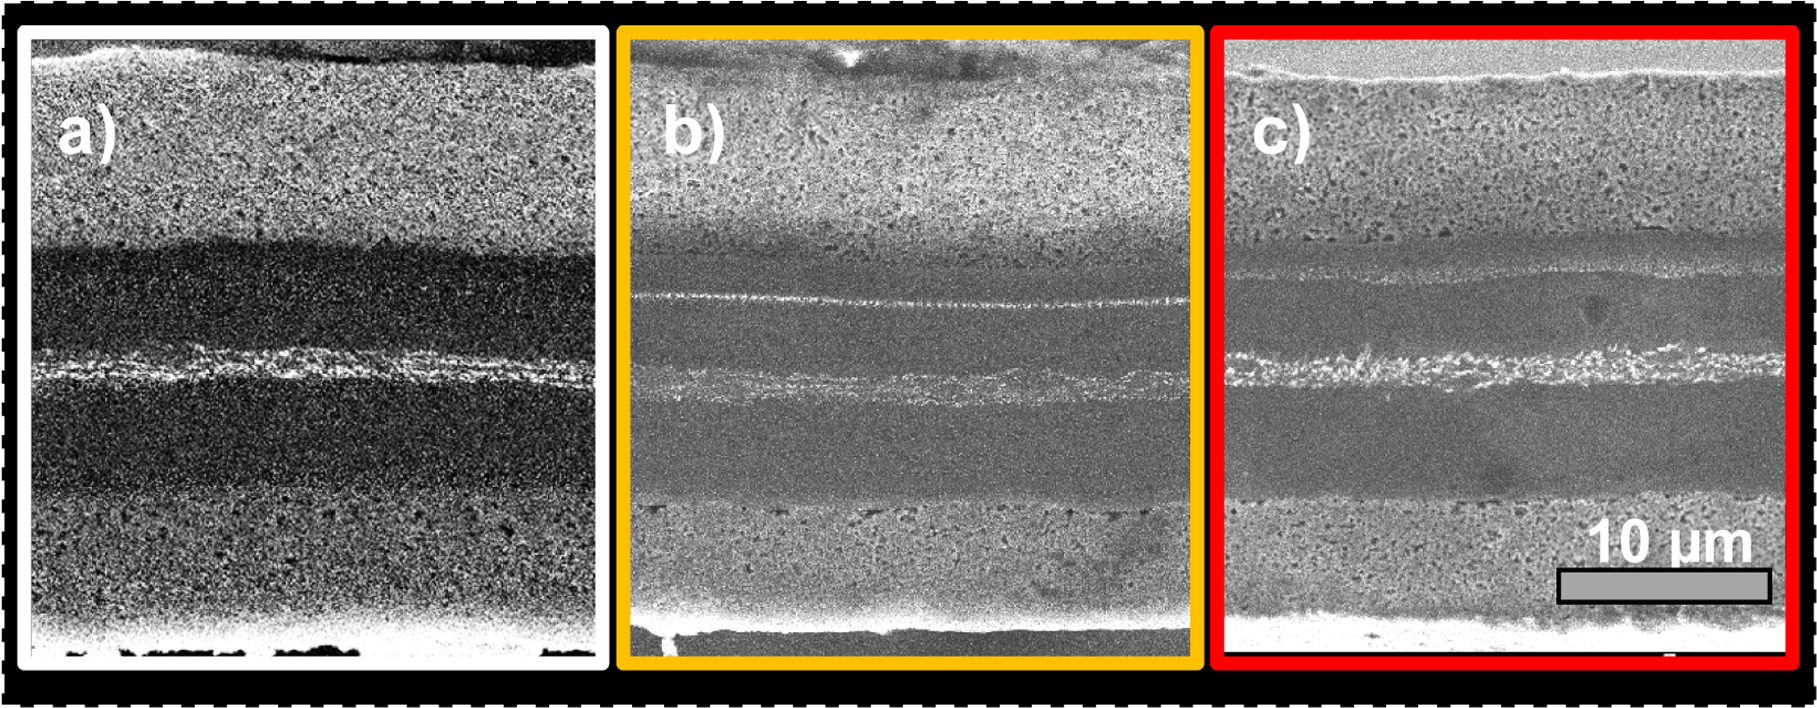
Figure 14. Evolution of the differential-flow H2/Air cell voltages (recorded at 80 °C/100% RH and 170 kPaabs) at four different current densities (0.2, 0.5, 1.0, and 2.0  ) versus the cathode electrode roughness factor (determined from the ECSA data shown in Fig. 3) for the different V-cycling ASTs (see legend in the figure). Shown are the data at BOT (black diamonds) and after 10k, 20k, and 30k cycles of the H2/N2 (solid symbols) and H2/Air (open symbols) V-cycling tests at different RH conditions; the gray dashed line is a guide-to-the-eye. The error bars of the BOT data correspond to the standard deviation of all tested MEAs, while the error bars of the other measurements (colored) correspond to the mean absolute deviation between two independent experiments. MEAs: 15 μm reinforced membrane with Pt loadings of 0.1/0.4
  (anode/cathode).
Download figure:
Standard image High-resolution image
In summary, the findings reported by the latter authors (Fig. 12 in Ref. 36) in conjunction with the data shown in Fig. 14 suggest that for V-cycling ASTs with a UPL of ≤1.0 VRHE, conducted either under H2/N2 between 30%-100% RH or under H2/Air between 70%-100% RH, the H2/Air performance only depends on the cathode electrode roughness factor that is reached after a given number of voltage cycles (note: the number of cycles over which a given cathode electrode rf value is reached decreases with increasing RH and increasing UPL). In other words, chemical/mechanical degradation of the ionomer in the cathode electrode that would be expected under H2/Air conditions (particularly at the lower RH) does not seem to affect the performance loss, nor is there any evidence that carbon-support corrosion would be enhanced for H2/Air compared to H2/N2 V-cycling ASTs.
Conclusions
In the present study, we examined the durability of 5 cm2 active area MEAs with Pt/Vulcan electrodes (0.1/0.4  anode/cathode) and a 15 μm reinforced PFSA membrane over the course of extended voltage cycling (V-cycling) accelerated stress tests (ASTs). The ASTs were conducted at 80 °C and different RH conditions (30%-100% RH) under either H2/N2 (anode/cathode) or H2/Air, applying 30,000 square-wave potential cycles with an upper potential limit (UPL) of 1.0 V and a lower potential limit of 0.6 V (LPL). The H2/Air V-cycling ASTs were conducted at differential-flow conditions to assure homogeneity along the flow-field path, and the lower potential limit was controlled to closely correspond to a high-frequency resistance (HFR) free cell voltage of 0.6 V (using an iR-compensation control mode) in order to maintain a constant cathode potential of ∼0.6 V versus the reversible hydrogen electrode potential (RHE). By these means (i.e., differential-flows and iR-compensation), the in-plane homogeneity and the modulation of the cathode potential for V-cycling ASTs under H2/Air are essentially identical to those conducted under H2/N2, allowing for a rigorous comparison of the effects of the two different gas configurations on MEA degradation.
The loss of electrochemically active surface area (ECSA) of the cathode electrode over the V-cycling ASTs was found to not depend on whether the ASTs were conducted under H2/N2 or H2/Air, but the cathode ECSA loss strongly decreased with decreasing RH. For example, more than 90% of the ECSA was lost over 30k cycles at 80 °C/100% RH while only ∼60% were lost at 80 °C/30% RH; this is at least in part ascribed to the rapidly decreasing diffusivity of dissolved platinum ions in the ionomer phase with decreasing RH, reducing the extent of platinum loss into the membrane ionomer phase. Furthermore, cross-sectional SEM images of MEAs cycled under H2/Air indicated the absence of cathode thinning over 30k voltage cycles with a UPL/LPL of 1.0/0.6 VRHE at 80 °C, indicating a negligible cathode carbon-support corrosion for an LPL/UPL of 0.6/1.0 VRHE even under H2/Air.
On the other hand, a major difference between V-cycling ASTs in H2/N2 and H2/Air was observed with regards to membrane degradation when V-cycling ASTs were conducted at <100% RH. In this case, H2 crossover measurements indicate membrane pinhole formation under H2/Air (at 50 and 70% RH), while under H2/N2 no pinhole formation or membrane thinning was observed even when cycling at 30% RH. The former is ascribed to a combination of chemical ionomer degradation in the presence of air and to mechanical membrane degradation due to local RH fluctuations at the MEA plane when cycling under H2/Air between zero current (at the UPL of 1.0 VRHE) and high current density (at the LPL of 0.6 VRHE). Nevertheless, for all of the here explored V-cycling ASTs, no degradation of the proton conduction resistance in the cathode electrode (RH+, cath; measured by electrochemical impedance spectroscopy) was observed over the course of 30 k voltage cycles under any of the examined conditions, suggesting negligible ionomer degradation in the cathode electrode.
Over the course of the various V-cycling ASTs, differential-flow H2/O2 and H2/Air polarization curves were recorded at 80 °C/100% RH and 170 kPaabs in order to quantify the loss of the ORR activity, the increase of the oxygen mass transport resistance, and the decrease in H2/Air performance. This showed that the decay of the ORR mass activity and specific activity at 0.9 V (determined from a Tafel analysis of the H2/O2 polarization curves) as well as of the oxygen transport resistance ( determined from limiting current measurements) are independent of whether the V-cycling ASTs were conducted under H2/N2 or H2/Air and solely depend on the ECSA loss. An analysis of the HFR and RH+, cath corrected H2/O2 cell voltages plotted versus the logarithm of the specific current density (i.e., the current density normalized to the cathode Pt loading and ECSA, corrected by H2 crossover and shorting currents) reveals that the thus corrected H2/O2 polarization curves recorded over the course of all of the here examined V-cycling ASTs conducted between 30%-100% RH under H2/N2 or H2/Air overlap, confirming that the ECSA is a unique descriptor of the H2/O2 performance. The same was observed for the HFR, RH+, cath, and
  corrected H2/Air polarization curves.
As one would expect based on the above noted findings, the H2/Air cell voltage decay at a given current density was also observed to only depend on the cathode electrode roughness factor (i.e., the product of the ECSA and the Pt cathode loading in units of  ). This means that the H2/Air performance loss is independent of whether a given cathode electrode roughness factor (or ECSA) loss was achieved over a large number of voltage cycles (e.g., at 80 °C/70% RH) or over a smaller number of voltage cycles (e.g., at 80 °C/100% RH) under either H2/N2 or H2/Air. An analogous behavior was also observed previously when changing the UPL (0.85-1.0 VRHE) and the UPL hold time (1-8 s) for V-cycling ASTs conducted at 80 °C/100% RH.
36
Therefore, while for a given MEA the cathode electrode roughness factor loss with the number of voltage cycles depends on the actual V-cycling AST conditions, the H2/Air performance loss is a unique function of the cathode roughness factor loss, indicating that the governing Pt ECSA loss mechanisms in the cathode are the same under the investigated conditions (30%-100% RH, UPL of 0.85-1.0 VRHE, and cycling under H2/N2 or H2/Air). However, in contrast to V-cycling under H2/N2, V-cycling under H2/Air does lead to the formation of membrane pinholes when conducted at underhumidified conditions (specifically at 50 and 70% RH).
). This means that the H2/Air performance loss is independent of whether a given cathode electrode roughness factor (or ECSA) loss was achieved over a large number of voltage cycles (e.g., at 80 °C/70% RH) or over a smaller number of voltage cycles (e.g., at 80 °C/100% RH) under either H2/N2 or H2/Air. An analogous behavior was also observed previously when changing the UPL (0.85-1.0 VRHE) and the UPL hold time (1-8 s) for V-cycling ASTs conducted at 80 °C/100% RH.
36
Therefore, while for a given MEA the cathode electrode roughness factor loss with the number of voltage cycles depends on the actual V-cycling AST conditions, the H2/Air performance loss is a unique function of the cathode roughness factor loss, indicating that the governing Pt ECSA loss mechanisms in the cathode are the same under the investigated conditions (30%-100% RH, UPL of 0.85-1.0 VRHE, and cycling under H2/N2 or H2/Air). However, in contrast to V-cycling under H2/N2, V-cycling under H2/Air does lead to the formation of membrane pinholes when conducted at underhumidified conditions (specifically at 50 and 70% RH).
Acknowledgments
This work has been supported by the Austrian Research Promotion Agency (Österreichische Forschungsförderungsgesellschaft) grant No. 865181 (PROTECT), and the Fuel Cells and Hydrogen 2 Joint Undertaking under grant agreement No. 101007170 (MORELife). The authors would also like to thank Yan-Sheng Li and Ana Marija Damjanović (Chair of Technical Electrochemistry, Technical University of Munich, Germany) for fruitful discussions on ASTs development.