
Abstract
Fe-Ni alloy films with invar alloy compositions were electrodeposited from a stable citrate bath containing trivalent iron ions (Fe3+) as the sole iron source. This bath was prepared based on determining the equilibrium constants for acid dissociation, complex formation and precipitation reactions. Electrodeposition was conducted under galvanostatic conditions at 25 °C without agitation and an investigation was carried out into the effects of pH and current density on the composition and microstructure of the films. The results showed that ferric hydroxide (Fe(OH)3), which is normally poorly soluble, did not precipitate after electrodeposition. Fe-Ni alloy films containing 31‒42 mass% Ni (including Fe-36 mass% Ni) were formed with a current efficiency of approximately 70%. The films were smooth and were made up of grains with sub-micron sizes, although some cracks were observed. Fe and Ni were distributed homogeneously throughout the films and the Fe-Ni solid solutions exhibited both face-centered cubic and body-centered cubic structures.
Export citation and abstract BibTeX RIS

This is an open access article distributed under the terms of the Creative Commons Attribution 4.0 License (CC BY, http://creativecommons.org/licenses/by/4.0/), which permits unrestricted reuse of the work in any medium, provided the original work is properly cited.
Invar is an Fe-based alloy that is typically synthesized by metallurgical methods. It contains 36 mass% Ni and exhibits an extremely low coefficient of thermal expansion (2 × 10⁻⁶ K−1). 1 Therefore, Invar alloy has been used in practical applications such as precision mechanical equipment. In recent years, there has been considerable research into the formation of Invar alloys by electrodeposition. 2–17 Electrodeposited Fe-Ni-Co alloy films having so-called Super Invar compositions 18–21 and Invar Fe-Ni alloy/SiC composite films 22 have also been investigated. In this prior work, ferrous ions (Fe2+) rather than ferric ions (Fe3+) were used as the primary iron source in the electrodeposition baths. Electrodeposited Fe-Ni alloys other than Invar alloys, 23–33 and Fe-Ni system ternary alloys 34–36 other than Super Invar alloys, have also been widely researched, again mainly using Fe2+ ions as the iron source. This procedure has become the standard because Fe3+ ions readily form a minimally soluble hydroxide (Fe(OH)3, having a solubility product Ksp of 4 × 10−38) in aqueous solutions. Thus, there has been little research into the preparation of stable electrodeposition baths containing Fe3+ as the main iron source. However, Fe2+ ions in aqueous solutions are easily oxidized to Fe3+ ions by dissolved oxygen, and Fe(OH)3 is subsequently formed. For example, Osaka et al. demonstrated that Fe2+ ions in a Co-Fe alloy bath were oxidized to Fe3+ on a Pt anode via an anodic electrode reaction as well as by dissolved oxygen. 37 This same work also showed that the addition of trimethylamineborane (a reducing agent) to the bath inhibited the formation of Fe3+. 37 Brankovic et al. reported the effect of Fe3+ (and the resulting Fe(OH)3) on the magnetic properties of electrodeposited Co-Fe alloys in trials using an electrodeposition bath containing a small amount of Fe3+ in addition to Fe2+. 38 Nagayama et al. prepared an Fe-Ni alloy electrodeposition bath containing malonic acid, which acted as a masking/complexation agent for Fe3+ generated via an anode electrode reaction and by air oxidation of Fe2+. 13 Thus, the majority of Fe-Ni alloy electrodeposition baths reported to date have contained Fe2+ as the primary iron source together with reducing and/or complexation agents to inhibit the formation of Fe(OH)3.
However, there have recently been some reports on Fe alloy electrodeposition baths containing Fe3+ ions as the iron source. Su et al. studied the rapid electrodeposition of an Fe-Ni alloy from a chloride bath containing both Fe2+ and Fe3+ as iron sources. 32 In addition, Ge et al. prepared an Fe-Ni-Pt ternary alloy electrodeposition bath containing Fe3+ as the iron source. 39 This bath also contained NaNO2, (NH4)SO4, glycine and (NH4)2C6H6O7 (triammonium citrate). The present authors also previously studied a stable Fe-Pt alloy electrodeposition bath containing Fe3+ as an iron source and (NH4)3C6H5O7 as a complexing agent. 40 The citric acid molecule contains three carboxyl groups and so this compound was originally assumed to act as a tridentate ligand for Fe3+ ions. 41–43 However, at present, it is thought that citric acid can function as a tetrabasic acid (abbreviated herein as H4Cit) and thus can form complexes with Fe3+ while acting as a tetradentate ligand based on coordination of the carboxyl and hydroxyl groups. 44,45 Ferric-citrate complexes were previously examined by electrospray mass spectrometry, 45,46 and the stability constants for these species were determined. 46,47 However, this prior work was performed primarily in the field of biology and involved samples such as the xylem sap of plants. Therefore, these ferric-citrate complexes were present at very low concentrations (on the order of micromolar to millimolar) compared with the levels of metal ions in plating baths (on the order of several hundred millimolar to molar).
In the present work, a stable ferric-citrate solution with a high complex concentration (0.2 M) was prepared based on the equilibrium among acid dissociation, complex formation and precipitation processes. This solution was then used to produce a Fe-Ni alloy plating bath capable of generating an Invar alloy via electrodeposition. To the best of our knowledge, this is the first demonstration of the electrodeposition of Fe-Ni alloy films with an Invar composition from a stable plating bath containing only Fe3+ ions as the iron source.
Experimental
The fractions of various citric acid species were plotted against pH based on stepwise acid dissociation constants (Kan ), defining citric acid as a tetrabasic acid (H4Cit). It is known that pKan varies with the ionic strength of the solution. In the present work, because plating baths typically have very large ionic strengths, pKan for the three carboxyl groups of H4Cit was assigned values of pKa1 = 2.82, pKa2 = 4.1 and pKa3 = 5.1. These values represent those reported in the literature for the highest ionic strength of 2 M. 48,49 However, it should be noted that the ionic strength of all solutions used in the present work was greater than 2 M. In addition, pKa4 = 14.4 49 was assigned to the hydroxyl group of citric acid. A conditional stability constant—pH diagram for the various ferric-citrate complexes was also generated based on the fraction of Cit4− and the stability constants for the main ferric-citrate complexes at different pH values. 46 The concentration of the aqua complex formed between Fe3+ and water (Fe(H2O)6 3+), which does not interact with citrate ions, was calculated from this diagram and an ionic product—pH plot for Fe(OH)3 was then produced. These data were generated using Fe3+ and citrate concentrations of 0.2 and 0.4 M, respectively (that is, with a Fe3+:citrate molar ratio of 1:2). The stable pH range for these ferric-citrate complexes was estimated from this plot. Stability tests of 0.2 M FeCl3·6H2O + 0.4 M Na3C6H5O7 solutions at various pH values were conducted at room temperature. The appearance of each solution was observed immediately after preparation and following a one-day interval. The Fe-Ni alloy electrodeposition bath was prepared on the basis of these stability tests and the bath composition used in the present study is summarized in Table I. In this work, H3BO3 was used as a buffer and the bath pH was adjusted to 2–4 by the addition of a HCl solution. Pure Cu substrates (C1020) with an exposed surface area of 10 cm2 (3 × 3.33 cm) were used as substrates. A Pt-plated Ti plate was used as the anode, and trials were performed in an electrolysis cell of our own design constructed from acrylic plates with internal dimensions of 7 × 3 × 6 cm. The distance between the cathode and anode in this apparatus was approximately 7 cm and electrodeposition was carried out under galvanostatic conditions at 25 °C without stirring, using a total electrical charge of 1000 C. The composition of each electrodeposited film was quantified by X-ray fluorescence spectroscopy (XRF) using a Rigaku, ZSX Primus II wavelength-dispersive spectrometer. The surface morphology and cross-sectional elemental distribution for each film was determined using field-emission scanning electron microscopy (FE-SEM: JEOL, JSM-7000F) together with energy-dispersive X-ray spectroscopy (EDS: JEOL, JED-2300). The crystal structures of the films were evaluated by X-ray diffraction (XRD: Shimadzu, XRD-6100).
Table I. Bath composition.
| Chemical | Concentration (M) |
|---|---|
| FeCl3·6H2O | 0.2 |
| NiCl2·6H2O | 0.4 |
| Na3C6H5O7 | 0.4 |
| H3BO3 | 0.5 |
Results and Discussion
The fraction of citric acid species (H4Cit, H3Cit−, H2Cit2−, HCit3−, and Cit4−) is a function of pH. For example, the fraction of Cit4− (αCit4−) is given by:

Figure 1 shows the relationship between the fractions of the various citric acid species and pH. It can be seen that in acidic solutions, no Cit4− is present and other species are dominant depending on the pH. In basic solutions, HCit3− is generally dominant, but there is evidence of an increase in the Cit4− fraction for pH >12.

Figure 1. Fractions of various citric acid (H4Cit) species as functions of pH.
Download figure:
Standard image High-resolution imageSilva et al. reported that dinuclear (Fe2(Cit)2 2−) or trinuclear species (Fe3(Cit)3 3−) are more common at lower pH, whereas the mononuclear dicitrate complex (Fe(Cit)2 5−) is predominant at neutral pH, and that the pH range in which these species are the main components depends on both the concentration of the ferric-citrate complex and the Fe3+:citrate molar ratio. 46 These three complexes consist of Fe3+ and Cit4−, which is a deprotonated species. In this study, for simplicity, it is assumed that Fe3+ ions form complexes with only Cit4− in acidic and neutral solutions. The stability constant for the ferric- Cit4− complex is affected by the acid-dissociation equilibrium for citric acid (H4Cit). The equilibrium state can be expressed by:
Therefore, the conditional stability constants that reflect the effect of acid-dissociation equilibrium should be considered. In previous studies, the stability constants for ferric-citrate complexes were determined at very low concentrations (on the order of micromolar to millimolar) and large Fe3+:citrate molar ratios (such as 1:10). 45,46,50 Silva et al. reported that the overall stability constants (β) for the three ferric-citrate complexes were logβ(Fe2(Cit)2 2−) = 48.0, logβ(Fe3(Cit)3 3−) = 73.8 and logβ(Fe(Cit)2 5−) = 32.73. 46 The conditional stability constants (βʹ) for each ferric-citrate complex were determined using Eq. 2 (see Eq. 1)

In the present work, the pH ranges over which Fe2(Cit)2 2− or Fe3(Cit)3 3− and Fe (Cit)2 5− were the main species were assumed to be 1–6 and 5–8, respectively.
Figure 2 plots the logβʹ values for the primary ferric-citrate complex species as functions of pH. The βʹ values for the Fe2(Cit)2 2− and Fe3(Cit)3 3− complexes that were predominant at low pH were found to be large, especially for Fe3(Cit)3 3−. The concentration of the Fe(H2O)6 3+ complex was determined from the βʹ value, and the ionic product [Fe3+][OH−]3 was then calculated for various pH. During these calculations, the total Fe3+ species concentration and the total citric acid species concentration were set to 0.2 and 0.4 M, respectively.
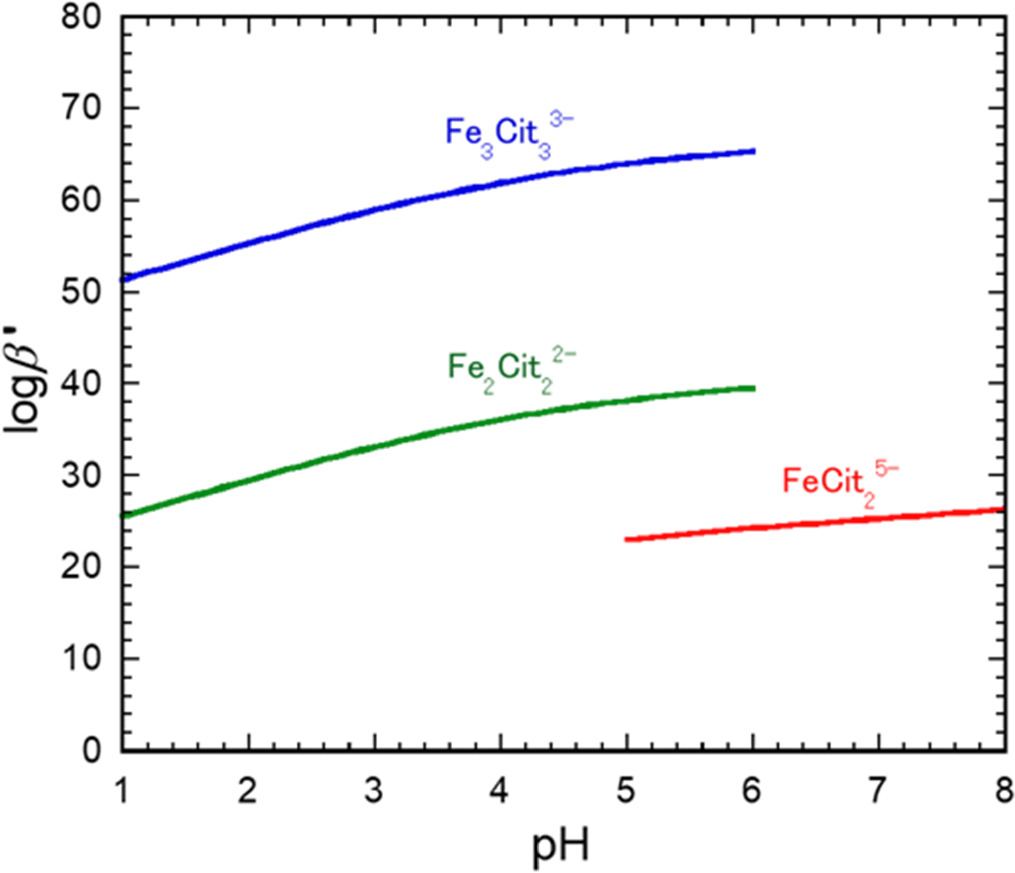
Figure 2. Log values of conditional stability constants, βʹ, for most common ferric-citrate complexes as functions of pH.
Download figure:
Standard image High-resolution imageFigure 3 shows the relationship between log([Fe3+][OH−]3) and pH for the primary ferric-citrate complexes. The dashed line indicates the log of the solubility product for Fe(OH)3 (Ksp = 4 × 10−38). At lower pH where Fe2(Cit)2 2− or Fe3(Cit)3 3− was predominant, the values of log([Fe3+][OH−]3) were determined to be much smaller than logKsp for Fe(OH)3. In contrast, at neutral pH, where Fe(Cit)2 5− was the main complex, the values of log([Fe3+][OH−]3) were similar to logKsp for Fe(OH)3. Therefore, we considered that although Fe(OH)3 is poorly soluble, it does not precipitate in the pH range of 1–6.
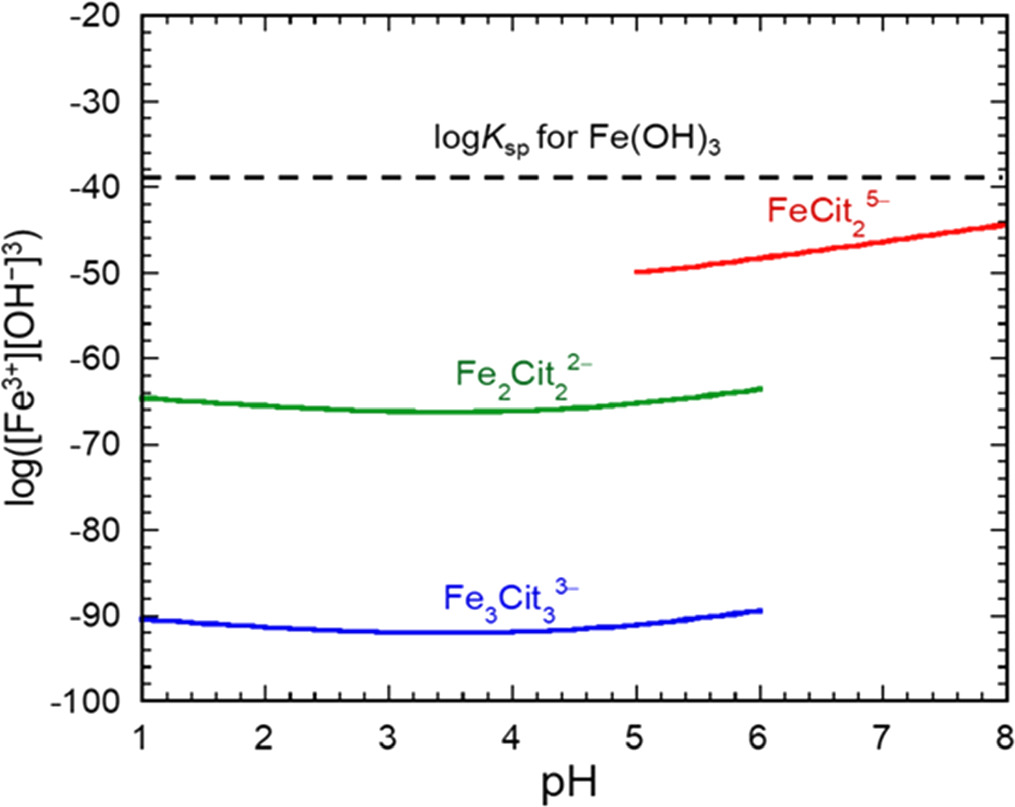
Figure 3. Log values of ionic products, [Fe3+][OH−], 3 for most common ferric-citrate complexes as functions of pH, using concentrations of total Fe3+ species and total citric acid species of 0.2 and 0.4 M, respectively. The dashed line shows the log of the solubility product of Fe(OH)3 (Ksp= 4 × 10–38).
Download figure:
Standard image High-resolution imageFigure 4 provides photographic images showing the appearance of ferric-citrate solutions having various pH values, produced using Fe3+ and citrate concentrations of 0.2 and 0.4 M. The as-prepared solutions in Fig. 4a exhibit greater precipitation of Fe(OH)3 at a pH of 5 or greater, such that the solutions were transparent at pH values below 4, with a light green coloration within the pH range of 2–4 and a dull green color at a pH of 1. After standing for one day, the pH range over which the solutions were transparent expanded to include a pH of 5, likely because some time was required for the solutions to reach equilibrium. After this point, the appearance of the solutions did not change with further aging. These results roughly agree with the estimated stable pH range in Fig. 3. At a pH of 1, ferric citrate complex ions are not likely to be these oligomeric complexes but other complex ions such as Fe(HCit) 46 and/or Fe(H2O)6 3+. Thus, these ferric-citrate solutions were stable in the pH range of 2–4.

Figure 4. Photographic images of 0.2 M FeCl3 · 6H2O + 0.4 M Na3C6H5O7 solutions having various pH values (a) immediately after preparation and (b) after standing for one day.
Download figure:
Standard image High-resolution imageThe Fe-Ni alloy plating bath used in this work (see Table I) was found to be stable. As noted, H3BO3 was added to this bath as a buffer to inhibit the precipitation of Fe(OH)3 and/or Ni(OH)2 at the cathode surface during electrodeposition.
Figure 5 shows the appearance of Fe-Ni alloy plating bath specimens having various pH values. Immediately after preparation, the bath solution was transparent and deep green over the pH range of 2–4 (Fig. 5a) and the appearance did not change following one day of standing (Fig. 5b). In this solution, Fe3+ was likely present as [Fe2(Cit)2]2− or [Fe3(Cit)3]3− complexes. In contrast, Ni2+ ions are known to combine with citric acid to form mononuclear monocitrate complexes such as NiH2Cit+, NiHCit and NiCit− in the same pH range. 51 The stability constants for these Ni-citrate complexes for a Ni2+:citrate molar ratio of 1:1 are much smaller than those for ferric-citrate complexes (logK(NiH2Cit)+ = 1.5, logK(NiHCit) = 3.35 and logK(NiCit)—= 5.49). 52 Therefore, for the present Fe-Ni alloy plating bath, Ni2+ was likely to be present as Ni(H2O)6 2+ and as citric complex ions such as Ni(Cit)–.
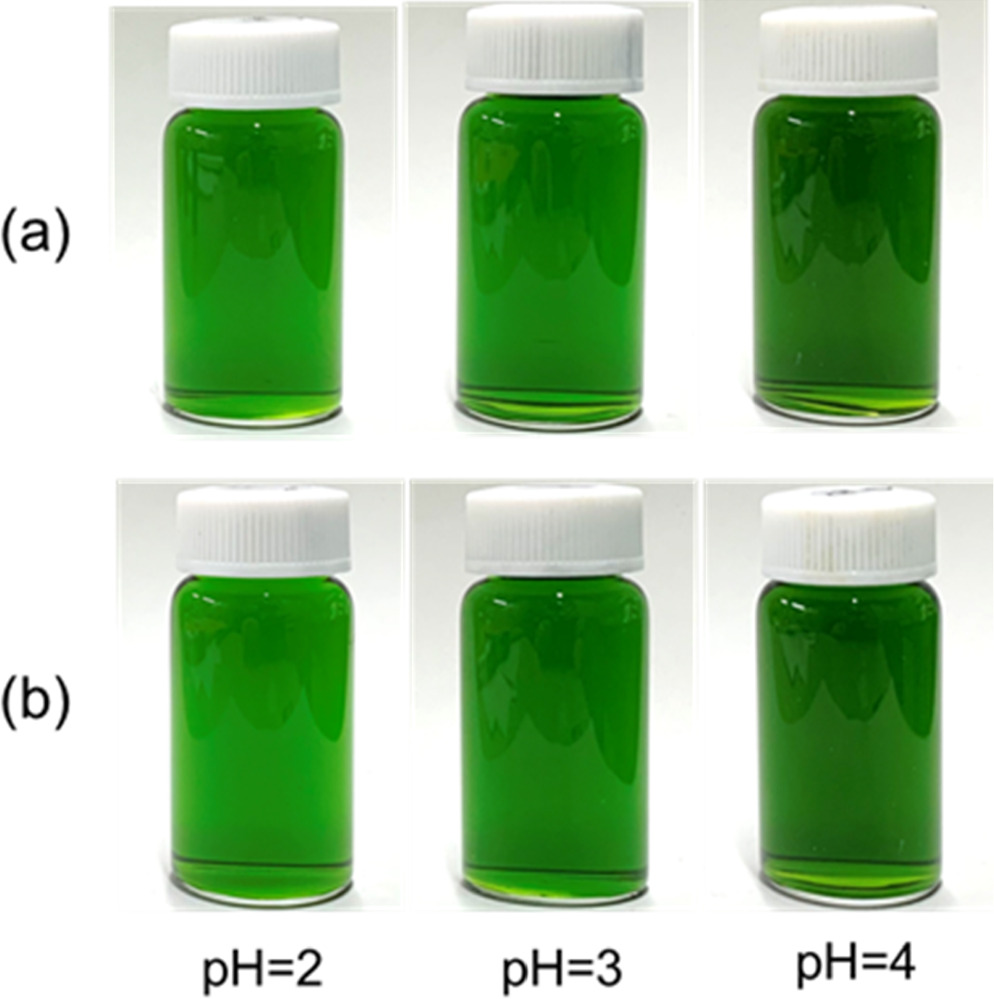
Figure 5. Photographic images of Fe-Ni alloy plating bath solutions (0.2 M FeCl3 + 0.4 M NiCl2 + 0.4 M Na3C6H5O7 + 0.5 M H3BO3) having various pH values (a) immediately after preparation and (b) after standing for one day.
Download figure:
Standard image High-resolution imageElectrodeposition was carried out at various current densities using plating baths with different pH values. The appearance of the plating bath did not change even after electrodeposition, indicating that Fe(OH)3 was not precipitated and the solution was stable. The effects of both the current density and bath pH on the Ni content in the electrodeposited Fe-Ni alloy films are shown in Fig. 6. Note that the dashed line in this figure indicates the composition of a Fe-36 mass% Ni specimen corresponding to a perfect Invar alloy. The Ni proportions in the electrodeposited films were in the range of 31–42 mass% and so were close to the desired value of 36 mass%. Note also that an Fe-36 mass% Ni film was formed at 35 mA cm−2 using a bath having a pH of 4. The Ni concentrations in these films slightly increased with increases in both current density and pH. Because the Fe-Ni alloy electrodeposition mechanism is complicated (involving the well-known anomalous codeposition phenomenon), 53,54 an explanation for this apparent change in the Ni content is not presented herein.

Figure 6. Ni content in Fe-Ni alloy films produced at various pH values as functions of current density.
Download figure:
Standard image High-resolution imageThe electrodeposition reactions of Fe and Ni are three and two electron processes, respectively. Consequently, the deposition current efficiency (CE) could be calculated as

where F is the Faraday constant (96,485 C mol−1), WFe-Ni is the mass of the deposited Fe-Ni alloy film, WRFe is the mass-based proportion of Fe in the Fe-Ni alloy film, WRNi is the mass-based proportion of Ni in the film, AWFe is the atomic weight of Fe (55.85 g mol−1), AWNi is the atomic weight of Ni (58.69 g mol−1), and AE is the amount of electricity passed through the bath (1000 C). Figure 7 shows the dependence of CE on both the current density and bath pH, and indicates CE values of approximately 70% for each set of conditions. This less than ideal CE can likely be attributed to the reduction of H+ ions to H2 and the reduction of Fe3+ ions to Fe2+.
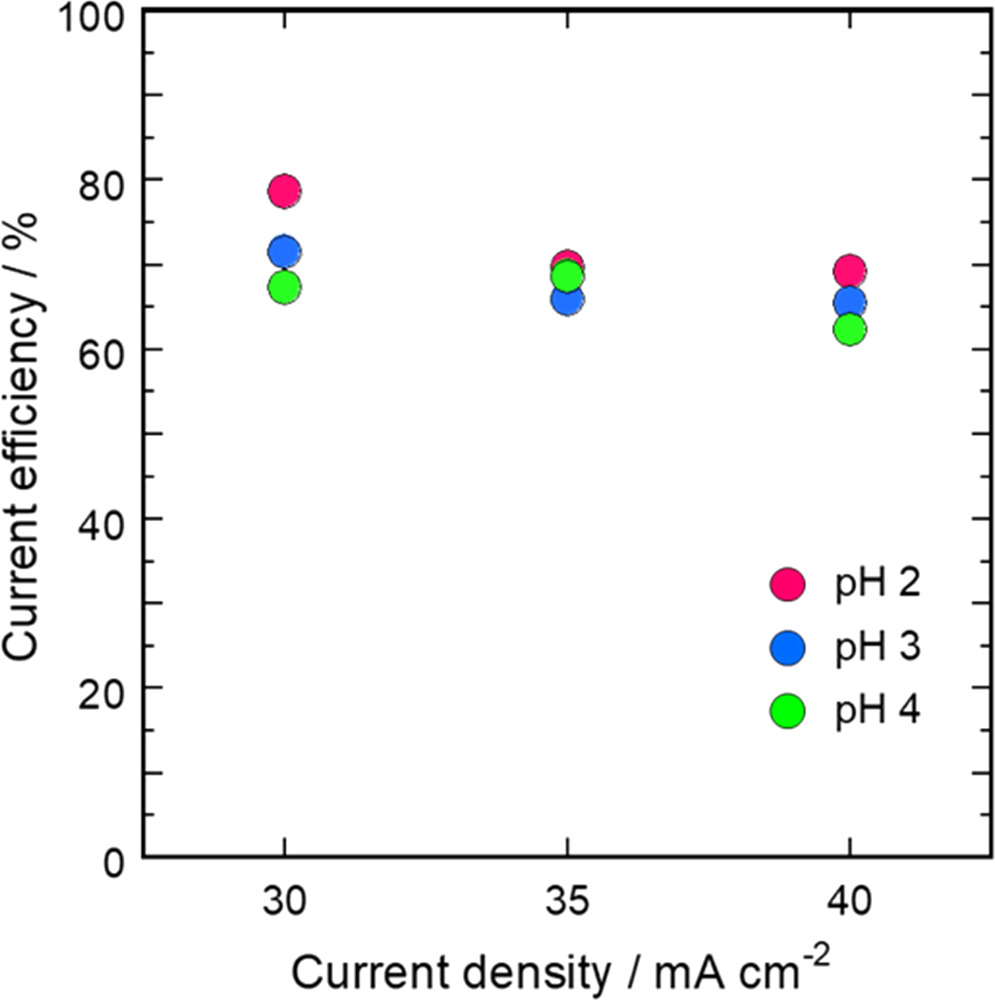
Figure 7. Current efficiency values at various pH as functions of current density.
Download figure:
Standard image High-resolution imageFigure 8 presents an SEM image of the surface of an Fe-36 mass% Ni alloy film electrodeposited at 35 mA cm−2 using a plating bath with a pH of 4. Although the surface of this sample appears smooth, some cracks can be seen (Fig. 8a). It is also apparent that the film consisted of small grains with diameters in the range of 100–200 nm (Fig. 8b). The other alloy films with different compositions (as shown in Fig. 6) were found to have similar surface morphologies.

Figure 8. SEM images of surface of Fe-36 mass% Ni alloy film acquired at (a) low and (b) high magnification.
Download figure:
Standard image High-resolution imageA cross-sectional SEM image and elemental mapping results for the Fe-36 mass% Ni alloy film are shown in Fig. 9. This film was evidently compact and contained no obvious defects such as voids (Fig. 9a). Both Fe and Ni were distributed uniformly throughout the film (Figs. 9b–9d), suggesting that this specimen comprised a solid solution of the two metals.

Figure 9. Results from cross-sectional elemental mapping of Fe-36 mass% Ni alloy film: (a) SEM image and maps showing (b) Cu, (c) Fe and (d) Ni distributions.
Download figure:
Standard image High-resolution imageXRD patterns for films with different compositions (see Fig. 6) are provided in Fig. 10, in order of increasing Ni content. All the diffraction peaks can be assigned to body-centered cubic (bcc) or face-centered cubic (fcc) structures of Fe-Ni alloy solid solutions (Fig. 10a). Figure 10b shows XRD patterns in the narrow diffraction angle range of 40° to 50°. Here, the peaks at 2θ = 43.6° and 44.7° are assigned to fcc and bcc structures, respectively, and the bcc peak is predominant in the case of the 31 mass% Ni sample, which had the lowest Ni content. Both the bcc and fcc peaks are seen for a Ni content of 33 to 38 mass%. In the case of the sample containing 42 mass% Ni, which was the highest Ni content, the fcc peak is the most intense. Thus, the strongest peak reflected the composition of the Fe-Ni alloy film. The stable phase of an Invar alloy is the fcc phase 55 and so the Fe-36mass% Ni alloy film formed in this study was a metastable phase. Previous studies have identified different primary phases in electrodeposited films having the Invar composition. 4,10,13 Grimmett et al. showed that the phase that was obtained depended on the electrodeposition conditions. Specifically, a mixture of bcc and fcc structures was obtained following direct current deposition, 4 similar to the present results. In contrast, Tabakovic and Nagayama reported that a single bcc phase was found in Invar composition Fe-Ni alloy films, but that heat treatment of these specimens transformed the metastable bcc phase to a stable fcc single phase. 10,13 Although it remains unclear why different primary phases can be formed in this alloy, both the bath composition and the electrodeposition conditions (such as bath temperature and cathode overpotential) are likely to have an effect.

Figure 10. XRD patterns of Fe-Ni alloy films; (a) wide 2θ range: 40–100 degrees, (b) narrow 2θ range: 40–50 degrees.
Download figure:
Standard image High-resolution image
In future work, we intend to clarify the mechanism by which such films are generated by electrodeposition and evaluate the coefficients of thermal expansion for these films after suppressing the formation of cracks.
Conclusions
In the present study, a novel Fe-Ni alloy plating bath was prepared that contained only Fe3+ ions as the iron source together with citrate as a complexing agent. The intent was to mitigate serious problems related to the precipitation of Fe(OH)3 owing to the oxidation of Fe2+ ions to Fe3+ ions during electrodeposition in conventional Fe-Ni alloy plating baths. The composition of this bath was established on the basis of equilibrium constants and the solution was shown to be stable over the pH range from 2 to 4. No Fe(OH)3 precipitation was observed even after electrodeposition and an Fe-Ni alloy film having an Invar composition (that is, Fe-36 mass% Ni) was produced using this bath. Although cracks were seen in the specimen, the film had a compact morphology and uniform composition. The film was determined to possess a metastable bi-phase structure consisting of fcc and bcc phases comprising an Fe-Ni alloy solid solution. The method used to prepare a stable Fe-Ni alloy plating bath incorporating citrate as a complexing agent for Fe3+ ions demonstrated in this study could potentially be employed to produce other materials such as permalloy films. In addition, this technique is a promising approach to the formation of other Fe-based alloy plating films.