
Abstract
Because polymer electrolyte fuel cell (PEFC) systems for vehicles are stand-alone systems, the net water drag coefficient ( ) is an essential index in water management and must be negative even during high temperature operation above 100 °C. In this study, to verify the water balance in the cell during high temperature operation, the effect of operating temperature on the current density (
 ) -
) -  characteristics under gas supply conditions similar to those of a real system was examined experimentally, where the water amount supplied to and discharged from the cell was measured at a cell temperature (Tcell) of 80, 100, and 120 °C. The experimental results obtained here indicates that the gas supply conditions to keep
  negative becomes more limited as Tcell is increased. This indicates that the relative humidity of supplied hydrogen should be kept low and that the stoichiometric ratio of hydrogen should be kept high. Furthermore, the effect of membrane thickness (
 ) on
) on  became more pronounced when Tcell exceeded 100 °C, indicating that operation at 120 °C is not realistic for PEFCs that use a 30-μm-thick proton exchange membrane.
Export citation and abstract BibTeX RIS

This is an open access article distributed under the terms of the Creative Commons Attribution Non-Commercial No Derivatives 4.0 License (CC BY-NC-ND, http://creativecommons.org/licenses/by-nc-nd/4.0/), which permits non-commercial reuse, distribution, and reproduction in any medium, provided the original work is not changed in any way and is properly cited. For permission for commercial reuse, please email: permissions@ioppublishing.org.
The expansion of zero-emission vehicles (ZEVs) is essential for the realization of a carbon-neutral society. Among several kinds of ZEV, fuel cell vehicles (FCVs) would be the most convenient due to their long cruising range and short refueling time. Polymer electrolyte fuel cells (PEFCs) are the most realistic power source for FCVs due to their power generation performance and ease of operation. Several companies have already introduced PEFC-powered passenger vehicles and/or forklifts to the market. 1–3 Today, in order to convert not only passenger vehicles but also heavy duty vehicles (HDVs) such as trucks and buses into ZEVs, attempts are underway to apply PEFC systems as a power source for HDVs. However, applying PEFCs to HDVs requires improvement in the power density and heat removal performance of PEFC systems. One way to overcome those challenges is to operate PEFCs at high temperatures above 100 °C; and research and development on high-temperature PEFC operation has been actively pursued. 4–7
For high-temperature operation of PEFCs, although the development of membranes and ionomers with high heat resistance is a major issue,
8–11
here we focus on water management during high-temperature operation. The increase in operating temperature of PEFCs would lead to a decrease in the relative humidity (RH) in the cell due to the increase in saturated vapor pressure. Even at high temperatures above 100 °C, the water content in the membrane is expected to depend on RH of the ambient gases, and thus the membrane would be drier at higher operating temperature (≥100 °C) than at conventional operating temperatures (≤80 °C). Because the PEFC system for vehicles is a stand-alone system, the only source of water to humidify the membrane and catalyst layer is produced water. Figure 1 shows a schematic of a PEFC system for vehicles designed to operate at temperatures over 100 °C. At the cathode, the produced water would be discharged to the outside by the cathode gas (air), and an external humidity exchanger must be used to humidify the supply cathode gas. As for the anode side, a circulation line would be installed, and some of the exhaust hydrogen (H2) would be merged with fresh H2 by a circulation pump and supplied back to the anodes. Because there is no way to humidify the hydrogen supplied to the anodes, the anode-side of the membrane would risk drying out. Therefore, it is necessary to humidify the anodes by water transport through the membrane, which is defined by the balance of electro-osmotic drag and back-diffusion based on concentration gradients. To avoid anode dry-out, the entire cell must be kept in a state where the flux of back-diffusion is greater than that of electro-osmotic drag, namely, the net water drag coefficient ( ) must be negative.
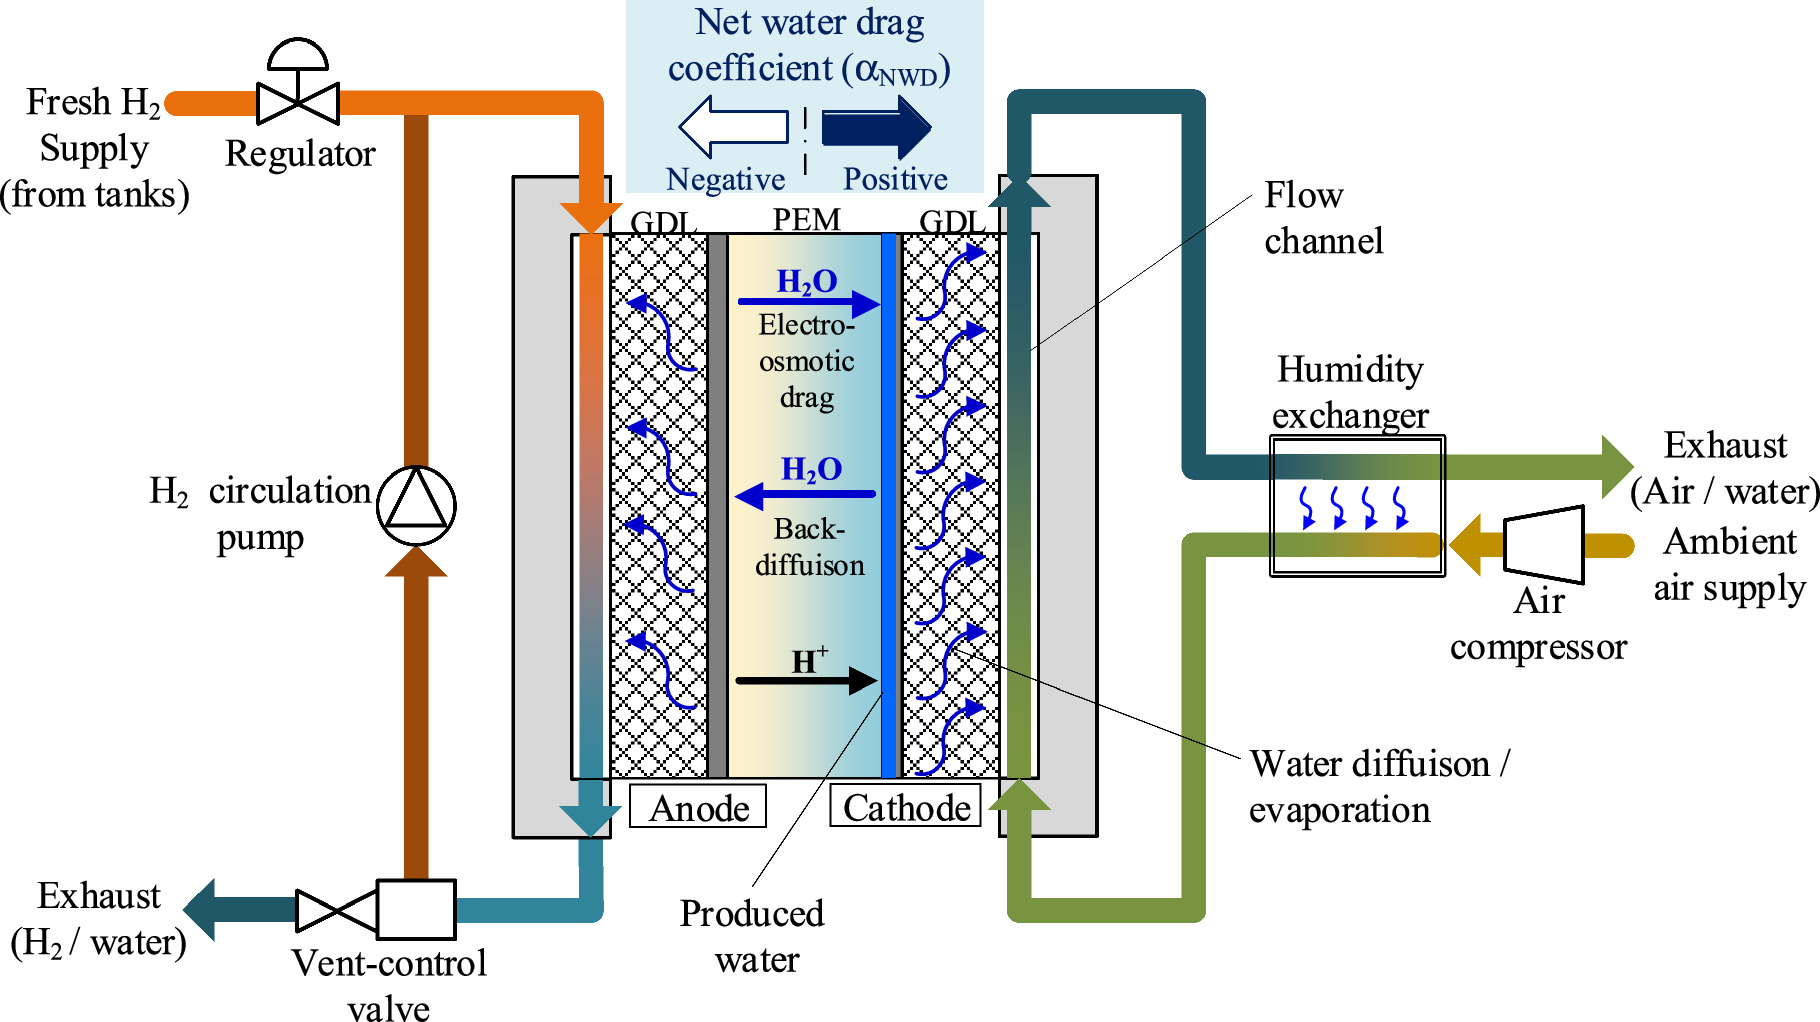
Figure 1. Schematic of gas supply and water transport in PEM for PEFC systems. Here, GDL is gas diffusion layer and PEM is proton exchange membrane.
Download figure:
Standard image High-resolution imageAs mentioned above, PEFC systems for vehicles are stand-alone systems, which imposes certain restrictions on the flow rate and RH of the gases (H2 and air) supplied to the cell/stack even during operation in the conventional temperature range (i.e., ≤80 °C). The power of the cathode air compressor is relatively large, potentially exceeding 10% of the net output of the PEFC stack.
12
Therefore, the flow rate of air supply must be limited to a stoichiometric ratio ( ) below 1.5 to save the power consumed by the air compressor. For the anode H2, the flow rate would be also controlled by the stoichiometric ratio (
 ), which would be kept below 1.5 to save power for the circulation pumps and due to the presence of impurities due to cross permeation through the membrane.
13,14
Note that
), which would be kept below 1.5 to save power for the circulation pumps and due to the presence of impurities due to cross permeation through the membrane.
13,14
Note that  defined here is the stoichiometric ratio of the hydrogen flowing into the cell, which is the total flow rate of the recycled H2 and the fresh H2 supplied from the cylinder. The PEFC system in the current Toyota Mirai is not equipped with an external humidifier,
15
so the RH of the air supplied to the cathode (
defined here is the stoichiometric ratio of the hydrogen flowing into the cell, which is the total flow rate of the recycled H2 and the fresh H2 supplied from the cylinder. The PEFC system in the current Toyota Mirai is not equipped with an external humidifier,
15
so the RH of the air supplied to the cathode ( ) should be below 10%. Because the maximum operating temperature of the PEFC stack of the current Mirai must be around 80 °C, operation at such low
  would be possible. However, as shown in Fig. 1, installation of an external humidifier to pre-humidify the cathode air is therefore no longer needed when the operating temperature of the stack exceeds 100 °C. Even if an external humidifier is installed, the
  is expected to remain below 30% due to limited efficiency of humidity exchange and higher operating temperatures. The RH of hydrogen at the anode inlet (
 ) depends on the operating conditions and is difficult to predict. However, because water is supplied to the anodes only by water diffusion through the membrane,
  should be equal to or lower than
  In summary, the flow rate and RH of supplied gases are limited to below certain values in an actual PEFC system due to the constraints of maintaining overall efficiency and the performance of humidity exchange; namely, the gas flow rate to both sides (anode and cathode) should be less than 1.5 of the stoichiometric ratio (
 and
and  ), and the RH of supplied gases for both sides (i.e.,
  and
and  ) is expected to be below 30%. It should be noted that in a real system, it is difficult to control the stoichiometric ratio and RH independently for both gases (H2 and air). In general, increasing the stoichiometric ratio leads to a decrease in RH. However, the stoichiometric ratio and RH of the gases supplied to the cells in a real system are expected to be in these ranges.
To identify the value of  for each cell unit, it is necessary to measure the amount of water per unit of time that accompanies the gases entering and leaving the cell. Via such measurements, previous studies examined the dependence of
  on the specifications of the cell components (membrane and gas diffusion layer) and cell operating conditions (cell temperature, pressure, flow rate and relative humidity of the inlet gases).
16–40
Among those studies, several investigated the current density (
on the specifications of the cell components (membrane and gas diffusion layer) and cell operating conditions (cell temperature, pressure, flow rate and relative humidity of the inlet gases).
16–40
Among those studies, several investigated the current density ( ) dependence of
  under gas supply conditions similar to the real system described earlier in this section.
19,20,23,24
The
under gas supply conditions similar to the real system described earlier in this section.
19,20,23,24
The  characteristics presented in those studies revealed that
  tended to decrease with increasing
  and that
  tended to stabilize when
  exceeded a certain value (c.a., 0.5 A cm−2). However, there have been no previous studies of
  measurements at operating temperatures above 100 °C under the gas supply conditions (flow rate and RH) expected to be applied in the real system described above.
We previously conducted experimental studies to measure  under various operating conditions using a single cell (25 cm2).
41–43
First, we evaluated the
under various operating conditions using a single cell (25 cm2).
41–43
First, we evaluated the  –
– characteristics under cathode dry conditions at Tcell = 60 °C, when
  = 2 or 3 at the cathode and at a constant H2 flow rate of 0.5 NL min−1 at the anode.
41
The measured
= 2 or 3 at the cathode and at a constant H2 flow rate of 0.5 NL min−1 at the anode.
41
The measured  characteristics confirmed that
  could be kept negative in the measurement range of
  (≤1.4 A cm−2), though
  increased with increasing
  Second, we evaluated the temperature dependence of
  characteristics in a Tcell range from 80 °C to 120 °C, when either a Nafion or Aquivion membrane (50-μm thickness) was used as an electrolyte and when
  = 2 or 4 at the cathode and the flow rate of H2 at the anode was constant (0.4 NL min−1).
42
Our results clearly demonstrated that
= 2 or 4 at the cathode and the flow rate of H2 at the anode was constant (0.4 NL min−1).
42
Our results clearly demonstrated that  increased with increasing
  and was positive in almost the entire
  range at
  = 120 °C. Although these two studies
41,42
provided a great deal of knowledge about
= 120 °C. Although these two studies
41,42
provided a great deal of knowledge about  the gas supply conditions differed from those in a real system, because the flow rate and/or RH of supplied gases was too high. Third, the
  characteristics were measured at Tcell = 80 °C under conditions similar to those of the gas supply in a real system, that is, standard conditions were 1.5 for both
  and
and  and 30% for both
  and
and  43
Measured
43
Measured  characteristics in which the relative humidity of discharged H2 from the anode (
 ) was constant at around 100%, showed that
  was stable when
  exceeded a certain threshold. The value of
  in this stable region was generally negative and particularly sensitive to changes in
  These measurements also suggested that in the
  stable region, almost the entire area of the membrane was fully hydrated, and the effect of back diffusion on
  became negligible at Tcell = 80 °C.
The objective of this study was to verify the effect of increasing the operating temperature on the water balance in the cell under gas supply conditions similar to those of a real system. The net water drag coefficient ( ) was selected here as an index of the water balance, and the
  characteristics were obtained experimentally at Tcell = 80 °C, 100 °C, and 120 °C. In addition, the gas supply conditions to produce a negative
  even at an operating temperature of 120 °C were examined.
Experimental
Cell set-ups
A single cell was used to measure the  −
− characteristics under various operating conditions. The cell used in this study was identical to those used in our previous studies
42,43
and had an electrode area of 25 cm2 (50 × 50 mm, square). The bipolar plates (separators) of both sides anode and cathode were made of graphite for high-temperature applications, and the geometry of the flow field was "serpentine-dual" with a channel and rib width of 1 mm and a channel depth of 0.5 mm. The flow direction of both the anode gas (H2) and cathode gas (air) was set at a "counter-flow" configuration. The same commercial catalyst-coated membranes (CCMs) as in previous studies
41,43
were applied in this study. The membrane used in the CCMs was made of perfluorosulfonic acid (PFSA) polymer and reinforced with expanded polytetrafluoroethylene (ePTFE). Two types of CCM with different membrane thicknesses (tmem) were incorporated into the cell for the experiment, that is, 15 and 30 μm (for Cell-1 and Cell-2, respectively). Because both types of CCMs were obtained from the same vender, the catalyst layer specifications were the same for both CCMs, with a platinum (Pt) loading of 0.1 and 0.4 mg cm−2 for the anode and cathode, respectively. For the gas diffusion layer (GDL), a Sigracet product (SGL28BC) with microporous layer coated on one side, was used for both sides of anode and cathode. The cell was assembled under compression of about 3 MPa with Teflon gaskets.
characteristics under various operating conditions. The cell used in this study was identical to those used in our previous studies
42,43
and had an electrode area of 25 cm2 (50 × 50 mm, square). The bipolar plates (separators) of both sides anode and cathode were made of graphite for high-temperature applications, and the geometry of the flow field was "serpentine-dual" with a channel and rib width of 1 mm and a channel depth of 0.5 mm. The flow direction of both the anode gas (H2) and cathode gas (air) was set at a "counter-flow" configuration. The same commercial catalyst-coated membranes (CCMs) as in previous studies
41,43
were applied in this study. The membrane used in the CCMs was made of perfluorosulfonic acid (PFSA) polymer and reinforced with expanded polytetrafluoroethylene (ePTFE). Two types of CCM with different membrane thicknesses (tmem) were incorporated into the cell for the experiment, that is, 15 and 30 μm (for Cell-1 and Cell-2, respectively). Because both types of CCMs were obtained from the same vender, the catalyst layer specifications were the same for both CCMs, with a platinum (Pt) loading of 0.1 and 0.4 mg cm−2 for the anode and cathode, respectively. For the gas diffusion layer (GDL), a Sigracet product (SGL28BC) with microporous layer coated on one side, was used for both sides of anode and cathode. The cell was assembled under compression of about 3 MPa with Teflon gaskets.
Measurements of cell performance and water balance
The objective of this study was to measure the water balance under gas supply conditions similar to those of a real PEFC system as presented in Fig. 1. However, in the present measurement system, neither an anode circulation line nor a cathode humidity exchanger was installed, and both anode and cathode gases (H2 and air) were supplied in a one-way direction. Figure 2 shows a schematic of the measurement system used in this study. The flow rate of supplied dry gases (H2/air) for each electrode (anode/cathode) (i.e.,  and
and  ) was regulated by a digital flow controller, respectively. The dry gas (H2 or air) was humidified to the target dew point by passing through a respective bubbling tank (humidifier) in which water temperature was regulated by the heater covering the tank. The dew point of each gas at the cell inlet (
 and
and  ) was continuously monitored by a mirror-type dew point meter (DPM) installed in each pipeline. In the experiment, the temperature of the pipeline from the tank to the cell was also carefully controlled by using a wrapping heater, so that
  and
and  were restrained within ±1 °C of the target value (the error of RH was approximately within ±1.5%). Target values for the humidifying gas dew point at each RH are summarized in Table SI. As for the dew point measurements at the outlet, our previous study using the same type of measurement system
43
showed that due to the high content of water, the condensation of water vapor could not be avoided at the cathode outlet even when the pipeline was heated, and thus, the dew point of discharged air at cathode (
were restrained within ±1 °C of the target value (the error of RH was approximately within ±1.5%). Target values for the humidifying gas dew point at each RH are summarized in Table SI. As for the dew point measurements at the outlet, our previous study using the same type of measurement system
43
showed that due to the high content of water, the condensation of water vapor could not be avoided at the cathode outlet even when the pipeline was heated, and thus, the dew point of discharged air at cathode ( ) could not be measured properly. Therefore, in this experiment, a DPM was not installed at the cathode outlet, but only at the anode outlet to measure the dew point of discharged H2 (
 ). The three DPMs (installed in the anode inlet/outlet and cathode inlet) used here were all capable of measuring dew points up to 120 °C (Optidew401, Michell Instruments). The pressures of inlet/outlet at anode and cathode (
 /
/ and
and  /
/ ) were continuously monitored by pressure transducers (HL, Sensez), and the outlet pressures of both the anode and cathode sides were controlled by a respective back pressure regulator installed at the ends of the outlet pipelines. The Tcell was controlled by plate heaters attached to both end plates.

Figure 2. Schematic of experimental setup to measure net water drag coefficient ( ) of PEFCs: (1) fuel cell (PEFC), (2) plate heater of the cell, (3) wrapping heater, (4) dew-point meter (DPM), (5) pressure gauge (transducer), (6) gas bubbling tank (humidifier), (7) digital flow controller, and (8) back-pressure regulator.
Download figure:
Standard image High-resolution imageIn this experiment, cell operation tests were conducted at Tcell = 80 °C, 100 °C, and 120 °C for both Cell-1 and Cell-2. The flow rates of supplied gas on both sides (H2 at anode and air at cathode) were controlled at a constant stoichiometric ratio, that is, the stoichiometric ratio of H2 at anode ( ) and that of air at cathode (
 ) were set at 1.5. However, in order to verify the effect of
  on
on  an additional test with
  = 2.0 was also performed with Cell-1 only at Tcell = 120 °C, whereas
  was kept at 1.5. In the experiments using Cell-1, the RH of supplied H2 at the anode inlet (
 ) was set to 20, 30, and 40% at each Tcell, whereas the RH of supplied air at cathode inlet (
 ) was set to 30%. Experiments using Cell-2 were conducted under conditions of 30% RH for both gas supplies (i.e.,
  and
and  ) at each Tcell. All experiments were performed under the condition of 250 kPa (abs) of outlet pressure of the gas on both sides of anode and cathode. Table I summarizes the operating conditions applied here.
Table I. Operating conditions in the measurements of cell performance and water balance.
| Cell-1 | Cell-2 | |
|---|---|---|
( = 15 μm) = 15 μm) | ( = 30 μm) = 30 μm) | |
Cell temperature ( ) ) | 80 °C, 100 °C, 120 °C | 80 °C, 100 °C, 120 °C |
Stoichiometric ratio of H2 ( ) at anode ) at anode | 1.5 a) | 1.5 |
Stoichiometric ratio of air ( ) at cathode ) at cathode | 1.5 | 1.5 |
Relative humidity at anode inlet ( ) ) | 20, 30, 40% | 30% |
Relative humidity at cathode inlet ( ) ) | 30% | 30% |
Total pressure at anode outlet ( ) ) | 250 kPa (abs) | 250 kPa (abs) |
Total pressure at cathode outlet ( ) ) | 250 kPa (abs) | 250 kPa (abs) |
a)Tests were also conducted at  = 2.0 only when
  = 120 °C and
  = 20%.
In order to verify the  dependence of
  the measurement of
  characteristics was carried out at the same time as the
  –
– characteristics. The
  was controlled with an electrical load (As-510, NF Corporation), and kept constant for at least 5 min at each measurement. The cell resistance (Rcell) during operation was monitored using an impedance meter (3566, Tsuruga) at a constant frequency of 1 kHz.
Calculation of net water drag coefficient ( )
)

The definition and the method of calculation of  was the same as those in our previous studies.
41–43
Table II summarizes the parameters and equations used in calculating
was the same as those in our previous studies.
41–43
Table II summarizes the parameters and equations used in calculating  As described in the previous subsection of "Measurements of cell performance and water balance," the flow rates of supplied dry gases (H2/air) for each electrode (
 and
and  ) were regulated by respective digital flow meters. The total pressure in the pipeline was measured at the inlet and outlet of each side (

 and
and  ) by respective pressure gauges. The dew point in the pipeline was measured at the inlet and outlet of the anode and at the inlet of the cathode (
 and
and  ) by dew point meters, and then the vapor pressure was equal to the saturated vapor pressure derived from the measured dew point, that is,
 and
and  The rate of charged and discharged amount of water accompanied by gas flow at each side (
 and
and  ) was then calculated by using the measured gas flow rates, total pressures, and dew points as presented in Table II. At steady state, the rate of water amount is balanced between charged, generated and discharged water from the cell as follows:

where  denotes the water production rate and can be expressed as

The  can be calculated independently from the respective water balances of the anode and cathode. The net water drag coefficient based on the water balance of charged and discharged water at the anode (
 ) is calculated by using the following equation.

Similarly,  obtained from the cathode side (
 ) is expressed by the following equation.

When the equality of Eq. 1 holds true,  can be assumed to be equal to
  In our previous studies,
41,42
when
In our previous studies,
41,42
when  was set high (>2.0), the dew point of discharged air at the cathode outlet (
 ) could also be measured stably, and the balance of Eq. 1 was confirmed to be valid within 5% error directly from the dew point results at four locations (inlet and outlet at cathode/anode). However, when
  was set low as 1.5, as in the present study, it was difficult to measure
  as mentioned above.
43
Because
as mentioned above.
43
Because  was not measured in this experiment, it was not possible to confirm the balance in Eq. 1. Instead, the dew points of H2 at the anode inlet and outlet (
 and
and  ) were measured simultaneously and accurately to calculate the value of
  from Eq. 3, which was considered here to be
  The dew point of air at the cathode inlet (
 ) was also measured and carefully controlled so that air with the target
  was supplied to the cathode.
Table II. Parameters in water balance calculation.
| Anode (H2) | Cathode (air) | ||
|---|---|---|---|
| Dry gas flow rate [mol s−1] a) | Inlet |

|

|
| Outlet |

|
| |
| Total gas pressure [Pa (abs)] | Inlet |

|

|
| Outlet |

|

| |
| Dew point of gas [K (°C)] | Inlet |

|

|
| Outlet |

| — | |
| Vapor pressure [Pa (abs)] b | Inlet |

|

|
| Outlet |

| — | |
| Water amount accompanied by gas flow [mol s−1] b | Inlet |
|

|
| Outlet |

| — | |
| Relative humidity (RH) b | Inlet |
|

|
| Outlet |
| — |
a)
 is current density,
  is electrode active area, and
  is the Faraday constant.
  and
and  are the stoichiometric ratio of supplied gas at the inlet of the anode and cathode, respectively, and
  is the fraction of oxygen (O2) in air (i.e., 0.21). b)
psat(T) represents the saturation pressure of water vapor at temperature T.
is the fraction of oxygen (O2) in air (i.e., 0.21). b)
psat(T) represents the saturation pressure of water vapor at temperature T.
Results and Discussion
Total pressure dependency on current density (i)
Calculation of the amount of water carried along with the gas required measuring not only the saturated vapor pressure based on the gas dew point but also the total gas pressure (Table II). The total pressure of both inlet and outlet at both the cathode and anode (

 and
and  ) were measured with the pressure gauges during the cell operation. Dependency of these pressures on
  during the measurements of
  (and
(and  ) characteristics under different conditions is shown in Fig. S1. The back pressure of both sides anode and cathode of the cell was set at around 250 kPa (abs) by using back-pressure regulators. However, the increase in gas flow rate (
 and
and  ) with increasing
  under constant stoichiometric ratio conditions resulted in an increase in the outlet pressure (
 and
and  ) as well as the inlet pressure (
 and
and  ).
).
As for the anode H2, as shown in Fig. S1, under the same  conditions, the behaviors of
  and
and  with respect to
  were almost the same regardless of Tcell,
  and
and  When
When  = 1.5, the pressure difference between
  and
and  was approximately 3 kPa at
  = 1.4 A cm−2. The experiments with
  = 2.0 was also carried out at Tcell = 120 °C and
  = 20%, and the pressure difference was increased to about 5 kPa.
As for the cathode, air supply conditions were the same for all experiments with  = 1.5 and
  = 30%. Because
  was about five times higher than
  even when
  =
=  = 1.5, the increase in
  and
and  with respect to the increase in
  was greater than that for anode H2 as seen in Fig. S1. The behaviors of
  and
and  versus
  at each Tcell were almost the same regardless of the change in anode gas supply conditions, though the pressure fluctuations were relatively large due to the high water uptake in the cell. When Tcell = 80 °C or 100 °C, the pressure difference between
  and
and  ranged from 15 to 20 kPa at
  = 1.4 A cm−2. However, when Tcell = 120 °C, the pressure differences increased to nearly 30 kPa at the same
  The
The  and
and  were the same at all temperatures, and the reason for the pressure differences is not well understood at present.
In the region of high  (c.a., > 1.0 A cm−2), a pressure difference of about 20 − 30 kPa between the anode and cathode should have been generated locally near the cathode gas inlet. However, our previous studies
41,43
showed that the effect of the gas pressure difference on water transport through the membrane was fairly limited. In any case, the measured total pressures here were directly used in the calculations of
(c.a., > 1.0 A cm−2), a pressure difference of about 20 − 30 kPa between the anode and cathode should have been generated locally near the cathode gas inlet. However, our previous studies
41,43
showed that the effect of the gas pressure difference on water transport through the membrane was fairly limited. In any case, the measured total pressures here were directly used in the calculations of 
Current (i)—voltage(Vcell) characteristics
The  characteristics of the cells with CCMs of different
  (15 and 30 μm) were compared at
  = 80 °C, 100 °C, and 120 °C. Figure 3 shows this comparison and the
  characteristics. As listed in Table I, in the case of Cell-1 (
 = 15 μm), the
  characteristics were measured under different
  conditions (20%, 30%, and 40%) at
  = 1.5, whereas
  and
and  were fixed at 1.5 and 30% respectively for all measurements. In the case of Cell-2 (
 = 30 μm), tests were conducted under fixed
  of 30% at each temperature. Note that the cell behavior was often unstable when
  = 0.1 A cm−2, probably due to the small gas flow rate. For this reason, data of
  and
and  at
at  = 0.1 A cm−2 were omitted from the graphs shown in Fig. 3.
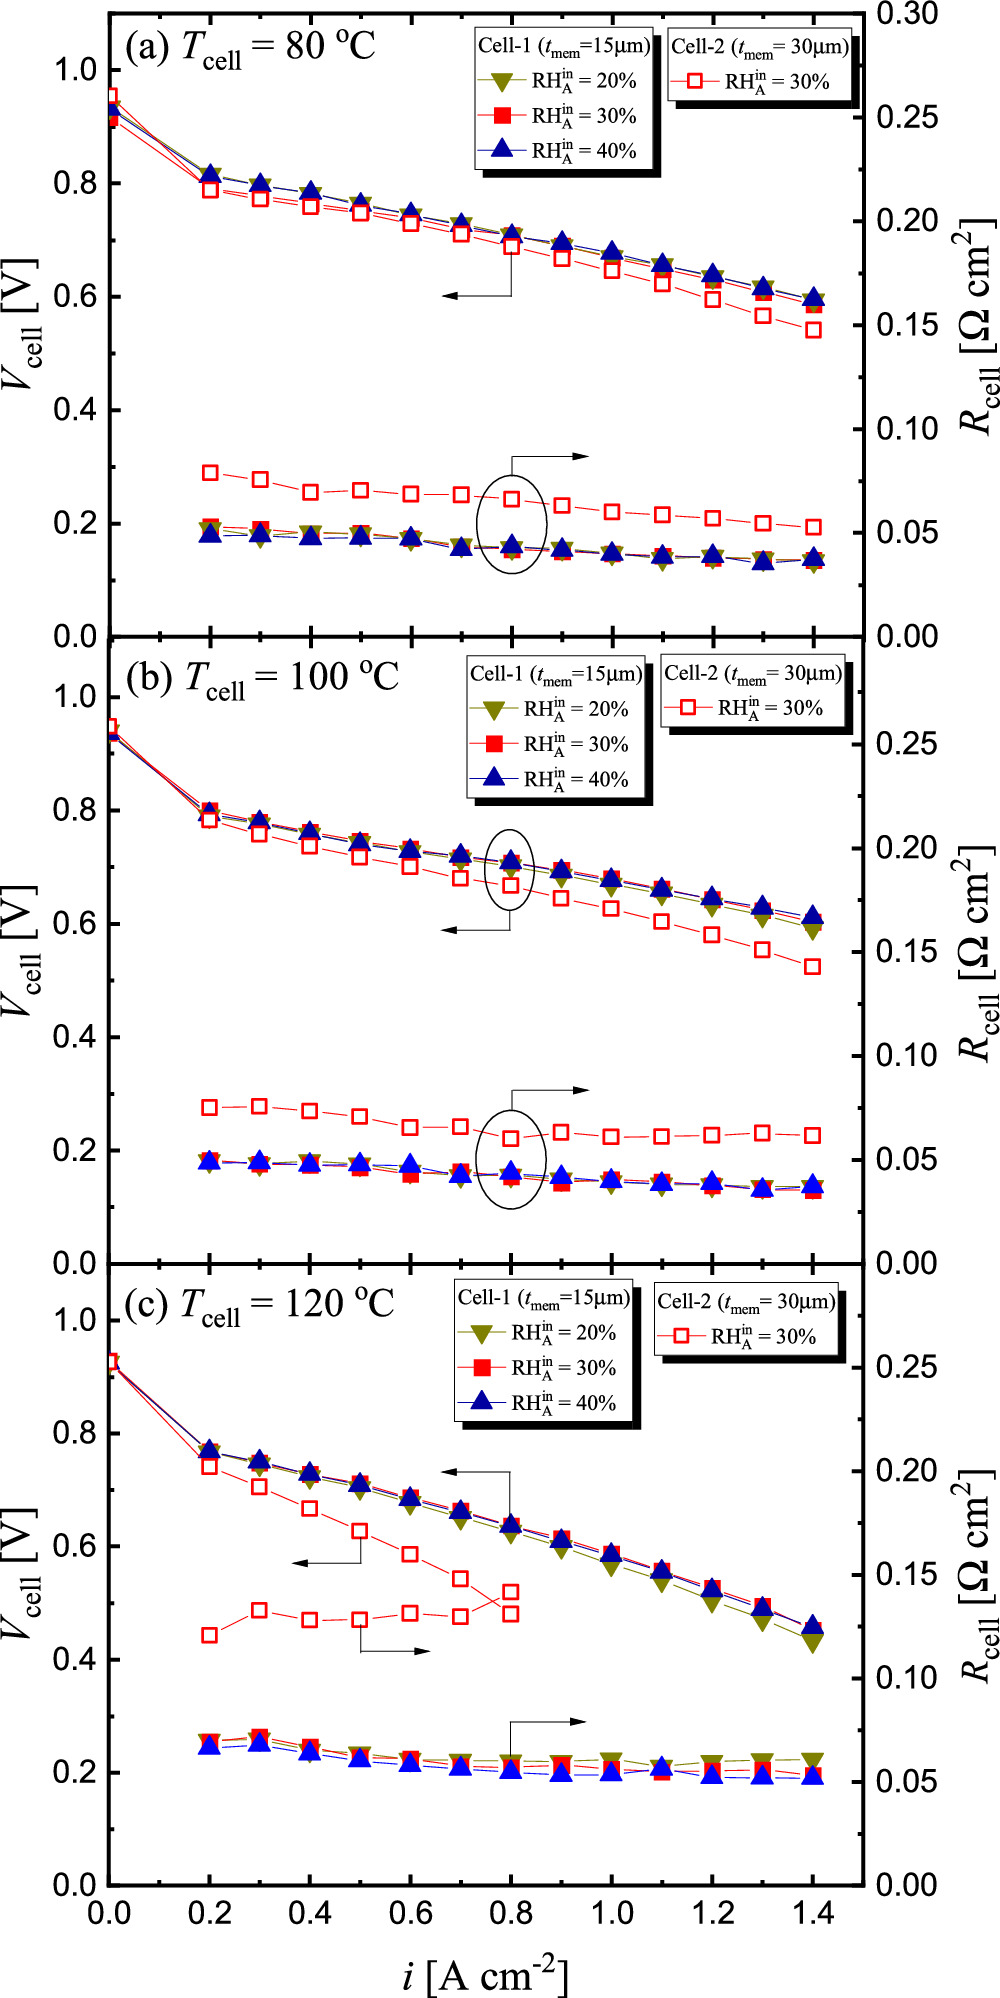
Figure 3. Dependency of cell voltage (Vcell) and resistance (Rcell) on current density (i) with Cell-1 and Cell-2 under different  at cell temperature (Tcell) of (a) 80 °C, (b) 100 °C, and (c) 120 °C, when
  =
=  = 1.5,
  = 30%,
  =
=  = 250 kPa(abs).
Download figure:
Standard image High-resolution imageThere is a possibility that cell operation at Tcell above 100 °C causes degradation of the membrane structure in a proton exchange membrane (PEM). A series of experiments were conducted here in consecutive order of Tcell at 80, 100, and 120 °C, and finally again at 120 °C. The results confirmed that there was almost no change in the  characteristics at Tcell = 120 °C, that is, the change in
  was about 15 mV at
  = 1.4 A cm−2. Therefore, no significant membrane degradation occurred during this operation time (several hours) even when Tcell was 120 °C.
The experiments at Tcell = 80 °C were also conducted in our previous study using cells with the same specifications (Cell-1 and Cell-2) under the same gas supply conditions for both the anode and cathode.
43
The  characteristics obtained in the present study were in good agreement with previous data; that is, the
  difference at
  = 1.4 A cm−2 was about 6 mV and 12 mV with Cell-1 (
 = 15 μm) and Cell-2 (
 = 30 μm), respectively. However, there was a significant difference in
  between the present data and the previous data. In a previous study using a cell with the same specifications as Cell-1,
43
between the present data and the previous data. In a previous study using a cell with the same specifications as Cell-1,
43
 was stable at around 0.032 Ω cm2 in the
  range of 0.5 to 1.4 A cm−2, whereas in the present study,
  showed a downward trend with increasing
  ranging from 0.05 Ω cm2 at
  = 0.5 A cm−2 to 0.035 at 1.4 A cm−2 (Fig. 3a). Similar differences in
  data were also observed in Cell-2. In our previous study,
43
data were also observed in Cell-2. In our previous study,
43
 was measured at 10 kHz for each
  by using a frequency response analyzer in combination with an electrical load. In contrast, in the present experiment,
  was measured simply and constantly monitored at 1 kHz by using a impedance meter. The accuracy of the
  measurement was supposed to be higher in the previous data
43
than in the present data. However, we determined that the present
measurement was supposed to be higher in the previous data
43
than in the present data. However, we determined that the present  data provided qualitative insights of the temperature dependence of
  and the water content in the membrane.
The  characteristics of Cell-1 in Fig. 3 show that the
  characteristics were relatively unaffected by changes in
  at any Tcell. In Cell-1, not only the
  characteristics but also
  characteristics were almost the same at Tcell = 80 °C and 100 °C, whereas those at 120 °C were significantly degraded. Because the
  of Cell-1 at 120 °C was certainly higher than that at 80 and 100 °C, the performance degradation at Tcell = 120 °C was considered to be mainly due to the high
  On the other hand, the difference in
  of the CCM was evident in the difference in
  The difference in
  performance between Cell-1 and Cell-2 could be attributed to the difference in
  In particular, at Tcell = 120 °C, the
  of Cell-2 was significantly higher than that of Cell-1, and the cell performance was also severely degraded. This result suggests that the membrane in Cell-2 was significantly dry during the operation at 120 °C.
Current density ()—net water drag coefficient () characteristics


Net water drag coefficient ( ) at each
  was obtained by measuring the pressures and dew points of gases at the inlet/outlet of both sides of anode and cathode as described in the Experimental section above. Measurement of the gas dew point is crucial in the calculation of
  When water droplets adhered to the mirror surface of a mirror-type dew point meter, the dew point fluctuated severely, thus making it difficult to accurately measure the dew point. Our previous studies
43
observed dew point fluctuations at low
When water droplets adhered to the mirror surface of a mirror-type dew point meter, the dew point fluctuated severely, thus making it difficult to accurately measure the dew point. Our previous studies
43
observed dew point fluctuations at low  ≈ 0.3 A cm−2 at the cathode outlet. Therefore, in the present experiment, the measurement of
  was omitted. In our present measurements of not only
  but also
  the dew point fluctuations possibly increased with
  For the
  only data that could be measured stably for more than 2 min were adopted and plotted in the graphs.
Figure 4 shows the  and
and  characteristics obtained for Cell-1 (
 = 15 μm) under different Tcell (80 °C, 100 °C, and 120 °C) and
  (20, 30, and 40%), at
  =
=  = 1.5 and
  = 30%. Figure 4a shows that at Tcell = 80 °C,
  was constant regardless of
  and was almost the same temperature as Tcell (i.e.,
  ≈ 100%), although data could only be obtained up to i = 0.6 A cm−2. The effect of
  on
on  characteristics was negligible. The
  calculated based on this
  data decreased with decreasing
  and
and  was negative when
  ≤ 30% as shown in Fig. 4d. The present data for
  and
and  at Tcell = 80 °C agreed well with our previous data measured under the same gas conditions using a cell with the same specifications.
43
Interestingly, the
at Tcell = 80 °C agreed well with our previous data measured under the same gas conditions using a cell with the same specifications.
43
Interestingly, the  range in which
  could be measured stably was also consistent with previous data. The
  characteristics at Tcell = 100 °C (Fig. 4b) showed that
  increased with increasing
  and stabilized at approximately
  = 1.0 A cm−2. Again, the effect of
  on
on  was small, and
  in the stable region range was 96 °C to 97 °C regardless of
  (i.e.,
  = 90%-93%). The
  characteristics at Tcell of 100 °C (Fig. 4e) show that
  was decreased with increasing
  and stabilized at approximately
  = 1.0 A cm−2. The same as the case of Tcell = 80 °C,
  decreased with decreasing
  at Tcell = 100 °C, and was negative region over almost the entire
  range at
  of 20%. In the
  characteristics at Tcell = 120 °C (Fig. 4c),
  increased with increasing
  and stabilized at approximately
  = 0.8 A cm−2, similar to the characteristics at 100 °C. At this Tcell = 120 °C,
  in the stable region ranged from 96 °C to 98 °C regardless of
  which corresponded to the fact that
  ranged from 45 to 48%. These results reveal that the anode side of the cell became considerably dryer at Tcell = 120 °C than at Tcell = 80 and 100 °C. It is reasonable to assume that this was the cause of the high
  at Tcell = 120 °C (Fig. 3c). Interestingly,
  in the stable region at Tcell = 100 °C and 120 °C was almost identical, but the reason for this is not clear at this time. The
  characteristics at Tcell = 120 °C (Fig. 4f) show that the effect of the
  decrease on the
  decrease became more significant as the increase of Tcell. However, even at
  = 20%,
  barely entered the negative region.
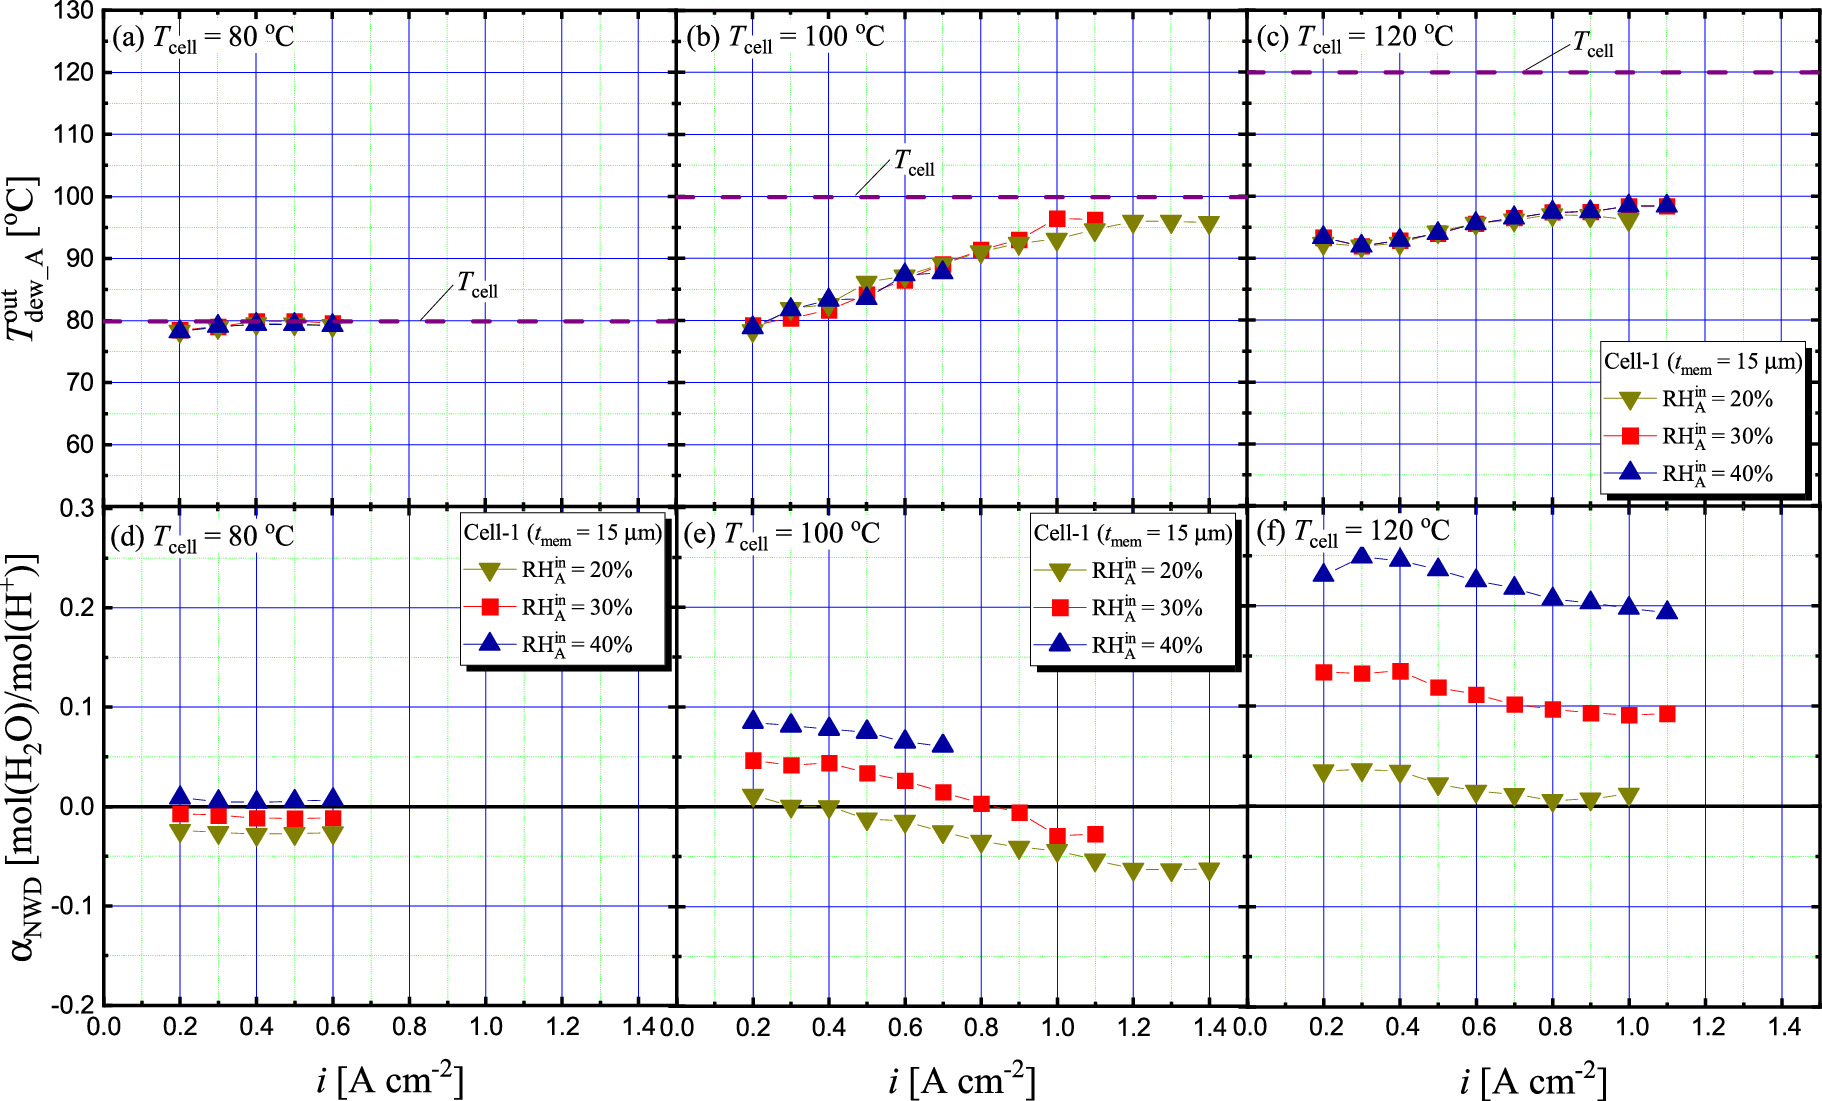
Figure 4. Dependency of dew point of discharged H2 from anode ( ) and net water drag coefficient (
 ) on current density (i) with Cell-1 (tmem = 15 μm) under different
  at different cell temperature (Tcell); (a), (d) 80 °C, (b), (e) 100 °C, and (c), (f) 120 °C, when
  =
=  = 1.5,
  = 30%,
  =
=  = 250 kPa(abs).
Download figure:
Standard image High-resolution imageTo verify the effect of  on the
  and
and  characteristics, a comparison of both characteristics obtained with Cell-1 (
 = 15 μm) and Cell-2 (
 = 30 μm) is shown in Fig. 5, at
  =
=  = 1.5 and
  =
=  = 30%. A similar comparison of
  characteristics at Tcell = 80 °C has been reported in our previous paper.
43
The data obtained in the present study were in good agreement with the data in that previous study, and the
characteristics at Tcell = 80 °C has been reported in our previous paper.
43
The data obtained in the present study were in good agreement with the data in that previous study, and the  values of Cell-1 and Cell-2 were almost the same at
  > 0.4 A cm−2 as shown in Fig. 5d. This is because
  was the same as Tcell in both cells in this
  range (Fig. 5a). The fact that
  was equal to Tcell (i.e.,
  = 100%) regardless of
  suggests that at Tcell = 80 °C, almost the entire area of membrane was fully hydrated regardless of
  and that the effect of back diffusion on
  did not appear in either cell.

Figure 5. Dependency of dew point of discharged H2 from anode ( ) and net water drag coefficient (
 ) on current density (i) with Cell-1 (tmem = 15 μm) and Cell-2 (tmem = 30 μm) at different cell temperature (Tcell); (a), (d) 80 °C, (b), (e) 100 °C, and (c), (f) 120 °C, when
  =
=  = 1.5,
  =
=  = 30%,
  =
=  = 250 kPa(abs).
Download figure:
Standard image High-resolution imageComparison of  characteristics at Tcell = 100 °C (Fig. 5b) shows that
  increased with the increase in
  in both cells and stabilized when
  exceeded approximately 1.0 A cm−2, but there was a clear difference between the
  values of the two cells. There was also a difference in
  in the stable region, when
  with Cell-1 was about 96 °C, whereas that with Cell-2 was about 90 °C. This difference in
  characteristics was reflected in the
  characteristics (Fig. 5e). As
  increased, the
  characteristics reveal that
  decreased with the increase in
  and then stabilized when
  exceeded approximately 1.0 A cm−2 with both cells. However, in Cell-1,
  entered a negative region when
  > 0.9 A cm−2, whereas in Cell-2,
  remained in a positive region even in the stable region of
 > 1.0 A cm−2. According to Fick's law, for a given water concentration gradient, the diffusion flux is inversely proportional to the diffusion length. As for the back-diffusion of water through the membrane, the diffusion length is nearly equal to
  The difference observed between Cell-1 and Cell-2 in the
  characteristics was thought to be due to the difference in back-diffusion flux caused by the difference in
  that is, the membrane was not fully hydrated, but a water concentration gradient appeared in the through-plane direction of the membrane. Note that
  tended to increase in both cells at
  < 1.0 A cm−2, suggesting that the humidification of the membrane progressed gradually with the increase in
  In addition, unlike the case of Tcell = 80 °C,
  did not reach Tcell in the stable region of
  > 1.0 A cm−2 in Cell-1 as well as Cell-2 at Tcell = 100 °C. This suggests that even in this
  region, the entire area of the membrane was not fully hydrated for either cell.
Comparison of the  characteristics of both cells at Tcell = 120 °C (Fig. 5c), reveals extraordinary behavior in Cell-2, that is,
  of Cell-2 decreased with the increase in
  Because
  in this condition (Tcell = 120 °C,
  = 30%) was set at 86.0 °C,
  was lower than
  in the region of
  > 0.4 A cm−2, and water was thus drawn up into the cell from the anode. According to the decrease in
 increased with the increase in
  (Fig. 5f). It is known that the diffusion coefficient of water in PEM depends on the water content in the membrane, and that the diffusion coefficient decreases significantly when the water content is small. Therefore, the flux of back-diffusion in Cell-2 must be significantly small, and the amount of water transported from the cathode through the membrane was considered to be restrained. As a result, drying of the membrane progressed from the anode side, resulting in performance degradation. For this reason,
  was considered to be very high in Cell 2 as seen in Fig. 3c. In conclusion, operation of Cell-2 (
 = 30 μm) is very difficult under gas supply conditions similar to a real system at Tcell = 120 °C.
As mentioned in the Introduction section,  must be negative in a stand-alone PEFC system. However, as shown in Fig. 4f, at Tcell = 120 °C,
  did not enter the negative region even when
  was lowered to 20%. On the other hand, the flow conditions of anode H2 were expected to be more flexible than those of cathode air in real system operation. Furthermore, our previous results obtained at Tcell = 80 °C
43
revealed that increasing
was lowered to 20%. On the other hand, the flow conditions of anode H2 were expected to be more flexible than those of cathode air in real system operation. Furthermore, our previous results obtained at Tcell = 80 °C
43
revealed that increasing  is effective in lowering
  An additional experiment was thus conducted with
  being increased from 1.5 to 2.0 under the conditions of Tcell = 120 °C and
  = 20%. The
  and
and  characteristics obtained from this additional experiment are shown in Fig. 6. Comparison of
  at 1.5 and 2.0 in the
  characteristics (Fig. 6a) reveal that
  with
with  = 2.0 was a slightly higher than that with
  = 1.5 when
  < 0.5 A cm−2, but were almost identical in the region above 0.6 A cm−2. On the other hand, the difference between the
  characteristics (Fig. 6b) at
  = 1.5 and 2.0 was significant due to the increase in flow rate of H2 (i.e.,
  and
and  ), and furthermore,
  was negative over the entire
  range when
  = 2.0. Note that there was no significant difference in the
  and
and  characteristics (Fig. S2). These results indicate that the
  characteristic was more insensitive to water transport in the cell than the
  characteristic; although an increase in
  increased the amount of water transported into the anode, the change in water transport had little effect on cell performance. As mentioned in the introduction section,
  and
and  are not independently controllable in a real system. However, the results confirmed that changes in
  have a greater effect on
  than changes in
  In real system operation,
  and
and  would be closely related, and an increase in
  is likely to result in a decrease in
  Both the increase in
  and the decrease in
  were advantageous in terms of lowering
  Therefore, this result indicates that increasing
  was an effective means of making
  negative even in high-temperature operation above 100 °C, though there was concern about performance degradation due to drying of the membrane.

Figure 6. Dependency of dew point of discharged H2 from anode ( ) (a) and net water drag coefficient (
 ) (b) on current density (i) with Cell-1 (tmem = 15 μm) under different
  (1.5 and 2.0) at cell temperature (Tcell) of 120 °C, when
  = 1.5,
  = 20%,
  = 30%,
  =
=  = 250 kPa(abs).
Download figure:
Standard image High-resolution image
In real systems, change in  could be achieved relatively easily by the power control of the H2 circulation pump (Fig. 1). It should be noted, however, that increasing
  would reduce the fuel utilization efficiency of FCVs. To optimize water management during high-temperature operation above 100 °C, further thinning of the PEM or sophisticated flow channel design would be required to ensure the water transport to the anodes through the membrane.
Conclusions
In this study, to verify the water balance in the cell during high temperature operation, the effect of operating temperature on  characteristics under gas supply conditions similar to those of a real system was examined experimentally, where the water amount supplied to and those discharged from the cell was measured at Tcell of 80 °C, 100 °C, and 120 °C. The experimental results obtained here indicated that the gas supply conditions to keep
  negative became more limited as the temperature increased; that is,
  should be kept low and
  should be kept high. Because such gas supply conditions would result in drier anodes, there was concern about performance degradation due to drying of the membrane. Furthermore, the effect of
  on
on  became more pronounced at higher operating temperatures above 100 °C, and it was found that as the
  increased, water transport through the membrane became more difficult, making operation at higher temperatures more difficult. Therefore, the development of thin, dry-resistant membranes is essential for high-temperature operation of PEFCs. In addition, a flow channel design to promote smoother water transport through the membrane would be required.
Acknowledgments
This work was supported partly by the New Energy and Industrial Development Organization (NEDO) through "Collaborative Industry-Academia-Government R&D Project for Solving Common Challenges Toward Dramatically Expanded Use of Fuel Cells and Related Equipment (P20003)." The authors wish to express their gratitude to Dr. Jedeok Kim of National Institute for Materials Science (NIMS).
Supplementary data (0.3 MB PDF)