
Abstract
Industrial production of cathode active material (CAM) for lithium-ion batteries is conducted by coprecipitation of a hydroxide (NixCoyMnz(OH)2) precursor (referred to as pCAM) in a stirred tank reactor and subsequent high-temperature calcination of the pCAM with a lithium compound. The physical properties of the resulting CAM are significantly affected by the associated pCAM utilized for synthesis. For an economical manufacturing of pCAM and CAM, the pCAM particle size and sphericity during the coprecipitation reaction must be precisely controlled, requiring an in-depth understanding of the NixCoyMnz(OH)2 particle formation mechanism. Therefore, the development of the secondary particle size and morphology throughout the semi-batch coprecipitation of Ni0.8Co0.1Mn0.1(OH)2 at various stirring speeds was monitored by light scattering and SEM imaging, respectively. A two-stage particle formation mechanism was identified: In the initial seeding phase, irregular-shaped secondary particles agglomerates are formed, which in the subsequent growth phase linearly increase in size with the third root of time, governed by the growth of individual primary particles. Thereby, the degree of turbulence governs the initial agglomerate size and number formed during seeding, which dictates the growth rate and the secondary particle sphericity. Finally, the proposed particle formation mechanism is compared to mechanisms prevailing in the literature.
Export citation and abstract BibTeX RIS

This is an open access article distributed under the terms of the Creative Commons Attribution 4.0 License (CC BY, http://creativecommons.org/licenses/by/4.0/), which permits unrestricted reuse of the work in any medium, provided the original work is properly cited.
Layered lithium nickel cobalt manganese oxides (LiNixCoyMnzO2, with x + y + z = 1 (NCMs)) are commercially employed as cathode active material (CAM) in lithium-ion battery (LiB) applications for electric vehicles, satisfying the demand for a long driving-range on a single charge due to their high energy density. 1,2 Currently, the industrial production of CAMs comprises two major synthesis steps: Initially, mixed metal hydroxide (M(OH)2) particles (M consisting mainly of Ni, Co, and Mn) are coprecipitated, serving as precursor for CAM synthesis (referred to as pCAM). The pCAM particles are subsequently blended with a lithium compound and calcined at elevated temperatures in a kiln to convert the powder mixture to the lithiated CAM (e.g., NCM) by solid-state reaction. 1,3,4
The coprecipitation is conducted by simultaneous introduction of mixed metal sulfate solution (MSO4(aq.)), sodium hydroxide solution (NaOH(aq.)), and ammonia solution (NH3(aq.)) in a stirred tank reactor under nitrogen atmosphere. In general, the following chemical reactions are occurring simultaneously: The coprecipitation of the M(OH)2 with sodium sulfate accruing as byproduct (Na2SO4) (Eq. 1) and the complexation of metal cations (M2+) by NH3 (Eq. 2), for which particularly Ni2+ exhibits a high affinity. 5 Further, it is suggested that the coprecipitation of M(OH)2 might also occur from the metal ammonia complex. 6


The thereby attained secondary particles exhibit particle sizes in the lower micron range (∼4–16 μm) and are composed of numerous plate-like primary particles in the submicron range. 4,7–11 After calcination at high temperatures, not only the secondary particle structure of the pCAM is preserved and reflected in the CAM structure, 12–15 but also the electrochemical performance of the CAM in the LiB is significantly affected by the morphology of the associated pCAM that was used for the CAM synthesis. 8,16,17 Furthermore, the physical properties such as the secondary particle size, uniformity, and sphericity of particles significantly affect the filterability and flowability of the pCAM and CAM powders, which is crucial for their efficient processing on an industrial scale.
In general, after the coprecipitation reaction, the attained pCAM particles are filtrated and washed with H2O and NaOH(aq.) in order to minimize the amount of remaining mother liquor and impurities, such as SO4 2−, from the crystallization reaction. 7 Additionally, synthesized CAMs are being subjected to a washing step to remove undesired residual lithium impurities (e.g., Li2CO3) formed during calcination reaction, 18,19 to increase the specific surface area of the CAM particles, 20 as well as to prevent ink gelation during electrode manufacturing 21 and deteriorating side-reactions in the final LiB application. 22 In this context, it is generally accepted that independent of the chemical composition, powders comprising of large, uniform, and spherical particles exhibit the lowest filtration resistance and display the least tendency for caking during washing. This significantly enhances the production throughput by increasing filtration rates. In contrast, small, non-uniform, and irregular-shaped particles show the poorest filtrability. 23–26 Analogously, uniformity, size and shape of particles affects the fluidity of powders, which is considerably reduced with decreasing particle size and uniformity as well as with a progressive deviation from a spherical particle shape. 23,27–31 In industrial-scale production of CAM, a free-flowing form of the pCAM and CAM powders is necessary, as this facilitates their processability in tonnage quantities. It is required that powders readily flow out of containers, can be easily transferred between various apparatuses for different process operations, and effortlessly packed for transportation and storage. However, lumping of the powder in technical apparatuses, pipes, or simply during storage entails the necessity for additional pulverization between process steps to maintain sufficient powder fluidity as well as excessively-frequent cleaning runs of the equipment; both is cost-intensive and lowers productivity. 23
A control of CAM particle size and uniformity is furthermore required for the popular strategy to increase the press density of CAM powders and thus the volumetric energy density of cathode electrodes for LIBs, namely the blending of CAMs with distinctively different particle sizes (large and small) in a desired mass ratio. 32,33 This is based on the de Larrard model that predicts that the maximum packing density can be achieved with a sphere size ratio of 4, in which case the optimal CAM blend would have a small-sphere mass fraction of 0.25. 34 For this reason, the control of particle size and shape is a substantial prerequisite for realizing optimized blend packings. Finally, the relevance of the physical attributes of the pCAM and CAM powders is not only limited to the CAM production process. In the subsequent manufacturing of electrode tapes from CAM powders, the physical property of the CAM affects the subsequent electrode coating procedure and the final electrode properties. 35,36
Based on the above discussion in conjunction with the objective to manufacture CAMs for LiB applications in an economic manner, a precise control of the physical properties of the pCAM and CAM powders is necessary. Therefore, an in-depth knowledge of the M(OH)2 pCAM particle formation mechanism during coprecipitation would enable a high degree of freedom to tailor pCAM and CAM properties according to the requirements for the cost-effective, large-scale manufacturing of CAMs as well as for a given LiB application. This study seeks to develop a mechanistic understanding of the M(OH)2 pCAM particle formation by monitoring the development of the secondary particle size (via light scattering analysis) and morphology (via SEM imaging) throughout the semi-batch coprecipitation of Ni0.8Co0.1Mn0.1(OH)2 at various stirring speeds. Using laser scattering analysis and a mass-balance model, it is demonstrated that the particle growth can be divided into two distinctive stages: An initial seeding phase, where the particle number increases while the particle size remains roughly constant, and a subsequent growth phase, where the number of particles remains roughly constant while the particle size increases. Investigation of the particle morphology at selected stages of particle growth is done by monitoring the secondary particle circularity via automated SEM image segmentation and by SEM imaging of cross-sectionally sliced Ni0.8Co0.1Mn0.1(OH)2 secondary particles after completed semi-batch coprecipitation. The latter reveals a core–shell pCAM structure, with the core consisting of loosely and randomly arranged primary particles. The validity of the two-stage coprecipitation mechanism is examined by comparing the pCAM size at the transition of the seeding to the growth stage with the core size of the pCAM particles after the semi-batch synthesis. Furthermore, by conducting semi-batch synthesis at different stirring speeds, the effect of turbulence (quantified by the Reynolds number and the average volume specific energy input) on the number/size of particles during the seeding phase and on the particle sphericity versus particle size of the final pCAM will be examined. In the end, a two-stage particle formation mechanism during the coprecipitation of Ni0.8Co0.1Mn0.1(OH)2 consisting of an agglomeration and a polycrystallization step is proposed, which is at variance with the coprecipitation mechanisms prevailing in the literature.
Theoretical Considerations
The fundamental characteristics of a semi-batch coprecipitation in a stirred tank reactor are schematically illustrated in Fig. 1. Reactants are continuously added, with the reaction suspension accumulating in the stirred vessel. This results in a steady increase of the total reaction volume (Vtotal) and mass of formed mixed metal hydroxide, so that of the volume of the formed mixed metal hydroxide (VM(OH)2) increases with progressing batch run time (trun). Due to low solubilities of the respective metal hydroxides of <200 ppm at the coprecipitation pH-range of 11.0–13.0,
5,37
an essentially complete conversion of the aqueous mixed metal sulfate solution (MSO4(aq.), M = Ni/Co/Mn in a molar ratio of 8/1/1) can be assumed. Furthermore, considering that over the entire run time the total volumetric flow rate  and the concentration of all input streams remained constant, then VM(OH)2 of the formed Ni0.8Co0.1Mn0.1(OH)2 particles is a simple linear function of trun:

Here,  is the volumetric flow rate of MSO4(aq.) (=18.0 ml h−1), cMSO4 is the concentration of the MSO4(aq.) solution (=2.6 mol l−1), MM(OH)2 is the molar mass of Ni0.8Co0.1Mn0.1(OH)2 (=91.93 g mol−1), and ρcryst. is the crystallographic density of Ni0.8Co0.1Mn0.1(OH)2. For the latter, a molar composition averaged crystallographic density of 3.96 g cm−3 is assumed, based on the crystallographic density of Ni(OH)2 (=4.1 g cm−3), Co(OH)2 (=3.6 g cm−3), and Mn(OH)2 (=3.26 g cm−3) as well as on the molar transition metal ratio of Ni/Co/Mn = 8/1/1.
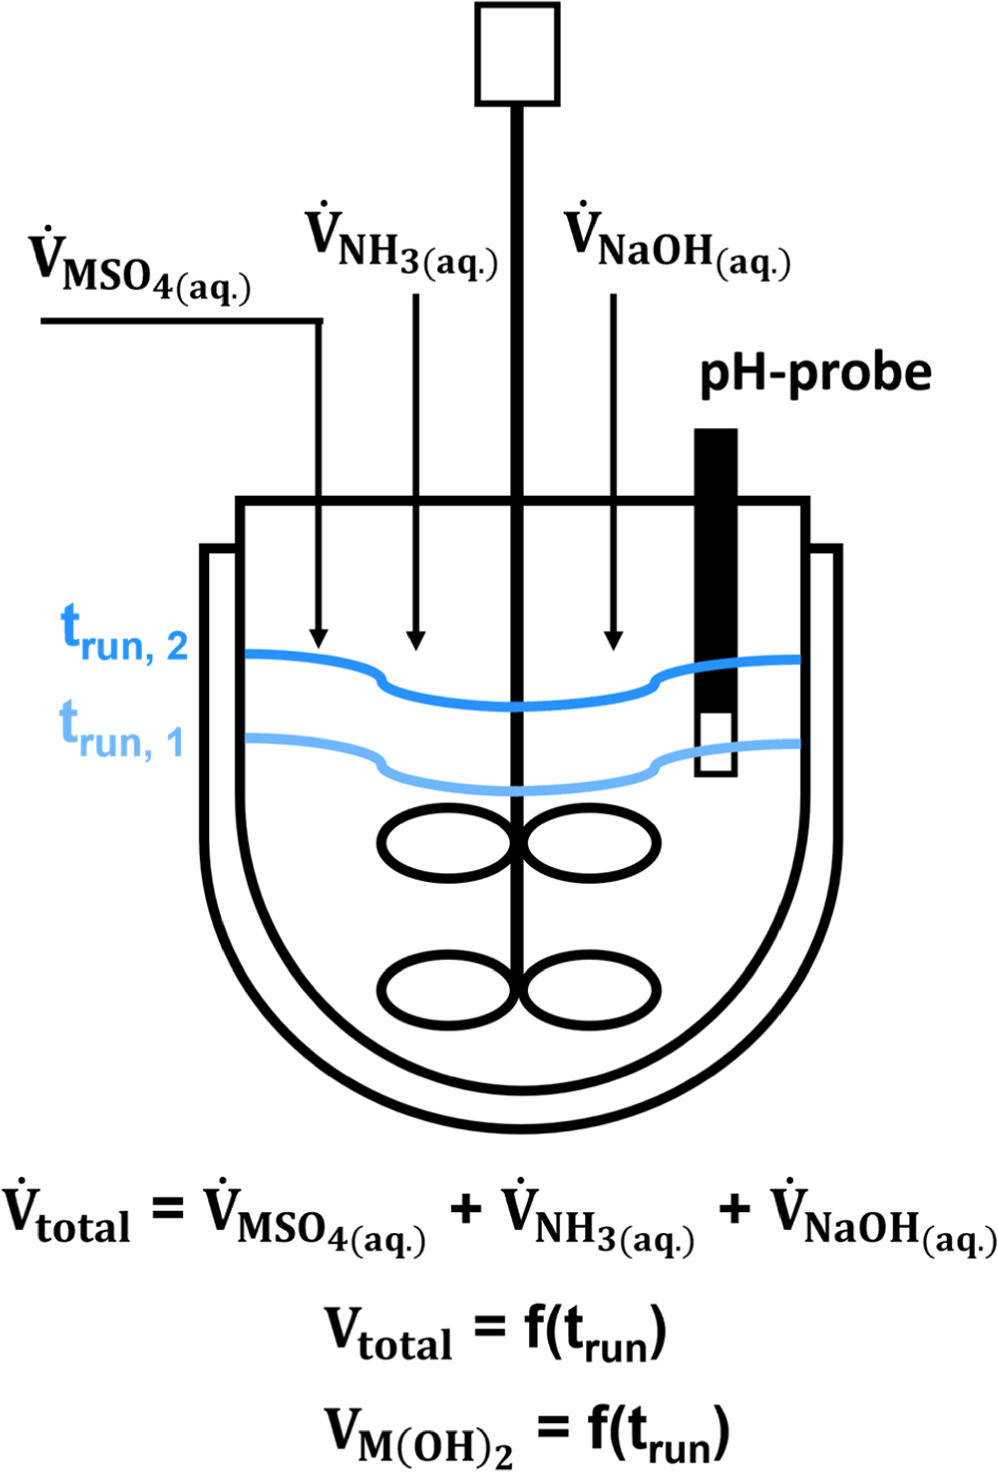
Figure 1. Schematic illustration of the stirred tank reactor setup used here for semi-batch coprecipitation of Ni0.8Co0.1Mn0.1(OH)2 secondary particles. For constant volumetric flow rates of the reactants ( ), the reaction volume (Vtotal) and thus the precipitated Ni0.8Co0.1Mn0.1(OH)2 volume (VM(OH)2) and mass are a linear function of the run time (trun), as indicated by the distinctive liquid levels at trun, 1 (light blue) and trun, 2 (dark blue).
Download figure:
Standard image High-resolution imageBy assuming an approximately spherical shape for the Ni0.8Co0.1Mn0.1(OH)2 particles, the volume of individual Ni0.8Co0.1Mn0.1(OH)2 particles (Vpar.) can be estimated as the volume of a sphere with a diameter that corresponds to the volume median particle size (d50) that can be determined by light scattering.

Due to mass conservation, the total volume of all particles inside the reactor is equal to VM(OH)2, so that the particle number (Npar.) at any given trun value can be approximated by:

When combined with Eqs. 3 and 4, the following relationship between the measured volume median particle size and the reaction run time holds if the number of particles remains constant (i.e., during the above postulated growth phase):
This would imply that during the growth phase, the d50 value would have to increase with the third root of the run time. Furthermore, with the constraint that the particle number throughout the run remains constant, the following equation is valid, which is frequently utilized for seeded batch crystallization reactions and relates the solid volume at the onset (Vs,initial) and at the end of the growth period (Vs,final) to the respective diameter of spherical particles (dfinal and dinitial): 38–40

The mean growth rate (G) of particles in a certain interval of trun between trun,1 and trun,2 with corresponding volume median particle sizes d50,1 and d50,2, respectively, can be defined by the following expression.

Experimental
Materials and methods
The following aqueous transition metal solutions were obtained from BASF SE (≥99.0% purity): Nickel(II) sulfate solution (2.6 mol l−1 NiSO4(aq.)), cobalt(II) sulfate solution (2.6 mol l−1 CoSO4(aq.)), and manganese(II) sulfate solution (2.6 mol l−1 MnSO4(aq.)). From these, a mixed metal sulfate solution (MSO4(aq.)) was prepared by combining the respective transition metal salt solutions in a molar ratio of M = Ni/Co/Mn = 8/1/1 to achieve an overall metal concentration of  = 2.6 mol l−1. Furthermore, sodium hydroxide solution (25 wt% NaOH(aq.) (≡7.9 mol l−1), ≥99.0% purity) and ammonia solution (25 wt% NH3(aq.) (≡13.2 mol l−1), ≥99.0% purity) were obtained from Bern Kraft GmbH (Germany). All solutions were used as they arrived from the chemical suppliers without any further purification.
Semi-batch coprecipitation of Ni0.8Co0.1Mn0.1(OH)2
The Ni0.8Co0.1Mn0.1(OH)2 particle formation was investigated during semi-batch coprecipitation reactions in a 480 ml stirred tank reactor under nitrogen atmosphere (with a N2 purge flow of 2.0 l h−1), equipped with a temperature control unit and a pH-probe (HA 405-DXK-S8, Mettler Toledo) for monitoring the internal pH-value of the solution (for a sketch of the reactor setup see our previous work). 7 The glass vessel with a double jacket for circulating a heating fluid had an inner diameter of 8 cm, a height of 15 cm, and an outer diameter of 15 cm; it was equipped with baffles, a three-stage 45° pitch-blade stirrer with a diameter of 5 cm, and three dosing tubes for the respective reactant solutions, namely for the mixed metal solution (MSO4(aq.)), the sodium hydroxide solution (NaOH(aq.)), and the ammonia solution (NH3(aq.)). The three dosing tubes (1 mm inner and 2 mm outer diameter) were introduced through the sealed top of the reactor, separated from each other by 4 cm each (with a total distance of 8 cm between the MSO4(aq.) and the NaOH(aq.) inlets); the tube outlets were positioned in the reactor 3 cm above the maximum liquid level, which corresponds to 12 cm from the bottom of the reactor.
Before starting the coprecipitation reaction, the vessel was charged with 200 ml deionized and degassed H2O as well as with 4.0 ml of 25 wt%NH3(aq.) solution to achieve an overall NH3(aq.) concentration in the reactor of 0.25 mol l−1. The temperature was set to 55 °C via circulation of tempered silicon oil through the double jacket and the stirring speed was set to the desired value. The internal reaction pH-value measured at the solution temperature of 55 °C was referenced to an external pH-value measured at 23 °C (pH23 °C; via an InLab® SemI MIcro, Mettler Toledo) by taking solution samples from the reactor and measuring the pH-value at 23 °C. The internal pH electrode was calibrated at 55 °C, while the external electrode was calibrated at 23 °C; in both cases, buffer solutions with pH23 °C = 7.0 and pH23 °C = 12.0 were employed (Certipure, Merck KGaA).
The semi-batch coprecipitation was initiated by simultaneously feeding the MSO4(aq.) solution at a volumetric flow rate of 18.0 ml h−1 and the NH3(aq.) solution at a volumetric flow rate 1.8 ml h−1 into the reactor. The NaOH(aq.) solution flow was controlled by a flow control-unit (Dulcometer, Prominent) linked to the internal pH-probe to maintain a constant pH-value throughout the reaction; the actual flow was close to the predicted volumetric flow rate of 12.0 ml h−1. The stirring speed was varied between 550, 950, and 1350 rpm, while other remaining process parameters remained unchanged. In desired time intervals, the reaction progress was controlled by withdrawing 4–5 ml of reaction suspension from the reactor, cooling it to 23 °C, measuring the pH-value at 23 °C and determining the particle size distribution by laser diffraction (see below). For investigation of particle morphology by scanning electron microscopy (see below), the particle slurry was filtered, washed with H2O in a 10:1 precipitate:H2O weight ratio, and dried in air at 120 °C for 12 h in an oven (universal Oven U, Memmert). After 8.75 h reaction run time, the total solution volume was 480 ml, and the reactant flows were stopped. The obtained product suspension was collected and identically processed.
Particle size distribution by laser scattering
The reactor suspension sample was homogenously dispersed, and a small amount of the particle slurry was transferred into the particle size analyzer (Mastersizer 2000, Malvern Panalytical GmbH) until a light obscuration between 4.0%–14.0% was achieved. The respective volume-based particle size distribution (PSD) was determined by laser diffraction based on Mie's scattering theory. A refractive index of 1.33 for H2O as dispersant was selected, while a refractive index of 2.19, identical to the refractive index of NiO, was assumed for the Ni0.8Co0.1Mn0.1(OH)2 particles. The intensity of the scattered laser beam was collected as a function of the scattering angle for particle sizes in the range of 0.05–70.0 μm by applying a combination of red and blue light. Based on three measurements per sample, the average volume-based percentile particle sizes d10, d50, and d90 were determined. The span (σ) of the PSD was calculated according to the following equation.

Scanning electron microscopy (SEM)
The morphology of the obtained pCAM particles was characterized by attaching the Ni0.8Co0.1Mn0.1(OH)2 powder on a SEM pin holder (Agar Scientific, Ltd.), which is covered with conducting carbon (Plano GmBH). Subsequently, the sample was coated with a 6 nm platinum layer (SCD 500 Sputter Coater, Bal-Tec AG). Top-view SEM imaging was performed with a thermal field emission cathode and an Everhat-Thornley secondary electron detector at an operating voltage of 5 kV (Ultra 55, Carl Zeiss Ag).
Samples for cross-section measurements were prepared by mixing 2 g of epoxy resin and 0.5 g of epoxy hardener (Buehler, ITW Test & Measurement GmbH) and then adding a few drops of the mixture to the respective Ni0.8Co0.1Mn0.1(OH)2 precursor sample in a gelatine capsule (Plano GmbH). The resulting slurry was cast onto an Al-foil using a manual coater with a gap size of 0.5 mm and dried in an oven at 40 °C overnight. Small sections thereof were transferred to an ion milling system (ArBlade 5000, Hitachi, Ltd.) equipped with an Ar-ion beam at an operating voltage of 6 kV. Images were taken as described above for the top-view measurements.
Particle circularity by SEM image segmentation
Quantitative information about particle circularity as a two-dimensional descriptor for the particle sphericity of Ni0.8Co0.1Mn0.1(OH)2 particles, which is a three-dimensional property, was determined from SEM top-view images at 1 k magnification by employing a segmentation model. The underlying algorithm implemented for automated image segmentation is based on a convolutional neural network utilizing the U-Net architecture, 41 which is analogous to the model applied by other authors for the segmentation of primary particles in polycrystalline lithium nickel oxide. 20,42 The as-measured lengths/areas from two-dimensional projected particles from the original SEM image were captured in the dimension of pixels and converted back to actual lengths/areas after segmentation by using a calibration factor from the image metadata. Additionally, several filters for the segmentation were employed to increase the accuracy of the process. Particles touching the boundary of the image were not evaluated, since particles in this region might not be fully captured. Further, only particles were considered, which exhibited an area of above 200 pixels and a solidity (=ratio between the particle's area and the area of the convex hull that encloses the particle) of ≥0.8. 43 These conditions ascertained that only particles that did not deviate excessively from a spherical shape were recognized. The circularity (C) of the segmented particles that fulfilled the aforementioned criteria was then calculated according to the isoperimetric quotient, which is defined as: 44

Here, Aparticle is the area and Pparticle is the perimeter of the segmented particle based on a 2D projection of the particle and Aeq. circle is the area of a perfect circle that would have the equivalent perimeter as that measured for the segmented particle (= Pparticle); note that C equals one for a perfect circle.
Overall, for each sample, the circularity of approximately 60–100 particles was determined to obtain the circularity distribution for each sample. For each circularity distribution the median number-based percentile circularities C10, C50, and C90 were determined. The validity of the segmentation model was verified by comparing algorithm-based circularity distributions of selected samples to distributions attained by manual segmentation via ImageJ. 45 Further, similar to the span σ that is used to represent the width of the particle size distribution determined by light scattering (see Eq. 9), the width of the here obtained circularity distributions (Cspan) was calculated according to the following equation.

Particle core size by cross-section SEM image segmentation
The size of secondary particle cores was manually determined from cross-section SEM images of Ni0.8Co0.1Mn0.1(OH)2 secondary particles at various magnifications by applying ImageJ. 45 For this analysis, only those secondary particles were considered as representative which had been sliced perfectly through the equator of the secondary particle during the SEM sample preparation to ensure fault-free quantification of the core size. This is assured by only selecting particles, which have a similar particle size as was determined by light scattering and for which the core was readily exposed. This prevents falsification of the analysis by in e.g., secondary particles that were sliced through the upper or lower quarter and therefore would result in a non-representative secondary particle core size.
The corresponding equivalent diameter (deq.) of a circle with identical area as the determined area of the core (Acore) was calculated according to the following.

Nitrogen physisorption measurements
The internal secondary particle porosity of Ni0.8Co0.1Mn0.1(OH)2 particles were determined by measuring nitrogen physisorption isotherms at 77 K (ASAP2420, Micromeritics). Prior to the measurements, pCAM powders were degassed at 120 °C for three hours. It was demonstrated in a previous work that the internal secondary particle porosity of pCAM particles can be determined via N2 capillary condensation in these pores at a high relative pressure p/p0 value of 0.995. 7 The SEM imaging analysis of the pCAM particles showed that internal pores were smaller than ∼300–400 nm, which is below the pore diameter below which according to the Kelvin equation liquid N2 can be formed in these pores at a relative pressure p/p0 value of 0.995.
The intra-particle porosity εintra of Ni0.8Co0.1Mn0.1(OH)2 secondary particles can be calculated according to: 46

where VN2,liquid is the specific liquid N2 volume condensed in the pCAM secondary particle pores and ρcryst. is the crystallographic density of Ni0.8Co0.1Mn0.1(OH)2. Here, a molar averaged crystallographic density of 3.96 g cm−3 is assumed, based on the crystallographic density of Ni(OH)2 (=4.10 g cm−3), Co(OH)2 (=3.60 g cm−3), and Mn(OH)2 (=3.26 g cm−3) and the transition metal ratio of Ni/Co/Mn = 8/1/1.
Results and Discussion
Analysis of particle growth during coprecipitation of Ni0.8Co0.1Mn0.1(OH)2
The particle growth during semi-batch operation was monitored by sampling the reaction suspension at desired time intervals and determining the corresponding particle size distribution (PSD) by light scattering. The development of the obtained volume median particle sizes (d50) throughout the semi-batch run time (trun) for coprecipitations conducted with different stirring speeds (n) are depicted in Fig. 2a. Furthermore, Table I lists the d50 values of the Ni0.8Co0.1Mn0.1(OH)2 particles formed after 5 min, 1.0 h, and 8.75 h as well as the span (σ) values that represent the width of the corresponding PSD for each semi-batch experiment. The d50 values of the initial particles generated after a trun of 5 min depend inversely on the applied stirring speed, while the spans of the corresponding PSDs are similar in each run and indicate a broad PSD. During the first hour of the coprecipitation reaction, the particle size increases only slightly (by ∼20%–30% between 5 min and 1.0 h, see Table I), accompanied by a minor decrease in PSD span (∼10%–15%). After this early phase, the particle growth over each run appears to follow a power function (see Fig. 2a), as observed by other authors during hydroxide pCAM coprecipitation, 47,48 which is characteristic for the growth of spherical particles independently of the material class. 49,50 The final d50 values achieved at the end of each experiment, i.e., after trun = 8.75 h is roughly inversely proportional to the stirring speed (see Table I). In contrast, independent of the applied stirring speed, the PSD of the particles continuously narrows over the course of the coprecipitation reaction, and the PSD span after 8.75 h of run time is approximately halved compared to the PSD of the initial particles formed after 5 min. A similar behavior, namely an extremely broad span of particles formed throughout the first 45 min of the semi-batch coprecipitation of Ni0.35Mn0.65(OH)2 that is followed by a continuous decrease in span throughout the proceeding particle growth phase was observed by Liu et al., without, however, conducting any further investigations in this phenomenon. 47
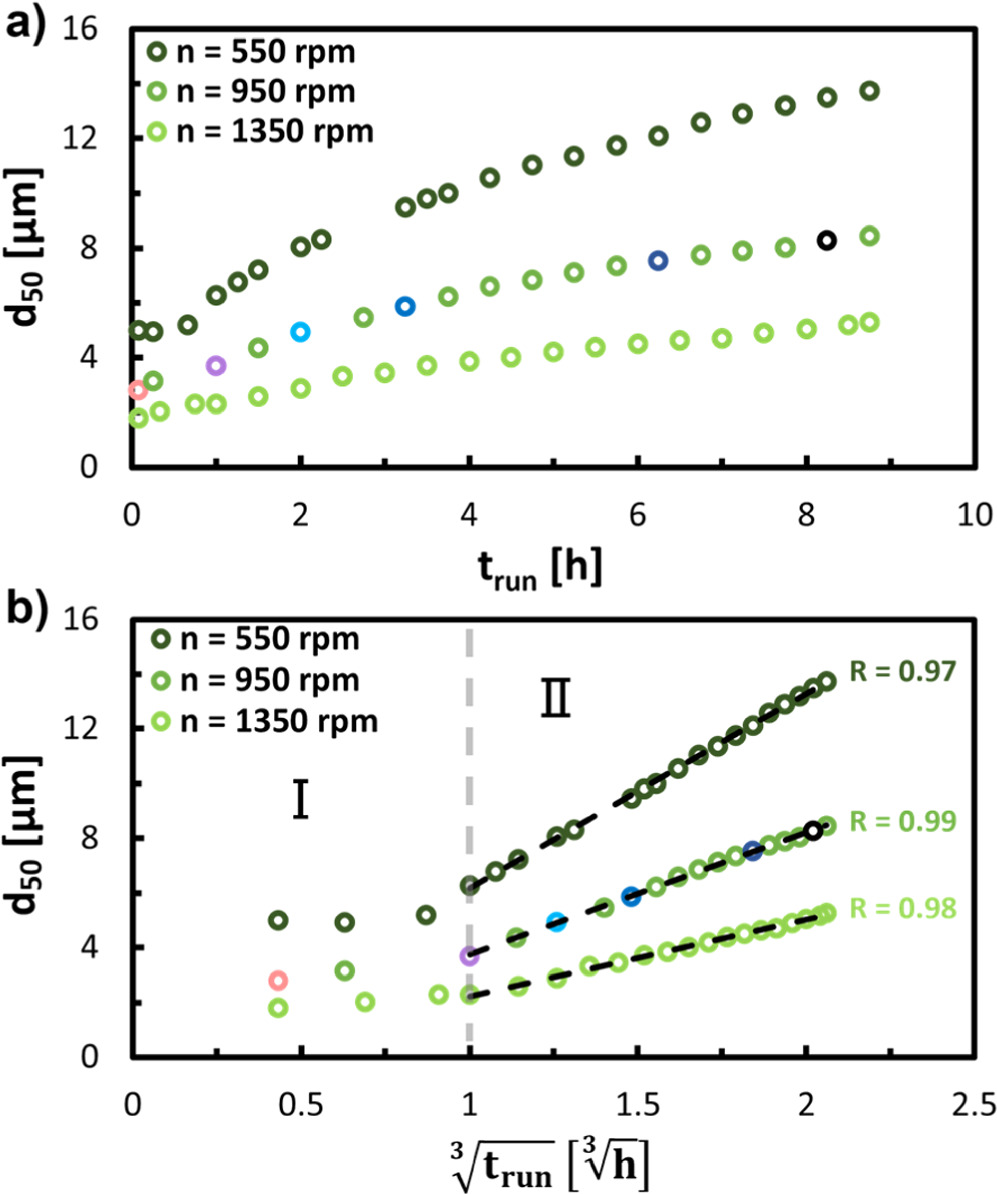
Figure 2. Evolution of the volume median particle size d50 obtained by light scattering during the semi-batch coprecipitation of Ni0.8Co0.1Mn0.1(OH)2 at a stirring speed of n = 550 rpm (dark green), n = 950 rpm (green) and n = 1350 rpm (light green), plotted versus: (a) the run time trun and (b) the third root of the run time, ![$\sqrt[3]{{t}_{run}}.$](https://content.cld.iop.org/journals/1945-7111/170/11/110513/revision2/jesad050bieqn5.gif) The gray dashed line divides the course of coprecipitation reaction into a seeding stage Ⅰ (trun > 1.0 h) and a growth stage Ⅱ (trun ≤ 1.0 h). The black dashed lines represent linear regressions of the d50 values in the growth stage between
The gray dashed line divides the course of coprecipitation reaction into a seeding stage Ⅰ (trun > 1.0 h) and a growth stage Ⅱ (trun ≤ 1.0 h). The black dashed lines represent linear regressions of the d50 values in the growth stage between ![$\sqrt[3]{{t}_{run}}$](https://content.cld.iop.org/journals/1945-7111/170/11/110513/revision2/jesad050bieqn6.gif) = 1.0
= 1.0 ![$\sqrt[3]{h}$](https://content.cld.iop.org/journals/1945-7111/170/11/110513/revision2/jesad050bieqn7.gif) and
and ![$\sqrt[3]{{t}_{run}}$](https://content.cld.iop.org/journals/1945-7111/170/11/110513/revision2/jesad050bieqn8.gif) = 2.06
= 2.06 ![$\sqrt[3]{h},$](https://content.cld.iop.org/journals/1945-7111/170/11/110513/revision2/jesad050bieqn9.gif) listing also the respective correlation coefficients R. The differently colored data points for the experiment at 950 rpm indicate exemplary particle suspensions for which volume-based PSD and SEM images of the coprecipitated particles are depicted in Fig. 3.
listing also the respective correlation coefficients R. The differently colored data points for the experiment at 950 rpm indicate exemplary particle suspensions for which volume-based PSD and SEM images of the coprecipitated particles are depicted in Fig. 3.
Download figure:
Standard image High-resolution imageTable I. Volume median particle size d50 and span σ (see Eq. 9) of the corresponding PSDs at selected stages of particle growth during coprecipitation of Ni0.8Co0.1Mn0.1(OH)2 in semi-batch mode conducted at various stirring speeds (n) as well as the mean growth rate (G) in stage II of the corresponding run calculated by Eq. 8.
| Run # | n [rpm] | d50, 5 min [μm] | σ5 min [-] | d50, 1.0 h [μm] | σ1.0 h [-] | d50, 8.75 h [μm] | σ8.75 h [-] | G [μm/h] |
|---|---|---|---|---|---|---|---|---|
| 1 | 550 | 5.0 | 1.5 | 6.2 | 1.4 | 13.7 | 0.73 | 0.96 |
| 2 | 950 | 2.8 | 1.4 | 3.7 | 1.2 | 8.4 | 0.76 | 0.62 |
| 3 | 1350 | 1.9 | 1.4 | 2.3 | 1.3 | 5.3 | 0.77 | 0.38 |
To gain further insights into the growth mechanism, the particle growth curves depicted in Fig. 2a were scaled by plotting the determined d50 as a function of the third root of the batch run time (![${\sqrt[3]{{\rm{t}}}}_{{\rm{run}}}$](https://content.cld.iop.org/journals/1945-7111/170/11/110513/revision2/jesad050bieqn10.gif) ) (see Eq. 6). The thus attained particle growth profiles for each of the applied stirring speeds (n) are shown in Fig. 2b. As already indicated above, independent of the stirring speed, the course of particle growth can be divided into two distinct stages: For
) (see Eq. 6). The thus attained particle growth profiles for each of the applied stirring speeds (n) are shown in Fig. 2b. As already indicated above, independent of the stirring speed, the course of particle growth can be divided into two distinct stages: For ![${\sqrt[3]{{\rm{t}}}}_{{\rm{run}}}$](https://content.cld.iop.org/journals/1945-7111/170/11/110513/revision2/jesad050bieqn11.gif) < 1.0 h (≙ trun < 1.0 h), the particle size remains fairly constant and only marginally increases, delineating stage I. After this initial phase, for
< 1.0 h (≙ trun < 1.0 h), the particle size remains fairly constant and only marginally increases, delineating stage I. After this initial phase, for ![$\sqrt[3]{{{\rm{t}}}_{{\rm{run}}}}$](https://content.cld.iop.org/journals/1945-7111/170/11/110513/revision2/jesad050bieqn12.gif) ≥ 1.0 h (≙ trun ≥ 1.0 h), the d50 values for each stirring speed increase perfectly linearly with
≥ 1.0 h (≙ trun ≥ 1.0 h), the d50 values for each stirring speed increase perfectly linearly with ![$\sqrt[3]{{{\rm{t}}}_{{\rm{run}}}},$](https://content.cld.iop.org/journals/1945-7111/170/11/110513/revision2/jesad050bieqn13.gif) illustrated by correlation factors (R) of the linear regression lines of close to one, delineating stage II. The slope of these linear regression lines are a function of the mean particle growth rates (G, defined by Eq. 8) during the respective coprecipitation, which are listed in Table I, and which are roughly inversely proportional to the applied n in the respective semi-batch run.
illustrated by correlation factors (R) of the linear regression lines of close to one, delineating stage II. The slope of these linear regression lines are a function of the mean particle growth rates (G, defined by Eq. 8) during the respective coprecipitation, which are listed in Table I, and which are roughly inversely proportional to the applied n in the respective semi-batch run.
This analysis suggests that new particles are still being generated during stage I, because the overall volume of coprecipitated solid VM(OH)2 is increasing with run time (see Eq. 3) while the particle size barely increases (see Fig. 2b). In contrast, in stage II, the increase of the d50 values with ![$\sqrt[3]{{{\rm{t}}}_{{\rm{run}}}}$](https://content.cld.iop.org/journals/1945-7111/170/11/110513/revision2/jesad050bieqn14.gif) suggests that the continuously coprecipitated solid mass is solely deposited on already existing particles, without any further increase in particle number (Npar., see Eq. 6). This growth behavior in stage II is characteristic for seeded batch crystallization processes, whereby nucleation and formation of new particles is suppressed by charging the reactor with seed particles before initiating the reaction.
38–40
Hence, after stage I, the semi-batch coprecipitation conducted in this work behaves analogous to a seeded crystallization reaction. Interestingly, despite different applied stirring speeds, the transition from stage I to stage II in the here conducted semi-batch experiments occurs at similar trun values. This suggests that the cessation of nucleation (i.e., the end of stage I) and the concomitant onset of particle growth (i.e., the beginning of stage II) seems to be mainly dependent on the solid mass fraction in the reactor. It is rationalized that this can be justified by the feedback effect of the existing solid mass in the reactor on the nucleation kinetics, namely by decreasing the existing supersaturation as driving force for nucleation in the system because lattice ions (for the formation of M(OH)2, the lattice ions are M2+ and OH−) are contributing to crystal growth on already available solid mass instead to the supersaturation.
51,52
This is consistent with the observation of a critical seed loading reported for seeded batch crystallization syntheses of various compounds, above of which the formation of new particles is effectively suppressed.
53,54
suggests that the continuously coprecipitated solid mass is solely deposited on already existing particles, without any further increase in particle number (Npar., see Eq. 6). This growth behavior in stage II is characteristic for seeded batch crystallization processes, whereby nucleation and formation of new particles is suppressed by charging the reactor with seed particles before initiating the reaction.
38–40
Hence, after stage I, the semi-batch coprecipitation conducted in this work behaves analogous to a seeded crystallization reaction. Interestingly, despite different applied stirring speeds, the transition from stage I to stage II in the here conducted semi-batch experiments occurs at similar trun values. This suggests that the cessation of nucleation (i.e., the end of stage I) and the concomitant onset of particle growth (i.e., the beginning of stage II) seems to be mainly dependent on the solid mass fraction in the reactor. It is rationalized that this can be justified by the feedback effect of the existing solid mass in the reactor on the nucleation kinetics, namely by decreasing the existing supersaturation as driving force for nucleation in the system because lattice ions (for the formation of M(OH)2, the lattice ions are M2+ and OH−) are contributing to crystal growth on already available solid mass instead to the supersaturation.
51,52
This is consistent with the observation of a critical seed loading reported for seeded batch crystallization syntheses of various compounds, above of which the formation of new particles is effectively suppressed.
53,54
Table I also shows that the span values (σ) of the PSDs for the three runs conducted at different stirring speeds decrease with run time. It is rationalized, that the narrowing of the PSD with progressing particle growth implies that the particle size increase of particles within each run is independent of their size, and therefore, nearly the surface mass specific uptake nearly identical for every particle. Consequently, smaller particles "catch up" in mass and volume to larger ones with proceeding trun, since an equal increase in diameter for particles of varying size denotes a larger gain in volume for smaller particles compared to larger ones. This overall results in a particle size independent growth rate within each run. Please note that the growth rate between each run is different (see G in Table I), which will be explained below.
By Eq. 5 determined values for Npar. of the coprecipitated Ni0.8Co0.1Mn0.1(OH)2 particles inside the reactor after 5 min, 1.0 h, and 8.75 h for each semi-batch experiment are given in Table II. The particle number during each run was increased within stage I by factor of ∼5–6 (i.e., between trun of 5 min and 1.0 h, see Fig. 2b), which implies that new particles are formed by nucleation. During the subsequent growth phase, i.e., in stage II, the initial particle number at trun = 1.0 h in each run decreases by 14%–29% until the end of the experiment at trun = 8.75 h. A decrease in particle number throughout the course of the coprecipitation reaction can be rationalized by the following scenarios: (a) agglomeration of secondary particles throughout the process; (b) a significant secondary particle porosity, which would lower the assumed crystallographic density (ρcryst.) applied for the calculation of the particle volume according to Eq. 3, and thus would result in an underestimation of particle number; and/or, (c) a decrease in solid volume inside the reactor, hence particle number, caused by the sampling of the reaction suspension over the course of the semi-batch operation. An agglomeration of secondary particles (scenario (a)) seems unlikely, since the d50 values during stage II increase with ![$\sqrt[3]{{{\rm{t}}}_{{\rm{run}}}}$](https://content.cld.iop.org/journals/1945-7111/170/11/110513/revision2/jesad050bieqn15.gif) (Fig. 2b), following the relationship given by Eq. 6 that is based on assuming a constant Npar. value. Furthermore, agglomeration processes are generally a function of agitation,
55,56
so that the largest decrease in particle number would be expected for the semi-batch coprecipitation conducted at n = 550 rpm, while run 3 conducted at n = 1350 rpm should exhibit the lowest change; this is contrary to the observations based on Table II, where the Npar. value calculated by Eq. 5 decreases most strongly for n = 1350 rpm (∼29% compared to ∼14% for n = 550 rpm).
(Fig. 2b), following the relationship given by Eq. 6 that is based on assuming a constant Npar. value. Furthermore, agglomeration processes are generally a function of agitation,
55,56
so that the largest decrease in particle number would be expected for the semi-batch coprecipitation conducted at n = 550 rpm, while run 3 conducted at n = 1350 rpm should exhibit the lowest change; this is contrary to the observations based on Table II, where the Npar. value calculated by Eq. 5 decreases most strongly for n = 1350 rpm (∼29% compared to ∼14% for n = 550 rpm).
Table II. Particle number (Npar.) in the reactor at selected stages of particle growth during the semi-batch coprecipitation of Ni0.8Co0.1Mn0.1(OH)2 conducted at various stirring speeds (n), calculated according to Eq. 5. The subsequent columns give the theoretically resulting particle size at trun = 8.75 h for an assumed constant number of particles during stage II ( based on Eq. 13), and the particle number (
 ) determined on the basis of the intra-particle porosity (εintra)-corrected density in Eq. 3. εintra was determined by nitrogen physisorption.
| Run # | n [rpm] | Npar., 5 min [-] | Npar., 1.0 h [-] | Npar., 8.75 h [-] |
 [μm] [μm] |
 [-] [-] | εintra [-] |
|---|---|---|---|---|---|---|---|
| 1 | 550 | 1.4 × 10⁹ | 8.3 × 10⁹ | 7.1 × 10⁹ | 12.9 | 8.2 × 10⁹ | 17.1% |
| 2 | 950 | 7.9 × 10⁹ | 4.1 × 10¹⁰ | 3.1 × 10¹⁰ | 7.6 | 3.8 × 10¹⁰ | 18.1% |
| 3 | 1350 | 2.5 × 10¹⁰ | 1.7 × 10¹¹ | 1.2 × 10¹¹ | 4.7 | 1.5 × 10¹¹ | 17.4% |
To examine hypothesis (b), the theoretically resulting particle size at the end of the experiments, i.e., at trun = 8.75 h ( ), was calculated by assuming that the number of particles would indeed remain constant during stage II, namely between trun of 1.0 h and 8.75 h, which is obtained by rearranging Eq. 7:

Here, VM(OH)2 1.0 h and VM(OH)2 8.75 h is the total volume of Ni0.8Co0.1Mn0.1(OH)2 particles formed after trun of 1.0 h and 8.75 h, respectively, which was calculated via Eq. 3, while d50 1.0 h is the volume median particle size of the Ni0.8Co0.1Mn0.1(OH)2 particles collected after a trun of 1.0 h, determined by light scattering. A comparison of the thus obtained  values listed in Table II for each semi-batch run to the values obtained by light scattering in Table I reveals that the former are underestimated by ∼0.6-0.8 μm. By inspecting Eq. 3, this could be caused by a particle density that is significantly lower than the crystallographic density of Ni0.8Co0.1Mn0.1(OH)2 (
 ) used for the calculation of
  which would be the case if the secondary particles have a significant porosity. Therefore, the intra-particle porosity (εintra) of the Ni0.8Co0.1Mn0.1(OH)2 secondary particles collected after a run time of 8.75 h was determined by nitrogen physisorption. In our previous work it was demonstrated that the internal secondary particle porosity can be determined via N2 capillary condensation in these pores at a high relative p/p0 value of 0.995.
7
The resulting εintra values of ∼17%–18% are listed in Table II, indicating a significant secondary particle porosity. It is assumed that the uniformity of the εintra values stems from a nearly constant volume ratio of the porous secondary particle core to the overall secondary particle irrespective of the stirring speed (see below), which implies that εintra in the core and outer regions of the secondary particles are very similar independent of the stirring speed. Using these experimentally determined εintra values, the volume of the coprecipitated particles (
which would be the case if the secondary particles have a significant porosity. Therefore, the intra-particle porosity (εintra) of the Ni0.8Co0.1Mn0.1(OH)2 secondary particles collected after a run time of 8.75 h was determined by nitrogen physisorption. In our previous work it was demonstrated that the internal secondary particle porosity can be determined via N2 capillary condensation in these pores at a high relative p/p0 value of 0.995.
7
The resulting εintra values of ∼17%–18% are listed in Table II, indicating a significant secondary particle porosity. It is assumed that the uniformity of the εintra values stems from a nearly constant volume ratio of the porous secondary particle core to the overall secondary particle irrespective of the stirring speed (see below), which implies that εintra in the core and outer regions of the secondary particles are very similar independent of the stirring speed. Using these experimentally determined εintra values, the volume of the coprecipitated particles ( ) was recalculated by multiplying the
  term in Eq. 3 by (1-εintra) in order to account for the lower secondary particle density on account of their porosity. With the thus corrected
  values, the corresponding particle numbers for the different runs (
 ) were calculated from Eq. 5 and are given in Table II. By considering εintra, the apparent decrease in particle number over the course of stage I (i.e., between trun of 1.0 and 8.75 h) amounts to only ∼1%–12%. Thus, within the error of this analysis (e.g., using d50 values rather than a size distribution), the number of coprecipitated particles over the course of stage II remains essentially constant.
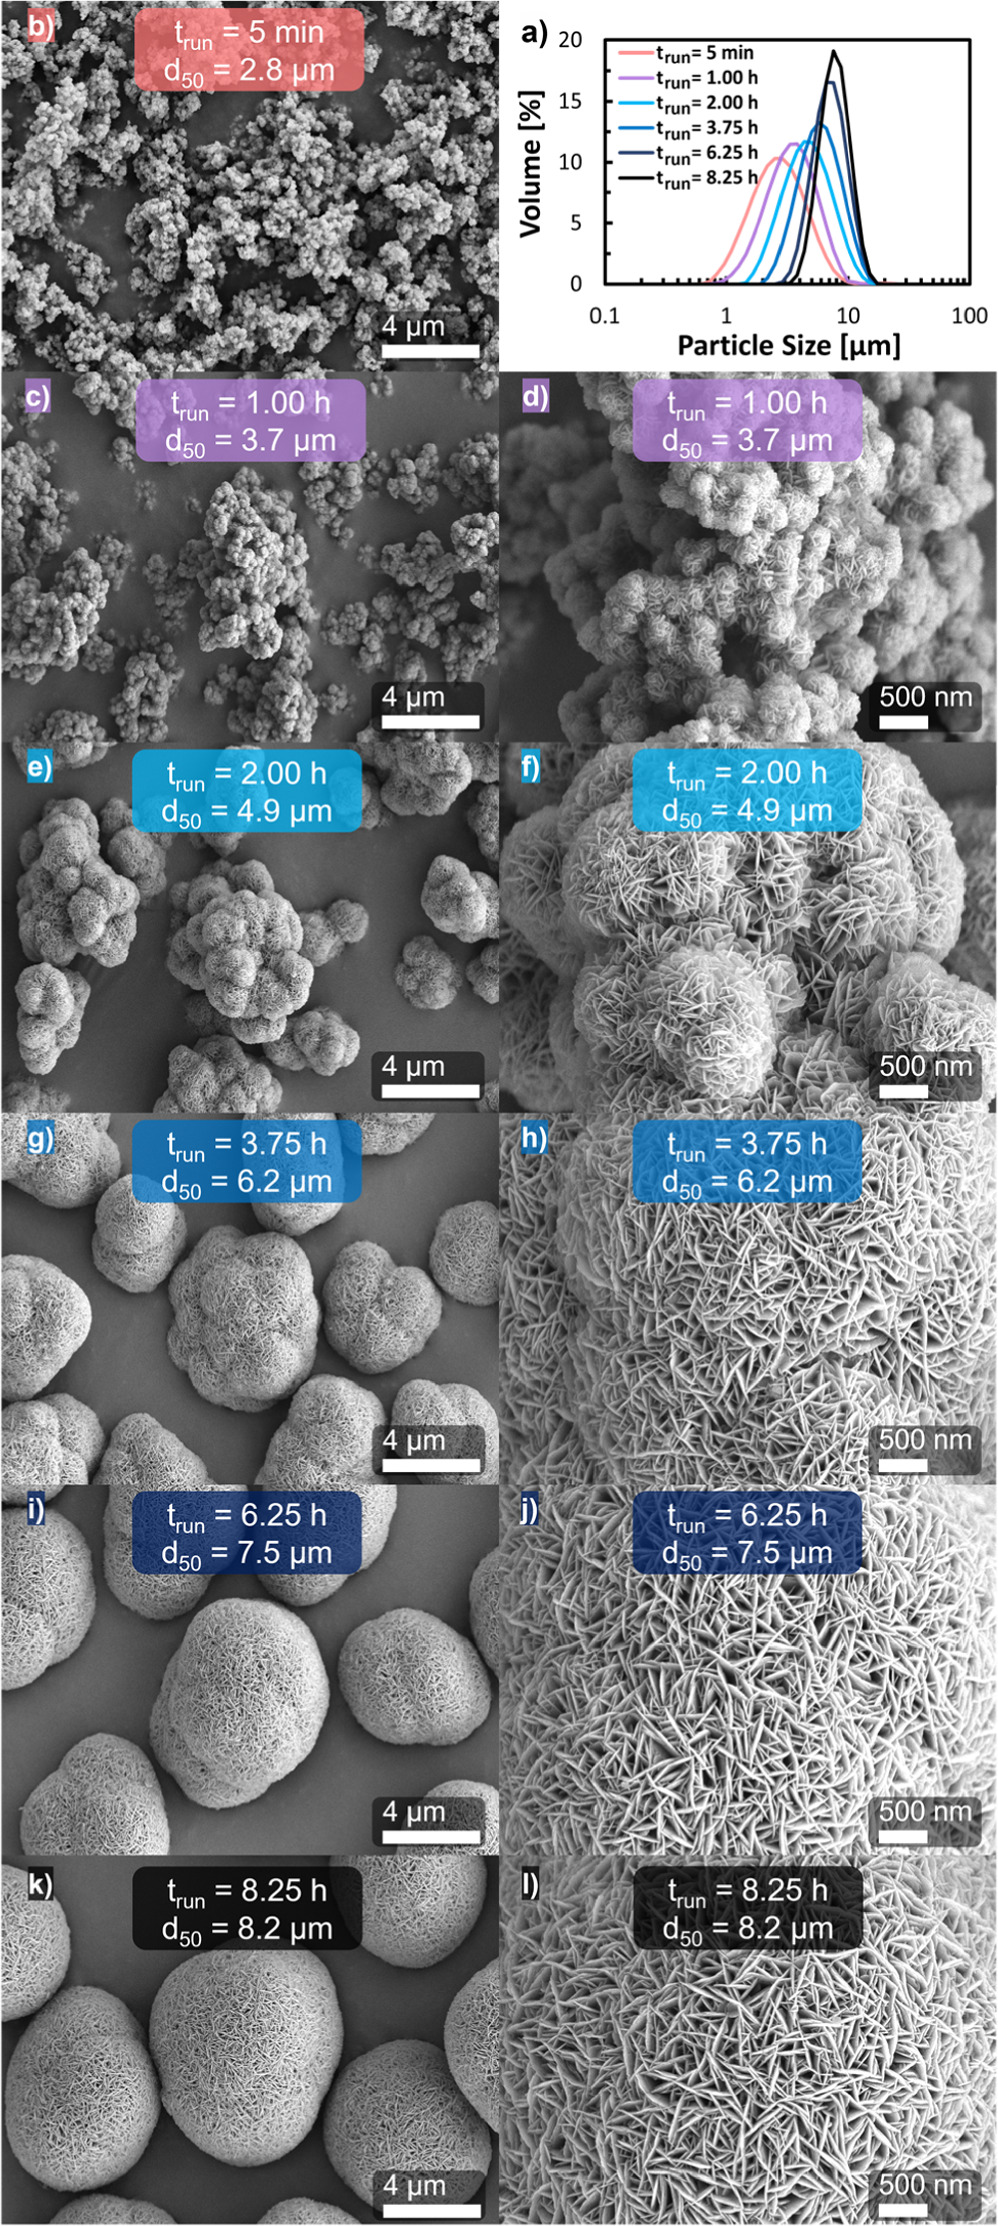
Figure 3. (a) Volume-based particle size distribution of Ni0.8Co0.1Mn0.1(OH)2 secondary particles obtained after different semi-batch coprecipitation run times at a stirring speed of n = 950 rpm. SEM top-view images at 5 k as well as at 20 k magnification of the corresponding Ni0.8Co0.1Mn0.1(OH)2 secondary particles after different run times: (b) 5 min (red), (c) & (d) 1.0 h (purple), (e) & (f) 2.0 h (light blue), (g) & (h) 3.75 h (blue), (i) & (j) 6.25 h (dark blue), and (k) & (l) 8.25 h (black).
Download figure:
Standard image High-resolution imageEven though the continuous withdrawal of solid volume by sampling reaction suspension from the reactor might account for part of the remaining decrease in Npar. during stage II (hypothesis (c)), the accumulated amount of sample volume withdrawn by the end of each run amounts to one-fifth of the total suspension volume, whereby the total amount of material lost due to sampling is significantly less. A significant sampling-induced loss of Npar.. would manifest as a deviation from Eq. 6 by an increase in growth rate, resulting in a continuous increase of the slope of the linear regressions depicted in Fig. 2b. Therefore, an impact on the particle growth kinetics and formation mechanism by sampling can be considered negligible.
In light of the above analysis, it is rationalized that the Ni0.8Co0.1Mn0.1(OH)2 particle formation can be divided in two distinctive stages: Initially, particles with a nearly constant diameter are generated by nucleation until enough solid mass is available in the reactor, so that the process during this period can be denoted as seeding stage (stage I in Fig. 2b). Analogous to seeded batch crystallizations, these particles serve as seed particles in the subsequent growth stage (stage II in Fig. 2b, in which solely particle growth is occurring, without a significant formation of new particles. The applied stirring speed during the semi-batch coprecipitation reaction seems to affect the size and number of particles formed in the seeding phase, which then determines the growth rate (G) during the growth phase, thus, the obtainable particle size after any given run time.
Analysis of the shape of coprecipitated Ni0.8Co0.1Mn0.1(OH)2 particles
For deeper insights into the particle formation mechanism, the morphology of particles at selected stages of particle growth during the semi-batch coprecipitation of Ni0.8Co0.1Mn0.1(OH)2 was characterized by top-view SEM imaging. Figure 3 displays SEM images and corresponding PSDs of Ni0.8Co0.1Mn0.1(OH)2 particles attained at various points in time for the run conducted at n = 950 rpm, whereby the selected run times are marked by the differently colored data points in Fig. 2. It is worthy to note that the PSDs depicted in Fig. 3a are mono modal, which is also true for the PSDs attained by light scattering for the semi-batch run at n = 950 rpm for run times that are not depicted in Fig. 3a, as well as in the other semi-batch experiments. The particles obtained during the initial phase of the coprecipitation run, i.e., after trun = 5 min exhibit a rather broad PSD (orange line in Fig. 3a) and are composed of undefined and loose aggregates (see Fig. 3b). After a trun of 1.0 h, consolidation of the inhomogeneous particle clusters into agglomerates has occurred (Fig. 3c), which are comprised of numerous tiny nano spheres and in turn consist of twinned and plate-like shaped primary particles (Fig. 3d) that are characteristic for beta-nickel hydroxide (Ni(OH)2) 57–61 and M(OH)2. 7,10,62 Please note that here the term aggregate was chosen as definition for loose particle assemblages that can be easily ruptured, while the term agglomerate was selected for particle consolidations that are cemented by solid bridges. 63 During that first hour of run time, the PSD span decreased slightly (by ∼14%, see Table I), but the PSD still remains comparably broad (see purple line in Fig. 3a). Particles collected at a trun of 2.0 h are aspherical and resemble the initial agglomerate structure with multiple radial extensions (Fig. 3e). At higher magnification (Fig. 3f), the radial orientation of the intergrown sub-micron sized plate-like shaped primary particles within such extensions becomes evident, whereby the vertical side ("edge") of the primary particles is exposed. This vertical side, which corresponds to the 001-plane 7,60 is pointing away from the center of the corresponding radial extension. With progressing trun, the number of radial extensions for a given aspherical secondary particle is decreased, while the radial extension size is enlarged (Fig. 3g); this further continues with run time, so that the rather heterogeneous structure exhibited by the initially coprecipitated particles (Fig. 3b) cannot be anymore identified after a trun of 6.25 h (Fig. 3i). Interestingly, the primary particles are always radially orientated around the secondary particle perimeter, with the vertical side of the primary particles facing away from the secondary particle center (Figs. 3h, 3j). Simultaneously, a continuous decrease in PSD span from 1.16 at trun = 2.0 h to 1.06 at trun = 3.75 h and to 0.83 at trun = 6.25 h is observed. Close to the end of the semi-batch experiment, i.e., at trun = 8.25 h, the various radial extensions within the secondary particle structure cannot be recognized any more, eventually resulting in spherical secondary particles without any indications of the initial agglomerate structure (Fig. 3k). These particles exhibit a ∼2-fold lower PSD span compared to the initially formed particles (0.76 vs 1.4, see Table I), which is reflected by the PSDs shown in Fig. 3 (black vs orange line). These hierarchically structured secondary particles are comprised of numerous sub-micron sized primary particles, as typically reported for NCM hydroxide precursor particles, 6,8–10,62 while the edge of the primary particles is consistently orientated towards the perimeter of the secondary particle (Fig. 3l).
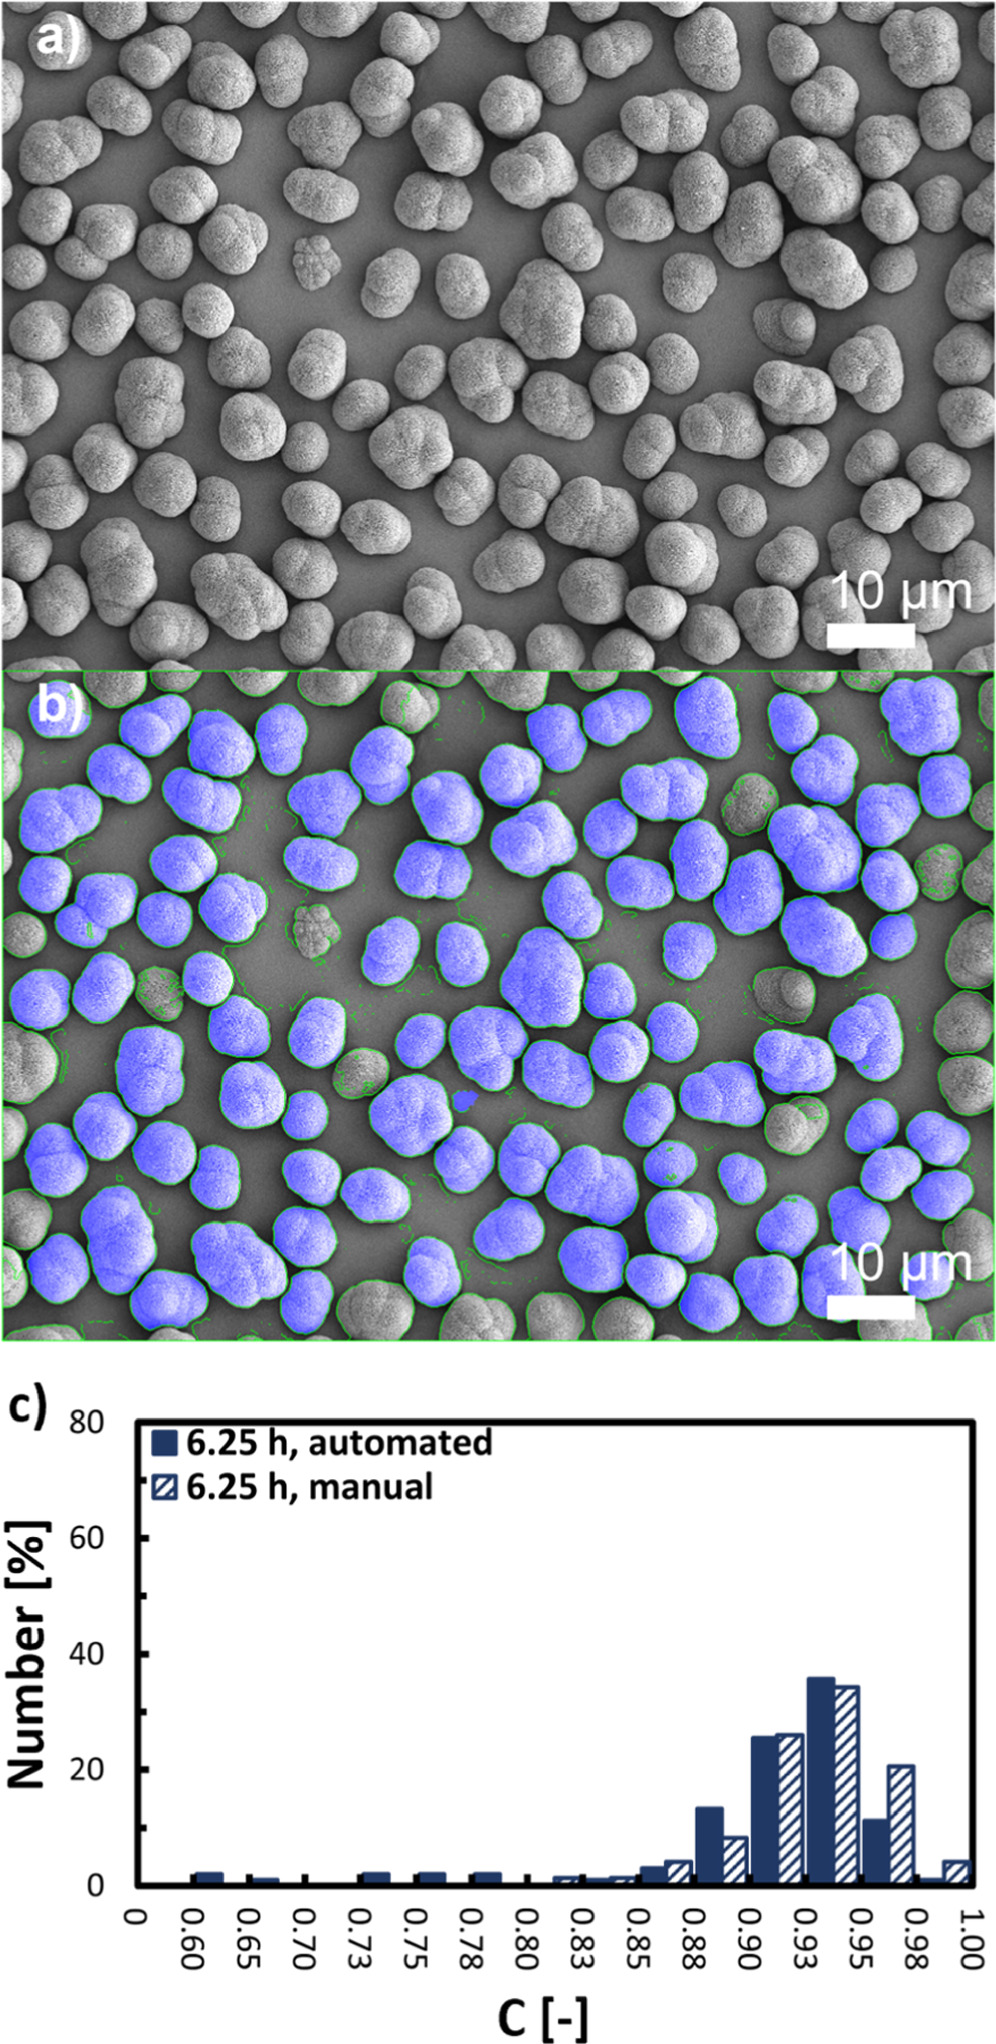
Figure 4. Quantification of particle circularity (C) as descriptor for the sphericity of Ni0.8Co0.1Mn0.1(OH)2 secondary particles by top-view SEM image analysis. (a) Top-view SEM image at 1 k magnification of Ni0.8Co0.1Mn0.1(OH)2 secondary particles obtained from the semi-batch coprecipitation after 6.25 h at a stirring speed of n = 950 rpm. (b) Selection criteria for the automated, algorithm-based secondary particle segmentation, whereby the particles that were selected for automated analysis are highlighted in blue overlay (the other particles were rejected for analysis due to incomplete imaging, insufficient contrast, or partial particle overlap). (c) Comparison of the number-based circularity distribution of Ni0.8Co0.1Mn0.1(OH)2 secondary particles determined by automated (filled) and by manual segmentation (unfilled).
Download figure:
Standard image High-resolution imageIn agreement with the two distinct stages observable in the particle growth profiles depicted in Fig. 2b, the development of the corresponding secondary particle morphology can likewise be divided into two stages:
- (i)The initial particles formed during the seeding stage (trun < 1.0 h) exhibit a loose and undefined aggregate-like structure, which is originating from a rapid nucleation of nanospheres. These nanoparticles immediately coagulate to particle clusters and are cemented to agglomerates by the ensuing crystal growth via solid bridge formation. That the particle formation during the seeding stage (between a trun of 5 min and 1.0 h) is governed by an agglomeration mechanism is supported by the inverse correlation of the secondary particle d50 values with the stirring speed during the respective semi-batch coprecipitation (Fig. 2, Table I). This result reflects the fact that the turbulence inside the agitated reaction vessel is governing the particle-particle attachment by agglomeration, which can be manipulated by the stirring speed. 55,56
- (ii)During the subsequent growth stage (trun < 1.0 h), the data suggest that the consolidated agglomerates generated during the seeding phase increase in size by lateral crystal growth of individual primary particles ("polycrystallization"), because the vertical side of the primary particles is consistently orientated towards the outer perimeter of the secondary particle during the growth phase (Figs. 3d, 3f, 3h, 3j, and 3l). This seems to result in an overall enhancement of the Ni0.8Co0.1Mn0.1(OH)2 secondary particle sphericity throughout the semi-batch reaction.
To quantitatively verify the increase in secondary particle sphericity over the course of the conducted experiments, SEM top-view images of Ni0.8Co0.1Mn0.1(OH)2 secondary particles at selected stages of the semi-batch coprecipitations conducted at various stirring speeds were segmented. The SEM images were taken at 1 k magnification and an automated segmentation algorithm was employed, that is analogous to the model employed by other authors. 20,42 By two-dimensional approximation of the segmented secondary particles, the area and perimeter of secondary particles was determined. This allows the calculation of the secondary particle circularity (C) as a two-dimensional descriptor for the secondary particle sphericity, which is a three-dimensional property, according to isoperimetric quotient given in Eq. 10. On average, the C values of 60-100 secondary particles per sample were determined and number-based C value distributions were formulated. Figure 4 exemplary displays a SEM image of Ni0.8Co0.1Mn0.1(OH)2 secondary particles collected at trun of 6.25 h during the semi-batch coprecipitation performed at n = 950 rpm (run 2) before (Fig. 4a) and after automated segmentation (Fig. 4b). The secondary particles in the SEM image that were not considered by the algorithm are encircled in green, while particles for which the C value was determined are additionally colored in blue.

Figure 5. (a) Number median particle circularity (C50) determined from SEM top-view images of secondary particles obtained at various stages of particle growth during semi-batch coprecipitation of Ni0.8Co0.1Mn0.1(OH)2 at various stirring speeds (n). The error bars represent the circularity span (Cspan, defined by Eq. 11), which indicates the width of circularity distributions that was determined from SEM top-view images. SEM top-view images at 5 k magnification of the dried Ni0.8Co0.1Mn0.1(OH)2 secondary particles obtained after a run time of 8.75 h, with the coprecipitation conducted at different stirring speeds: (b) n = 1350 rpm; (c) n = 950 rpm; and, (d) n = 550 rpm.
Download figure:
Standard image High-resolution imageThe validity of the algorithm-based segmentation was exemplarily verified by manual segmentation, and the resulting number-based C value distributions extracted from the SEM image displayed in Fig. 4a are compared in Fig. 4c. The obtained distributions are in good agreement, and only minor deviations can be observed for secondary particles exhibiting nearly perfect circularity (C > 0.95) and for rather non-circular particles (C < 0.80). The discrepancy for C > 0.95 might be ascribed to circular secondary particles, which were not considered by the algorithm due to local brightness inhomogeneities across the secondary particle structure that results in a blending with the background brightness. The discrepancy for C < 0.80 might be due to improper segmentation of overlapping secondary particles by the model, which results in an underestimation of the C value for the particle that is being overlapped, whereby such overlapped particles were not considered during manual segmentation. However, these slight discrepancies result in an only minor deviation of ∼2% when comparing the number median circularity (C50) determined from the C value distributions obtained by both methods (data not shown). In an analogous manner, the validity of the segmentation was further exemplarily verified for Ni0.8Co0.1Mn0.1(OH)2 secondary particles obtained at a trun of 3.75 h and 8.25 h during the semi-batch coprecipitation conducted at n = 950 rpm. The resulting number-based C value distributions are given in Fig. A.1. Again, the discrepancy between the automated and the manual segmentation based C50 values is rather minor, with only ∼4% for particles collected at a trun of 3.75 h and ∼1% for particles collected at a trun of 8.25 h. It is worthy to note that C values for secondary particles formed at run times shorter than 2.0 h were not determined, due to an excessive deviation of the secondary particles from a circular shape (Figs. 3b–3d). Furthermore, due to the two-dimensional approximation of three-dimensional particles, which is the basis of Eq. 10, some three-dimensional aspherical features of the particle that are not located on or near the perimeter of the particle, are underestimated or even not considered. This, e.g., is the case when radial extensions are orientated towards the camera's line-of-sight in top-view SEM images. Therefore, it is assumed, that values for C obtained via the here presented method as a two-dimensional descriptor for particle sphericity, which is a three-dimensional property, are slightly overestimating the actual sphericity of secondary particles. Regardless, however, it is demonstrated that reasonable results can be obtained by the algorithm-based determination of the secondary particle circularity as descriptor for the secondary particle sphericity from SEM images by the here applied approach. This allows a quantitative assessment of the subjectively observable increase in secondary particle sphericity in Fig. 3.
Figure 5 a depicts the automated SEM image segmentation-based evolution of the C50 values of secondary particles collected after similar run times (within trun
 0.25 h) during semi-batch coprecipitation of Ni0.8Co0.1Mn0.1(OH)2 conducted at three different stirring speeds. For all three runs, the relative increase in C50 with increasing d50 during the growth stage (stage II in Fig. 2b) between trun = 2.0 h and trun = 8.25 h is similar, namely ∼20%-30%. Furthermore, the width of the circularity distributions (Cspan, defined by Eq. 11), that is represented by the error bars in Fig. 5a, decreases by factor of ∼4–5 with increasing trun for all three semi-batch experiments. However, in contrast to the inverse relationship between d50 and the stirring speed (Fig. 2), the C50 values of the particles at a trun of 2.0 h (left-most data points within each run in Fig. 5a) increase with the stirring speed. It is also interesting to note that even though the slowest stirring speed (n = 550 rpm) yields the largest secondary particles, those particles exhibit the lowest C50 (see Fig. 5a). Close to the beginning of stage II, particles with a d50 of 8.1 μm and a C50 of 0.63 are obtained for n = 550 rpm, growing into particles with a d50 of 13.5 μm and a C50 of 0.83 at trun = 8.25 h. In comparison, for n = 1350 rpm, much smaller particles with higher circularity are obtained: at trun = 2.0 h, the secondary particles have a d50 of only 2.9 μm and a C50 of already 0.81, which at trun = 8.0 h increases to a still rather small d50 of 5.0 μm and a C50 of 0.95. The Ni0.8Co0.1Mn0.1(OH)2 secondary particles produced with n = 950 rpm display comparable particle circularities compared to the experiment with n = 1350 rpm, but with larger particle sizes for any given run time (see Fig. 5a). Further, due to the increase of C50 over trun (thus with increasing d50) for all three conducted runs, Cspan must intrinsically decrease with increasing trun as non-circular particles become more circular over time while already circular particles remain circular. This results in the observed narrowing of Cspan with increasing trun for all three runs.
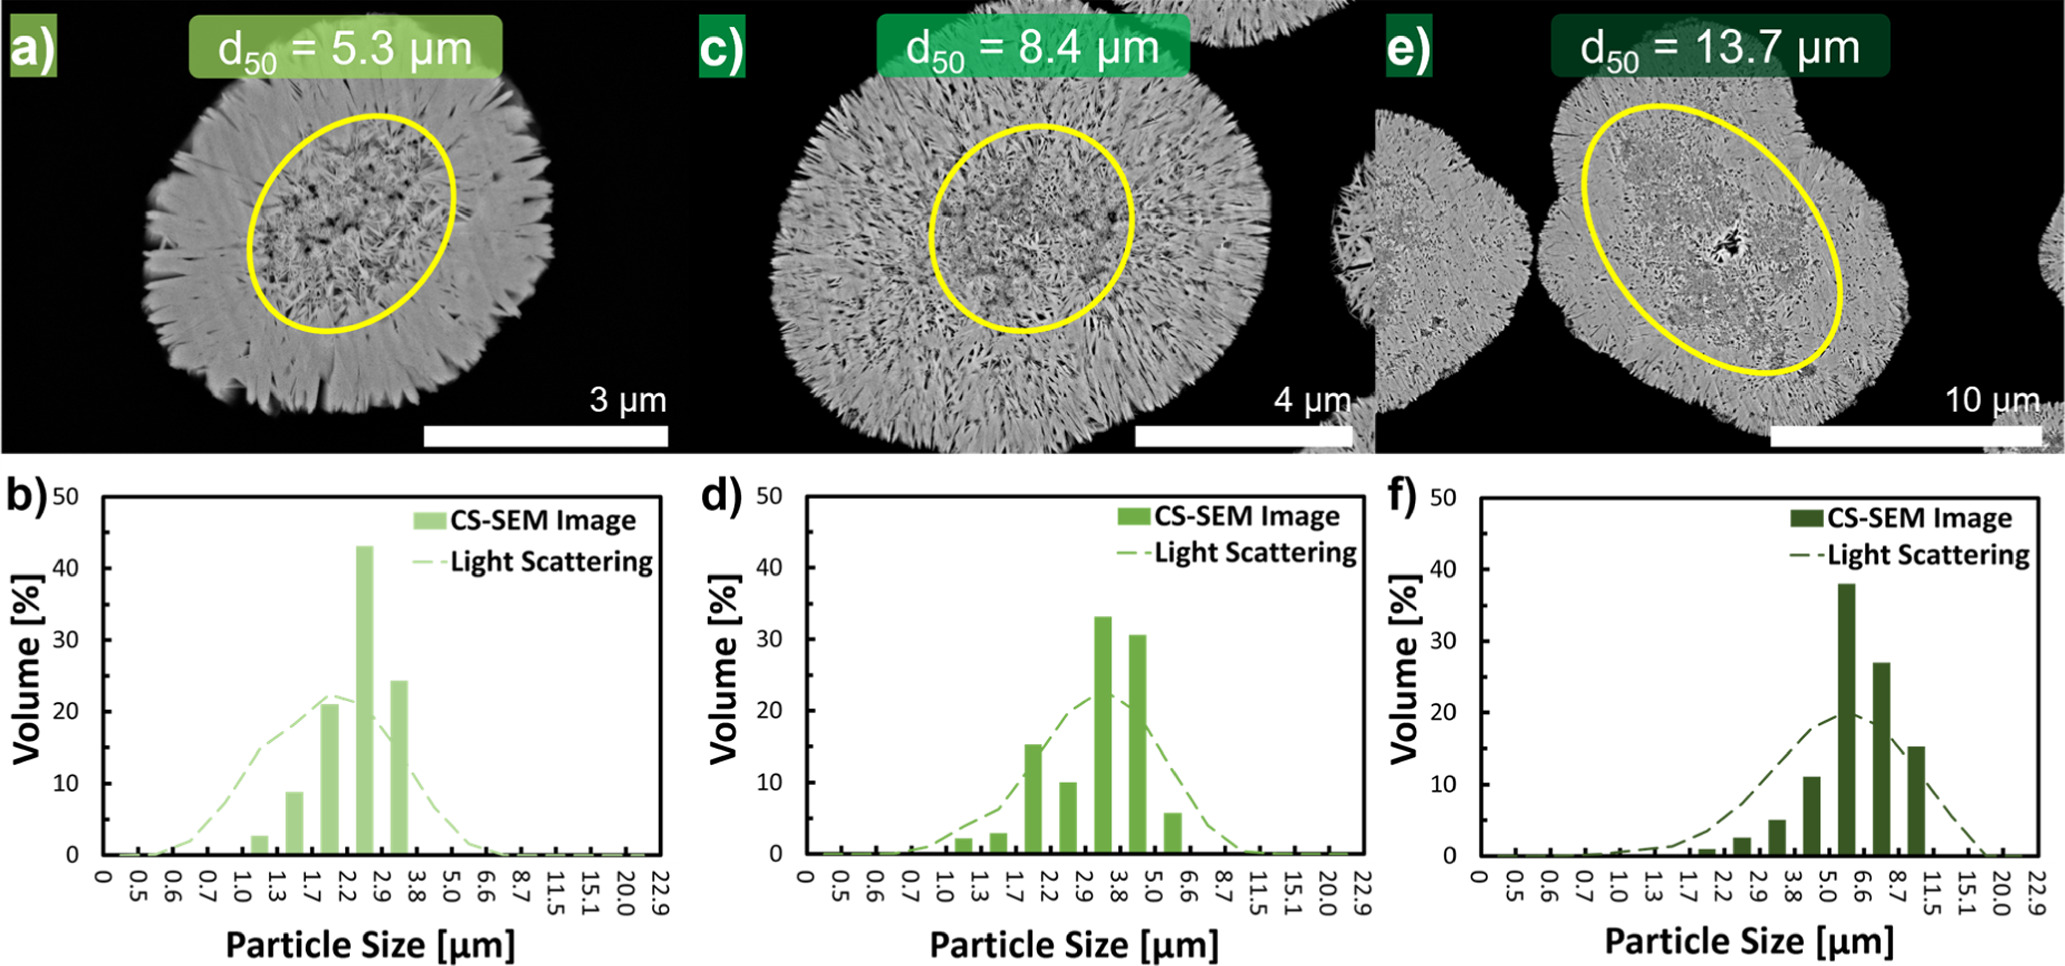
Figure 6. Exemplary cross-sectional SEM images of Ni0.8Co0.1Mn0.1(OH)2 secondary particles obtained after trun = 8.75 h for different stirring speeds: (a) n = 1350 rpm (5 k magnification); (c) n = 950 rpm (10 k magnification); and, (e) n = 550 rpm (15 k magnification). The secondary particle core is encircled in yellow, marking the area that was used to quantify the equivalent diameter (deq., acc. to Eq. 12). The lower panels compare the volume-based particle size distributions of the Ni0.8Co0.1Mn0.1(OH)2 secondary particles obtained by semi-batch coprecipitation after trun = 1.0 h, i.e., at the seeding-to-growth transition (dashed line, determined by light-scattering) with the volume-based core size distribution obtained by cross-sectional SEM images of coprecipitated particles (deq. values based on ∼50 images per run) obtained after trun = 8.75 h (bars) and produced at different stirring speeds: (b) n = 1350 rpm; (d) n = 950 rpm; and, (f) n = 550 rpm.
Download figure:
Standard image High-resolution imageThe quantitative differences in secondary particle circularity are further visualized by SEM top-view images of the final Ni0.8Co0.1Mn0.1(OH)2 particles obtained by semi-batch coprecipitation after trun = 8.75 h at stirring speeds of 1350 rpm (Fig. 5b), 950 rpm (Fig. 5c), and 550 rpm (Fig. 5d). Identical to the secondary particles throughout the growth phase at n = 950 rpm (Figs. 3e–3l), the secondary particles obtained at 1350 rpm and 550 rpm consist of numerous sub-micron primary particles, which is characteristic for NCM hydroxide precursors. 6–10,62 Furthermore, the vertical side of the primary particles is consistently orientated towards the outer perimeter of the secondary particles, which verifies that independent of the applied stirring speed, the secondary particle size increases by the growth of the individual primary particles. In accordance with the C value analysis conducted above, the Ni0.8Co0.1Mn0.1(OH)2 secondary particles prepared at n = 1350 rpm and n = 950 rpm exhibit an equal sphericity with no radial particle extensions or recognizable traces of the initial agglomerate structure, whereby the secondary particles obtained at 1350 rpm are smaller compared to those obtained at 950 rpm. The secondary particles obtained at 550 rpm are the largest, but still exhibit an aspherical shape, which consists out of multiple radial extensions originating from the initially formed agglomerates, consistent with their still relatively low C50 value of ∼0.8 (see Fig. 5a).
In summary, one can conclude that the stirring speed during the semi-batch coprecipitation of Ni0.8Co0.1Mn0.1(OH)2 determines the initial agglomerate size and number formed during the seeding stage, which not only governs the growth rate and thus the resulting particle size in the subsequent growth phase, but also the ability of the secondary particles to achieve a high degree of sphericity for a given particle size and run time. Overall, with increasing stirring rate, smaller Ni0.8Co0.1Mn0.1(OH)2 particles with higher sphericity can be obtained (see Fig. 5), while the PSD span is unaffected by the stirring rate (see Table I).
Cross-sectional analysis of Ni0.8Co0.1Mn0.1(OH)2 particles
Complementary evidence for a two-stage particle formation mechanism was found by evaluation of cross-section SEM images of Ni0.8Co0.1Mn0.1(OH)2 secondary particles obtained by semi-batch coprecipitation after trun = 8.75 h. Exemplary SEM cross-section images of Ni0.8Co0.1Mn0.1(OH)2 secondary particles attained at n = 1350 rpm, 950 rpm, or 550 rpm are displayed in Figs. 6a, 6c, and 6e, respectively. Independent of the stirring speed, the secondary particle structure can be divided into two parts: A particle core consisting of loosely arranged nanometer-sized primary particles, which is followed by a layer of elongated primary particles aligned around the core and orientated towards the outer perimeter of the secondary particle. This coincides well with the above observation that the vertical side of the plate-like shaped primary particles is consistently pointing towards the outer perimeter of the secondary particles. However, it is noteworthy that these core–shell features exhibiting radial patterns can only be observed by cross-sectional SEM imaging if the secondary particle has been perfectly sliced through the equator of the secondary particles during the SEM sample preparation.
Analogous to the size of the initial particles formed during the seeding stage (trun ≤ 1.0 h), the magnitude of the secondary particle core scales inversely with the applied rotation speed in the respective run. This suggests that the core within the secondary particle structure corresponds to the initial agglomerates formed during the seeding stage, which increase in size by polycrystallization. To quantitatively verify this hypothesis, the size of the core in secondary particles was determined by manual segmentation of cross-sectional SEM images. The area of the porous particle cores of ∼50 cross-sectionally sliced Ni0.8Co0.1Mn0.1(OH)2 secondary particles obtained after trun = 8.75 h for each semi-batch run was determined. The equivalent particle diameter (deq.) of a circle with the identical area as the measured area of the particle core was calculated by applying Eq. 12. From the resulting deq. values, volume-based core size distributions were constructed. These are shown in Figs. 6b, 6d, and 6f (green colored bars), where they are compared to the PSDs of secondary particles at the transition of the seeding into the growth stage, i.e., at trun = 1.0 h, which were determined by light-scattering (green colored dashed lines). Overall, the size distributions of the secondary particle cores coincide well with the light scattering derived PSDs at the transition point.
This correspondence was further quantitatively verified by determining the volume-based median core size of the Ni0.8Co0.1Mn0.1(OH)2 secondary particles ( ) from the respective cross-sectional SEM based core size distribution. Table III gives a comparison of these
  values with the d50, 1 h values of the secondary particles obtained at the seeding-to-growth transition, i.e., at trun = 1.0 h (obtained by laser scattering and taken from Table I), revealing an excellent agreement between these two parameters for each of the respective runs (with differences of less than 10%). Consequently, it is reasonable to assume that the core within the secondary particles corresponds to the initial agglomerates formed during the seeding stage and that the core size is inversely proportional to the stirring speed. The somewhat irregular morphology of the core might originate from the inclusion of void spaces during the chaotic aggregation of nanospheres throughout the seeding stage. After the aggregate has solidified to an agglomerate, only primary particles that are in intimate contact with the mother liquor are able to grow, as they are accessible for diffusion of lattice ions towards the solid surface. By contrast, primary particles that are located in the inside of the agglomerate are inaccessible by lattice ions, which could potentially fill the pores among primary particles with crystallizing matter. This results in void spaces in the core compared to the shell, even though void spaces persist in the entire secondary particle structure. Similar core–shell like features of secondary particles exhibiting radially aligned primary particles were also identified by SEM imaging of cross-sectionally cut secondary particles of precipitated Ni(OH)2,
60,61
Ni0.75Co0.15Mn0.10(OH)2,
64
Ni0.83Co0.07Mn0.10(OH)2,
65
and Ni1/3Co1/3Mn1/3(OH)2.
12
values with the d50, 1 h values of the secondary particles obtained at the seeding-to-growth transition, i.e., at trun = 1.0 h (obtained by laser scattering and taken from Table I), revealing an excellent agreement between these two parameters for each of the respective runs (with differences of less than 10%). Consequently, it is reasonable to assume that the core within the secondary particles corresponds to the initial agglomerates formed during the seeding stage and that the core size is inversely proportional to the stirring speed. The somewhat irregular morphology of the core might originate from the inclusion of void spaces during the chaotic aggregation of nanospheres throughout the seeding stage. After the aggregate has solidified to an agglomerate, only primary particles that are in intimate contact with the mother liquor are able to grow, as they are accessible for diffusion of lattice ions towards the solid surface. By contrast, primary particles that are located in the inside of the agglomerate are inaccessible by lattice ions, which could potentially fill the pores among primary particles with crystallizing matter. This results in void spaces in the core compared to the shell, even though void spaces persist in the entire secondary particle structure. Similar core–shell like features of secondary particles exhibiting radially aligned primary particles were also identified by SEM imaging of cross-sectionally cut secondary particles of precipitated Ni(OH)2,
60,61
Ni0.75Co0.15Mn0.10(OH)2,
64
Ni0.83Co0.07Mn0.10(OH)2,
65
and Ni1/3Co1/3Mn1/3(OH)2.
12
Table III. The volume-based median core size of Ni0.8Co0.1Mn0.1(OH)2 secondary particles ( ) determined by the analysis of cross-sectional SEM images of Ni0.8Co0.1Mn0.1(OH)2 secondary particles attained by semi-batch coprecipitation after trun = 8.75 h for various stirring speeds (n). This is compared to the volume-based secondary particle diameter obtained after trun = 1.0 h (d50, 1.0 h, based on laser scattering and taken from Table I). The last two columns provide the Reynolds Number (Re) calculated by Eq. 14 as well as the average volume energy input (Eavg.) calculated by Eq. 15, both being given for the conditions at trun = 0.0 h.
| Run | n [rpm] |
 [μm] [μm] | d50, 1.0 h [μm] | Re [-] | Eavg. [W/l] |
|---|---|---|---|---|---|
| 1 | 550 | 6.2 | 6.2 | 41041 | 1.54 |
| 2 | 950 | 3.4 | 3.7 | 70890 | 7.94 |
| 3 | 1350 | 2.5 | 2.3 | 100739 | 22.8 |
Characterization of turbulence during coprecipitation of Ni0.8Co0.1Mn0.1(OH)2
In general, the stirring speed is only an indicator for the turbulence in a stirred-tank reactor, since the turbulent flow caused by stirring also depends on the properties of the stirred fluid as well as the physical dimensions and the other features of the reaction vessel (e.g., stirrer blade configuration). For a better characterization of the prevailing turbulence in an agitated reaction vessel, the dimensionless Reynolds number (Re) and the average volume energy input (Eavg.) can be used. Both values allow comparing the turbulent motion of a fluid between distinctive reactor setups. 66–68 The Reynolds number represents the ratio of inertial forces to viscous forces of a fluid in a stirred-tank reactor and is defined as:

Here, ρfluid is the density of the stirred fluid (=985.0 kg m−3 for H2O at 55 °C, representing the condition at trun = 0.0 h), n is the stirring speed in units of 1/s, d is the stirrer diameter (=0.05 m), and μ is the dynamic viscosity of the stirred fluid (=0.00055 kg ms−1 for H2O at 55 °C) The parameter Eavg. describes the kinetic energy imparted into the stirred liquid and can be calculated according to:

Here, Ne is the dimensionless Newton Number, which for the here used 45° pitch-blade stirrer and for the turbulent regime with Re > 10000 equals to Ne = 1.3, 69 and Vtotal is the volume of the reaction suspension (=200 ml at a trun = 0.0 h).
The Re and Eavg. values for the three different stirring rates are listed in Table III. By increasing the stirring speed from 550 rpm to 1350 rpm, Re increases by a factor of ∼2.5, while Eavg. is increased by factor of ∼15. Even though an intensification of turbulence by strong stirring increases the particle collision frequency within the fluid, the shear stress induced by hydrodynamic forces on the aggregates is concomitantly amplified. This in turn results in the breakage of aggregates before cementation occurs via solid bridge formation by the further crystallization reaction. Permanent particle attachment is additionally reduced due to the higher particle velocities with increasing turbulence, hence higher particle momentum. This leads to higher impact energy upon particle-particle collision and effectively decreases the agglomeration probability. These phenomena overall result in a decrease in the maximum aggregate and/or agglomerate size with increasing turbulence, thus increasing Re and Eavg.. 55,56 The same inverse relationship between Re and Eavg. vs. the aggregate and agglomerate size was observed in this study. Here, during the seeding stage, the Ni0.8Co0.1Mn0.1(OH)2 particle size (i.e., d50 5 min and d50, 1.0 h, see Table I) decreases by a factor of ∼2.6–2.7 when n (=input parameter for Re and Eavg.) is increased from 550 to 1350 rpm, which corresponds to an increase of n by a factor of ∼2.5. Since the particle size decreases by a factor of ∼2.6-2.7, the particle number (Npar., 5 min and Npar.,1.0 h, see Table II) increases by a factor of ∼18-20, which closely corresponds to 2.6–2.73, as is required by a mass balance. Since the number of particles formed during the seeding stage determines the solid surface area, the growth rate (G) during the ensuing growth stage and therefore, the particle size at the end of the semi-batch experiment (i.e., d50, 8.75 h), consequently exhibit similar correlations by factor 2.5 and 2.6 (Table I), respectively. Thus, it is rationalized that the degree of turbulence inside the stirred-tank reactor, which can be quantified by Re and Eavg., regulates the aggregation and agglomeration during the seeding stage, which governs the size and number of Ni0.8Co0.1Mn0.1(OH)2 secondary particles formed during the seeding stage.
Similar reports on the impact of stirring speed on agglomeration rates, thus agglomerate size, have been reported for the coprecipitation of various material classes in stirred-tank reactors operated in (semi-)batch 70–72 or continuous mode. 73,74 Additionally, a decrease of the final secondary particle size accompanied by an increase in secondary particle sphericity has been observed during the continuous coprecipitation of Ni1/3Co1/3Mn1/3(OH)2, 10 Ni0.90Co0.05Mn0.05(OH)2, 75 and Ni0.80Co0.15Al0.05(OH)2 76 in a Couette Taylor reactor when increasing the rotational speed of the inner cylinder. The analogous observations have been made when increasing the stirring speed in a stirred-tank reactor during the coprecipitation of Ni(OH)2, 77 Ni0.5Co0.2Mn0.3(OH)2, 9 Ni0.6Co0.2Mn0.2(OH)2, 78 and Ni0.225Co0.125Mn0.65(OH)2. 79
Particle formation mechanism during coprecipitation of Ni0.8Co0.1Mn0.1(OH)2
Considering the two distinctive stages in the development of the Ni0.8Co0.1Mn0.1(OH)2 secondary particle size (Fig. 2b) and respective morphology (Figs. 3 and 6) as well as the increase in secondary particle circularity as descriptor for particle sphericity (Fig. 5) during the growth phase, the two-step particle formation mechanism of Ni0.8Co0.1Mn0.1(OH)2 secondary particles depicted in Fig. 7 is proposed. Initially nucleation (I) induces the formation of nanosized spheres comprised of several twinned plate-like primary particles (II) that are subjected to rapid and chaotic aggregation to randomly arranged particle clusters (III). Due to solid bridge formation by ensuing lateral crystal growth of individual primary particles, the generated loose aggregates are consolidated to agglomerates, while primary particle growth in direction away of the agglomerate core results in radial extensions leading to aspherical secondary particles (IV). Continuous secondary particle growth by polycrystallization, which is characterized by the lateral crystal growth of individual primary particles leads to a smearing out of the initial irregular agglomerate structure, so that eventually well-defined spherical secondary particles with a core–shell structure (V) are attained. The size of the initial agglomerates can be manipulated by the turbulence, which governs the growth rate and the capability of secondary particles to become spherical after a given run time. Additionally, the particle size increase within each run is independent of their size and therefore, the surface mass specific uptake is nearly identical for every particle. This results in a narrowing PSD with progressing particle growth throughout the coprecipitation reaction.

Figure 7. Schematic illustration for the proposed two-step secondary particle formation mechanism during coprecipitation of Ni0.8Co0.1Mn0.1(OH)2. Initially nucleation (I) induces the formation of nanosized spheres comprised of several twinned plate-like primary particles (II) that are subjected to rapid and chaotic aggregation to undefined particle clusters (III). Due to solid bridge formation by ensuing lateral crystal growth of individual primary particles, the generated loose aggregates are consolidated to agglomerates, while primary particle growth in direction away of the agglomerate core results in radial extensions leading to aspherical secondary particles (IV). Continuous secondary particle growth by polycrystallization, which is characterized by the lateral crystal growth of individual primary particles leads to a smearing out of the initial irregular agglomerate structure, so that eventually well-defined spherical secondary particles with a core–shell structure (V) are attained.
Download figure:
Standard image High-resolution imageDespite an analogous development of secondary particle morphology from irregular-shaped agglomerates to polycrystalline spherical secondary particles was observed by SEM imaging in several studies, 6,47,61,80,81 the overall proposed particle formation mechanism in this work is in contrast with prevailing theories present in the literature for the coprecipitation of M(OH)2 in a stirred-tank reactor. Numerous studies report that the secondary particle enlargement during coprecipitation of M(OH)2 results from a continuous agglomeration of primary particles. 9,48,75,82–84 In other instances, Ostwald ripening is suggested as the underlying particle growth mechanism, hence dissolution of generated nuclei and/or small primary particles, followed by recrystallization on existing secondary particles, 6,39,85 which is suggested to also result in a decrease in particle size distribution width with progressing coprecipitation time. 86 Others have also been claiming a simultaneous occurrence of agglomeration and Ostwald ripening. 80,81
Since the particle collision frequency followed by permanent particle attachment during agglomeration is based on a statistic encounter of primary particles due to the isotropic turbulence in stirred vessels,
55,87,88
a random primary particle orientation would be attained as it is in the case for true aggregates and agglomerates.
89,90
Hence, a consistent orientation of the vertical side of the primary particles towards the outer perimeter of the spherical secondary particle as observed for M(OH)2 (co)precipitation, accompanied by a radial alignment of primary particles around the secondary particle core, can hardly be justified by agglomeration. Furthermore, an overall irregular-shaped particle structure would be expected in contrast to spherical secondary particles. An increase in secondary particle sphericity by shear force at higher degrees of turbulence, which makes particles more spherical over time, is also questionable, as this would result in a considerable number of attritional fragments,
91,92
which were not observed by light scattering or SEM imaging, and which would lead to a deviation from the d50∼![$\sqrt[3]{{{\rm{t}}}_{{\rm{run}}}}$](https://content.cld.iop.org/journals/1945-7111/170/11/110513/revision2/jesad050bieqn33.gif) relationship during particle growth, due to the formation of new particles. Additionally, the emergence of a second particle modal originating from a second nucleation event after prolonged reaction time, observed by Kim et al. during semi-batch coprecipitation of Ni0.855Co0.155(OH)2,
93
is difficult to conciliate with an agglomerate mechanism, when considering that there is no driving force for continuously generated primary particles at a certain point throughout the coprecipitation reaction to suddenly form new secondary particle agglomerates instead of agglomeration with already existing secondary particles. A surface charge controlled self-assembly of primary particles in the sense of a controlled agglomeration of primary particles as origin for circular arrangement of primaries is also highly unlikely, because the surface charge results from an electrochemical double layer that is surrounding the particles and that decreases drastically in thickness with increasing ionic strength of the solution. Accordingly, it is reported that above an ionic strength of 0.1 M, the thickness of the electrochemical double layer is below 4.0 nm for a 1:1 electrolyte, and is even further decreased for electrolytes of higher valency.
94
For the relatively highly concentrated feed solutions (2.6 M MSO4(aq.) and 7.9 M NaOH) as well the volumetric flow rates in this work, the salt concentration of 0.1 M in the reaction mixture is already exceeded after only 20 min of the semi-batch coprecipitation reaction due to Na2SO4 formation according to Eq. 1. At such high ionic concentrations, surface charge driven phenomena become insignificant, as the critical ion concentration above which coagulation was observed to occur for Na+ salt based systems was reported to be already above 0.12 M.
95
This is further emphasized by the fact that during the very early stage of crystallization the agglomeration of nanospheres for the formation of the secondary particle core could not proceed in a controlled manner and resulted in chaotic particle clusters as shown in Figs. 3b–3d.
96
relationship during particle growth, due to the formation of new particles. Additionally, the emergence of a second particle modal originating from a second nucleation event after prolonged reaction time, observed by Kim et al. during semi-batch coprecipitation of Ni0.855Co0.155(OH)2,
93
is difficult to conciliate with an agglomerate mechanism, when considering that there is no driving force for continuously generated primary particles at a certain point throughout the coprecipitation reaction to suddenly form new secondary particle agglomerates instead of agglomeration with already existing secondary particles. A surface charge controlled self-assembly of primary particles in the sense of a controlled agglomeration of primary particles as origin for circular arrangement of primaries is also highly unlikely, because the surface charge results from an electrochemical double layer that is surrounding the particles and that decreases drastically in thickness with increasing ionic strength of the solution. Accordingly, it is reported that above an ionic strength of 0.1 M, the thickness of the electrochemical double layer is below 4.0 nm for a 1:1 electrolyte, and is even further decreased for electrolytes of higher valency.
94
For the relatively highly concentrated feed solutions (2.6 M MSO4(aq.) and 7.9 M NaOH) as well the volumetric flow rates in this work, the salt concentration of 0.1 M in the reaction mixture is already exceeded after only 20 min of the semi-batch coprecipitation reaction due to Na2SO4 formation according to Eq. 1. At such high ionic concentrations, surface charge driven phenomena become insignificant, as the critical ion concentration above which coagulation was observed to occur for Na+ salt based systems was reported to be already above 0.12 M.
95
This is further emphasized by the fact that during the very early stage of crystallization the agglomeration of nanospheres for the formation of the secondary particle core could not proceed in a controlled manner and resulted in chaotic particle clusters as shown in Figs. 3b–3d.
96
The size-dependent growth rate induced by Ostwald ripening of a solid depends amongst others on the bulk solubility of the ripening solid. 97 The coprecipitation of M(OH)2 is typically conducted in the pH-regime of 11.0–13.0, in which the solubility of Ni2+, Co2+, and Mn2+ is <200 ppm. 5,37 Even though the Ni2+ solubility is increased by the formation of [Ni(NH3)n]2+ in alkaline media, the solubility of Co2+ and Mn2+ is only negligibly affected, due to a low affinity for the complexation reaction. 5 Furthermore, since the reactants are continuously fed in the stirred vessel, supersaturation is continuously generated, which creates a steady driving force for M(OH)2 crystallization rather than its dissolution. Therefore, it is rationalized that the essential driving force required for the dissolution of M(OH)2 primary particles on the peripheral regions in the secondary particles and even secondary particles itself is extremely low. Hence, that the occurrence of Ostwald ripening as particle growth mechanism during coprecipitation of Ni0.8Co0.1Mn0.1(OH)2 is rather marginal. The argument that dissolution is unlikely to occur is further supported by the result presented in Fig. 6: Independent of the applied stirring speed for a given run, the PSD at the end of the seeding stage at trun of 1.0 h coincides well with the size distribution of the secondary particle core for particles collected after trun of 8.75 h. A reduction in Ni0.8Co0.1Mn0.1(OH)2 PSD width, i.e., that is σ (see Eq. 9), with progressing coprecipitation time, i.e., that is trun, induced by Ostwald ripening is also unlikely, as it is expected that the dissolution of small particles and recrystallisation on larger particles would actually result in an increase of span instead of a decrease, since the smaller particles would decrease in size due to dissolution over the batch run time (the size of the smaller particles is represented by the d10 in Eq. 9), while the large particles increase in size, (the size of the larger particles is represented by the d90 in Eq. 9). Since an increase in σ with increasing trun was not observed in this work, the effect of Ostwald ripening on the particle size distribution width can be excluded.
However, nucleation at the contact point of the injected MSO4(aq.) with the bulk alkaline reaction suspension inside the stirred tank reactor followed by an immediate dissolution of thereby formed nuclei and subsequent deposition as dissolved ions on primary particles within already existing secondary particles, thus resulting in crystal growth, cannot be excluded. Nonetheless, this does not interfere with the proposed particle formation mechanism that secondary particle growth occurs by growth of individual primary particles.
Interestingly, Andreassen analogously demonstrated for the precipitation of vaterite that the particle growth mechanism is governed by "spherulitic growth," hence growth of distinctive primary particles from a common core. This lead to the formation of a spherical polycrystalline secondary particle structure. 98,99 Furthermore, spherulitic crystallization as underlying particle growth mechanism was identified for several materials such as Li2CO3, 100 Y2(OH)5(NO3), 101 and l-glutamic acid. 102 This conclusion was in contrast with the formerly assumed agglomeration mechanism of primary particles or nano-crystals resulting in the formation of secondary particles. 103,104 Additionally, polycrystallization can also lead to aspherical secondary particles, which deceivingly looks like an agglomerate structure, even though it does not originate from an agglomeration of primary particles, as it was suggested for Al(OH)3. 105 Considering this, it is rationalized that the particle enlargement during the coprecipitation of Ni0.8Co0.1Mn0.1(OH)2 secondary particles is remarkedly similar to spherulitic growth. However, it is worthy to note that independent of the crystal composition, the particle growth mechanism also depends on the applied process conditions (concentration of reactants, volumetric flow rates etc). 106 Hence, a deviation to the proposed mechanism can be expected if the coprecipitation conditions diverge considerably from the applied process parameter in this work. Nevertheless, the demonstrated relationships in this work allow to optimize the secondary particle sphericity by manipulation of the turbulence in a stirred-tank reactor at otherwise constant process parameters, thereby tailoring M(OH)2 based pCAM particle size and morphology to satisfy the requirements for powder processing on an industrial scale.
Conclusions
To tailor the physical properties of M(OH)2 (M consisting mainly of Ni, Co, and Mn) precursor particles (pCAMs) for the preparation of cathode active materials (CAMs), the particle formation mechanism during the semi-batch coprecipitation of Ni0.8Co0.1Mn0.1(OH)2 in a stirred-tank reactor was investigated by varying the stirring speed between 550, 950, and 1350 rpm. The development of the secondary particle size and morphology throughout the coprecipitation reaction with a total run time of 8.75 h was monitored by light scattering and SEM imaging, respectively.
Independent of the applied stirring speed, the particle growth can be divided into two distinctive stages. Within the first hour of the reaction, the seeding stage, the particle size remains roughly constant and irregular-shaped secondary particle agglomerates are generated. In the subsequent growth phase, i.e., after a run time of 1.0 h, the agglomerates increase in size linearly proportional to the third root of time by crystal growth of individual plate-like shaped primary particles. This results in a smearing out of the initially produced aspherical agglomerate structure and an increase in secondary particle sphericity.
Further proof for a two-step particle formation mechanism was given by SEM imaging of cross-sectionally cut Ni0.8Co0.1Mn0.1(OH)2 secondary particles after a run time of 8.75 h. Independent of the applied stirring speed in the respective run, a secondary particle core consisting of randomly and loosely packed nanometer-sized primary particles was identified, surrounded by a dense layer of elongated plate-like shaped primary particles that are radially aligned around the core. Here, the size of the secondary particle core determined from SEM imaging coincides well with the particle size attained by light scattering at the transition between seeding and growth phase at a run time of 1.0 h. An increase of the turbulence during the coprecipitation reaction (controlled by the stirring speed) decreases the size and increases the number of the agglomerates that are formed during the seeding stage, which not only decreases the final secondary particle size, but also enhances the sphericity of the secondary particles at any given time during the growth stage.
In summary, a two-stage particle formation mechanism comprised of agglomeration and subsequent polycrystalline growth is proposed. This contrasts with the mechanisms proposed in the literature, which suggest that during coprecipitation of M(OH)2 the secondary particles grow by continuous agglomeration of nucleating primary particles and/or Ostwald ripening. However, outside of the lithium-ion battery material related literature, the particle formation mechanism proposed in the present work is known as polycrystallization and closely related to spherulitic crystallization. Finally, the demonstrated relationships in this study allow to optimize secondary particle size and sphericity during coprecipitation of M(OH)2 by manipulation of the turbulence in a stirred-tank reactor at otherwise constant process parameters.
Acknowledgments
The authors want to thank BASF SE who supported this work within the BASF SE Research Network. Phil Jack Holzmeister is gratefully acknowledged for developing the image segmentation algorithm and data processing. Special thanks go to Stefan Oswald for inspiring and fruitful discussions.
Appendix
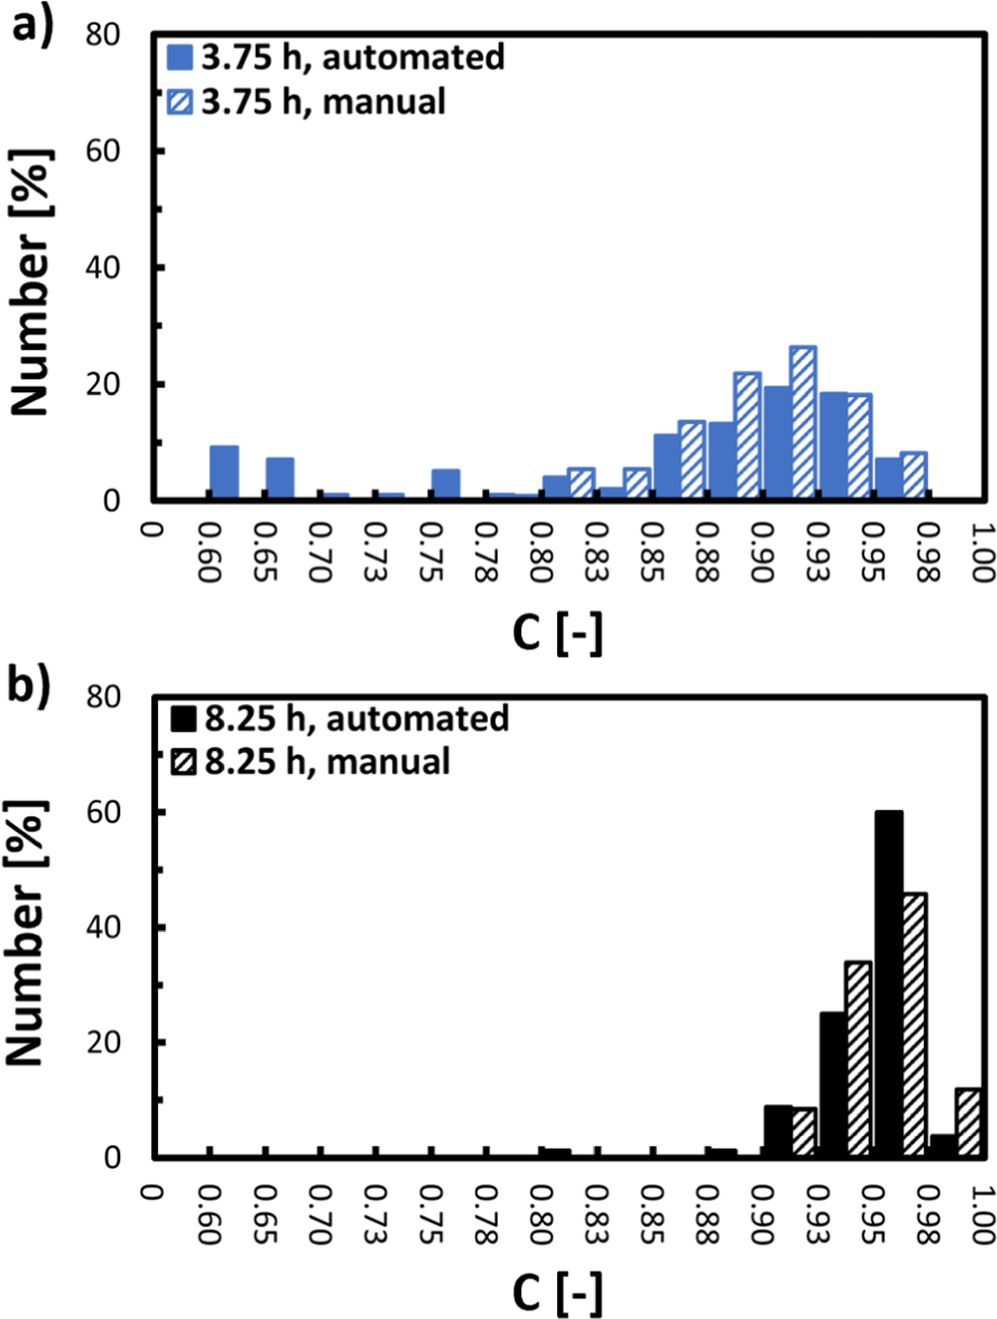
Figure A.1. Quantification of particle circularity C as descriptor for sphericity of Ni0.8Co0.1Mn0.1(OH)2 secondary particles by SEM top-view image analysis. Comparison of number-based circularity distributions obtained by automated (filled) and manual segmentation (unfilled), determined for Ni0.8Co0.1Mn0.1(OH)2 secondary particles attained by semi-batch coprecipitation at n = 950 rpm after different run times: (a) trun = 3.75 h; (b) trun = 8.25 h.
Download figure:
Standard image High-resolution image