

Abstract
Sodium-ion batteries are cheaper and attractive alternatives to lithium-ion batteries, particularly for low-energy and high-power applications. In this regard, a targeted cell design is essential to achieve optimal cycling performances and reduced cell impedance. While optimized electrode and electrolyte formulations are important, the formation protocol -initial cycles that establish the electrode-electrolyte interphase- significantly impacts cell impedance and interphase stability. In this study, we investigate the influence of formation temperature on the nature of interphases formed in Na3V2(PO4)2F3 (NVPF)|hard carbon (HC) cells. Our findings reveal that the interphase's nature and chemical composition evolve with the formation temperature. Moreover, cell temperature affects interphase dissolution and reformation, suggesting the potential benefits of employing mixed high and low temperatures during formation cycles to achieve desired interphase properties. A formation protocol coupling cycling stages at different temperatures (55 °C–25 °C–0 °C) exhibits an edge over with respect to low impedance, slightly higher reversible capacity and long cycling stability compared to the cells formed solely at 55 °C. The results presented underscore the necessity of exploring formation protocols including not only high temperatures but also colder temperatures, like 0 °C and below. This approach is pivotal for advancing the understanding of interphase dynamics and optimizing sodium-ion battery performance.
Highlights
High-temperature formation steps in sodium-ion cells improve cycling stability but increase overall impedance of the cells.
Low-temperature formation steps promote the formation of NaF on the surface of the hard-carbon negative electrode.
Cycling stability is linked with NaF content in the solid-electrolyte interphase over the hard-carbon electrode.
Higher degree of ion pairing is observed at higher temperatures for sodium-ion electrolytes.
Export citation and abstract BibTeX RIS
Sodium-ion batteries (NIBs) are emerging as low-cost alternatives for Li-ion batteries, particularly for high-power applications. This is due to the superior Na+ cation diffusion in most electrodes and electrolytes used in NIBs compared to their Li-ion counterparts. The Na+ cation, with its larger ionic radius and lower charge density than Li+, exhibits a weaker interaction within the ionic framework in electrode materials, as well as in solution, 1,2 resulting in a higher power-rate capability. Hence, sodium-ion batteries based on Na3V2(PO4)2F3 (NVPF)|hard carbon (HC) and Prussian blue analogs (PBA) I HC chemistries are primarily promoted for their high power applications, achieving nearly 80% cell charging within 10 min. 3 However, achieving their full potential in terms of power capabilities requires maximizing the bulk ionic conductivity in the electrolyte while minimizing interphase impedance and charge transfer resistance.
Ensuring long cycling life of the batteries is also crucial for commercial applications. However, in the case of sodium-ion batteries, the stability of the solid-electrolyte interphase (SEI) formed on HC electrodes is considerably lower compared to the one formed on graphite anodes for lithium-ion cells. 4,5 Furthermore, the cathode surface exposes the electrolyte to elevated oxidative potentials, triggering its decomposition and the creation of a cathode-electrolyte interphase (CEI). A common strategy to optimize the chemical and physical properties of both electrode-electrolyte interphases involves the introduction of functional additives into the electrolyte formulation. 6 Regrettably, in many instances, these additives result in an increased cell impedance, thereby constraining the cells' rate capability. There is a delicate balance, then, between cycling stability and cell impedance, which can be tilted to one side or the other depending on the targeted application of the battery.
Another commonly used strategy, although far less understood, is the use of specific formation protocols, i.e., particular conditions during the first charge/discharge cycles. In commercial Li-ion batteries, this formation step accounts up to 32% of the cost due to its high demand of capital investment and high labour and space requirement. 7,8 Thus, a number of studies published in literature so far focused on decreasing the time required for effective cell formation, without sacrificing the cells' cycling stability and performance. This is achieved by adjusting formation cycles with varying cycling rates, cut-off potentials, temperatures, or combinations thereof. 9–12 For example, a mild heating of the cells during formation (up to 40 °C–60 °C) decreases electrolyte viscosity, promotes impregnation of the electrolyte into the separator and electrodes, and increases ionic conductivity. The composition and performance of the SEI formed at higher temperatures is still under debate, with some authors observing beneficial effects, 13 while others claiming a decreased performance due to an excessive electrolyte degradation. 14 Nevertheless, it is agreed that higher temperatures favour the presence of more stable inorganic products, like sodium carbonate, fluoride, or oxide, instead of organics, like alkylcarbonates. 15
To produce batteries with improved cycling performance while maintaining acceptable impedance, it is crucial to understand the effect of different parameters used during formation on the composition and performance of the SEI and CEI. In this study we investigate the impact of the temperature employed during formation for sodium-ion cells using Na3V2(PO4)2F3 (NVPF) as positive electrode, and hard carbon (HC) as negative electrode materials. Firstly, we employ a standard electrolyte solution (NP30: 1 M NaPF6 in EC:DMC 1:1 volume ratio) to explore potential correlations between formation temperature, stability, and cell performance. Subsequently, we delve into the physical phenomena governing the growth and evolution of the SEI/CEI at different temperatures, linking them to the observed chemical composition of the SEI and CEI. Finally, we extend our derived knowledge on formation cycle to include a more commercially relevant electrolyte composition, incorporating methyl acetate (MA) as low-viscosity co-solvent to enhance the power capability, and electrolyte additives for cycling stability. The influence of the formation protocol is studied in commercial 18650 cylindrical cells containing the power-optimized electrolyte formulation, where the effects of including high and low temperature formation steps are presented.
Experimental Details
Materials and electrolyte preparation
NaPF6 was purchased from Stella Chemifa and used as received. The solvents, ethylene carbonate (EC, DoDo Chem), dimethyl carbonate (DMC, DoDo Chem), propylene carbonate (PC, Dodo Chem), and methyl acetate (MA, Sigma-Aldrich), were dried over activated 3 Å molecular sieves for one week before electrolyte preparation. The electrolyte additives vinylene carbonate (VC, TCI Chemicals), tris(trimethylsilyl)phosphite (TMSPi, TCI Chemicals), succinonitrile (SN, Sigma-Aldrich) were used as received. Sodium oxalato(difluoro)borate (NaODFB) was prepared following previous reports. 16
Two different electrolyte formulations are employed in this study: either a standard NP30 (1 M NaPF6 in EC:DMC 1:1 volume ratio), or an electrolyte formulation developed previously for high-power performance (1 M NaPF6 in EC:PC:DMC:MA 25:25:30:20 volume ratio + 0.5 wt% NaODFB + 0.5 wt% TMSPi + 1 wt% VC + 3% SN).
Cell assembly and cycling
One-side coated NVPF and HC electrodes on Al foil for coin cell experiments, as well as dry 18650 cylindrical cells containing the same, were received from TIAMAT Energy, Amiens. Coin cells (type 2032) were assembled inside an Ar-filed glovebox using 13 mm diameter NVPF and HC electrodes and two glass-fiber disks as separators soaked with ∼150 μl of electrolyte. Cylindrical 18650 cells were filled with electrolyte and sealed in a dry room. The cells were cycled using a Biologic battery cycler/potentiostat-galvanostat at C/5 constant current (with 1 C = 128 mA.h/gNVPF).
Optical calorimetry techniques
Insertion of fibres into 18650 cells
A 0.8 mm hole was drilled in the negative pole of the hermetically sealed TIAMAT cells using a drilling machine (SIDERMECA TFW2545V). The holes were done close to the centre of the negative pole to prevent the destruction of the jellyroll and to ensure that the fiber would not interact with the jellyroll, hence preventing any possible strain measurements. The drilled cells were dried overnight in a Buchi oven at 80 °C before entering them in the glovebox. Inside the glovebox, the cells were filled with 5.5 mL of electrolyte. Then, the prepared sensors were inserted and sealed with epoxy and left to cure for 24 h.
Optical tests
Optical measurements were obtained using interrogators from FBGuard 1550 (Safibra) or Luna Si255 (Micron Optics). The wavelength resolution of both is 1 pm and the sampling period used was 1 s.
Calibration of sensors
Thermal calibration of sensors was done using temperature-controlled ovens (IPP55 and IPP110, Mermmet). Cells were left at OCV during a period of 24 h while temperature increases ranging between 10 and 60 °C were imposed. The details on the determination of circuit model parameters could be referred from the previous publications. 17
Characterization techniques
Raman analyses were carried out over the electrolytes at different temperatures using a Renishaw InVia Reflex spectrometer. A 633 nm laser was used, with a power of 1 mW to avoid heating, and a 1800 lines/mm grating giving a 1 cm−1 per pixel spectral resolution. The spectra were collected using a 50x long working distance microscope objective, with an exposure time of 120 s. The electrolytes with different compositions were filled in a quartz capillary of 1 mm diameter and sealed inside of an Ar-filled globe box. Temperature variable spectra were obtained by placing the capillaries in a Linkam THMS600 heating stage. The spectra were collected at 0 °C, 25 °C and 55 °C and the solutions were held at each selected temperature for at least 15 min to get a homogeneous and stabilized temperature inside the capillary.
Samples for X-ray photoelectron spectroscopy (XPS) were collected from NVPF|HC full coin cells right after formation. The cells were de-crimped inside an Ar-filled glovebox and the recovered electrodes were washed with dry DMC before drying in the glovebox antechamber. XPS measurements were carried out with a THERMO Escalab spectrometer, using focused monochromatic Al Kα radiation (hν = 1486.6 eV) and equipped with an argon-filled glove box allowing to preserve the samples from moisture and air at all times from their preparation to their analysis. Peaks were recorded with constant pass energy of 20 eV. The pressure in the analysis chamber was around 2 × 10⁻⁷ mbar and the analyses were done using charge compensation. The binding energy scale was calibrated using the C 1 s peak at 290.9 eV associated to the CF2- carbons of PVdF binder. The spectra were fitted using a minimum number of components. Several spectra were recorded at different times to check that the samples were not subjected to degradation during the X-ray irradiation. The analyses were performed on two different points for each sample to check the homogeneity of the surface.
Results and Discussion
Impact of the cell formation temperature on cycling
In order to evaluate how the choice of temperature during the formation cycles affects the subsequent cycling stability of NIB cells, NVPF|HC full cells were assembled using a standard NP30 electrolyte (1 M NaPF6 in EC:DMC 1:1 vol). In all cases, the formation protocol consisted on three full charge-discharge cycles (2–4.25 V) at C/5 rate performed at either 55 °C, 25 °C, or 0 °C.
The cycling profile and derivative plot during the first charge are shown in Figs. 1A and 1B, respectively. By comparing the first and the second charges in the derivative plot, we can tentatively assign the processes associated to SEI formation, distinguishing them from those intrinsically associated with either NVPF or HC processes. Further confirmation that these peaks are associated with SEI-formation reactions can be obtained by measuring the heat released inside the cell, as previous experiments by our group have shown that the first charge heat is vastly dominated by the SEI formation. The recorded temperature inside the 18650 cells during the three formation cycles at either 0 °C, 25 °C, or 55 °C is shown in Supporting Fig. S1. From the recorded temperature, and using a thermal model previously described in other reports, the heat released as function of cell voltage can be obtained. 17 The heat released during the first cycle for the three different formation temperatures is shown in Fig. 1C, confirming that two main reactions are observed during SEI formation. The first one, below 3 V, likely corresponds to EC reduction over the HC electrode similarly to the case of Li-ion cells. 18

Figure 1. Analysis of the first charge voltage profile of NVPF|HC cells as function of formation temperature. (A) Recorded cell voltage vs capacity, (B) Derivative capacity plot of the first and second charges of the cells, with the second cycle shown in light colour, and (C) heat generated inside the cell as function of cell voltage (normalized per gram of NVPF in the cathode). The colour legend is the same in the three panels..
Download figure:
Standard image High-resolution imageBoth SEI-formation processes are displaced to higher voltage values and decreased in intensity for lower formation temperatures. We discard the possibility that this shift is the result of overpotentials inside the cell since the intrinsic peaks associated to the NVPF desodiation transitions in Fig. 1D are only slightly affected. Instead, this peak shift points towards a significant modification of the SEI formation mechanism, which also results in a different total heat released during the first charge: 220.3 J/gNVPF for 55 °C, 179.3 J/gNVPF for 25 °C, and 152.0 J/gNVPF for 0 °C. The higher heat released during the 55 °C formation evidences a higher degree of electrolyte decomposition, as has been previously observed for Li-ion formation protocols at elevated temperatures. 19
The large electrolyte decomposition observed at high temperature also translates into large irreversible capacity loss of these cells. In Fig. 2A, the first cycle irreversible capacity loss is compared for a total of 40 cells, where the formation cycles were carried out at either 55, 25, or 0 °C. The largest capacity loss for the cells formed at 55 °C implies that more charge is consumed during SEI formation, potentially resulting in a thicker SEI. Forming the cells at either 25 °C or 0 °C results in less irreversible loss, although surprisingly it is slightly higher in the case of 0 °C. The fact that the lowest irreversible loss occurs during formation at 25 °C, rather than 0 °C, suggests the presence of different SEI formation mechanisms at different temperatures or the enhancement of specific processes at low or high temperatures. A deeper discussion into the effect of the temperature on the different processes occurring during the SEI/CEI formation will be presented further down.
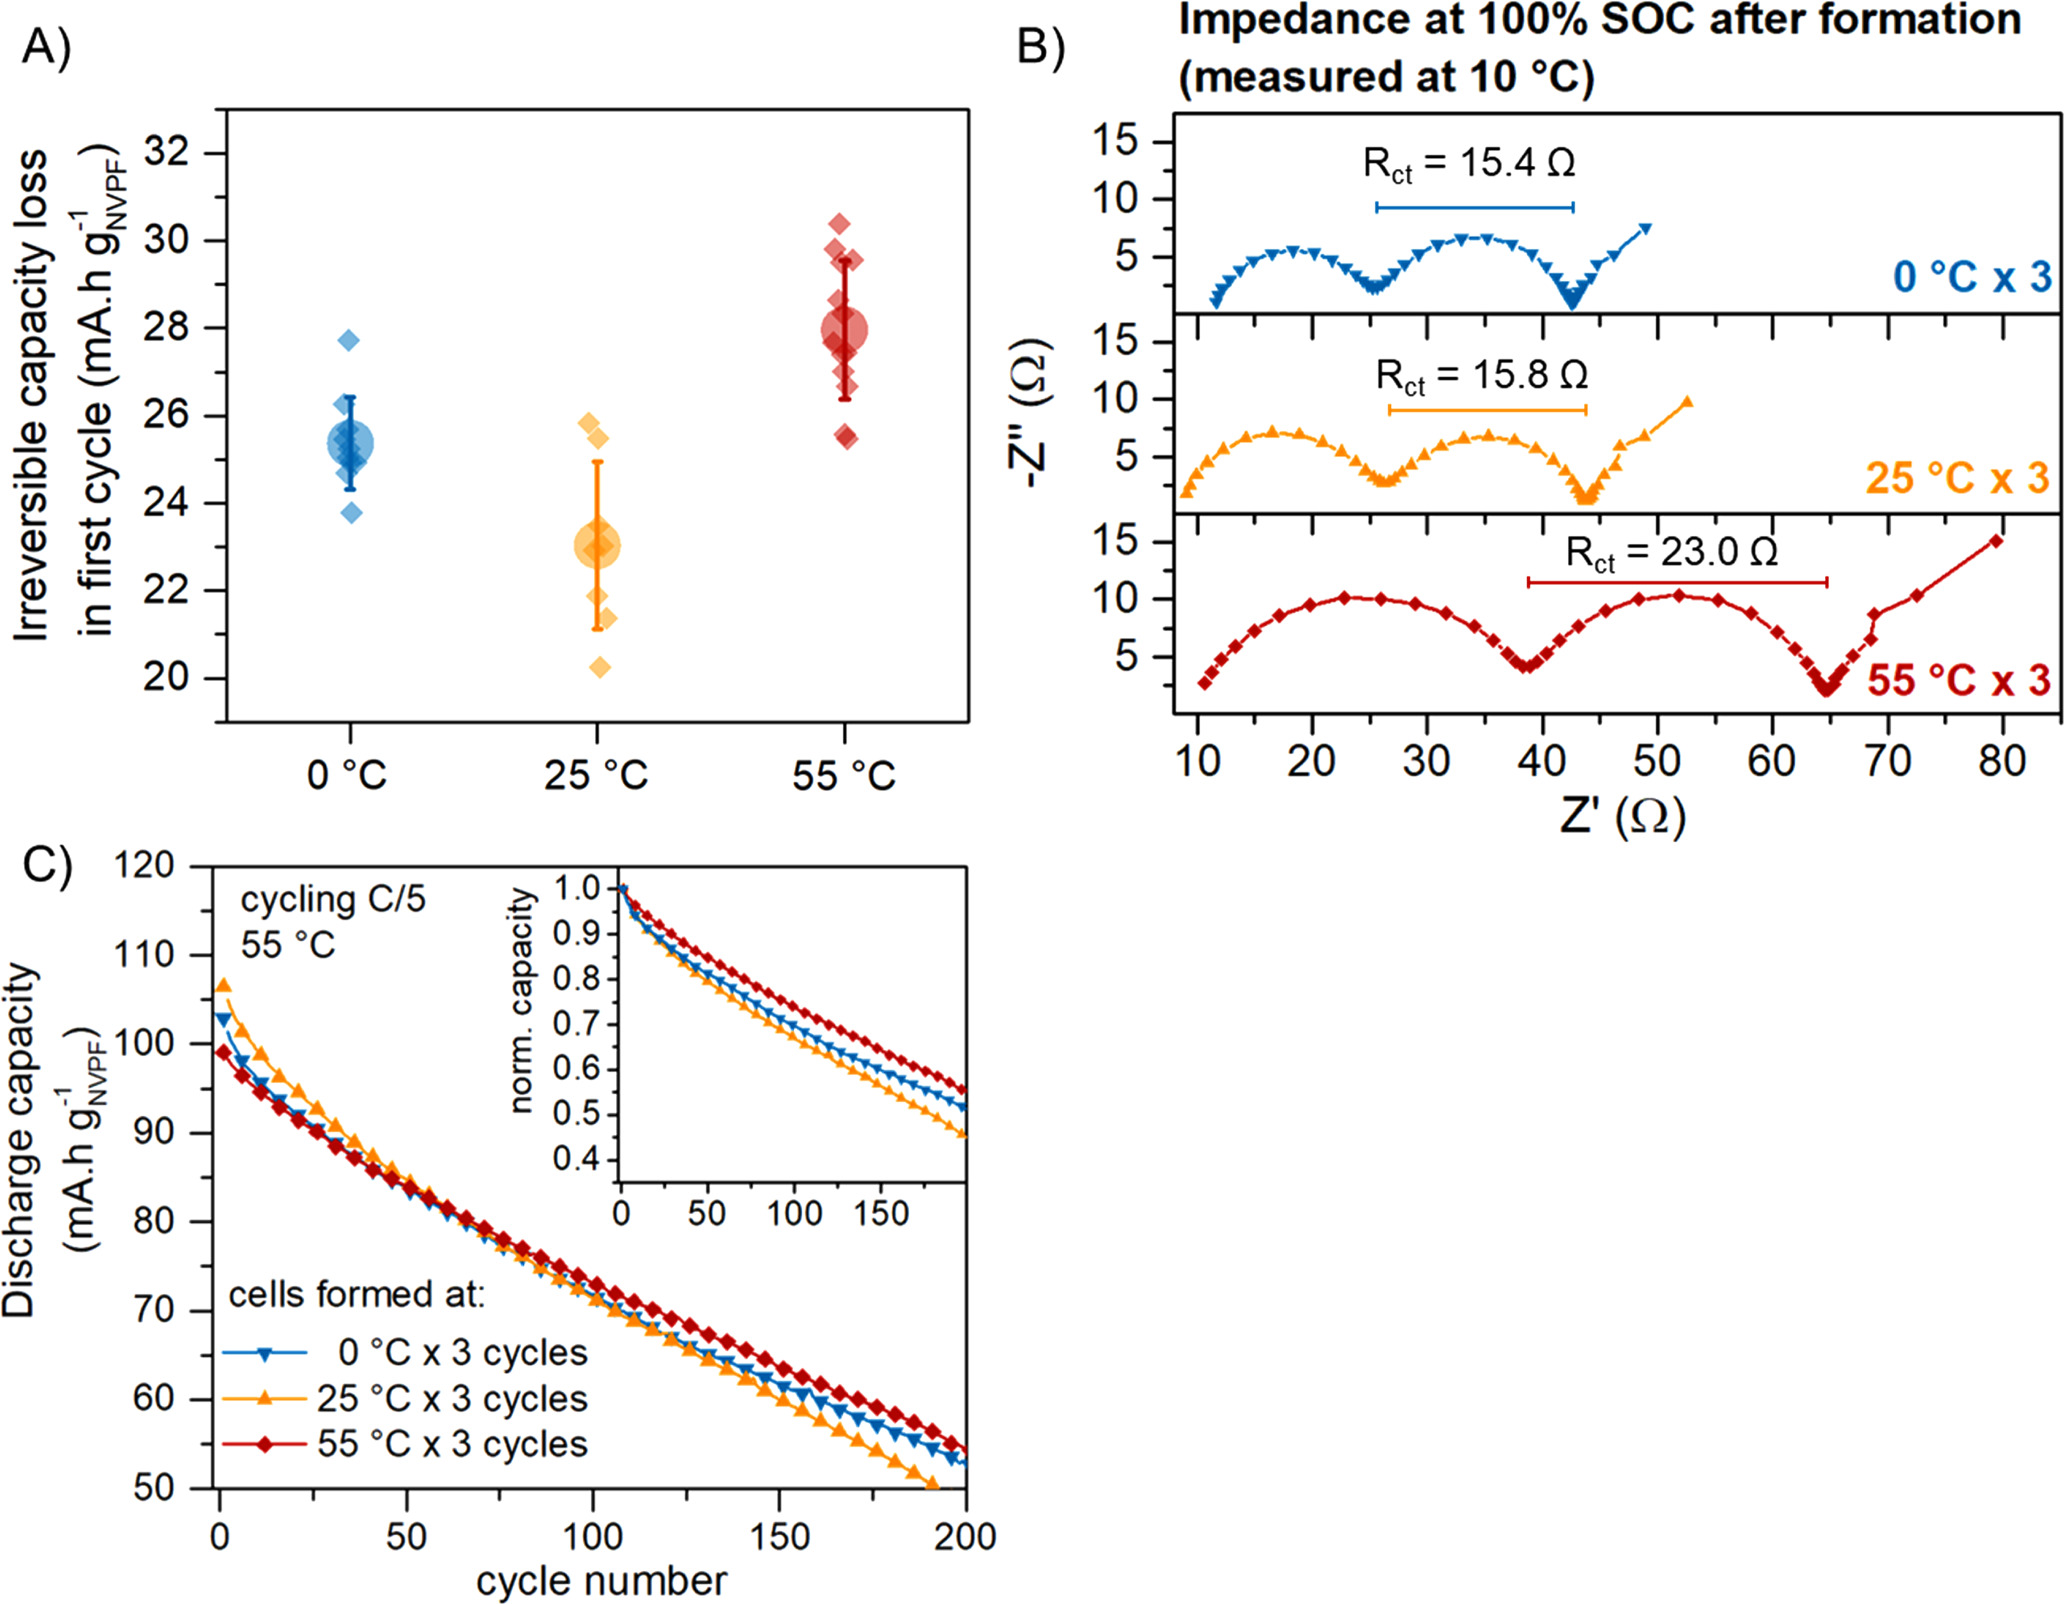
Figure 2. Performance of the NVPF|HC cells containing NP30 electrolyte as function of the formation protocol. (A) Irreversible capacity loss in the first cycle, (B) Nyquist plot of the cell impedance after formation (measured at 100% SOC and 10 °C), and (C) Capacity retention upon constant cycling at 55 °C and C/5 rate.
Download figure:
Standard image High-resolution imageThe resistivity of the electrode-electrolyte interfaces right after formation was evaluated by potentiostatic electrochemical impedance spectroscopy (PEIS), and the obtained Nyquist plots are shown in Fig. 2B. PEIS experiments were conducted at 10 °C to allow easy distinction between the different processes. The Nyquist plots of the cells exhibit two semi-circles, aligning with previous reports on similar NVPF|HC coin cells. Drawing from analogous experiments detailed in earlier studies, we assigned the low-frequency semi-circle to the charge transfer process across the SEI and CEI layers. 3 By fitting the obtained spectra to the equivalent circuit shown in Supporting Fig. S2, the charge transfer resistance (Rct) across the interphases can be obtained (the summarized circuit element constants are given in Table S1). The cells formed at 55 °C × 3 show the highest Rct values, reflecting a lower mobility of the Na+ cations across the SEI and CEI formed at high temperatures. The higher Rct also reflects the extensive electrolyte degradation occurring at 55 °C, as observed previously in the irreversible capacity loss (Fig. 2A).
Next, the cycling stability of the cells after formation was assessed through continuous cycling at 55 °C and C/5 rate (1 C = 128 mAh/gNVPF), and the capacity retention is shown in Fig. 2C and Supporting Fig. S3. The high-temperature cycling was employed to exacerbate the parasitic reactions and other degradation phenomena inside the cells, as was described in previous reports. 20 Although the cells formed at 55 °C exhibit the highest impedance and the lowest capacity in the first cycles, they display the highest capacity retention upon cycling. In contrast, the cells formed at 25 °C show the poorest performance, retaining only ∼45% of their initial capacities after 200 cycles. The lower capacity retention is the result of a low coulombic efficiency (Supporting Fig. S4), especially for the cells formed at 25 °C. However, in the three cases the efficiency lies below 99.6%, resulting in the capacity fading observed in Fig. 2C regardless of the formation protocol.
To gain a deeper understanding of the degradation phenomena responsible for the low coulombic efficiency and the fast degradation observed in the cells, we studied the evolution of the charge and discharge endpoints upon cycling (QC and QD, respectively, as shown in Fig. 3). Regardless of the formation protocol, the cells display a continuous slippage of QC and QD towards higher values, indicating a continuous parasitic reaction occurring at both positive and negative electrodes. In all cases, the QD increases more rapidly than QC, resulting in a closure of the capacity window (QC-QD), and implying that a continuous SEI growth on the HC surface is the prevailing degradation phenomena on the cells during cycling. 21 The SEI growth can also be evidenced by a constant increase in the cell polarization (ΔV), calculated as the difference between the average voltage of the cell during charging and during discharging (Supporting Fig. S4b).

Figure 3. Endpoint slippage analysis of the full cells. (A) Evolution of the cycling curves (cycling at 55 °C) in the first 20 cycles of a cell formed at 25 °C, the charge and discharge endpoints are labelled and the respective slippage is evidence by the arrows. (B) Evolution of the charge and discharge endpoints upon cycling for the cells formed followed three different protocols.
Download figure:
Standard image High-resolution imageThe increase in QC, in turn, reveals the existence of some parasitic oxidation reactions at the surface of the NVPF electrode. The faster increase in QC in the 25 °C-formed cell suggests the presence of redox shuttle species generated during the SEI growth. For example, sodium methoxide formed by DMC reduction at the HC surface migrates to the opposite electrode and get oxidized. 21,22
Overall, the formation protocol at 55 °C promotes the formation of more stable electrode-electrolyte interphases, as evidenced in the highest capacity retention and lowest QC and QD slippage. However, it is worth noting that the 55 °C × 3 formation leads to a higher impedance of the cell, which could affect charge-discharge rate capability. Conversely, the cell formed at 25 °C demonstrates reduced impedance, indicating higher Na+ cation mobility across the interphases. Despite this enhanced mobility, these cells are not sufficiently stable to support continuous cycling, leading to extensive electrolyte degradation. Surprisingly, cells formed at 0 °C exhibit a blend of advantages from both scenarios: they possess low impedance, maintain slightly higher cycling stability, and experience minimal degradation. In the subsequent section, we will delve into the potential physical parameters that contribute to the formation of the SEI and CEI at varying temperatures.
Factors affecting the SEI/CEI formation at different temperatures
Evidently, the temperature employed during formation has a big impact on the SEI/CEI stability and thus, in the subsequent cycling of the NVPF|HC cells. To understand the reason behind such difference, the possible changes in different parameters of the electrolyte during change in temperature are analysed next. The first one is the Na+ cation solvation which could dictate the electrode-electrolyte interface and the interfacial reactions, as suggested in recent studies. 23,24 The nature of solvation shell of the cations in carbonate electrolytes was studied by Raman spectroscopy as a function of temperature.
The Raman spectra of 1 M NaPF6 electrolytes measured at 55, 25 or 0 °C is shown in Fig. 4A, with focus on the ring breathing mode of EC solvent centred around 890 cm−1 (the full Raman spectra is shown in Supporting Fig. S5). The solvent vibration band displays a shoulder at around 900 cm−1 previously assigned to the vibration of solvent molecules directly bound to the Na+ cations in solution, while the unperturbed free EC molecules account for the main band at 894 cm−1. Thus, the spectra of the electrolytes can be deconvoluted into the two different contributions to estimate their corresponding proportions in the solution at different concentrations (Figs. 4B and 4C). By increasing the temperature from 0 °C to 55 °C a decrease in the intensity of the shoulder is observed which is translated into a lower amount of EC molecules participating in the solvation of Na+ cations.
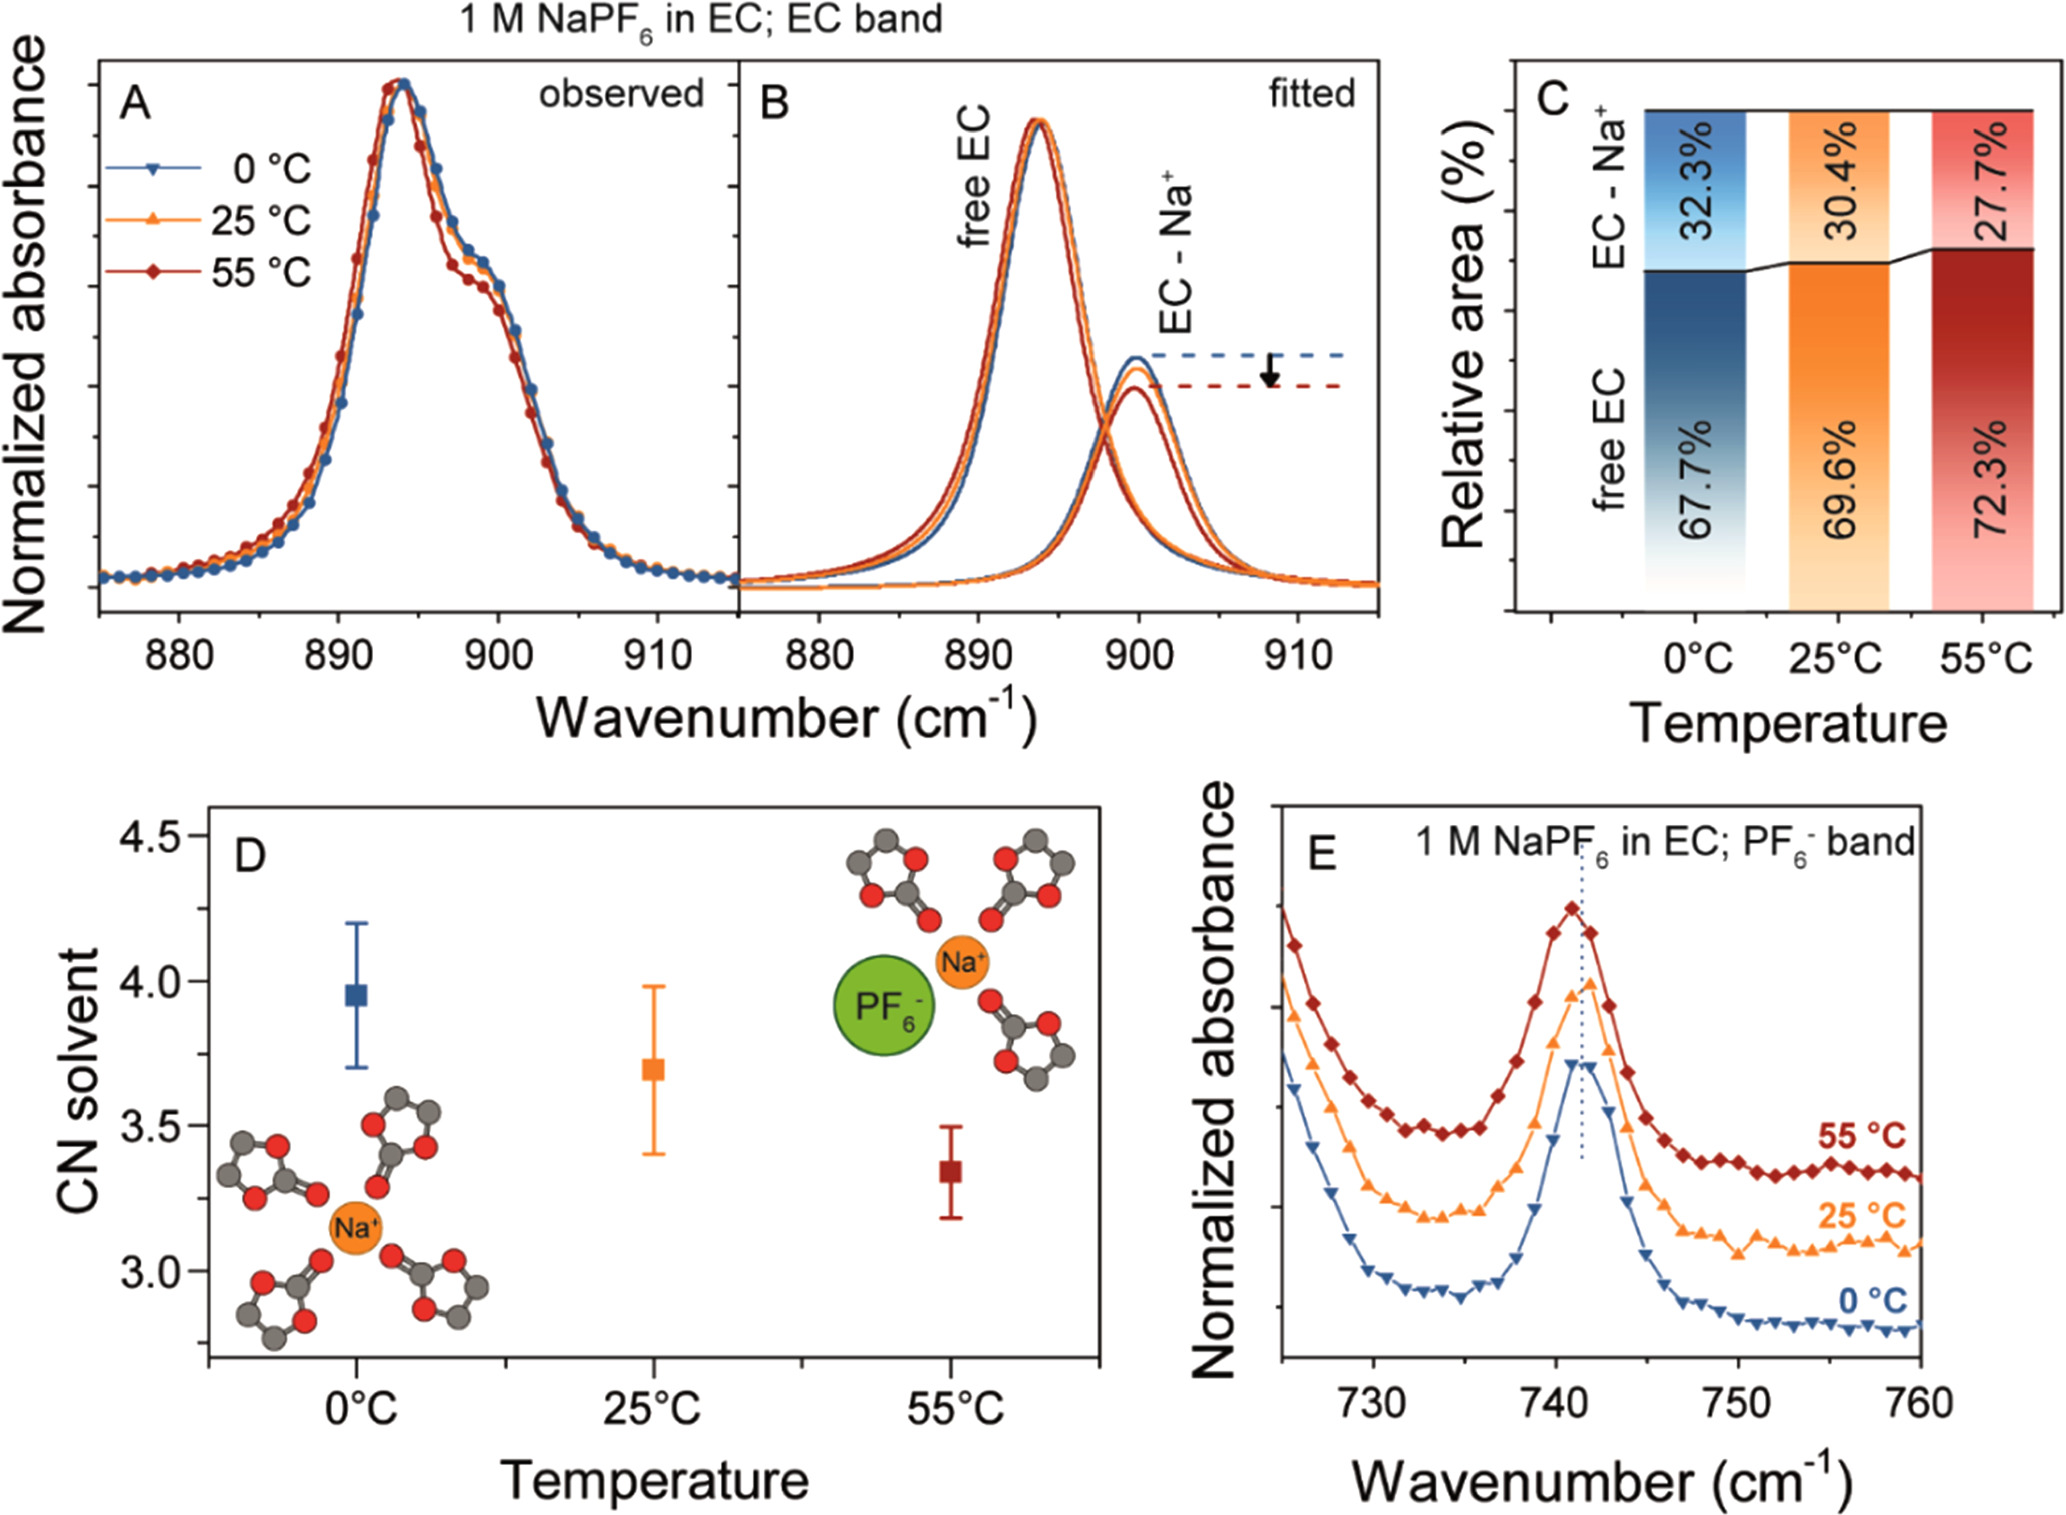
Figure 4. Solvation of Na+ electrolytes as function of temperature. (A) Observed Raman spectra in the EC ring deformation region. (B) Fitting of the observed spectra to two Voigt contributions corresponding to the free and the bound EC molecules, respectively. (C) Relative areas of the free and bound individual bands, as function of temperature. (D) Calculated coordination number of Na+ cations by EC at different temperatures, the error bands correspond to the uncertainty in the area estimation by the deconvolution. (E) Evolution of the PF6 − anion vibration band as function of temperature.
Download figure:
Standard image High-resolution imageThe average number of solvent molecules included in the first solvation shell of the cation can be calculated as:

Where  is the area of the corresponding band in the Raman spectrum,
 ![$\left[{EC}\right]$](https://content.cld.iop.org/journals/1945-7111/170/10/100529/revision2/jesad017fieqn2.gif) and
and ![$\left[N{a}^{+}\right]$](https://content.cld.iop.org/journals/1945-7111/170/10/100529/revision2/jesad017fieqn3.gif) is the molar concentration of EC molecules and Na+ cations, respectively, and the parameter
is the molar concentration of EC molecules and Na+ cations, respectively, and the parameter  is a correction parameter included to account for the difference in the Raman activity of the free and the coordinated EC molecules.
25
The evolution of the CNsolvent as function of temperature is shown in Fig. 4D. We observe a decrease in CN at higher temperatures, suggesting that the Na+ - PF6
− interaction gets more prominent and the anion starts to take place in the first solvation shell of the cation. This creates contact ion-pairs in solution, as depicted in the insets of Fig. 4D.
is a correction parameter included to account for the difference in the Raman activity of the free and the coordinated EC molecules.
25
The evolution of the CNsolvent as function of temperature is shown in Fig. 4D. We observe a decrease in CN at higher temperatures, suggesting that the Na+ - PF6
− interaction gets more prominent and the anion starts to take place in the first solvation shell of the cation. This creates contact ion-pairs in solution, as depicted in the insets of Fig. 4D.
The increasing interaction between Na+ and PF6 − at 55 °C is further supported by a distinct 1 cm−1 redshift of the PF6 − band (741 cm−1), and a slight broadening, as the temperature increase. Solvents bands not affected by the cation coordination display no such shift upon increase in temperature (Supporting Fig. S6). Although the signal-to-noise ratio for this band is inadequate for reliable deconvolution and obtaining quantitative information, the evolution of the band nevertheless reinforces our hypothesis that Na+-PF6 − pairing becomes more pronounced at elevated temperatures. This observation aligns with previously reported computational studies. 26 Interestingly, we note a consistent trend of increased ion pairing at higher temperatures across all studied electrolytes, encompassing solvent blends between EC, PC, DMC, and even MA (Supporting Fig. S5). However, incorporating additional solvents leads to a higher number of fitted bands, rendering the deconvolution analysis less reliable.
Recently, several studies have focused on the direct correlation between solvation shell and SEI composition.
27
For example, by increasing the salt concentration the fraction of ion-pairs in solution increase, the anions are then dragged along with the Na+ cations towards the HC surface during charge, producing an SEI rich on anion-decomposition products. Based on the trend observed in Fig. 4D, we could expect the SEI formed at 55 °C being primarily composed of anion decomposition products, while the one formed at 0 °C being richer in solvent-decomposition products like carbonates, alkoxides, etc. X-ray photoelectron spectroscopy (XPS) was employed to assess the chemical composition of the SEI and CEI. NVPF and HC electrodes were recovered from full cells right after formation at either 0, 25, or 55 °C. The C 1 s, F 1 s, P 2p, and O 1 s—V 2p XPS spectra of the recovered electrodes, along with the corresponding pristine electrodes, are shown in Fig. 5 and supporting Fig. S6 with the deconvoluted intensities in Table S2. In all cases, the surface layer formed on the NVPF electrode is very thin (Supporting Fig. S7), evident by only a small modification of the F 1 s and P 2p edges, which is ascribed to a small amount of phosphate and fluorophosphate species formed through anion decomposition. Notably, the temperature variations influence the ratio between these two components. The 0 °C formation protocol yields a higher presence of fluorophosphates, while they are virtually absent in the SEI of the cell formed at 55 °C, where we observe more phosphate content. This observation can be explained by considering the anticipated sequential path of anion decomposition: ![${\left[P{F}_{6}\right]}^{-}\to {\left[P{O}_{x}{F}_{y}\right]}^{5-2x-y}\to {\left[P{O}_{4}\right]}^{3-},$](https://content.cld.iop.org/journals/1945-7111/170/10/100529/revision2/jesad017fieqn5.gif) thus higher temperatures would favour complete degradation to phosphate, while lower temperatures yield a mixture of partially decomposed species.
thus higher temperatures would favour complete degradation to phosphate, while lower temperatures yield a mixture of partially decomposed species.

Figure 5. XPS spectra of the recovered HC electrodes after formation at either 55 °C, 25 °C, or 0 °C.
Download figure:
Standard image High-resolution imageIn contrast, the HC electrodes after formation are covered by a distinguishable surface layer, the SEI, which thickness can be qualitatively assessed by comparing the area of the HC peak to the peaks associated to SEI products in the C1s spectrum (Fig. 5b). The SEI formed at 25 °C and 0 °C is relatively thinner than the one formed at 55 °C, as the HC peak can be clearly seen. Whereas, the SEI formed at 55 °C is relatively thicker (the peak due to HC is almost hidden by the surface species) and inhomogeneous as indicated by the XPS spectra in two different points on the surface.
Furthermore, vanadium content was exclusively observed in the hard carbon electrode for the cells formed at 55 °C (peaks in orange in the O1s—V2p edge, Fig. 4B). The presence of vanadium in the hard carbon evidences its dissolution from the (NVPF) positive electrode, a process accentuated at higher temperatures, as previously reported. 20 We noted a direct correlation between the V content and the SEI thickness, in regions with higher presence of vanadium being thicker. This suggests a potential catalytic effect of vanadium cations for electrolyte decomposition and SEI growth. This underscores the potential detrimental effects of high-temperature formation, as it exacerbates active material dissolution that poisoned the negative electrode. The P 2p spectra of the HC electrodes also show a higher content of phosphate in the areas where V was detected. This suggests that V might be dissolved from the NVPF material carrying some phosphate ligands, or that the enhanced electrolyte reactivity in these areas produces more phosphate through anion decomposition.
The F 1s spectra of the recovered HC electrodes show the presence of a significant amount of NaF and fluorophosphates. This is particularly evident in the case of 55 °C, where the high thickness of the layer completely hides the peak ascribed to fluorine in PVdF (used as binder in the electrode). Interestingly, the SEI formed at 25 °C shows a relatively lower amount of NaF compared to either 0 °C or 55 °C. It is worth noticing that the trend in NaF content (55 °C > 0 °C > 25 °C) follows the electrochemical performance, with the cell formed at 25 °C being the worst of the three. It goes in-line with the common belief regarding the beneficial effect of NaF for the formation of a robust and stable SEI as discussed previously in literature, a reason why additives such as sodium oxalato(difluoro)borate (NaODFB) are introduced for sodium electrolytes. However, larger amount of NaF for 0 °C formation than for 25 °C contradicts our initial assumption that the low ion-pairing observed at 0 °C would result fewer anion-decomposition products in the SEI. It also diverges from the expectations based on anion decomposition, which would typically be reduced at low temperatures.
At this point, it is important to note that previous studies have stressed the issue of the high solubility of SEI components in sodium-ion batteries and its impact in their cycling life. 4 Compared to the lithium case, the inorganic sodium salts typically present in the SEI are more soluble in water as well as in carbonate solvents (Table I). This results in a continuous dissolution of the inorganic fraction of the SEI during cycling or during storage, and thus continuous electrolyte decomposition. Additionally, depending on their enthalpy of solution, the precipitation or dissolution of particular solid phases can be enhanced or suppressed. The dissolution of fluorides is an endothermic process, so it can be prevented by decreasing the temperature. The opposite is true for the inorganic carbonates, for which the dissolution is prevented at higher temperatures. This trend may explain why we observe a high content of NaF in the SEI formed at 0 °C even when we did not expect so from the ion-pairing hypothesis. Other inorganic and organic components of the SEI will have particular thermochemical properties, and their deposition would be enhanced at either low temperature or high temperatures.
Table I. Thermodynamic parameters of different possible SEI components in LIB and NIB anodes.
| SEI component | Solubility in water a) [g L−1] | Solubility in PC a) [mg L−1] |
 (in H2O)
b) [kJ mol−1] (in H2O)
b) [kJ mol−1] | Deposition will be favored by |
|---|---|---|---|---|
| LiF | 1.34 | 0.157 | 4.73 | Cooling |
| NaF | 13.0 | 0.160 | 0.91 | Cooling |
| Li2CO3 | 41.3 | 8.617 | −14.8 | Heating |
| Na2CO3 | 307 | 6.603 | −26.65 | Heating |
a)Values extracted from Ref. 5 b)Values extracted from Refs. 28–30.
In summary, the formation and evolution of the SEI in NVPF|HC cells during the initial cycles is highly dependent on the temperature. The underlying physical phenomenon governing these processes are extensive and intricate, making it inherently challenging to directly manipulate the SEI composition and performance solely through temperature adjustments. Nevertheless, we have observed sound trends in the SEI characteristics which are dependent on the temperature of formation and which are summarized in Fig. 6. Both the SEI thickness and cell impedance increase when the cells are formed at higher temperature. This phenomenon might be associated with the higher degree of ion pairing as well as transition metal dissolution from the positive electrode material and possible parasitic chemical reactions. However, we cannot disregard the benefits of high-temperature formation steps as they provide the best cycling stability indicating the most stable interphase. On the other hand, low temperature formation steps could be advantageous in promoting NaF content in the SEI while avoiding transition metal dissolution and unwanted parasitic reactions. We envision that an optimized formation protocol would include formation steps at high and low temperatures in order to obtain the benefits of the higher stability of the 55 °C-formed interfaces, and the lower impedance of the 0 °C-formed interfaces.
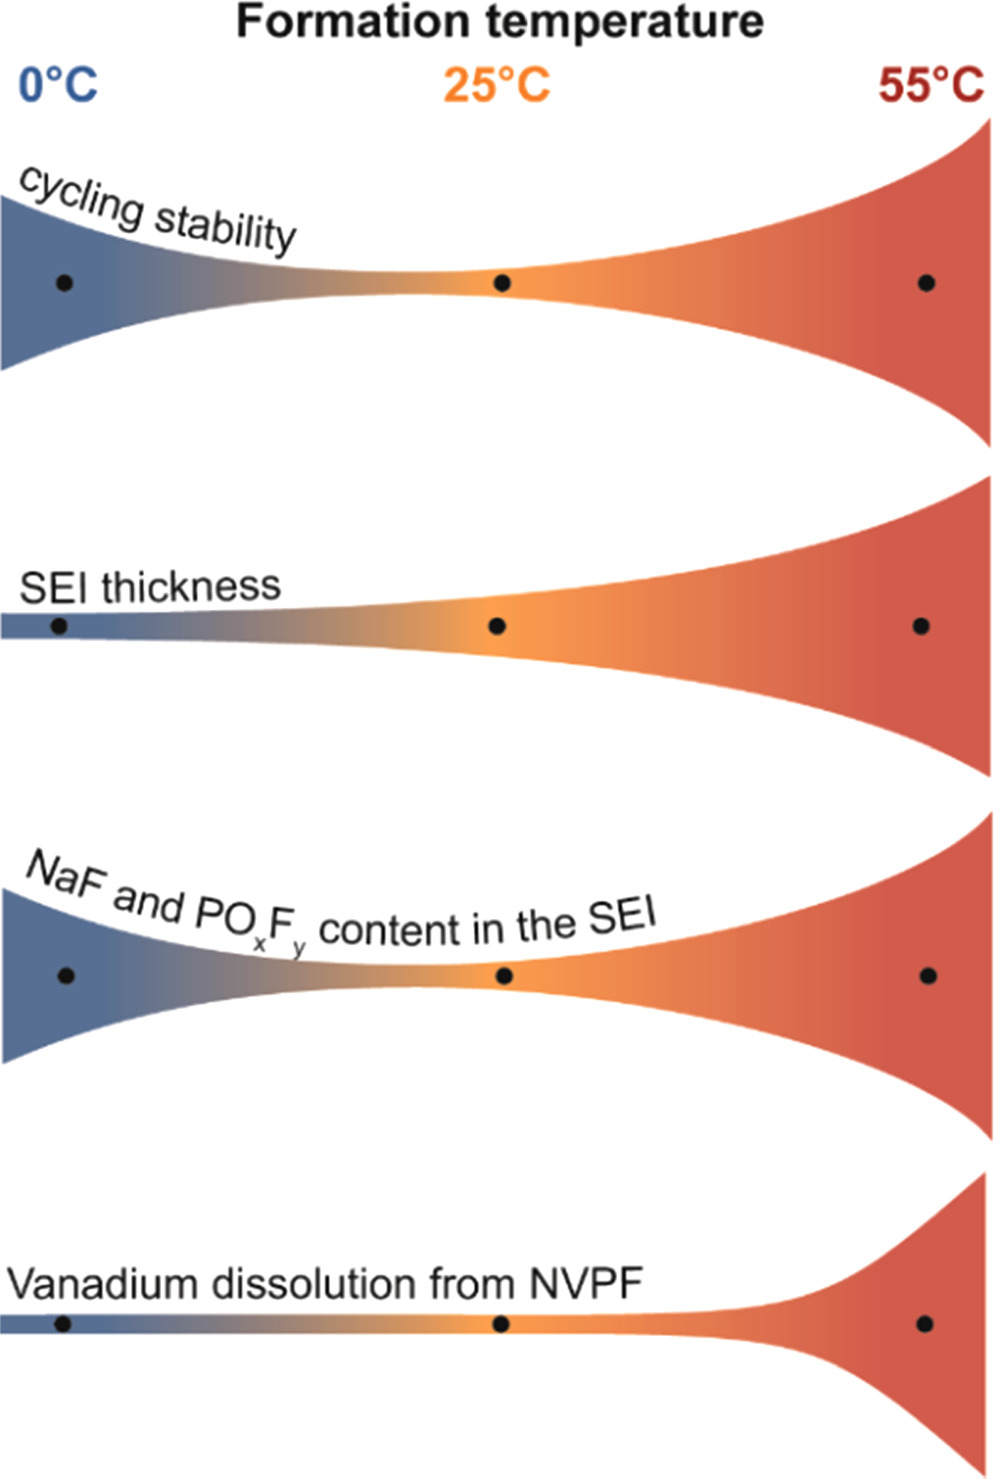
Figure 6. Summary of the effect of the temperature used during formation on different parameters of NVPF-HC cells.
Download figure:
Standard image High-resolution imageTo combine the benefits of the high- and low-temperature formation steps we implemented a new formation protocol involving three full charge-discharge cycles at different temperatures: one cycle at 55 °C followed by one cycle at 25 °C and finally a third cycle at 0 °C. We compared this formation protocol (55 °C–25 °C-0 °C) to the previously discussed 55 × 3 formation. Note that the formation protocol of 55 °C–25 °C-0 °C is selected as a representative example for mixed temperature formation protocol, as it consider 3 cycles at C/5 for a total period of 24 h for formation similar to 55 °C × 3 times protocol. Nevertheless, there are different combinations of mixed temperature formations possible and needs a large number of experiments to pick up the best.
As shown in Fig. 7, both formation protocols (55 °C–25 °C-0 °C and 55 °C × 3) result in the same behaviour regarding capacity retention. However, the cell formed using the 55–25–0 protocol displayed lower impedance after formation, as was expected following the previous discussed results. The developed formulation protocol, 55–25–0, seems to be optimal for the formation of a stable and low resistive SEI in NVPF|HC cells, hence motivating to imply such formation protocol for 18650 cells.
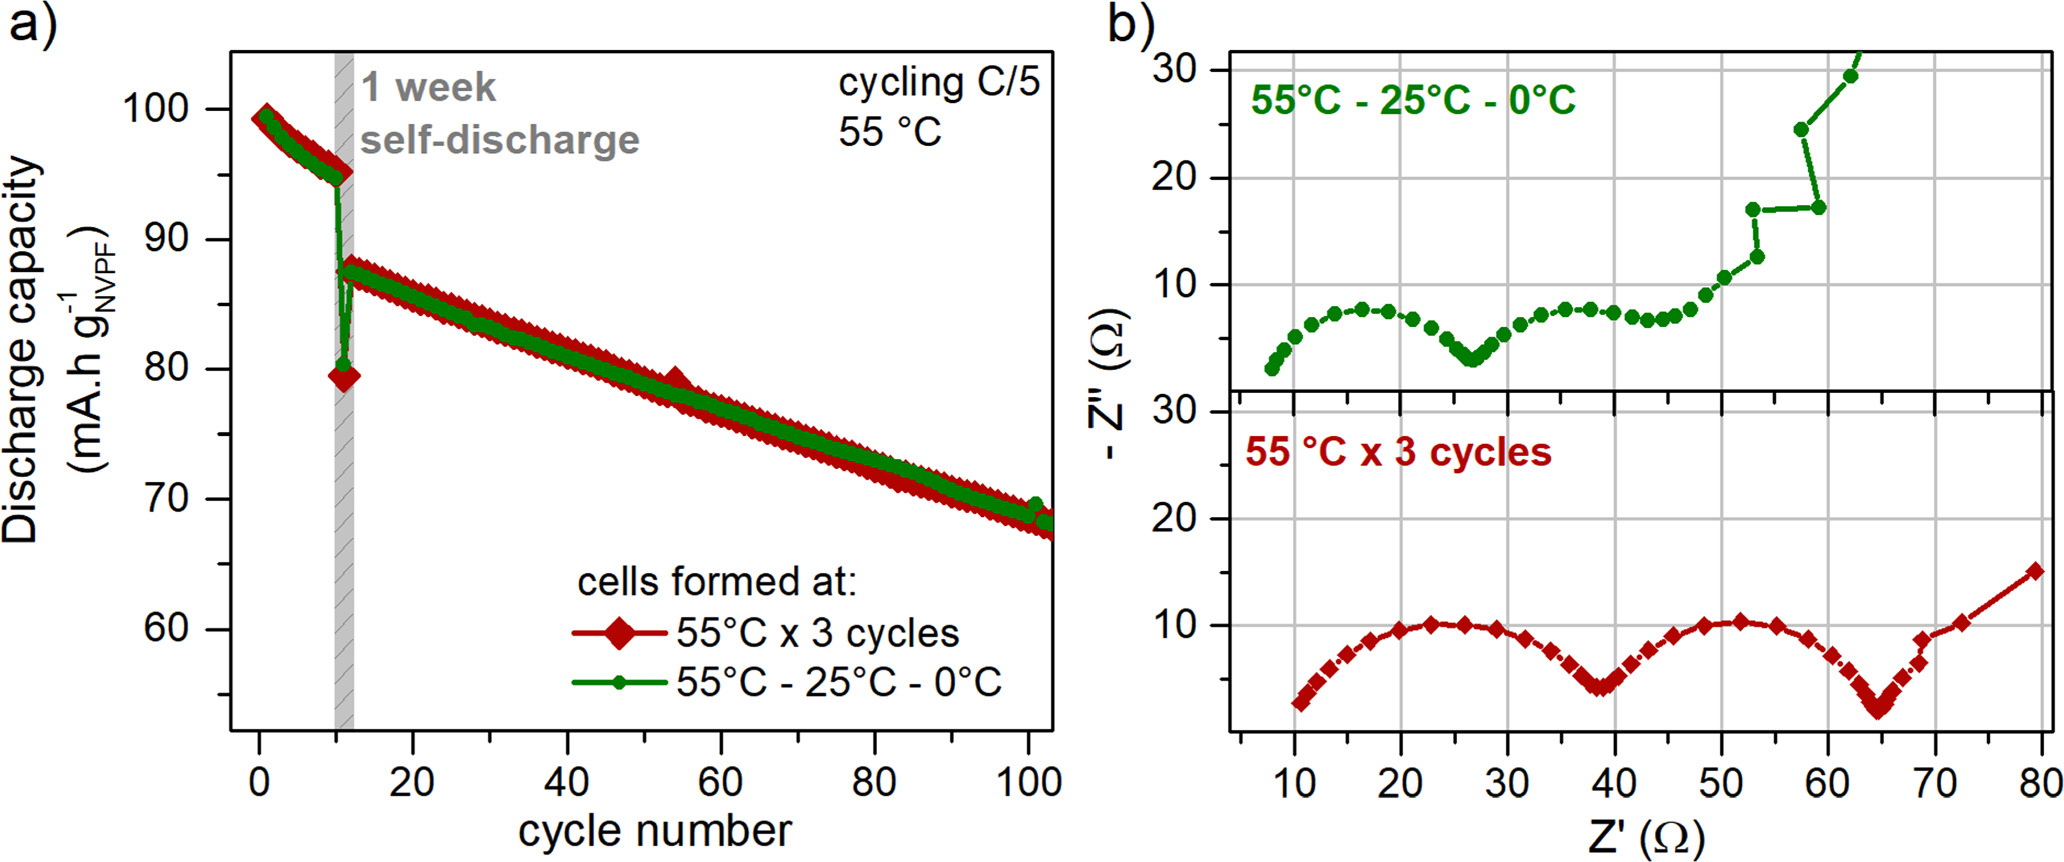
Figure 7. Performance of the NVPF|HC cells after following 2 different formation protocols. (A) Capacity retention upon cycling, including a self-discharge step of 1 week at cycle 10. (B) Impedance of the cells right after formation, measured at 10 °C and 100% SOC.
Download figure:
Standard image High-resolution imageMoving towards commercial sodium-ion batteries: influence of formation protocol in cylindrical 18650 cells
At this stage, we aim to translate this derived knowledge to practical Na-ion batteries. Commercial Na-ion batteries often incorporate one or more electrolyte additives to stabilize the interphases and enable extended cycling lifetimes. In the presence of additives, the chemistry of the interphase formation is significantly influenced, although the decomposition of the salt and solvent also plays a notable role. With this consideration, it becomes intriguing to investigate whether the aforementioned mixed formation protocol of 55 °C–25 °C-0 °C yields beneficial effects when applied to a more commercially relevant electrolyte formulation. To explore this, we turn our attention to a previously optimized electrolyte formulation designed for high-power NVPF|HC cells. 3 This electrolyte formulation consists on a 1 M NaPF6 solution in a EC:PC:DMC:MA solvent mixture, together with electrolyte additives including vinylene carbonate (VC), sodium oxalato(difluoro)borate (NaODFB), succinonitrile (SN), and tris(trimethylsilyl)phosphite (TMSPi). In this electrolyte formulation the additive NaODFB has been shown to produce a NaF-rich SEI, which improves the SEI's stability, aligning with our previous conclusion regarding the positive role of NaF content in the SEI. Furthermore, VC helps to protect the hard carbon together with NaODFB, and the SN helps in protecting the NVPF surface. Lastly, TMSPi helps in reducing acidic impurities in the electrolyte. It is important to emphasize that when employing this combination of additives, the initial cycle at 55 °C becomes imperative for the proper functioning of the additives. This requirement has been previously documented in other studies from our group. 31
Dry cylindrical 18650 cells were obtained from TIAMAT and were filled with the electrolyte formulation under study. The cells were then subjected to specific formation protocols decided before: either 55 °C × 3 or the sequential 55 °C–25 °C-0 °C, before their performance was assessed in terms of cycling stability, impedance, and power rate capability.
The cycling profiles during formation for 2 cells following different formation protocols are shown in Supporting Fig. S8 together with the impedance of the cells right after formation at 55 °C × 3 or 55 °C–25 °C-0 °C. The impedance of the cells is significantly different, which is attributed to a different sodium content in the NVPF and HC electrodes at 0% SOC after formation. Indeed, as the 55 °C × 3 consumes more charge (or more sodium) during formation, the sodium inventory balance between the two electrodes will be different than the case of the 55 °C–25 °C-0 °C formation protocol. This can also be evidenced by the OCV of the cells after formation: the cell formed at 55 °C × 3 displays an OCV of 2.5 V at 0% SOC, while the cell formed at 55 °C–25 °C-0 °C displays an OCV of 2.7 V.
The cycling performances of the cells were compared at a wide temperature range (0 °C to 55 °C) to showcase the cycling stability of the NVPF|HC cells containing this optimized electrolyte formulation. The cycling curves shown in the Supporting Fig. S9 and the capacity retention plot in Fig. 8. The capacity values were normalized considering the first cycle discharge capacity during the 55 °C formation cycle step as 100%. The eight different cells used for this study vary slightly in their initial capacity (Supporting Fig. S10), hence such normalization was used for proper comparison. A slightly higher capacity and a better capacity retention is evidenced for the cells after the 55 °C–25 °C-0 °C formation protocol, although the difference between the two protocols is not significant to assure a beneficial aspect at this respect. The same trend is observed when we cycle the cells constantly at 55 °C; both formation protocols exhibiting nearly similar capacity retention and very similar increase in the cell polarization (shown by increase in ΔV in Fig. 8d).
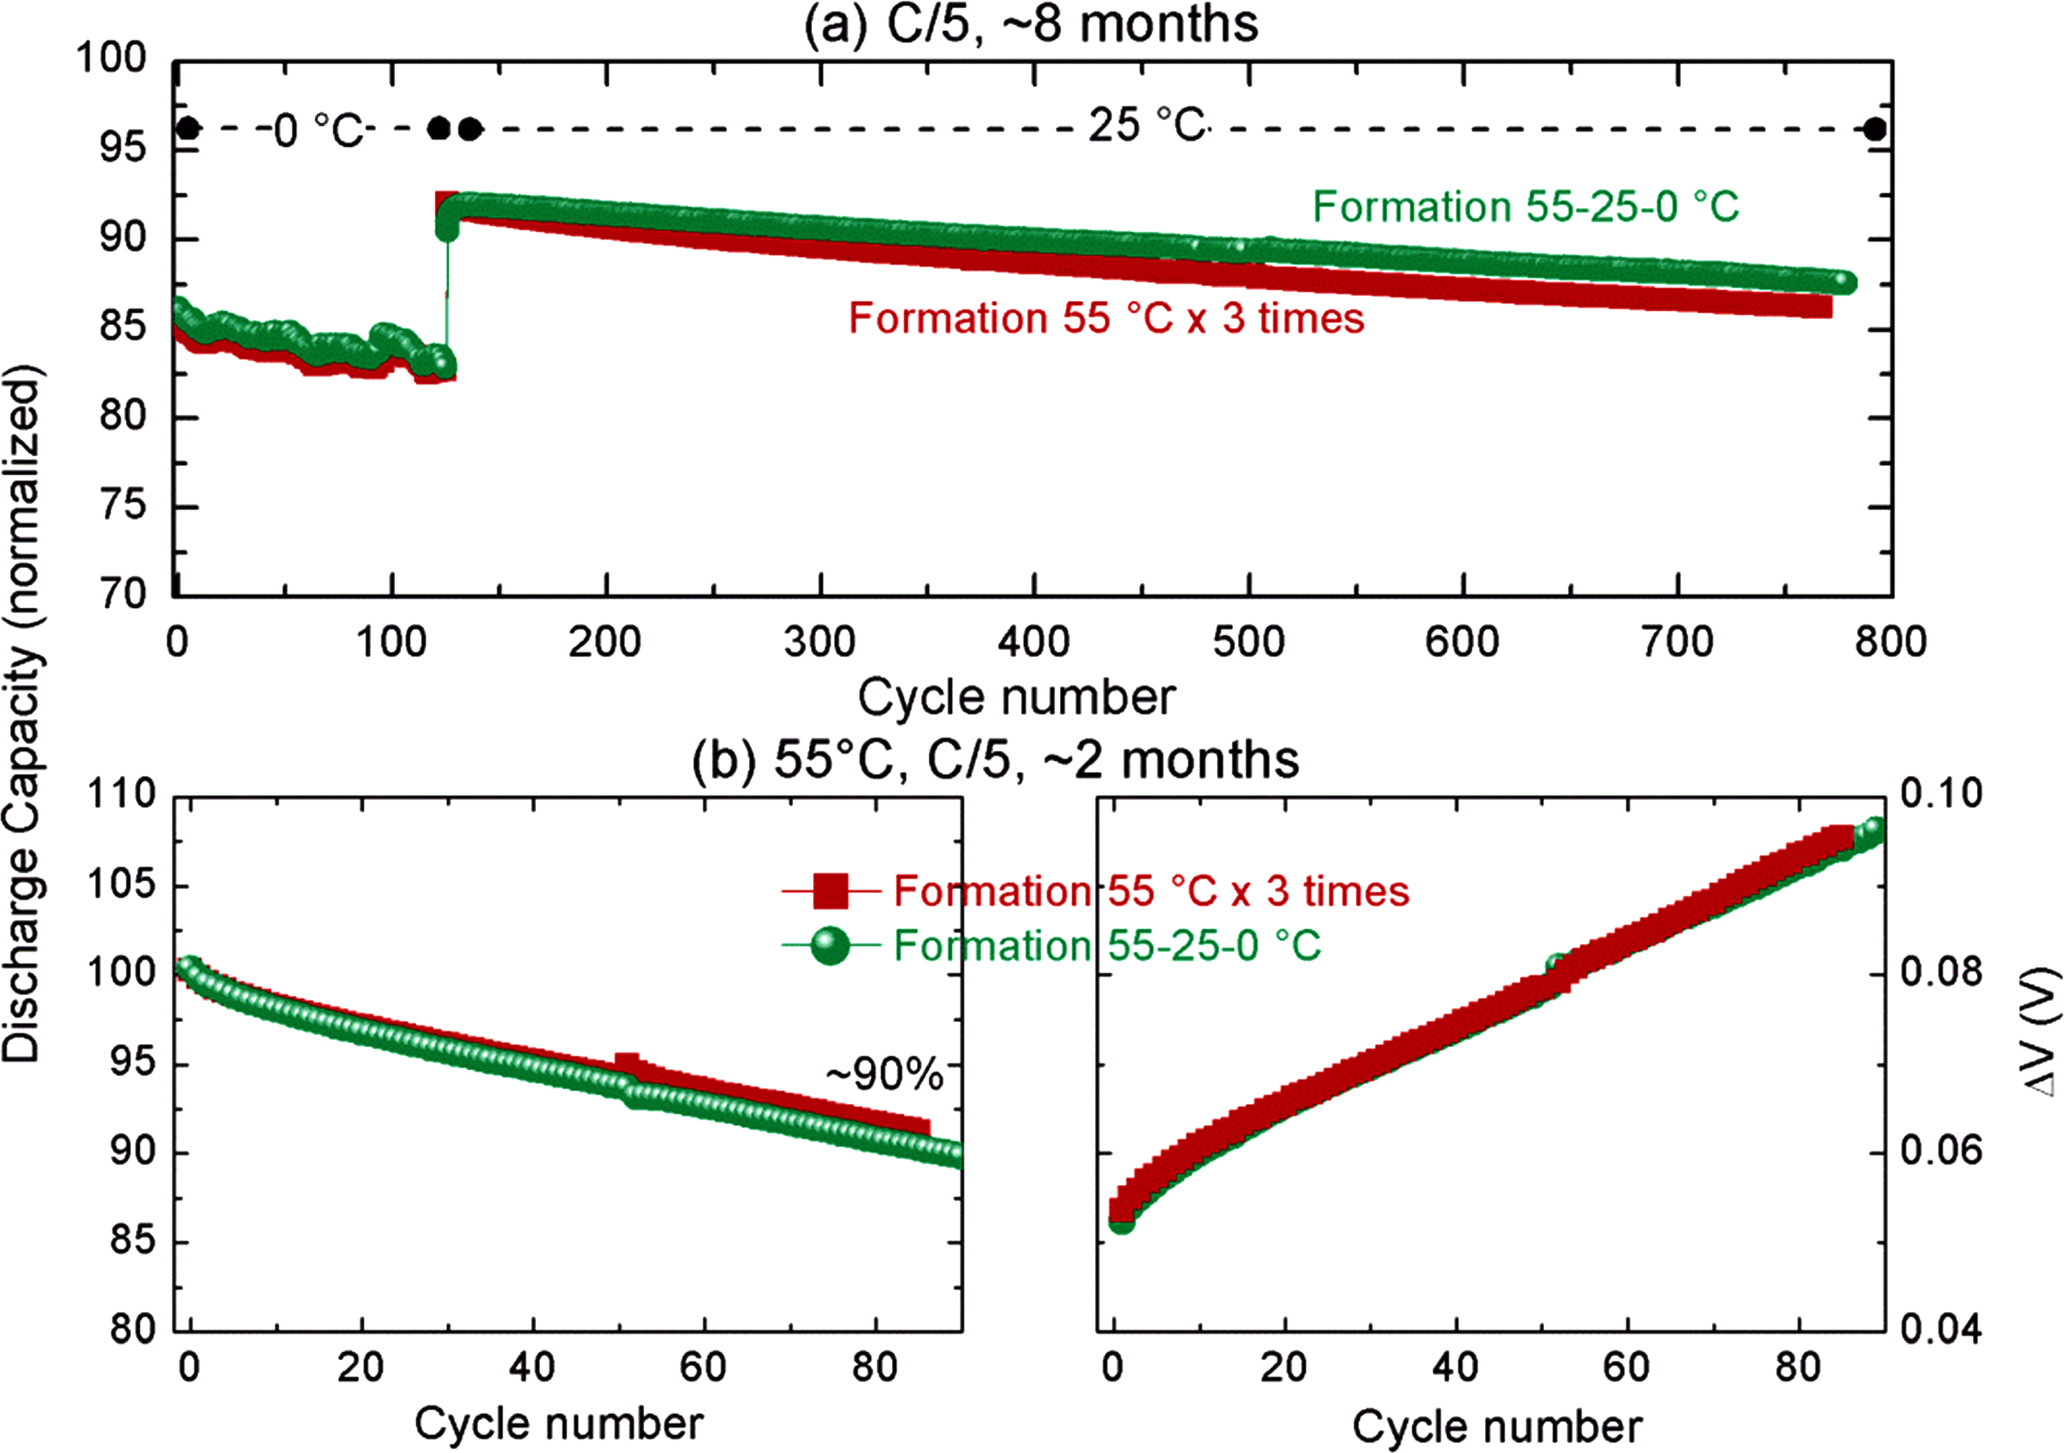
Figure 8. Performance of the 18650 cells depending on the formation protocol. (a) capacity retention for the cells cycled at 0 °C for 105 cycles and then moved to continuous cycling at 25 °C, (b) capacity retention (right panel) and increase in polarization of the cell (left panel) for the cells cycled continuously at 55 °C.
Download figure:
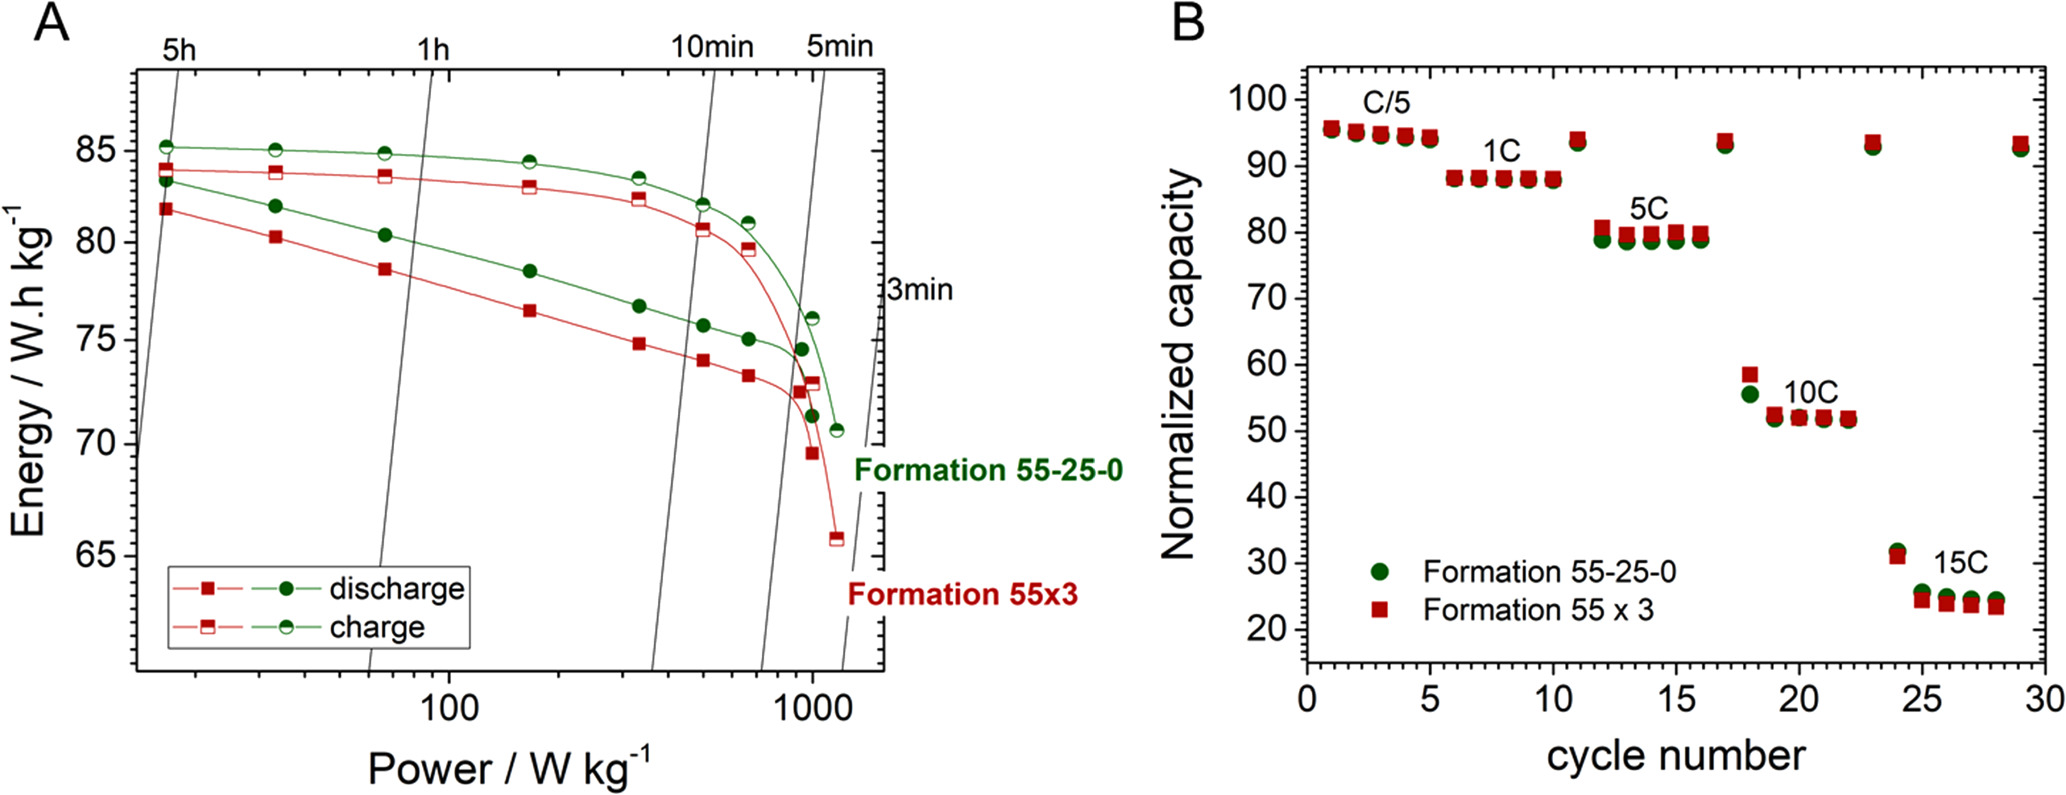
Standard image High-resolution imageFinally, the cells were assessed for their power rate capability using constant-power protocols, where the cells were either charged or discharged at constant power (I* V is constant) and the results are shown in Fig. 9A. It's important to note that the cell's design prioritized high power performance over high capacity, which accounts for their relatively low energy density, approximately 80 Wh kg−1 (considering a weight of approximately 30 g per cell). Irrespective of the formation protocol employed, it is remarkable that up to 95% of the cell's capacity can be charged within 10 min (with a power load of about 500 W kgcell −1). However, when applying the same power during discharge, only 85% of the capacity can be recovered. This asymmetry during charge and discharge comes from the constant-power experiment design, which will apply a much higher current at the end of the discharge (supporting Fig. S11), increasing the polarization on the sloppy region of the cycling curve hence reduced capacity. During charge, in contrast, the experiment applies a high current at the beginning (when the cell is at low potentials) and reduces as the cell charges to 4.25 V. Hence, in the next experiment, the cells were subjected to continuous cycling at different C-rates (constant current in charge and discharge with 1 h rest period in between for heat dissipation if any). Nearly 80% of capacity could be retained at 5C-5D, however it reduced to ∼50% on moving for 10C-10D.
Figure 9. Power-rate tests on power-optimized 18650 cells after following different formation protocols. (A) Ragone plot obtained for charge or discharge constant-power experiments, and (B) Capacity retention of the cells as function of the cycling rate.
Download figure:
Standard image High-resolution image
Interestingly, the choice of the formation protocol seemed to have a minimal impact on the rate capability of the cells. Only marginal gains in rate capability were observed with the 55 °C–25 °C-0 °C formation protocol at very high power rates. This can be attributed to the already outstanding performance of the cell design for high-power applications. Further, the first formation cycle is maintained at 55 °C for both formation protocols that accounts for the very similar interphase, except for the maturation of interphase in the second and third cycles. Results may vary depending on the electrode material, additive used and by wisely designing the formation protocol.
Conclusions
In this study, we have reported the effect of the formation temperature in the cycling stability, impedance, and power-rate performance of NVPF|HC cells. Depending on the temperature employed during formation (55 °C, 25 °C, or 0 °C), the SEI formation follows different pathways, evidenced by a clear alteration of the dQ/dV profile and the heat generated during the first charge. Surprisingly, forming the cells at 25 °C resulted in the worst capacity retention and worst coulombic efficiency of the three, which is ascribed to a low content of NaF in the interphase. When cells were formed at higher temperatures, an extensive electrolyte decomposition and the formation of a thicker SEI layer is observed, which resulted to be stable although with high impedance. Furthermore, evidence of vanadium dissolution and its subsequent deposition on the SEI layer was also observed, a phenomenon that catalyses further electrolyte decomposition.
Alternatively, forming the cells at low temperature resulted also in high content of NaF but less/ no transition metal dissolution. The high content of NaF in the SEI is ascribed to the lower solubility of this component at lower temperatures. This represents the first example of a targeted composition of the SEI obtained by temperature modulation, and opens the door for further studies on this direction.
However, the beneficial effects observed for the 0 °C step in coin cells using NP30 electrolyte were not directly transferable when using power-optimized 18650 cells and a power-optimized electrolyte formulation. We believe that when one or more additives are present in the electrolyte formulation, they dominate the SEI formation in the first cycle and thus the formation 55 °C–25 °C-0 °C have a less pronounced effect. Given that in this case we use SEI-forming additives, the effect of the low temperature step was more nuanced. The additives dominated the SEI formation, attenuating the differences in impedance and thwarting any translation into power rates or rate-capability tests. It shows the difficulties in translating the fundamental scientific understanding directly into practical systems. A much deeper study using different additives, cell design and/or very low temperatures (−10 °C or less) may require to explore further. Nevertheless, we believe formation protocol using mixed temperature steps need more attention for understanding as well as in applications as we observed that the designed formation protocol 55 °C–25 °C-0 °C resulted in a comparatively higher reversible capacity of the cells while retaining their high cycling stability (more than 800 cycles at C/5 rate) and high power rate capability: around 90% of charge and discharge in 5 min, or 50% retention when constantly cycling at 10C–10D.
Acknowledgments
The authors thank the RS2E Network for funding (French National Research Agency STORE-EX Labex Project ANR-10-LABX-76–01). P. D. thanks RS2E for PhD funding. TIAMAT Energy, France is gratefully acknowledged for providing the NVPF|HC 18650 cells for R&D purposes as well as the NVPF, HC electrodes for coin cell studies.
Supplementary data (2.5 MB PDF)