

Abstract
The expression for the exchange current density to describe the intercalation kinetics of Li-ion battery materials proposed by Newman and coworkers has been used extensively for battery modeling, however its applicability to existing battery materials should be validated. Here we show an electrochemical impedance spectroscopy (EIS) analysis of the kinetic behavior of NCM 111 as a function of electrolyte salt concentration and state-of-charge (SOC) and compare it to the proposed theory. An areal capacity dependent EIS analysis first gives insights into the feasibility of measuring kinetic and transport parameters, including the solid diffusion resistance of lithium, showing that low-areal capacity electrodes are required to predominantly probe the kinetics. We then show how the charge transfer kinetics follow a Butler-Volmer type concentration dependent behavior for lower concentrated electrolytes (≤1.5 M) but deviate from the proposed theory at higher salt concentrations. A further SOC dependent analysis shows how NCM 111 generally follows the proposed theory of U-shaped symmetric kinetics, but the limited oxidative stability window leads to practically asymmetric kinetics for charging and discharging. This asymmetry is visible in NCM 111 lithiation and delithiation rate tests, where upon lithiation the kinetics generally become slower for higher degrees of lithiation, limiting the performance.
Export citation and abstract BibTeX RIS

This is an open access article distributed under the terms of the Creative Commons Attribution Non-Commercial No Derivatives 4.0 License (CC BY-NC-ND, http://creativecommons.org/licenses/by-nc-nd/4.0/), which permits non-commercial reuse, distribution, and reproduction in any medium, provided the original work is not changed in any way and is properly cited. For permission for commercial reuse, please email: permissions@ioppublishing.org.
There are a variety of factors that influence the performance of commercial Li-Ion batteries, e.g., cell design, electrode composition/morphology, or active material properties. While the measurement probing the electrode's geometric microstructure, i.e., its tortuosity, has become standard practice,
1–3
accurately measuring and modeling kinetic and transport parameters of battery materials is more difficult, so that many parameters are either fitted or assumed.
4
Most notably, Doyle, Fuller, and Newman
5,6
put forth an expression for the exchange current density which incorporated the state-of-charge (SOC) dependence (i.e., the change in concentration of the electroactive species in the solid phase of the active material) into the Butler-Volmer (BV) equation for Li-ion batteries (described later by Eq. 5). Others have questioned the thermodynamic consistency of the Newman model and have developed adaptations, however the resulting equations for  are similar to that of Newman.
7–9
Thus, Newmans adapted BV equation is used to model a variety of Li-ion battery active materials, even though the most commonly used active materials can drastically differ in the way the lithium insertion occurs. Nevertheless, the adapted BV equation is extensively used for widely utilized Li-ion battery active materials such as graphite or the materials from the NCM family, even though its applicability for these materials is not always clear due to a lack of experimental data. For instance, a popular Li-ion battery cathode active material is nanometer-sized LiFePO4 (LFP), for which the lithium (de)intercalation exhibits a two-phase behavior (rather than the lithium (de)intercalation in NCMs), with a lithiated LiFePO4 phase and a delithiated FePO4 phase with unfavorable intermediate stages.
10,11
The analysis of individual LFP particles has shown that they are either present in their lithiated or delithiated stage, with very few particles in an intermediate stage.
12
This (de)intercalation behavior requires an adaptation of the kinetic theory and model to describe the (de)lithiation process.
13
On the other hand, Li(Ni1/3Co1/3Mn1/3)O2 (commonly referred to as NCM 111) can be seen as an intercalation material in the classical sense, where the structure can accommodate a continuous range of intercalated lithium and where the material transport inside the NCM particle can be described by classical diffusion. An important consideration, however, is that only part of the intercalated lithium can be exchanged reversibly, as it becomes structurally unstable upon full delithiation of the material.
14–17
Due to the widespread use of NCM materials, we chose to study the charge transfer kinetics of NCM 111, serving as a baseline case to assess whether the adapted BV equation along with the commonly used parameters can correctly describe the kinetic aspects of the material or whether extensions/modifications are required.
are similar to that of Newman.
7–9
Thus, Newmans adapted BV equation is used to model a variety of Li-ion battery active materials, even though the most commonly used active materials can drastically differ in the way the lithium insertion occurs. Nevertheless, the adapted BV equation is extensively used for widely utilized Li-ion battery active materials such as graphite or the materials from the NCM family, even though its applicability for these materials is not always clear due to a lack of experimental data. For instance, a popular Li-ion battery cathode active material is nanometer-sized LiFePO4 (LFP), for which the lithium (de)intercalation exhibits a two-phase behavior (rather than the lithium (de)intercalation in NCMs), with a lithiated LiFePO4 phase and a delithiated FePO4 phase with unfavorable intermediate stages.
10,11
The analysis of individual LFP particles has shown that they are either present in their lithiated or delithiated stage, with very few particles in an intermediate stage.
12
This (de)intercalation behavior requires an adaptation of the kinetic theory and model to describe the (de)lithiation process.
13
On the other hand, Li(Ni1/3Co1/3Mn1/3)O2 (commonly referred to as NCM 111) can be seen as an intercalation material in the classical sense, where the structure can accommodate a continuous range of intercalated lithium and where the material transport inside the NCM particle can be described by classical diffusion. An important consideration, however, is that only part of the intercalated lithium can be exchanged reversibly, as it becomes structurally unstable upon full delithiation of the material.
14–17
Due to the widespread use of NCM materials, we chose to study the charge transfer kinetics of NCM 111, serving as a baseline case to assess whether the adapted BV equation along with the commonly used parameters can correctly describe the kinetic aspects of the material or whether extensions/modifications are required.
To measure kinetic parameters, electrochemical impedance spectroscopy (EIS) can be a useful tool when it comes to discerning individual kinetic and transport related resistances. An important factor to consider in analyzing Li-ion battery electrode impedances is the effect of the various transport processes within thick, porous electrodes that strongly affect the impedance spectra obtained for a given active material. How to analyze porous electrode EIS spectra in order to be able to extract well-defined kinetic and transport parameters has been the subject of numerous publications.
2,18–23
The lithium ion transport resistances in the liquid electrolyte phase contained within the pores of Li-ion battery electrodes (further on referred to as  or pore resistance) lead to mass transport losses at higher current. This is particularly significant for the thick electrodes with industrially relevant areal capacities (∼3–5 mAh cm−2), where it results in a change of the local Li+ concentration in the liquid electrolyte across the thickness of the electrode. It is therefore important to understand the change of the kinetics of an active material for a changing electrolyte salt concentration. To simplify this analysis, it is first necessary to reduce the influence of the geometric electrode properties (i.e., porosity, thickness, tortuosity) on the electrochemical response of the active material, which can be achieved by using very thin electrodes with low active material loadings. This is due to the fact that the ionic pore resistance
  increases with electrode thickness while the charge transfer resistance (
 ) decreases with increased active material loading and thus with increasing thickness,
24
so that thin, low-loaded electrodes are dominated by the kinetic properties of the active material rather than by electrode morphology. A perfect exclusion of transport resistances within an electrode can in principle be achieved by single-particle measurements, like those reported by Tsai et al.
25
They performed single-particle impedance measurements of NCM 111, with a single NCM 111 particle attached to a tungsten tip, arguing that the successful extraction of intrinsic active material properties would require such an extreme approach. While this analysis made it possible to avoid the use of a polymer binder that is required for the preparation of electrode layers, such a setup still raises concerns about the electrical connection between the probe-tip and the active material particle. Additionally, microstructural changes of active material particles due to particle cracking, particularly prominent for polycrystalline NCM materials, may drastically change the material over the first few cycles, making an analysis of the material after several initial cycles in a practical setup more relevant.
26–30
) decreases with increased active material loading and thus with increasing thickness,
24
so that thin, low-loaded electrodes are dominated by the kinetic properties of the active material rather than by electrode morphology. A perfect exclusion of transport resistances within an electrode can in principle be achieved by single-particle measurements, like those reported by Tsai et al.
25
They performed single-particle impedance measurements of NCM 111, with a single NCM 111 particle attached to a tungsten tip, arguing that the successful extraction of intrinsic active material properties would require such an extreme approach. While this analysis made it possible to avoid the use of a polymer binder that is required for the preparation of electrode layers, such a setup still raises concerns about the electrical connection between the probe-tip and the active material particle. Additionally, microstructural changes of active material particles due to particle cracking, particularly prominent for polycrystalline NCM materials, may drastically change the material over the first few cycles, making an analysis of the material after several initial cycles in a practical setup more relevant.
26–30
In this publication we therefore first examine the influence of areal capacity (proportional to the areal active material mass loading) on the impedance spectrum of NCM 111 electrodes and on their charge rate capability in order to determine when the electrode performance is affected by mass transport, e.g., by changes in the electrolyte concentration across the electrode due to mass transport resistances in the liquid electrolyte phase. This allows us to define an areal capacity that is low enough to largely eliminate electrode-related transport resistances while still allowing for the preparation of homogenous electrode films, which we then employ for subsequent studies on the NCM 111 charge transfer kinetics and the solid phase lithium ion diffusion resistance in NCM 111. Thus, we determine the charge transfer resistance of NCM 111 at different electrolyte concentrations and temperatures. The charge transfer resistance and, qualitatively, the solid phase lithium diffusion resistance are then determined as a function of SOC. The dependence of the charge transfer resistance on electrolyte salt concentration is also compared to the expected functional dependency given by the adapted BV-type kinetics from Newman and co-workers. Finally, we show the importance of the SOC dependent change in kinetics on the intrinsic rate capability of the NCM 111 by comparing the performance of low areal capacity electrodes in charging and discharging direction.
Experimental
Slurry preparation and drying
Li(Ni1/3Co1/3Mn1/3)O2 (NCM 111, BASF, BET 0.3 m2 g−1), conductive graphite (SFG6L, Timcal), Super C65, and polymer binder (polyvinylidene fluoride (PVDF), Arkema) at a ratio of 90:2:3:5 (wt) were mixed with N-methyl-2-pyrrolidone (NMP, Sigma Aldrich, anhydrous, 99.5%) at a solid:liquid ratio of 1:1 (wt:wt) in a planetary mixer (Thinky ARV-310) at 2000 rpm for five minutes. The prepared slurry was coated onto an aluminium current-collector foil (MTI, 11 μm) attached to a glass plate using a gap bar coater (RK PrintCoat Instruments, UK) at a wet-film thicknesses of 30 μm, 60 μm, 120 μm, and 250 μm to attain areal the capacities of ∼0.25–0.4, ∼0.7, ∼1.6, and ∼2.9 mAh cm−2, respectively (based on a reversible capacity of 145 mAh g−1), and dried in an oven at 50 °C. While the electrodes coated at a wet-film thickness of 30 μm that were used for large parts of the analyses in this work showed a larger range of areal capacity, a later section will show that the influence of mass transport is negligible in the areal capacity range of ∼0.25–0.7 mAh cm−2. The dried electrodes were punched out to a diameter of 10.95 mm (equating to an area of ∼0.94 cm2) using an electrode punch (Hohsen Corp. OSAKA, Japan) and compressed via hydraulic press using ∼1 ton held for 10 s.
Cell assembly
For electrochemical impedance analysis, a three-electrode cell setup (Swagelok® T-cell) with a gold-wire reference electrode (GWRE, described in more detail in Fig. 1b in Ref. 31) was used. The cells were built inside an argon-filled glove box (MBraun, 25 °C ± 1 °C, oxygen and water content <0.1 ppm, Ar 5.0, Westfalen). All cell parts were dried at 120 °C in a vacuum oven (Büchi, Switzerland) for 8 h before being transferred into an Ar-filled glovebox, with the exception of the separators which were dried at 300 °C.
The cells were assembled with an NCM 111 working electrode, two porous glass fiber separators with a diameter of 11 mm (VWR, 250 μm uncompressed thickness, 90% porosity), and a counter electrode consisting of a free-standing graphite electrode firmly attached to the metallic lithium foil (as described in Ref. 32). 80 μl of electrolyte were added to the cells. The self-mixed electrolytes were made using LiPF6 (BASF, battery grade) and EC:EMC 3:7 (wt:wt) (battery grade, Gelon, China). Base solutions of 0.1 M, 1.0 M, and 3.0 M electrolyte were mixed and diluted to attain additional electrolyte concentrations of 0.03, 0.5, 1.5, 2.0, and 2.5 M. Additionally, commercial electrolyte (Gotion, USA, battery grade) of nominally the same composition for concentrations of 0.1, 1.0, and 2.5 M was used. Hydrogen fluoride was measured by acid-base titration with an approx. 1 mM NaOH in water employing the TitroLine® 7000 (SI Analytics, Germany), respectively. The exact concentration of the NaOH solution was determined by titrating 1 ml of an aqueous 10 mM potassium hydrogen phthalate solution (KHP, Sigma Aldrich, Germany).
Cell cycling procedures
Using a potentiostat (Bio-Logic Science Instruments, France), the gold-wire reference electrode (GWRE) was lithiated at 150 nA for 1 h via the counter electrode in a temperature-controlled chamber (25 °C, Binder). This establishes an equilibrium potential of the GWRE of +0.31 V vs Li+/Li. 31
The cycling protocol started with a 3 h open circuit voltage (OCV) phase to allow for complete wetting of the electrode. Five initial cycles at C/5 were performed galvanostatically (constant current (CC)) between cathode potentials of 2.5 V and 4.2 V vs Li+/Li (controlled via the GWRE), whereby the charge was completed with a constant voltage hold (CV) for 1 h; in some instances, upper cathode cutoff potentials of 4.4 V and 4.6 V vs Li+/Li were used (again, with a CCCV charge and CC discharge). The electrodes were then brought at C/10 to a desired cathode potential or lithium content x (defined as x in Lix(Ni1/3Mn1/3Co1/3)O2) and then held either at the desired cathode potential or at OCV for 1 h, respectively, prior to starting the impedance measurement. At 25 °C, the C/5 cycling to cathode potentials of 4.2, 4.4, or 4.6 V vs Li+/Li yielded reversible capacities of 145, 171, and 195 mAh g−1, respectively, determined separately in electrodes of ∼1.5 mAh cm−2 (not shown). The Li content x after the initial cycles was determined by subtracting the irreversible capacity losses (ICLs in mAh/g) of the electrodes after the initial five cycles from the theoretically assumed maximum capacity of 278 mAh g−1 via  or for SOC dependent measurements calculated from the delithiation capacity (DC in mAh/g) via
  This might also include parasitic reactions especially at higher cutoff voltages such that the calculated x-content might be an overestimate.
Potentiostatic electrochemical impedance spectroscopy measurements were performed at either the determined lithium content or at the set potential from 30 kHz to either 0.1 Hz or 0.001 Hz, with an excitation of 10 mV. For temperature dependent measurements, the cells were placed in a temperature-controlled chamber (Espec, Japan) and the impedance measurement was performed 2 h after the chamber had reached the target temperature.
For the NCM 111 lithiation (i.e., discharge) rate test, the NCM 111 electrodes were (after the initial C/5 cycles) first charged at constant current to a cathode potential of 4.2 V vs Li+/Li and held there for 1 h prior to initiating the constant current discharge to 2.5 V vs Li+/Li. Here, the selected discharge rates in CC mode were varied between C/10 and 5C, while the charge rates in CCCV mode were the same as the discharge rate for ≤1C discharge or kept at 1C for >1C discharge. For the NCM 111 delithiation (i.e., charge) rate test between C/10 and 5C, the NCM 111 electrodes were first discharged in CCCV mode to 2.5 V vs Li+/Li and then charged in CC mode to 4.2 V vs Li+/Li (the discharge rates were same as the charge rate for ≤1C charge or 1C for >1C charge).
Review of Newman-type Butler-Volmer Kinetics for Intercalation Materials
The here cited theory is shown to give the reader an overview over the predominantly used expressions for battery kinetics. It allows comparison of the prevalent theory to the experimentally obtained data and the presented equations have not been altered to explain any discrepancies between theory and experiment. To describe the intercalation kinetics of typical battery active materials, the following set of equations were proposed by Newman and coworkers 5,6,33,34
with  as the exchange current density,
  and
and  as the anodic and cathodic transfer coefficients,
  as the Faraday constant,
  as the universal gas constant,
  as solid potential,
  as the solution (electrolyte) potential, and
  as the open circuit voltage of the electrochemical interface. The exchange current density is given by the following expression:
33
as the open circuit voltage of the electrochemical interface. The exchange current density is given by the following expression:
33

Here,  is the exchange current density at reference concentration (
 ). For complex reactions,
 and
and  may be a complicated function of the symmetry factor and
  can even be unrelated to the
  and
and  parameters. The intercalation reaction is given as follows:

Lacking experimental data, Newman and coworkers assumed the intercalation reactions to be a first order reaction, and the following expression for the exchange current density was proposed (by replacing 
 and
and  ):
):

Here, the rate constant  also contains the Arrhenius type temperature dependence,
  is the concentration of lithium in the solid host (represented by
  in Eq. 4),
  is the concentration of unoccupied sites (represented by
  in Eq. 4), and
  is the concentration of lithium ions in the liquid electrolyte. For polymer electrolytes, the solubility of lithium in the electrolyte also plays a role, since the available solvation sites for lithium ions in polymer electrolytes are limited. The proposed expression by Newman for the exchange current density of polymer electrolyte incorporates this limitation in a similar way as it incorporates the concentration limitation of unoccupied sites in the solid phase, i.e., adding the term
  to the right-hand-side of Eq. 4.
34
to the right-hand-side of Eq. 4.
34
Equation 4, assuming  is extensively used in the battery modeling community for common liquid electrolyte battery active materials, even though the experimental validity of Eq. 4 has not been rigorously established. For small voltage perturbations (≤10 mV) of the kinetic overpotential
  Eq. 1 can be linearized using the approximation
  (also using
  ), resulting in

Here, the last term on the right-hand-side is derived in combination with Eq. 4. Equation 5 can be transformed into an equation for the charge transfer resistance for small kinetic overpotentials

The term  is a measure of the available free sites for intercalation, and thus for the theoretical state-of-charge (SOCtheor) for a cathode active material (in the case of NCM 111, e.g., x = 0 in Lix(Ni1/3Mn1/3Co1/3)O2 for 100% SOCtheor), but resulting in slower kinetics (larger
  ) when the lithium content of the material approaches its maximum value, as
  then approaches zero. On the other hand, the term
  describes the intercalated lithium that in theory is available for the delithiation reaction, (for NMC 111 0% SOCtheor is x = 1 in Lix(Ni1/3Mn1/3Co1/3)O2), resulting in slower kinetics when the active material becomes depleted of intercalated lithium and
  approaches zero. This leads to a U-shaped charge transfer resistance curve over the theoretical SOC (i.e., for a lithium content ranging from x = 1 to x = 0), with poor kinetics corresponding to high
  at high and low theoretical SOCs (see Fig. 1a).
Such a description is plausible when considering the potential profile vs state-of-charge of most intercalation materials. When the potential profile becomes very steep towards very high and very low SOCs, no charge can be passed, and the electrode is under so-called blocking conditions, where the reaction kinetics get too slow for practical applications.
20
This, e.g., is reflected in the shape of the potential vs SOC profile of TiS2 shown by West et al.,
35
which served as the template for the initial Newman model: TiS2 shows a symmetric, steep potential drop towards lower SOCs when the material is lithiated. Not every intercalation material can be reversibly fully depleted or fully filled, as will be shown in our later analysis of the SOC dependence of the charge transfer resistance of NCM 111, and therefore one must take care when using Eq. 4 to describe the kinetics of battery active materials. Figure 1a shows the SOC dependent charge transfer resistance as expressed in Eq. 6 (normalized to an  value of 1 Ω for the minimum resistance), following the relationship
  whereby
  and
and  for a cathode material (also assuming
  ). The resistance for
  (black line) has a symmetric U-shaped profile, with the minimum resistance at 50% SOCtheor. The change in resistance is less than a factor 2 between 10 and 90% SOCtheor, and
  only starkly increases at SOCs below or above those values, respectively. Changing
  to 0.3 or 0.7 (with the constraint of
  ) leads to asymmetric SOC dependent kinetics, and the resistance minimum is shifted to a higher SOCtheor (
 blue line) or a lower SOCtheor (
 red line). Figure 1b shows the concentration dependence of
  predicted by Eq. 6, with
  normalized to 1 Ω for a lithium-ion concentration in the electrolyte of 1 M. According to Eq. 6, the relationship between the charge transfer resistance and the lithium-ion concentration in the electrolyte is described by
  leading to lower
  values for higher lithium salt concentrations in the electrolyte.

Figure 1. Charge transfer resistance  vs theoretical SOC for intercalation materials acc. to the kinetic expression given in Eq. 6. (a) SOC dependent charge transfer kinetics for different combinations of
  and
and  assuming
  The plotted
  values are normalized to 1 Ω in their respective resistance minimum. (b)
  vs the lithium ion concentration in the electrolyte for different
  values (assuming
  ), normalized to a value of 1 Ω at a 1 M lithium ion concentration.
Download figure:
Standard image High-resolution imageResults and Discussion
Influence of areal capacity on charge transfer and diffusion resistance determination via EIS
This subsection discusses the influence of electrode areal capacity on the impedance spectra of NCM 111 electrodes (working electrode impedance spectra measured via gold-wire reference electrode), as well as the effect of areal capacity on the charge (i.e., delithiation) rate capability. This serves to define the value of the areal capacity that is low enough to not impose significant electrolyte transport resistances while still allowing the preparation of homogenous electrodes. Using such electrodes will later on allow for a more rigorous analysis of the NCM 111 charge transfer resistance and the solid phase lithium diffusion resistance.
Figure 2a depicts the equivalent circuit model for a porous Li-ion battery electrode. It consists of two current rails for the conduction of electrons (left) and ions (right). The left rail represents electrical resistance elements ( ) with an additional electrical contact resistance
  element at the current-collector/electrode interface (bottom left). The electrical resistance contributions are considered negligible in this study due to the relatively high amounts of carbon additives in the NCM 111 electrode (5 wt%; see Experimental section), but small influences on the spectra cannot be excluded. Some EIS spectra depicted in Fig. 2 show the end of a semi-circle at the highest frequencies, which is attributed to an electrical contact resistance (visible as a semi-circle in the kHz regime
20,36
) but cannot be resolved due to the frequency limitation of the GWRE above 30 kHz. The influence of electrical resistances on the blocking impedance of porous electrodes is described in Ref. 37. The right current rail in Fig. 2a consists of the ionic pore resistance, representing the ion conduction resistance in the electrolyte phase within the pores of the electrode (
element at the current-collector/electrode interface (bottom left). The electrical resistance contributions are considered negligible in this study due to the relatively high amounts of carbon additives in the NCM 111 electrode (5 wt%; see Experimental section), but small influences on the spectra cannot be excluded. Some EIS spectra depicted in Fig. 2 show the end of a semi-circle at the highest frequencies, which is attributed to an electrical contact resistance (visible as a semi-circle in the kHz regime
20,36
) but cannot be resolved due to the frequency limitation of the GWRE above 30 kHz. The influence of electrical resistances on the blocking impedance of porous electrodes is described in Ref. 37. The right current rail in Fig. 2a consists of the ionic pore resistance, representing the ion conduction resistance in the electrolyte phase within the pores of the electrode ( ), coupled with liquid diffusion Warburg elements in the pores (
 ). The ionic resistance and Warburg diffusion resistance in the separator (
 and
and  ) are shown in the top right corner of Fig. 2a. Finally, the two current rails are connected via elements that are composed of a charge transfer resistance (
 ) in series with a finite length solid phase diffusion Warburg element (
 ) that are both in parallel with a constant phase element from the electrochemical double-layer (
 ) at the active material and carbon additive surface
 ![$\left(\left[{w}_{{\rm{s}}}+{r}_{{\rm{ct}}}\right]/{q}_{{\rm{dl}}}\right).$](https://content.cld.iop.org/journals/1945-7111/170/8/080522/revision1/jesacf161ieqn75.gif) The liquid Warburg elements (separator and pores) are finite length diffusion elements in transmissive configuration (ionic current enters (/leaves) the separator from one end and leaves (\enters) from the other), which yield a constant diffusion resistance for low frequencies
The liquid Warburg elements (separator and pores) are finite length diffusion elements in transmissive configuration (ionic current enters (/leaves) the separator from one end and leaves (\enters) from the other), which yield a constant diffusion resistance for low frequencies  38
The solid diffusion resistance is a finite length diffusion resistance in reflective configuration (no flux boundary condition at the center of the solid particle for lithium transport), i.e., its imaginary resistance constantly changes (
38
The solid diffusion resistance is a finite length diffusion resistance in reflective configuration (no flux boundary condition at the center of the solid particle for lithium transport), i.e., its imaginary resistance constantly changes ( ) and its measured resistance is 1/5 of the total diffusion resistance for perfectly spherical diffusion (
 ).
39,40
).
39,40
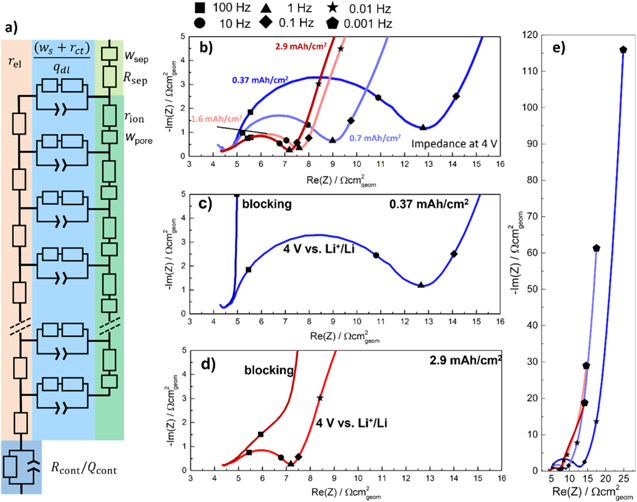
Figure 2. Equivalent circuit model and impedance spectra of NCM 111 electrodes with different areal capacities, using EC:EMC (3:7 g:g) with 1 M LiPF6 as electrolyte (note that the impedance data are aligned along the x-axis to correct for minor differences in the HFR for better visibility). (a) Porous electrode equivalent circuit model with two current rails: one (left) with electrical resistance elements (rel) and an electrical contact resistance at the bottom (Rcont), coupled with a constant phase element (Qcont), and one (right) with ionic pore resistances (rion) and pore Warburg elements ( ) and an ionic resistance an Warburg element for the separator (Rsep; and wsep, top right); both rails are connected by charge transfer resistance and solid phase diffusion Warburg elements (Rct; and ws,), coupled with associated constant phase elements (qdl). (b) EIS comparison of NCM 111 electrodes in EC/EMC with 1 M LiPF6 with areal capacities of 0.37, 0.7, 1.6, and 2.9 mAh cm−2, measured at cathode potentials of 4.0 V vs Li+/Li after five initial formation cycles. (c) & (d) EIS spectra obtained for the lowest and highest here studied areal capacities at cathode potentials of 4.0 V vs Li+/Li and at OCV prior to the formation cycles, i.e., under blocking conditions. (e) Impedance spectra of panel b but plotted all the way to 1 mHz. The symbols in panels b-e mark the frequencies to which the respective points correspond (see legend above panel b).
Download figure:
Standard image High-resolution imageFigure 2b shows the EIS spectra of NCM 111 electrodes of different areal capacities at a cathode potential of 4.0 V vs Li+/Li after a 1 h OCV hold (self-mixed EC:EMC (3:7 wt:wt) in 1 M LiPF6), which corresponds to a lithium content of x ≈ 0.53 in the NCM 111 material. It should be noted, that prior to these measurements, all cells had been subjected to five cycles with an upper cathode potential of 4.2 V vs Li+/Li. The lowest areal capacity of 0.37 mAh cm−2 shows the largest semi-circle, associated with the charge transfer reaction, with a charge transfer resistance of  ≈ 7.5 Ωcm2
geom. The charge transfer resistance decreases with increasing areal capacity, as it is inversely proportional to the areal capacity.
24
Figure 2c shows the impedance spectra of the 0.37 mAh cm−2 electrode at both 4.0 V vs Li+/Li as well as that recorded at OCV before any current was applied to the cell, i.e., under so-called blocking conditions (for blocking impedance analysis see Refs. 2, 18, 41): a small ionic pore resistance feature is visible at high frequencies, amounting to
≈ 7.5 Ωcm2
geom. The charge transfer resistance decreases with increasing areal capacity, as it is inversely proportional to the areal capacity.
24
Figure 2c shows the impedance spectra of the 0.37 mAh cm−2 electrode at both 4.0 V vs Li+/Li as well as that recorded at OCV before any current was applied to the cell, i.e., under so-called blocking conditions (for blocking impedance analysis see Refs. 2, 18, 41): a small ionic pore resistance feature is visible at high frequencies, amounting to  ≈ 2 Ωcm2
geom as determined from the real axis difference between the high- and low-frequency intercept in the blocking impedance spectrum (corresponding to
≈ 2 Ωcm2
geom as determined from the real axis difference between the high- and low-frequency intercept in the blocking impedance spectrum (corresponding to  Ωcm2
geom); the
Ωcm2
geom); the  contribution is also visible in the non-blocking spectrum at 4.0 V vs Li+/Li due to the low value of
  compared to
  at such a low areal capacity.
18,24
Increasing the areal capacity of the NCM 111 electrode decreases
at such a low areal capacity.
18,24
Increasing the areal capacity of the NCM 111 electrode decreases  due to the increase in electrochemically active surface area, but the simultaneously increasing
  for the resulting thicker electrodes transforms the impedance spectrum, so that
  needs to be evaluated independently to extract
  24
Figure 2d shows the impedance of the highest areal capacity electrode with 2.9 mAh cm−2, both under blocking conditions and at a cathode potential of 4.0 V vs Li+/Li. The
24
Figure 2d shows the impedance of the highest areal capacity electrode with 2.9 mAh cm−2, both under blocking conditions and at a cathode potential of 4.0 V vs Li+/Li. The  value extracted under blocking conditions now amounts to ≈8.5 Ωcm2
geom. This value is not consistent with the ∼8 fold increase in areal capacity (i.e., from 0.37 to 2.9 mAh cm−2) which one might expect to also lead to a ∼8-fold increase in
value extracted under blocking conditions now amounts to ≈8.5 Ωcm2
geom. This value is not consistent with the ∼8 fold increase in areal capacity (i.e., from 0.37 to 2.9 mAh cm−2) which one might expect to also lead to a ∼8-fold increase in  but considering the very thin electrodes for the lower areal capacity, an increase in loading is not expected to directly increase the thickness proportionally at first. The electrode of 1.6 mAh cm−2 on the other hand shows an
  of ∼5 Ωcm2
geom (expected ∼4.7 Ωcm2
geom, assuming it follows the trend of the 2.9 mAh cm−2 electrode) and is more in line with the expected trend. The 1 Hz low-frequency resistance (LFR1Hz) and the high-frequency resistance (HFR) intercepts give an electrode resistance (LFR1Hz-HFR, no semi-circle fit) of ≈3 Ωcm2
geom. Analyzing the spectra according to the procedure outlined in Ref. 24 gives a resulting charge transfer resistance of ≈1 Ωcm2
geom, i.e., significantly smaller than the 3 Ωcm2
geom electrode resistance, but in accordance with the ≈8 fold increase in active material from 0.37 to 2.9 mAh cm−2.
of ∼5 Ωcm2
geom (expected ∼4.7 Ωcm2
geom, assuming it follows the trend of the 2.9 mAh cm−2 electrode) and is more in line with the expected trend. The 1 Hz low-frequency resistance (LFR1Hz) and the high-frequency resistance (HFR) intercepts give an electrode resistance (LFR1Hz-HFR, no semi-circle fit) of ≈3 Ωcm2
geom. Analyzing the spectra according to the procedure outlined in Ref. 24 gives a resulting charge transfer resistance of ≈1 Ωcm2
geom, i.e., significantly smaller than the 3 Ωcm2
geom electrode resistance, but in accordance with the ≈8 fold increase in active material from 0.37 to 2.9 mAh cm−2.
Figure 2e shows the full EIS spectra recorded at 4.0 V vs Li+/Li down to 1 mHz (note that these are the same data as in Fig. 2b, just plotted to lower frequencies). The capacitive behavior at lower frequencies (between 10 mHz and 1 mHz, marked by star and diamond symbols, respectively) is mostly attributed to the solid phase finite length (reflective) Warburg resistance.
22,23
The impedance analysis thus gives two distinct capacitance values (not counting the capacitance from a contact resistance semi-circle that is partially visible at the highest frequencies): i) the electrochemical double-layer capacitance from the electrode material/electrolyte interface ( in Fig. 2a), which scales with the surface area of the cathode active material and the conductive carbons; and, ii) the capacitance relating to the charge storage capacity (contained in
  in Fig. 2a), which scales with the cathode active material areal capacity and which also depends on the local slope of the OCV.
39
in Fig. 2a), which scales with the cathode active material areal capacity and which also depends on the local slope of the OCV.
39
Regarding the latter, seeking to determine whether the low frequency (<10 mHz) capacitance can be correlated to the charge extracted from the NCM 111 material, and thus to the solid phase lithium diffusion resistance, we compared the measured capacitance at very low frequencies to the charge which could be extracted in the region of the NCM 111 OCV potential profile around 4.0 V vs Li+/Li. Moškon et al.
42
have performed a similar analysis on LiMnPO4 and have shown that such an approach is feasible. In our case we examined the charge curve of the NCM 111 electrodes obtained in the C/5 formation cycle just prior before the impedance measurements, quantifying the charge that was extracted between 3.99 V and 4.01 V vs Li+/Li, further on referred to as  (i.e., between ±10 mV [
 ] around the 4.0 V vs Li+/Li, where the EIS measurement with an amplitude of ±10 mV was conducted). Figures 3a and 3b illustrate the method for determining
  and
and  The later on discussed charge rate capability test in Fig. 4 shows that at C/5 ≈ 99% of the capacity at C/10 could be obtained, suggesting that the overpotential for all NCM 111 electrodes at C/5 was low enough to assume a full extraction of charge at this C-rate and thus
  could be accurately determined. As a second step, assuming perfect capacitive behavior, the low-frequency datapoints in Fig. 2e were converted to an electrical charge value via
  with
with  being the angular frequency and
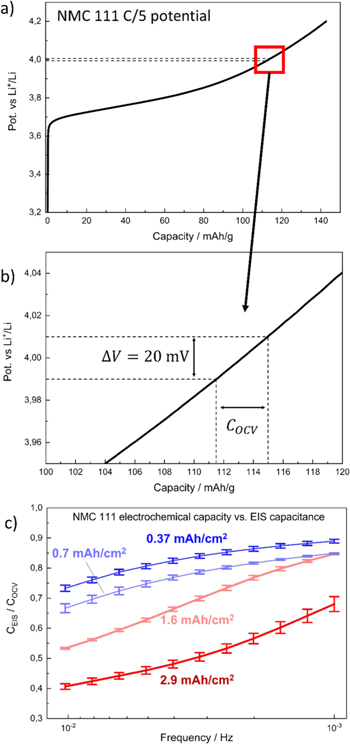
Figure 3. Comparison of the charge calculated from EIS spectra at different frequencies ( ) and the charge extracted from the linearized potential profile of the NCM 111 electrodes with different areal capacities (
 ) in order to validate the assumption of probing mainly the solid phase diffusion branch of the electrode at very low frequencies. (a) Exemplary potential profile of an NCM 111 electrode with an areal capacity of 0.37 mAh cm−2, with dotted lines highlighting where the diffusion resistance measurement and the COCV capacity determination was conducted; (b) zoomed-in view. (c) CEIS/COCV ratio as a function of EIS measurement frequency, recorded at a cathode potential of 4.0 V vs Li+/Li after five initial formation cycles. The electrodes with the lower areal capacities approach the expected value of 1, indicating that using low-areal capacity electrodes improves the accuracy of the diffusion resistance analysis at a given frequency. The experiments were conducted using self-mixed EC:EMC (3:7 wt:wt) with 1 M LiPF6 as electrolyte at 25 °C.
Download figure:
Standard image High-resolution image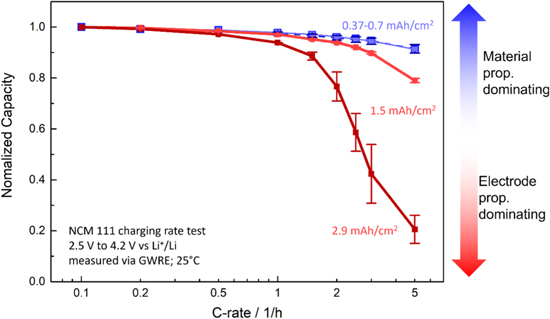
Figure 4. Delithiation (i.e., charge) rate test of NCM 111 electrodes at different areal capacities. The change in performance with areal capacity is attributed to mass transport losses in the electrolyte phase within the electrode pores due to electrolyte concentration gradients. The 0.37 and 0.7 mAh cm−2 electrodes are overlapping, suggesting no influence from mass transport on both measurements and thus a predominant limitation by the NCM 111 kinetics and/or solid phase lithium diffusion. The 1.5 mAh cm−2 electrode shows initial signs of additional losses at C-rates of 2C, while the 2.9 mAh cm−2 electrodes already show initial limitations at 1C, exhibiting the most drastic performance drop off among all samples. Rate tests were performed between 2.5–4.2 V vs Li+/Li in a T-cell setup with a GWRE in 1 M self-mixed LP57 electrolyte at 25 °C.
Download figure:
Standard image High-resolution imageFigure 3c shows the thus determined  ratios as a function of frequency and areal capacity. The
  ratios for the NCM 111 electrodes with the lowest areal capacities (dark blue symbols/lines) approach ≈0.89, meaning that the imaginary resistance in the EIS measurement is slightly higher than expected and thus gives slightly lower
  values compared to the
  capacity value predicted by the charge curve. However, the apparently gradual approach towards a
  ratio of 1 with varying electrode capacities from 0.37 to 2.9 mAh cm−2 suggests that the assumption of probing the active material properties (as opposed to the electrode or separator properties) as the frequency is decreased to very low values holds true and that there is no interference by parasitic side reactions. More importantly, it shows that frequencies of ≈1 mHz allow for an almost quantitative determination of the charge capacity by EIS for the electrode with the lowest here examined areal capacity of 0.37 mAh cm−2 (i.e., its
  ratio becomes close to 1), while for the thicker higher areal capacity electrodes much lower frequencies would be required.
The reason for the discrepancy of 11% between  and
and  for the lowest areal capacity electrode is not known; it might be either a systematic error in evaluating the data (e.g., the assumption of perfect capacitive behavior) or a not yet fully completed diffusion process, both supported by the impedance data, as the capacitive branch has not reached a perfect 90° upward angle (see Fig. 2e). Nevertheless, the lowest here examined areal capacity of 0.37 mAh cm−2 seems sufficient to essentially fully probe the active material at a frequency of 1 mHz, and only little further improvement would be obtained by decreasing the areal capacity of the electrode which would render it more difficult to achieve homogeneous electrode layers. Probing the electrode to even lower frequencies than 1 mHz would result in impractically long measurement times. The substantial discrepancy of the 2.9 mAh cm−2 electrode is not surprising, as a higher areal capacity results in a reduced low-frequency imaginary resistance due to the capacitive nature of the 10 mHz to 1 mHz frequency resistance regime. The spectrum is thus more likely to be disturbed by other diffusion phenomena (e.g., from the separator liquid diffusion which is a constant contribution in all measurements), and the assumption of a dominating solid diffusion resistance becomes invalid at such high areal capacities. Additionally, a liquid phase diffusion resistance in the thicker high areal capacity electrode might arise, which, if not yet fully completed at the lowest frequency of 1 mHz, still adds to the imaginary part of the impedance spectrum. The electrolyte in the electrode pores can have significant influence on the low-frequency impedance spectra (as shown in Ref. 23), which we aim to decrease here. This shows that electrodes with a very low areal capacity are useful when analyzing the kinetics and the solid phase lithium diffusion in Li-ion battery active materials, as the resistances for both of these processes become enlarged and dominant in their respective frequency domain. A more detailed analysis of the diffusion resistance and charge transfer kinetics over SOC will be given below.
The electrode areal capacity can have great impact on the electrode behavior. An increased areal capacity means an increase in electrode thickness, which, during cycling, can result in higher electrolyte mass transport losses, i.e., changes in Li+ concentration in the electrolyte. A change in Li+ at the electrode interface in turn changes the electrode charge transfer resistance, as described by Eqs. 2 and 4. To understand which areal capacity is affected by the liquid electrolyte transport, the NCM 111 electrodes underwent a delithiation (i.e., charge) rate test as shown in Fig. 4. The electrodes with the lower areal capacities of 0.37 and 0.7 mAh cm−2 show the same high capacities reached even for C-rates up to 5C (blue colored lines/symbols). This is because the mass transport overpotential of these electrodes (in the electrolyte) is still negligibly small up to 5C and that their performance is mainly limited by the NCM 111 properties, e.g., the kinetics and/or the solid lithium diffusion resistance. The high capacities achieved up to 5C show that the material is only weakly limited in these aspects. Increasing the areal capacity of the NCM 111 electrodes decreases the achieved electrode capacities drastically for higher C-rates (see red colored lines/symbols). In these cases, the electrodes now become limited in the electrolyte transport (electrical resistances are assumed small due to the high amount of conductive additive in the electrodes, see experimental section), leading to strong concentration gradients in the electrolyte phase across the thickness of the electrode. To study the effect of the Li+ concentration in the electrolyte on the electrode kinetics, we measured the material kinetics at different electrolyte concentrations using electrodes with low areal capacities (0.25–0.4 mAh cm−2).
Kinetics of NCM 111 at varying LiPF6 concentrations
This subsection shows the results of the EIS analysis of low-areal capacity NCM 111 electrodes (∼0.25 mAh cm−2) using LiPF6 salt concentrations between 0.03 M and 3 M in EC:EMC 3:7 (wt:wt). NCM 111 half-cells with GWRE were assembled using different electrolyte concentrations and cycled 5 times between 2.5–4.2 V vs Li+/Li at C/5 (including a 1 h potential hold at 4.2 V) before measuring impedances at various steps between 3.6 V and 4.2 V vs Li+/Li. For the concentration dependent impedance analysis shown in Fig. 5, a self-mixed electrolyte was used (see experimental section), while for a later analysis, commercial electrolyte pre-mixed at varying salt concentrations was used to ensure the results obtained here were not the result of improper material handling. Both sets of electrolytes gave comparatively similar results, as explained in this section.
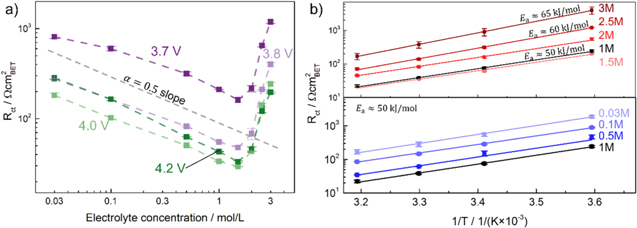
Figure 5. EIS results of NCM 111 electrodes with low-areal capacity (∼0.25 mAh cm−2), depicting the charge transfer resistance Rct measured for different LiPF6 salt concentrations using the self-mixed electrolyte and normalized to the NCM 111 BET surface area of 0.3 m2 g−1. (a) 25 °C data measured at potentials between 3.6–4.2 V vs Li+/Li (i.e., for x ≈ 0.9–0.36 in Lix(Ni1/3Mn1/3Co1/3)O2); while at concentrations ≤1.5 M the behavior is following a logarithmic trend, the Rct values obtained above 1.5 M are contradicting the usually expected BV-trend. (b) Arrhenius plot of the temperature dependence of the charge transfer resistance measured at 4.0 V vs Li+/Li (i.e., for x ≈ 0.46) at different salt concentrations. For concentrations between 0.03 M to 2 M, the activation energy is ∼50 kJ mol−1 and increases to 60 and 65 kJ mol−1 for the 2.5 and 3 M measurements, respectively.
Download figure:
Standard image High-resolution imageThe above described BV and Newman kinetics for liquid electrolytes predict a correlation of the exchange current density with the Li+ electrolyte concentration to be  (see Eq. 4), assuming all other parameters are constant. This includes the concentration of the lithium intercalated in the solid (
 ), which is taken care of when measuring at the same SOC. Since the reference electrode is also immersed in the same electrolyte as the working electrode, the analysis and potentials all shift equally with changing electrolyte concentration according to the Nernst equation, and the cycling and measuring protocol do not need to be adjusted. Figure 5a shows the concentration-dependent charge transfer resistance, normalized to the NCM 111 BET surface area (0.3 m2 g−1), evaluated at potentials ranging from 3.6–4.2 V vs Li+/Li (i.e., for x ≈ 0.9–0.36 in Lix(Ni1/3Mn1/3Co1/3)O2). For concentrations from 0.03 M to 1.5 M, the logarithm of the charge transfer resistance
  vs the logarithm of the electrolyte concentration follows a linear relationship, with a slope of very close to −0.5 (marked by the gray dashed line in Fig. 5a). This is consistent with the prediction based on Eq. 6 when considering that these data are recorded at constant temperature (i.e., at constant value of
  ) and constant potential (i.e., at constant SOC or
  ): in this case log(
 ) should be proportional to −
 ·log(
·log( ), so that a slope of −0.5 indicates an
  coefficient of 0.5. However, for higher electrolyte concentrations, i.e., above 1.5 M,
  increases with increasing electrolyte concentration, contrary to the expected theoretical behavior for liquid electrolytes.
Figure 5b shows an Arrhenius plot of the temperature-dependent NCM 111 charge transfer resistances at 4.0 V vs Li+/Li, yielding activation energies of ∼50 kJ mol−1 at electrolyte concentrations between 0.03–2 M, increasing to ∼60 kJ mol−1 and ∼65 kJ mol−1 for the 2.5 M and 3 M electrolyte, respectively. The deviation from the expected BV-type behavior (i.e., from a constant activation energy value and a constant  ) can be caused by numerous reasons, e.g., the effect a high salt concentration may have on the electrolyte properties. A review of Li-ion battery electrolytes can be found in Ref. 43.
To first ensure that the observed behavior is not an artefact of the self-mixed electrolyte and any impurities such as hydrogen fluoride (HF) that might arise from mixing high concentrated electrolytes, we re-measured the NCM 111 kinetics using commercially available 0.1 M, 1 M, and 2.5 M electrolytes. The 1 M and 2.5 M commercial electrolyte was tested for its HF content via an HF titration (see experimental section) and determined to be 44 ppm for the 2.5 M electrolyte, compared to an essentially identical concentration of 39 ppm for the 1 M electrolyte. At the time of availability of the HF probe and the commercial electrolyte, the self-mixed electrolyte had been discarded due to its age. For the commercial electrolyte we can assume no additional influence coming from HF impurities which could damage the NCM surface when using a highly concentrated (i.e., 2.5 M) electrolyte, yet observed the same phenomenon of increasing resistances (from 1 M to 2.5 M LiPF6) as for the self mixed electrolyte.
Figure 6a shows the impedance response of the low-areal capacity NCM 111 electrodes shown in Fig. 5 (∼0.25 mAh cm−2) at 4.0 V vs Li+/Li, measured in a 0.1, 1, and 2.5 M commercial electrolyte (blue, black, and dark red lines). The decrease of  by a factor ∼3 when increasing the electrolyte concentration from 0.1 to 1 M is consistent with an
  -value of 0.5, and thus gives the same result as the self-mixed electrolyte (see Fig. 5a). When increasing the electrolyte concentration to 2.5 M using the commercial electrolyte,
  again increases substantially (∼3-fold), as was observed for the self-mixed electrolyte (by ∼4-fold, see Fig. 5a), suggesting that this behavior is not an artefact from the preparation of the self-mixed electrolytes. The impedance response with the 2.5 M commercial electrolyte shows what appears to be an additional semi-circle feature below 1 Hz (triangular symbol on the dark red line) that was also observed in the earlier experiments with self-mixed electrolytes, which, however, is not observed for the impedance spectra recorded with ≤1.5 M electrolytes. There are at least two possible sources for the unexpected impedance increase and the additional impedance feature for electrolyte concentrations ≥2 M: (i) the feature is part of the electrolyte impedance response alone (e.g., electrolyte diffusion), i.e., not connected to the NCM 111 kinetics and ascribable to some other polarization phenomena; (ii) it arises from the solid/liquid interface, i.e., from the interaction of the electrolyte with the solid phase, and is therefore connected to the kinetics. The first hypothesis is easily tested, as any property which solely arises from the electrolyte would be visible, and reasonably constant, when using other electrodes with a higher areal capacity, similar to, e.g., the ohmic separator resistance, which is not a function of any electrode state or property. Here it can be observed that the 1.5 mAh cm−2 electrode measured in the 2.5 M electrolyte (light red line in Fig. 6a) shows a similar impedance feature in the same frequency range (i.e., near 1 Hz, marked by the triangular symbol), albeit significantly decreased in magnitude. Comparing the shape of the 1.6 mAh cm−2 electrode impedances from Fig. 2b (light red curve) recorded in 1 M self-mixed electrolyte with the 1.5 mAh cm−2 electrode impedance in Fig. 6a recorded in 2.5 M commercial electrolyte shows that the impedance of the former has a minimum around 1 Hz, whereas the impedance of the latter exhibits an additional stretched out feature around 1 Hz, which could arise from an underlying semi-circle. It can therefore be concluded that the feature visible in the measurement with the 2.5 M electrolyte is not from the electrolyte itself, but is rather related to the interface between the electrode active material and the electrolyte and that the large semi-circle is still representing the material kinetics.

Figure 6. NCM 111 impedance date measured at 4.0 V vs Li+/Li and 25 °C, from data shown in Fig. 5. (a) Impedance data measured in a 0.1 M (blue), 1 M (black), and 2.5 M (dark red) commercial electrolytes for low-areal capacity electrodes of ∼0.25 mAh cm−2 as well as for a ∼1.5 mAh cm−2 electrode in 2.5 M electrolyte (light red, specifically marked in the figure), still showing an increase in Rct at high salt concentration. The latter is not predicted by the simple BV theory, and the measurement with a higher areal capacity electrode shows that the additional feature around 1 Hz (triangular symbol) is linked to the electrode surface area and not the electrolyte. (b) Replots the 1 M and 2.5 M electrolyte impedances from a), comparing them to the impedance of the electrode cycled in the 2.5 M electrolyte after harvesting, washing in DEC, re-assembly in a cell with 1 M electrolyte, and recording the impedance after one cycle (light gray line) as well as after 2 and 5 cycles (gray and dark gray lines, respectively). For the harvested and re-assembled electrode, the impedance measured in the first cycle is substantially reduced and after five cycles very closely resembles that of the electrode originally recorded in the 1 M electrolyte, suggesting no permanent surface change has occurred.
Download figure:
Standard image High-resolution imageThe influence of high salt concentrations on the material interface have been studied in the literature as well. Steinrück et al. 44 studied the electrolyte/metal oxide interface and found that a highly concentrated electrolyte builds a more ordered electrochemical double layer around metal oxides. Tatara et al. 45 show similarly increased kinetic resistances of NCM 811 for high electrolyte concentrations, but also show that additional delithiation outside of the material's usual stability window (in their case from 4.3 V and upwards for the NCM 811) shows lower degradation when using higher salt concentrations. This was explained by a reduced electrolyte reactivity due to the higher salt concentration.
To see if the effect of the highly concentrated electrolyte is permanent, the electrodes cycled in 2.5 M electrolyte were harvested, washed in diethyl carbonate (DEC), and re-measured in a 1 M electrolyte (see Fig. 6b). Measuring the impedance at 4.0 V vs Li+/Li in the first cycle after electrolyte exchange shows a reduction in the impedance (light gray line in Fig. 6b, and in the subsequent cycles the impedance (darker gray lines) becomes essentially identical to the impedance of the NCM 111 electrode measured solely in a 1 M electrolyte (black line). The effects from the electrolyte therefore do not appear permanent but were also not immediately removed by the washing step. This suggests a non-destructive interplay between the NCM 111 material and the electrolyte, and thus the kinetics shown in Fig. 5 appear to be valid (i.e., not a measurement artefact) and the rise in resistance above 1.5 M electrolyte salt concentration appears to be a true phenomenon. It should be mentioned that, as shown by Tatara et al., the effect a highly concentrated electrolyte has on the cathode active material kinetics depends also on the type of salt, as, e.g., LiBF4 has a lower EC coordination compared to LiPF6, 45 and thus a comparison of two electrolytes using different salts (or the same salt but different concentrations of EC in the solvent) is expected to yield different outcomes.
An alternative explanation for the increase in kinetics for highly concentrated electrolytes is the solubility limit of the LiPF6 salt in the electrolyte, i.e., the maximum dissociated salt concentration achievable for a given electrolyte composition. Such a limit could lead to a similar behavior of the electrolyte salt concentration-dependent kinetics compared to the SOC dependent active material kinetics. As free solvent molecules (predominantly EC) in the electrolyte are required to dissociate the lithium salt,
46,47
a high concentration of Li+ at the electrode/electrolyte interface could hinder further solvation of Li+. Figure 7 plots the logarithm of the charge transfer resistance linearly over the electrolyte salt concentration, with the gray line representing an analogous functionality as that used to describe the SOC dependence of  (see Fig. 1a) except now with
  representing the saturation limit of the electrolyte (i.e.,
  for constant SOC and temperature; see discussion near Eq. 4); here we used
  and we assumed
  to correspond to 3 M, as this appeared to be the highest achievable salt concentration during mixing. A similar theory has been proposed by Newman for polymer electrolytes, which are limited in the amount of Li+ which can be solubilized by the polymer electrolyte.
6,34
The shape of the experimental data appears asymmetric, with still a minimum at half of the here assumed maximum salt concentration. Quantitatively, however, this trend that cannot be represented by the equation used for the gray line, which significantly deviates from the experimental data (compare gray line and light green symbols/lines). Thus, further investigation into the kinetics at high salt concentrations and a modification of the kinetic equation are necessary to find a proper mathematical representation of the here measured charge transfer resistances.
to correspond to 3 M, as this appeared to be the highest achievable salt concentration during mixing. A similar theory has been proposed by Newman for polymer electrolytes, which are limited in the amount of Li+ which can be solubilized by the polymer electrolyte.
6,34
The shape of the experimental data appears asymmetric, with still a minimum at half of the here assumed maximum salt concentration. Quantitatively, however, this trend that cannot be represented by the equation used for the gray line, which significantly deviates from the experimental data (compare gray line and light green symbols/lines). Thus, further investigation into the kinetics at high salt concentrations and a modification of the kinetic equation are necessary to find a proper mathematical representation of the here measured charge transfer resistances.
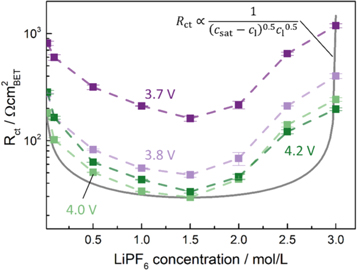
Figure 7. Charge transfer resistance data from Fig. 5 replotted vs electrolyte salt concentration on a linear scale. The gray line plots the charge transfer resistance vs electrolyte concentration relationship based on the Newman type BV kinetic theory (Eq. 4) with the inclusion of a solubility limit in the electrolyte salt concentration csat (here assumed as 3 M), so that Rct should follow the expression given in the upper right corner of the figure (measured at constant SOC and temperature); it is normalized to the minimum value measured at 4.0 V vs Li+/Li in 1.5 M electrolyte.
Download figure:
Standard image High-resolution imageThis analysis shows that the NCM 111 kinetics for electrolyte concentrations of up to 3 M cannot be described by the simple relationship of  but that an additional term for higher-concentrated electrolytes or an adaptation of the equations is required, including also an electrolyte solubility limit. An additional method to determine the transfer coefficients
  and
and  would be to apply high currents and measuring the kinetic overpotential to extract the Tafel kinetics. The following estimate, however, shows that this is experimentally rather difficult, if not impossible. Based on the impedance data at 4.0 V vs Li+/Li for the ∼0.37 mAh cm−2 NCM 111 electrode in Fig. 2c, yielding an
  value of ∼8 Ωcm2
geom, the
value of ∼8 Ωcm2
geom, the  value for a 0.1 mAh cm−2 electrode (in our view the experimentally lowest feasible areal capacity) should be ∼4-fold higher, amounting to ∼30 Ωcm2
geom. Calculating the kinetic overpotential at 1C (≡0.1 mA cm−2) would then yield a value of ∼3 mV acc. to Ohm's law, which is valid to use as such low overpotentials are in the linear BV-regime. To accurately measure the kinetic resistances at high overpotentials would require currents far beyond 20C or 2 mA cm−2 (at this point, the linearly estimated overpotential would still only amount to ∼60 mV), which for cell setups such as the T-cell setup used here are impractical, as these current densities lead to additional losses across the separator due to electrolyte transport limitations. Furthermore, solid diffusion limitations and changes in SOC would also additionally distort the measurement results at such high currents. As a matter of fact, the areal capacity-dependent rate test shown in Fig. 4 also shows that the limitation in electrolyte transport does not allow for current densities far outside of the linear BV-regime for practical applications of Li-ion batteries.
value for a 0.1 mAh cm−2 electrode (in our view the experimentally lowest feasible areal capacity) should be ∼4-fold higher, amounting to ∼30 Ωcm2
geom. Calculating the kinetic overpotential at 1C (≡0.1 mA cm−2) would then yield a value of ∼3 mV acc. to Ohm's law, which is valid to use as such low overpotentials are in the linear BV-regime. To accurately measure the kinetic resistances at high overpotentials would require currents far beyond 20C or 2 mA cm−2 (at this point, the linearly estimated overpotential would still only amount to ∼60 mV), which for cell setups such as the T-cell setup used here are impractical, as these current densities lead to additional losses across the separator due to electrolyte transport limitations. Furthermore, solid diffusion limitations and changes in SOC would also additionally distort the measurement results at such high currents. As a matter of fact, the areal capacity-dependent rate test shown in Fig. 4 also shows that the limitation in electrolyte transport does not allow for current densities far outside of the linear BV-regime for practical applications of Li-ion batteries.
SOC dependent EIS analysis—method description
This subsection shows the Li-content dependent analysis of the charge transfer kinetics as well as the low-frequency diffusion resistance measured down to 1 mHz.
Figure 8a shows an impedance spectrum of a low-areal capacity NCM 111 electrode at 3.78 V vs Li+/Li (x ≈ 0.64) as well as the equivalent circuit for a thin electrode at the top of the figure. As a 0.32 mAh cm−2 electrode has a mass loading of less than 3 mg cm−2 and is thus rather thin (<15 μm, estimated), its pore resistance is negligibly small compared to the other resistances, so that the main contributions to the impedance are the high-frequency separator resistance offset, the charge transfer resistance (red semi-circle) as well as diffusion resistances (blue). For such an electrode,  can directly be extracted from the impedance spectra without the use of a transmission line model. The measured diffusion resistance, however, has two contributions, namely the liquid diffusion in the separator and the solid diffusion in the cathode active material. Measuring the low-frequency impedance at different SOCs would thus only change the cathode active material solid diffusion resistance and the charge transfer resistance. The separator diffusion resistance can then be assumed constant, as it is not a function of the cathode active material SOC.
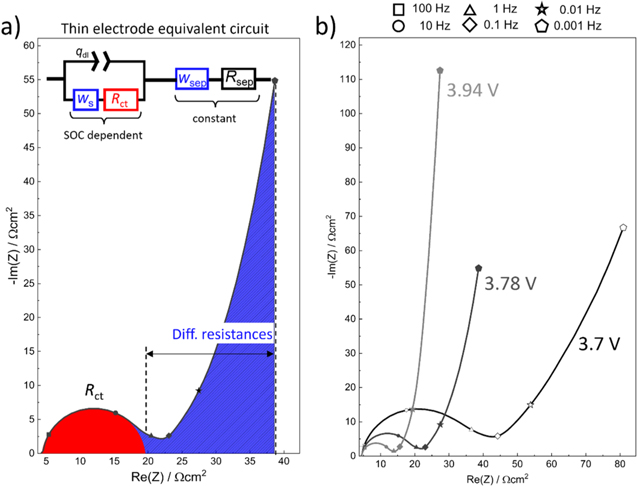
Figure 8. Nyquist plots for NCM 111 electrodes with ∼0.32 mAh cm−2 at 25 °C in the self-mixed LP57 electrolyte (1 M LiPF6), with frequencies down to 1 mHz. (a) Example plot showing the contribution of the kinetic and the diffusion resistance. The diffusion resistance includes both the resistance from the reflective solid Warburg diffusion in the NCM 111 cathode active material as well as the transmissive Warburg diffusion resistance from the liquid electrolyte in the separator, whereby the latter can be considered to be constant over all SOCs. (b) Example impedance plots depicting the low frequency impedance of the NCM 111 electrode at 3.7 V vs Li+/Li (x ≈ 0.8 in LixNi1/3Co1/3Mn1/3O2), 3.78 V (x ≈ 0.64), and 3.94 V (x ≈ 0.5), showing both a decrease in charge transfer kinetics and diffusion resistance with increasing SOC.
Download figure:
Standard image High-resolution imageFigure 8b shows exemplarily the NCM 111 impedance spectra at different potentials, from 30 kHz to 1 mHz. At 3.7 V vs Li+/Li (x ≈ 0.8), the impedance response down to 1 mHz does not yet reflect a purely capacitive behavior (i.e., it is not yet close to a 90° slope), and thus the diffusion resistance that would be deduced from the 1 mHz data would be underestimated. The other two spectra recorded at higher NCM 111 potentials have reached a (mostly) capacitive behavior at 1 mHz, so that their diffusion resistance can be determined at least semi-quantitatively. The analysis was performed using the x-axis (Re(Z)) value of the 1 mHz datapoint and subtracting both the HFR and the  values. The remaining resistance value constitutes the diffusion in the separator and the impedance response of the spherical diffusion in the solid cathode active material.
SOC dependent EIS analysis—charge transfer resistance Rct
Figure 9 shows the charge transfer resistance at different states of lithiation of the NCM 111 electrodes. As discussed earlier, the Newman kinetics were designed for a full insertion/removal of the active lithium species into the material. This, however, is generally not possible for NCM materials: full lithiation after the first cycle is not possible for NCM 111 due to the extremely slow lithiation kinetics at high degrees of delithiation
48
(commonly referred to as first-cycle irreversible capacity loss or first-cycle ICL) and at high degrees of delithiation the material becomes unstable. NCM 111 can usually be cycled up to a potential of ∼4.4 V vs Li+/Li, and we additionally cycled the material to 4.6 V to understand the kinetic behavior over a wider SOC range, even though the material is not stable for long term cycling at this potential.
14,48
All cells were cycled 5 times at C/5 to the respective cut-off potential before the SOC-dependent impedance measurement was performed. Figure 9a shows  normalized to the BET surface area as a function of the lithium content x (note that x = 1 corresponds to SOCtheor = 0%). The NCM 111 electrodes exhibit an initial Li-loss due to the slow kinetics for lithium re-insertion and, in case of high upper cutoff potentials, due to irreversible reactions at high potentials, which is reflected by the shift of the U-shaped curves in Fig. 9a to the right side and by the increase in charge transfer resistance at higher lithium content x (i.e., at low SOCtheor), some of which could be recovered by applying a low potential to the material for several hours (assuming the material has not undergone substantial irreversible changes).
48
normalized to the BET surface area as a function of the lithium content x (note that x = 1 corresponds to SOCtheor = 0%). The NCM 111 electrodes exhibit an initial Li-loss due to the slow kinetics for lithium re-insertion and, in case of high upper cutoff potentials, due to irreversible reactions at high potentials, which is reflected by the shift of the U-shaped curves in Fig. 9a to the right side and by the increase in charge transfer resistance at higher lithium content x (i.e., at low SOCtheor), some of which could be recovered by applying a low potential to the material for several hours (assuming the material has not undergone substantial irreversible changes).
48

Figure 9. SOC dependent kinetics measured for electrodes of ∼0.37 mAh cm−2 in self-mixed LP57 electrolyte (1 M LiPF6) at 25 °C, cycled to the different upper cutoff potentials marked in the figure. (A) Charge transfer resistance as a function of Li-content x (described as LixNi1/3Co1/3Mn1/3O2), for NCM 111 cycled initially to different upper cutoff potentials. The general shape follows that of the Newman-type kinetics with both  -values being 0.5 (labeled as
  gray line), but the NCM 111 material shows stronger changes with SOC and the minima are shifted to lower degrees of lithiation. (B) Re-plots the data from (a), but redefining the theoretical SOC as SOCadjusted, such that 0% SOCadjusted corresponds to the practically full material after the first-cycle ICL and 100% SOCadjusted corresponds to a theoretically complete delithiation of the material. The materials now show their minimum resistance at 50% SOCadjusted and the kinetics can be described by the Newman-type kinetics with both
  -values being 2 (labeled as
  light gray line).
Download figure:
Standard image High-resolution imageThe impedances show a U-shaped trend with a minimum charge transfer resistance at a lithium content of x ≈ 0.44 for NCM 111 cycled to upper cut-off potentials of 4.2 and 4.4 V vs Li+/Li and at x ≈ 0.38 for 4.6 V. The electrodes cycled to 4.2 V show an overall lower  compared to 4.4 V and 4.6 V. The kinetic relationship proposed by Newman predicts a U-shaped form, but for
  the expected minimum resistance should be at x = 0.5 (gray line in Fig. 9a). More drastically different from the experimental data, however, is the predicted dependence of
  with the lithium content x, which is very weak over a wide range of x (i.e., between x ≈ 0.9-0.1) contrary to the experimental data. It should be noted that the curve shift to lower x values for higher upper cut-off voltages is attributed to the losses from oxygen release and surface reconstruction and are most severe for the electrode cycled to 4.6 V.
To correct the kinetics for the first-cycle irreversible capacity loss of the NCM 111 material, we define an adjusted SOC value (SOCadjusted), whereby 0% SOCadjusted corresponds to the NCM 111 material in its fully lithiated state that is obtained when charged at C/10 (practically full) and 100% SOCadjusted still represents the fully delithiated NCM 111 (theoretically empty, i.e., x = 0). The thus normalized data now show their kinetic minimum at ∼50% SOCadjusted, regardless of cut-off potential or the first-cycle ICL, and are now more closely represented by the Newman-type kinetics. The Newman kinetics (Eq. 6) shown in Figs. 9a and 9b were calculated using the relationship  and then adjusting the remaining offset such that the minimum resistances overlap. For Fig. 9a,
  can be defined as cs = x × cmax nd thus covers the range for SOCtheor, while for Fig. 9b
  is adjusted to mean the individually measured electrodes maximum practically achievable Li-content and thus covers the range of SOCtheor. Mathematically, the two behave exactly the same except over a different range of Li concentration. The gray curves described as
  in Figs. 9a and 9b show the change of
  whereby both
  -values are set to 0.5. The
  curve in Fig. 9b (light gray) was calculated with the
  -values set to 2, changing the curvature of the kinetics, which now overlap much more closely with the experimentally obtained data (shown for the data set with an upper cutoff potential of 4.2 V). The analysis shows that for SOC dependent kinetics, different transfer coefficients from those used for the electrolyte-dependent data would need to be used to match the experimental data. Thus, the definition of
  is not sufficient and needs to be adjusted to separate terms for the liquid and solid concentration, e.g., as

with  being the adjusted value to create the SOCadjusted instead of SOCtheor,
  and
and  It should also be noted that it is not clear which of these coefficients would apply to the Butler-Volmer reaction kinetics (in its original form, not the adjusted form by Newman) and thus which of them would be reflected in the Tafel slope. One factor to explain the difference of this equation to the proposed theory could be the use of concentration instead of activity. The here proposed additional term for the electrolyte saturation could only be explained by a decrease in activity at higher salt concentrations, which would contradict measurements by Landesfeind et al.,
49
who showed an increase in thermodynamic factor (and thus an increase in activity) with increasing salt concentration. Similarly, the high value of 2 for the SOC dependent coefficients could be explained by a change in activity of the intercalated species and presumably can be traced back to changes within the material over the whole range of SOC. Despite these differences, the material still shows a remarkable similarity to the Newman model. Also, the NCM 111 electrodes cycled to an upper cutoff potential of 4.4 and 4.6 V vs Li+/Li show almost identical resistances when plotted vs SOCadjusted in Fig. 9b. Both are expected to have undergone some form of surface reconstruction, and additional growth of structurally different layers into the material due to, in this case, oxygen loss,
14,17
but such expected differences in the outer layer thickness are not reflected in
It should also be noted that it is not clear which of these coefficients would apply to the Butler-Volmer reaction kinetics (in its original form, not the adjusted form by Newman) and thus which of them would be reflected in the Tafel slope. One factor to explain the difference of this equation to the proposed theory could be the use of concentration instead of activity. The here proposed additional term for the electrolyte saturation could only be explained by a decrease in activity at higher salt concentrations, which would contradict measurements by Landesfeind et al.,
49
who showed an increase in thermodynamic factor (and thus an increase in activity) with increasing salt concentration. Similarly, the high value of 2 for the SOC dependent coefficients could be explained by a change in activity of the intercalated species and presumably can be traced back to changes within the material over the whole range of SOC. Despite these differences, the material still shows a remarkable similarity to the Newman model. Also, the NCM 111 electrodes cycled to an upper cutoff potential of 4.4 and 4.6 V vs Li+/Li show almost identical resistances when plotted vs SOCadjusted in Fig. 9b. Both are expected to have undergone some form of surface reconstruction, and additional growth of structurally different layers into the material due to, in this case, oxygen loss,
14,17
but such expected differences in the outer layer thickness are not reflected in  as it is measured at the particle surface alone and the thickness of such a layer should be irrelevant.
SOC dependent EIS analysis—particle solid diffusion resistance Rpart
Figure 10 shows the SOC dependent diffusion resistance in blue (as defined in Fig. 8a, including both liquid and solid phase diffusion resistances) over the adjusted SOC. This diffusion resistance measured here is only of a semi-quantitative nature, as the analysis for actual diffusion would require detailed knowledge about the particle shape and size distribution and requires an appropriate model, as, e.g., shown in Refs. 39, 50. Since the particle size distribution also affects the spectrum shape, an accurate fit of such a spectrum was not possible and the resistance was determined by partly fitting the spectrum for its separator HFR and  and subtracting the resistance from the obtained total real resistance (Re(Z)) of the spectrum. Assuming that the diffusion behavior in solid particles will ultimately lead to a vertical line (pure capacitive behavior) and not a tilted line (as obtained in CPE) in a Nyquist plot, the here defined overall diffusion resistance can be considered as an underestimate, especially at lower SOCs, as described above.
39
Since individual measurements to low frequencies take around 10 h of measurement time, this analysis was only done for the cut-off potential of 4.2 V using an NCM 111 electrode with low-areal capacity (∼0.35 mAh cm−2).
and subtracting the resistance from the obtained total real resistance (Re(Z)) of the spectrum. Assuming that the diffusion behavior in solid particles will ultimately lead to a vertical line (pure capacitive behavior) and not a tilted line (as obtained in CPE) in a Nyquist plot, the here defined overall diffusion resistance can be considered as an underestimate, especially at lower SOCs, as described above.
39
Since individual measurements to low frequencies take around 10 h of measurement time, this analysis was only done for the cut-off potential of 4.2 V using an NCM 111 electrode with low-areal capacity (∼0.35 mAh cm−2).
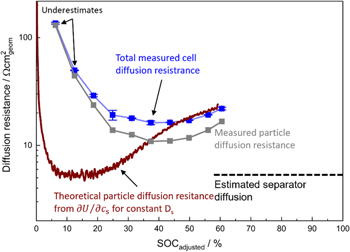
Figure 10. Total measured cell diffusion resistance (blue) extracted from the low-frequency impedance analysis, containing both the separator and the solid lithium diffusion resistance in the NCM 111 particles. Experiments were conducted with low-areal capacity NCM 111 electrodes (∼0.32 mAh cm−2) that were cycled to an upper cutoff potential of 4.2 V vs Li+/Li. The estimated separator diffusion resistance contribution is 5.7 Ωcm2 (marked by the black dashed line) and is independent of the electrode SOC. The particle diffusion resistance (gray) was corrected for the separator diffusion resistance and (for spherical particles) corresponds to 1/5 of the total particle diffusion resistance. Assuming a constant solid lithium diffusion coefficient of 2.2 × 10⁻¹³ m2 s−1, the brown line shows the change in diffusion resistance due to the material-specific changes in the potential slope. The first two resistances at low SOC were obtained from spectra which did not show a capacitive behavior at the lowest frequency and are thus considered underestimates.
Download figure:
Standard image High-resolution imageThe diffusion resistance for such a thin electrode (where the transport resistance in the electrolyte phase within the electrode can be neglected) represents the sum of (i) the liquid Warburg resistance of the separator (as estimated in the Appendix) and (ii) 1/5 of the Warburg resistance of the solid spherical particle  (Eq. 7 below). In the separator, 1 Ωcm2 electrolyte HFR would cause an additional 1.33 Ωcm2 diffusion resistance, which can then be subtracted from the measurement (see Appendix for a detailed explanation). In this case, the observed HFR of 4.0 Ω resistance (for T-cell electrodes with a geometric surface area of 0.94 cm2) would result in 5.32 Ω (or 5.7 Ωcm2) diffusion resistance, so that it can amount to up a third of the total diffusion resistance measured and is therefore not negligible. The particle diffusion resistance
 ![${R}_{{\rm{part}}}\,\left[{{\rm{\Omega }}{\rm{cm}}}_{{\rm{part}}}^{2}\right]$](https://content.cld.iop.org/journals/1945-7111/170/8/080522/revision1/jesacf161ieqn162.gif) with the Warburg resistance of the solid particles is defined as:
39,40
with the Warburg resistance of the solid particles is defined as:
39,40

Here, ![${R}_{{\rm{meas}}}\,\left[{{\rm{\Omega }}{\rm{cm}}}_{{\rm{geom}}}^{2}\right]$](https://content.cld.iop.org/journals/1945-7111/170/8/080522/revision1/jesacf161ieqn163.gif) is the experimentally measured areal diffusion resistance of the projected diffusion surface area ratio Apart [
is the experimentally measured areal diffusion resistance of the projected diffusion surface area ratio Apart [ ] (i.e., the area of the particle if its surface was perfectly smooth, as surface roughness on the outside has no bearing on the diffusion inside the particle),
  is the slope of the open circuit potential (OCV) over the solid concentration change,
  the particle radius, and
  the lithium diffusion resistance in the solid phase.
To calculate a diffusion coefficient, the projected diffusion area of the spherical particles Apart, i.e., the area measured if the surface of the particles was perfectly smooth, therefore not the BET surface area, is needed. For the here used areal capacity of ∼0.32 mAh cm−2 and the specific capacity of 145 mAh g−1 at 4.2 V vs Li+/Li, the areal loading of the NCM 111 CAM is  mg cm−2. With a density of 4.7 g cm−3, the NCM 111 volume gives 0.47
  Assuming a uniform particle radius of 10 μm (spheres), gives a volume of 4.2 ×
  per particle and thus 1.1 ×
  particles and a total particle surface area per geometric electrode surface area of Apart = 1.4
  For comparison, the BET surface area would have yielded 7.8
Correcting the experimentally measured diffusion resistance at ∼40% SOCadjusted (∼16 Ω cm2) for the liquid Warburg (5.7 Ω cm2) gives  10.3 Ω cm2, and thus,
  Taking the local slope at this SOC (1.9 × 10⁻⁵ V/mol/m3
part), the diffusion coefficient for this SOC is calculated to ≈2.8 × 10⁻¹³ m2 s−1, similar to a previously reported value for NCM 111.
50
Assuming this diffusion coefficient to be constant over SOC would result in a theoretically measured diffusion resistance which now only depends on the OCV slope. The brown line in Fig. 10 shows the diffusion resistance which would theoretically be measured if the diffusion coefficient was constant, i.e., the resistance would only depend on the local OCV slope. It shows a distinct minimum in resistance at low SOC, in a region where the experimentally measured resistance is highest. The difference between the theoretically expected diffusion resistance (red line) and the experimentally measured resistance (gray line) can be interpreted as an effective change in diffusion coefficient, assuming the particle morphology is constant (i.e., no reversible particle breathing). Thus, the NCM 111 diffusion coefficient is decreasing by one order of magnitude between the higher and lower SOC, respectively.
Taking the local slope at this SOC (1.9 × 10⁻⁵ V/mol/m3
part), the diffusion coefficient for this SOC is calculated to ≈2.8 × 10⁻¹³ m2 s−1, similar to a previously reported value for NCM 111.
50
Assuming this diffusion coefficient to be constant over SOC would result in a theoretically measured diffusion resistance which now only depends on the OCV slope. The brown line in Fig. 10 shows the diffusion resistance which would theoretically be measured if the diffusion coefficient was constant, i.e., the resistance would only depend on the local OCV slope. It shows a distinct minimum in resistance at low SOC, in a region where the experimentally measured resistance is highest. The difference between the theoretically expected diffusion resistance (red line) and the experimentally measured resistance (gray line) can be interpreted as an effective change in diffusion coefficient, assuming the particle morphology is constant (i.e., no reversible particle breathing). Thus, the NCM 111 diffusion coefficient is decreasing by one order of magnitude between the higher and lower SOC, respectively.
Comparing the diffusion resistance with the charge transfer kinetics, their minima are somewhat aligned between 40%−50% SOCadjusted, and their shape over SOC is similarly U-shaped, with an increase in resistance towards higher degrees of lithiation. A proper diffusion analysis of NCM materials can be difficult, as this material is composed of secondary particles containing small primary particles. Particle breathing over SOC and cracking over cycling changes the effective diffusion length and any analysis would only give an effective diffusion coefficient which might contain additional diffusion from liquid penetrating the particle. 26,30 A thorough analysis of the material diffusion would require spherical single crystal NCM particles of a narrow particle range to get accurate information on the diffusion coefficient. Charbonneau et al. 50 have measured polycrystalline diffusion coefficients via EIS by applying such a model, however only measured the first cycle and the 50th cycle and neglected a correction for the liquid diffusion. This correction is especially necessary if the electrode loading is such that the measured diffusion resistance is in the same order of magnitude as the cell separator resistance, as was the case here for parts of the measured spectra, even though the areal capacity is already considered very low.
Rate test analysis of thin NCM 111 electrodes
The SOC dependent analysis shows the change in kinetics over SOC, which practically become asymmetric due to the partial usage of the material. To understand the influence of the asymmetric kinetics on the rate capability of the NCM 111 material, we performed charge (delithiation) and discharge (lithiation) rate tests with low-area capacity electrodes (∼0.37 mAh cm−2). Figure 11a shows the potential profile of the C/10 and 5C charge (delithiation, green) and discharge (lithiation, red) rate test. As seen previously in Figs. 9 and 10, towards low SOC the charge transfer and the diffusion resistances of NCM 111 increase starkly, whereas these resistances decrease towards higher SOCs, which becomes visible in the decrease in overpotential between the C/10 and 5C delithiation curves over the course of charging (green curves). The opposite effect is visible more severely in the lithiation curves, where the measured capacity is limited much more significantly and the difference between the C/10 and 5C curves (red) increases drastically towards the end of discharge. Figure 11b shows the overall reached capacities of C-rates up to 5C.

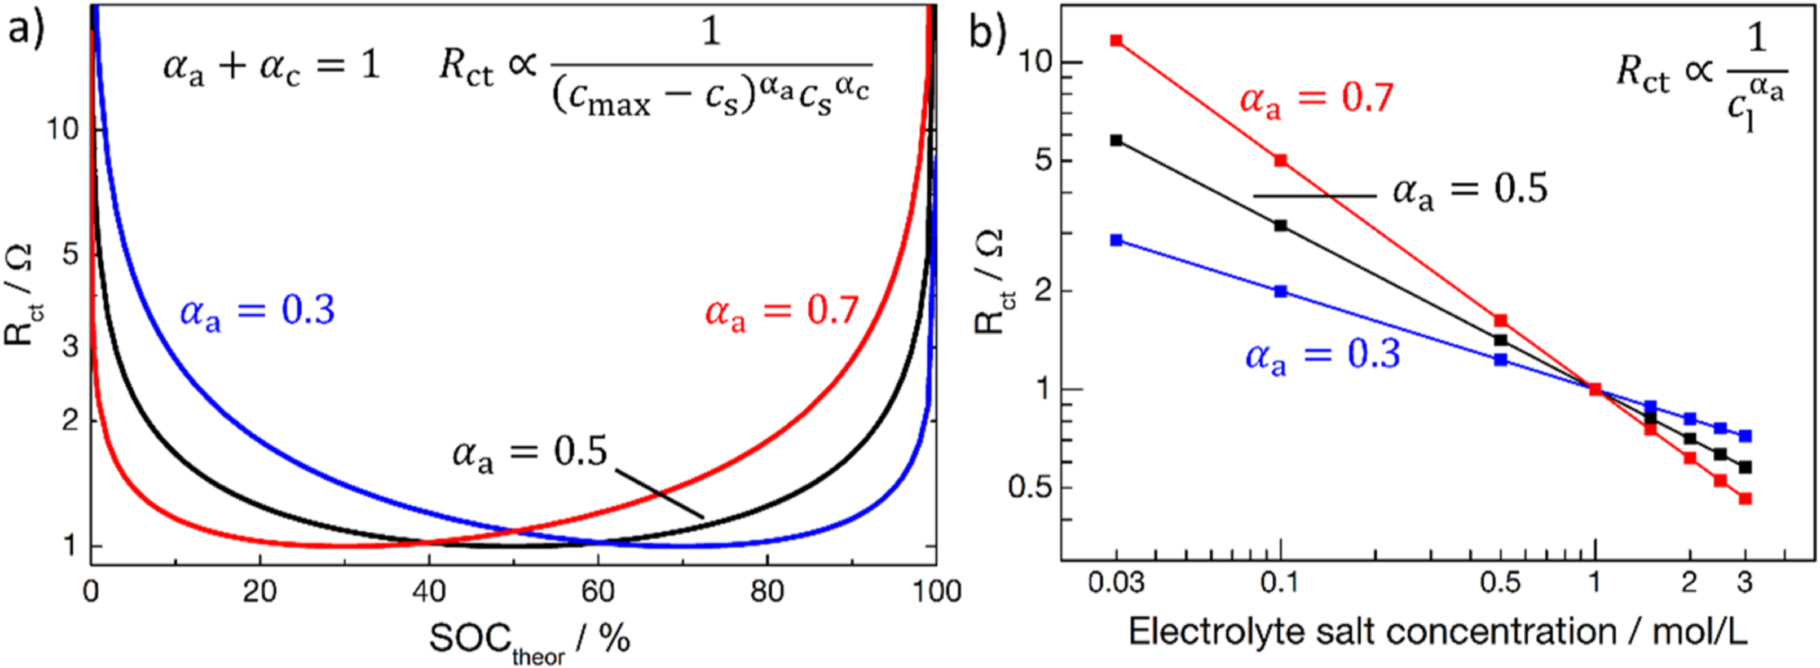
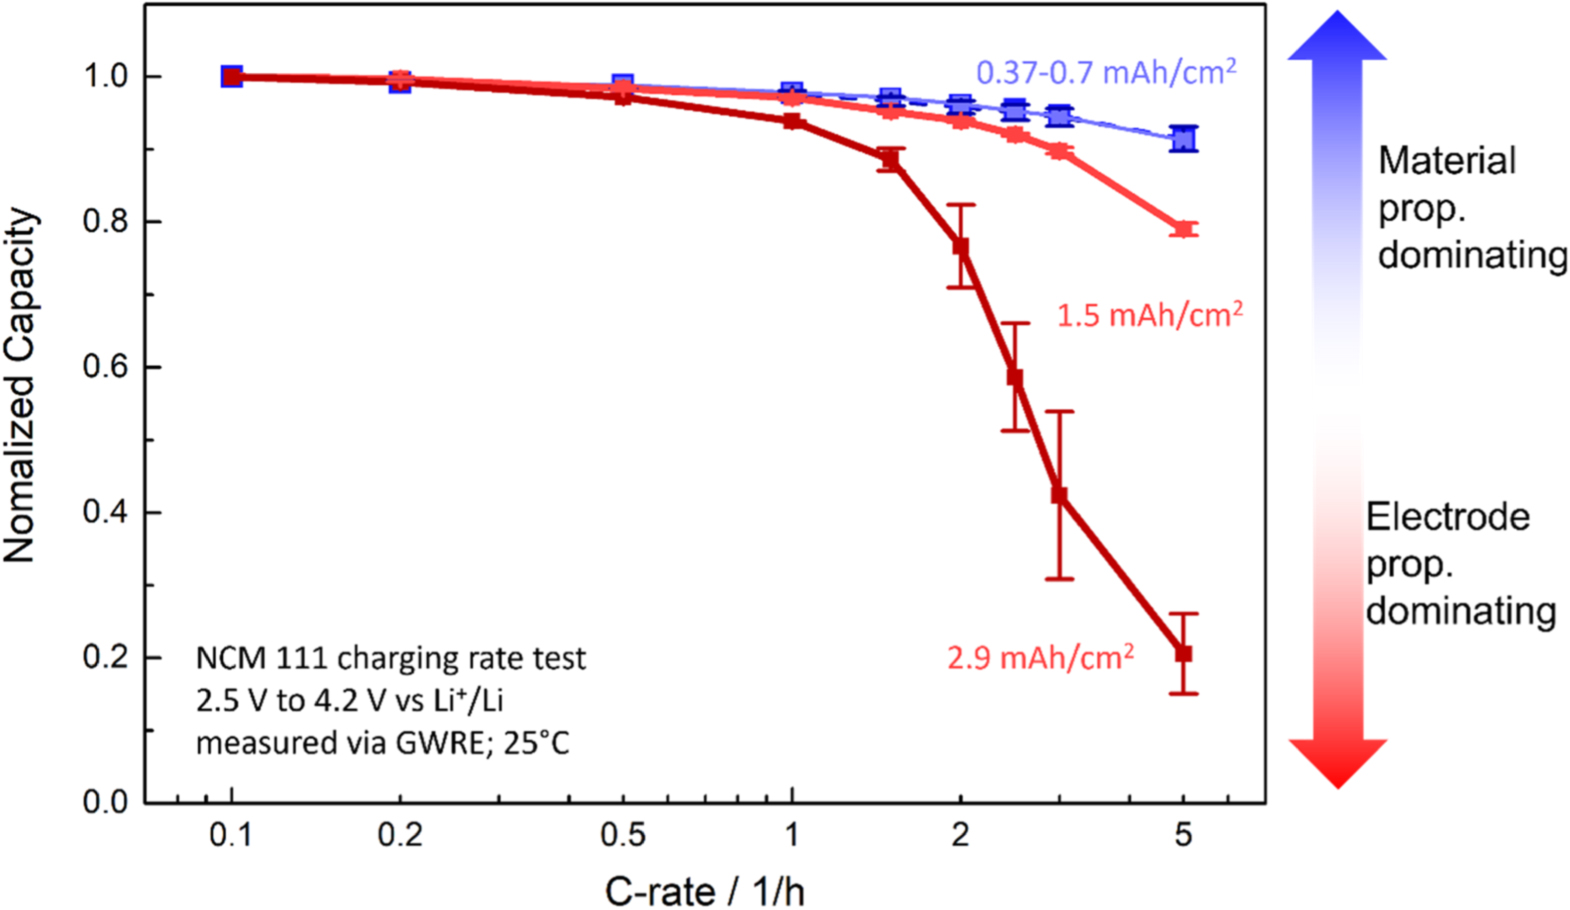
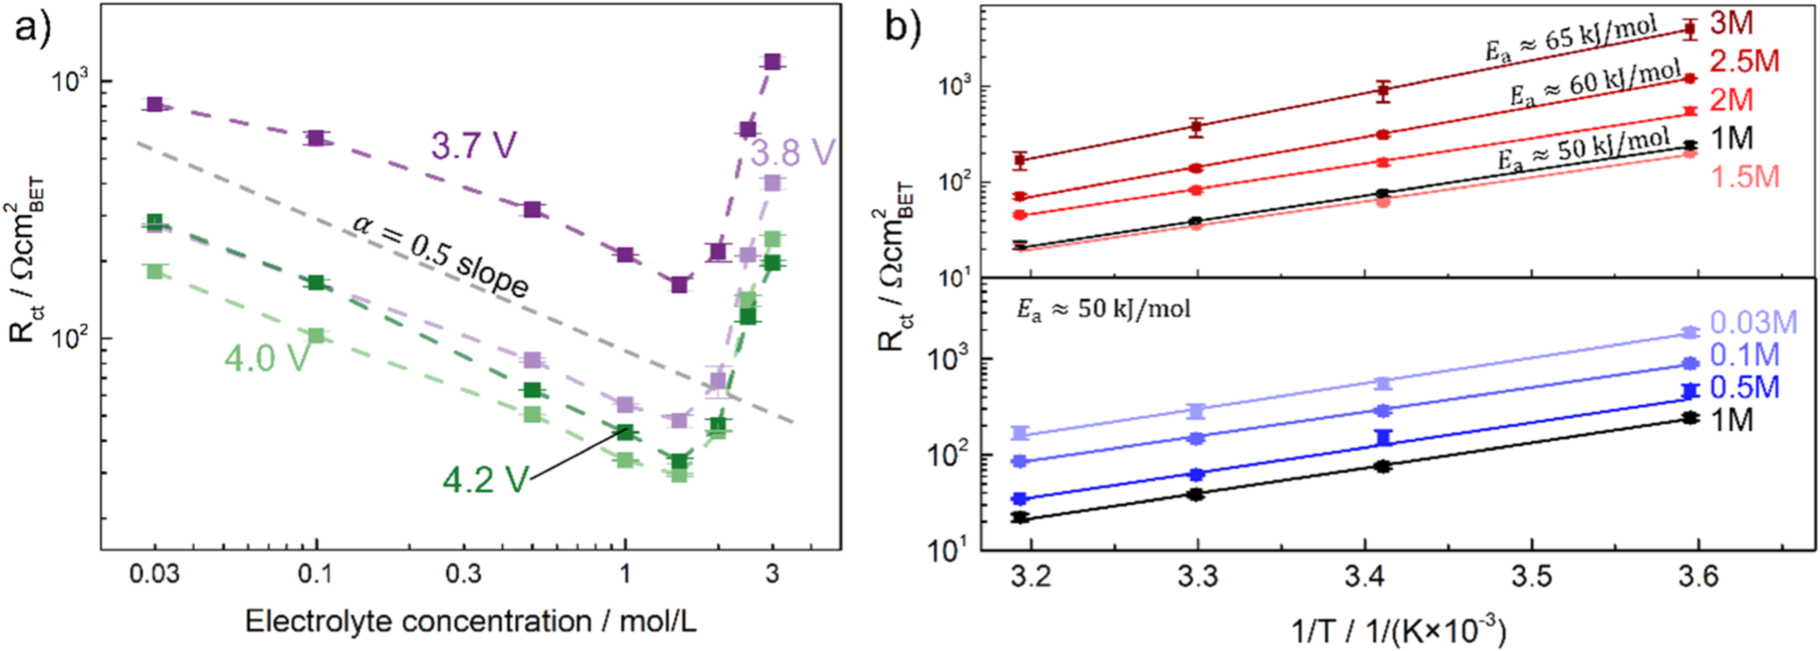
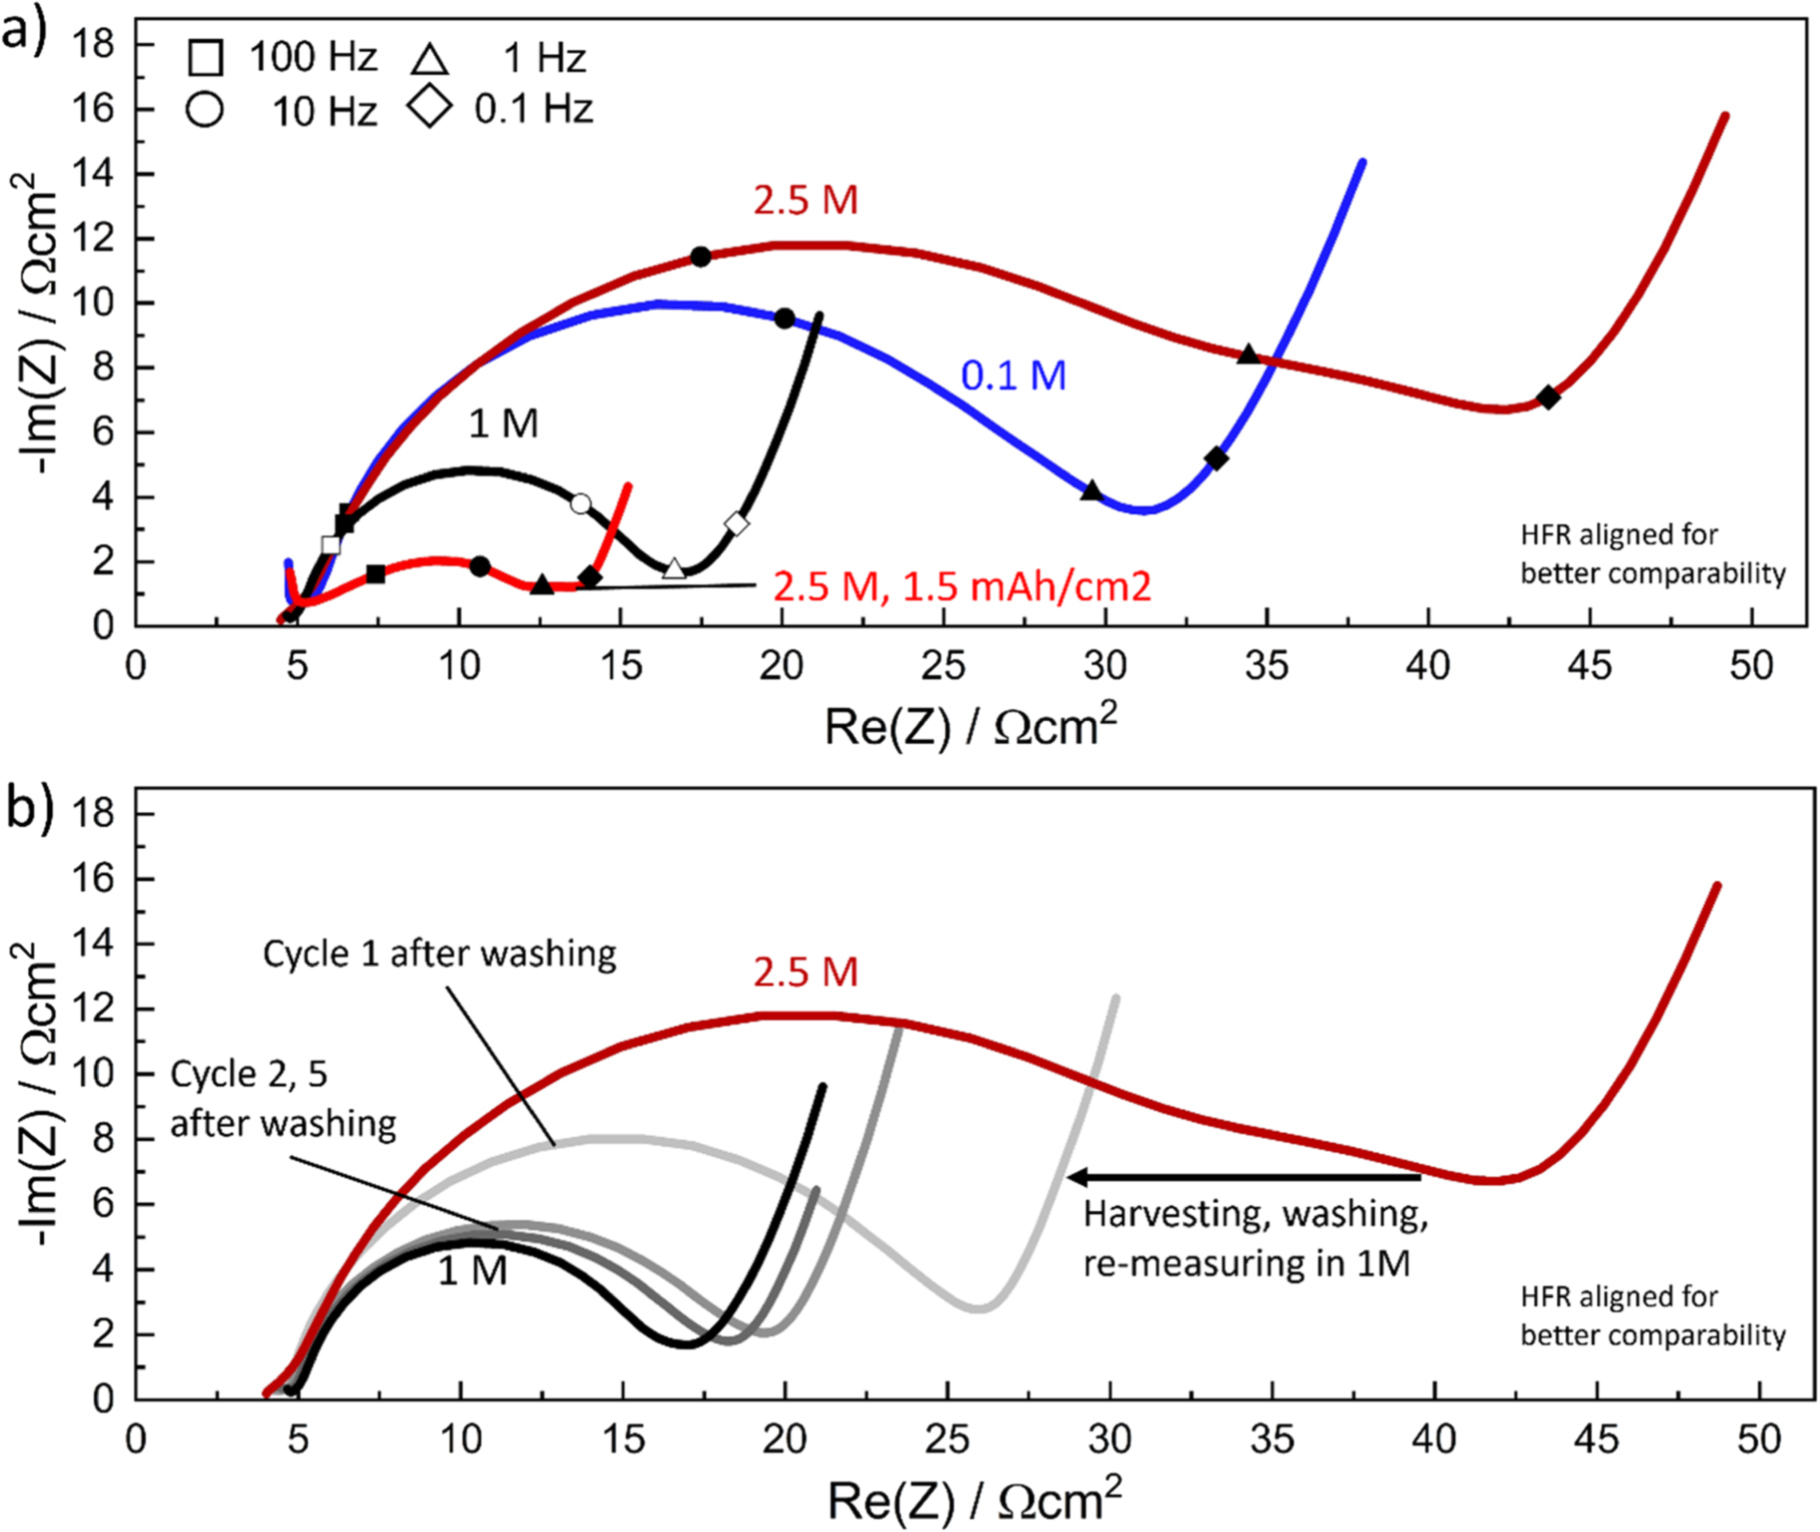
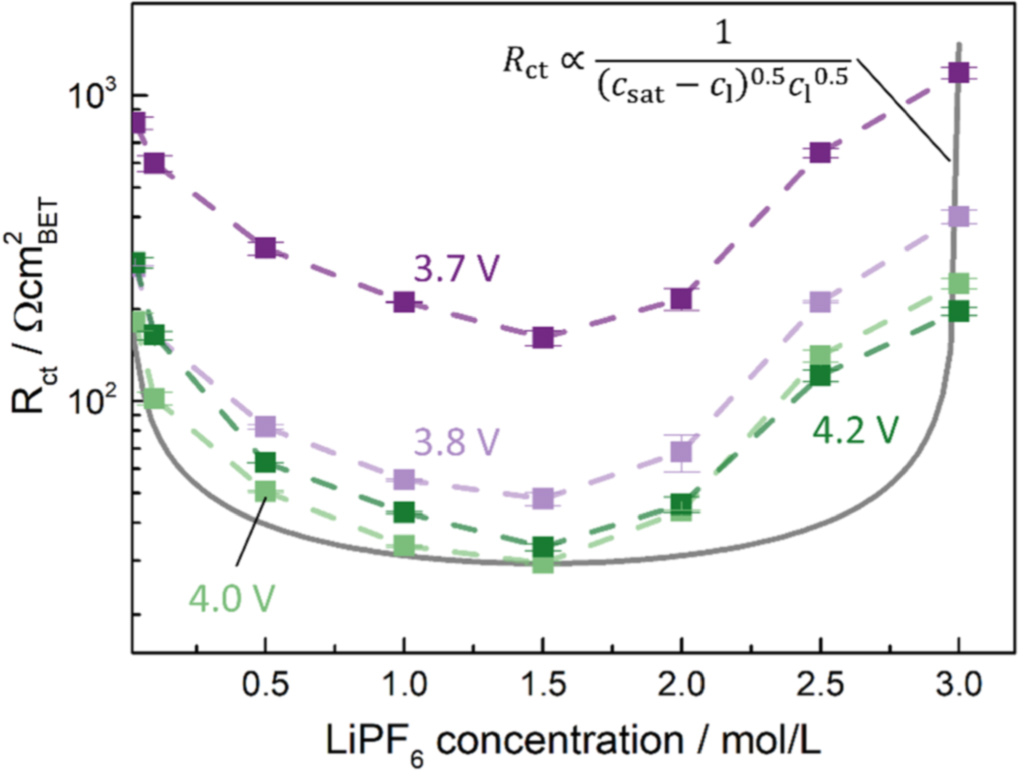
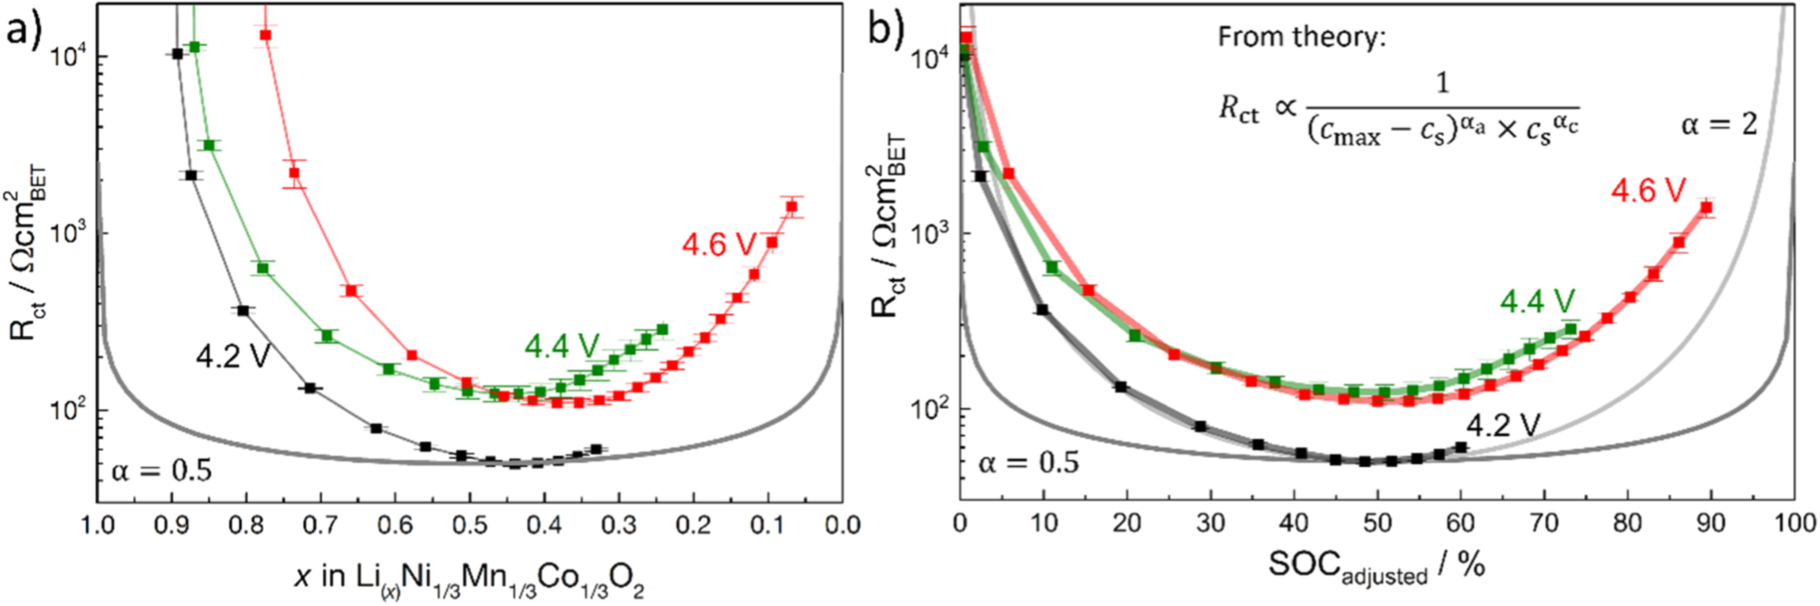
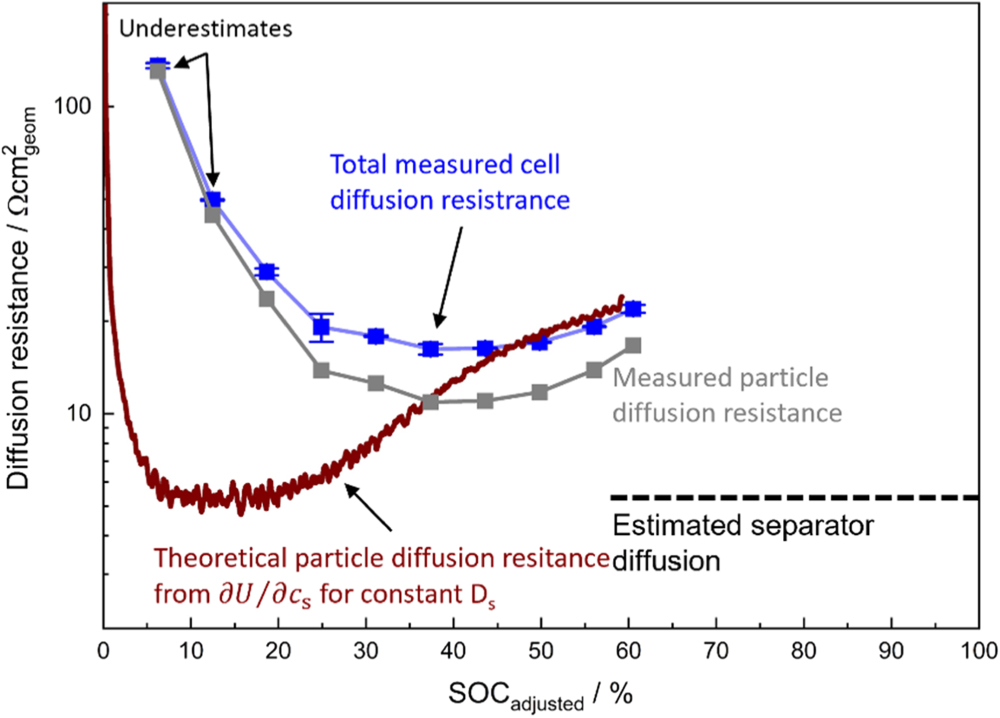
Figure 11. Rate test of thin NCM electrodes with an areal capacity of ∼0.37 mAh cm−2 at 25 °C measured in the self-mixed LP57 electrolyte (1 M LiPF6). (A) Lithiation and delithiation potential curves at C/10 and 5C, showing that during delithiation the kinetics generally become faster, while during lithiation both the charge transfer and diffusion resistance increase towards higher degrees of lithiation, leading to significantly increased overpotentials. (B) Capacities reached between C/10 and 5C for lithiation and delithiation.
Download figure:
Standard image High-resolution image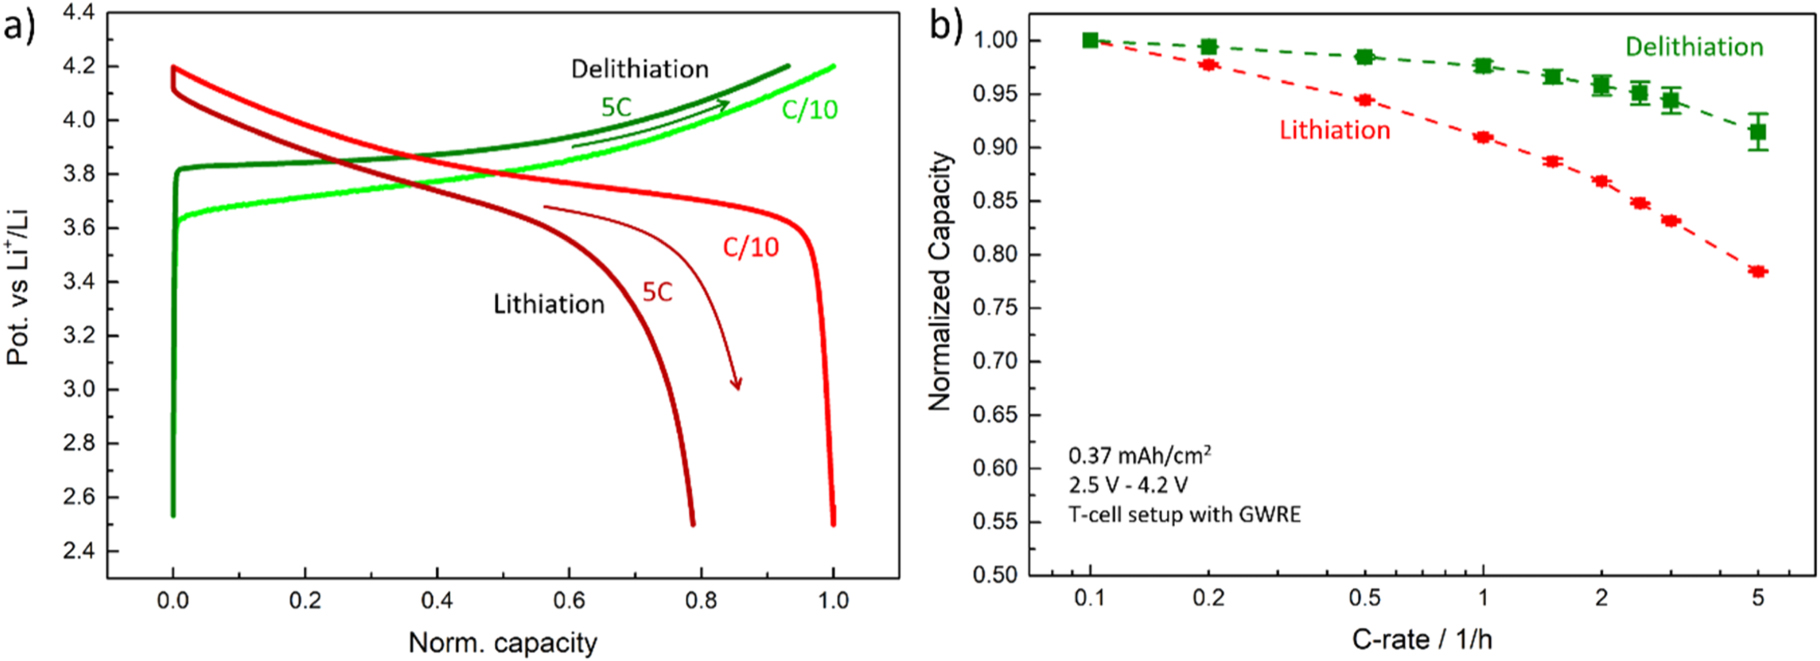
Conclusions
This work shows an electrochemical impedance spectroscopy based kinetic analysis of NCM 111 electrodes. We first give an overview over the kinetic theory which was adapted by Newman for intercalation materials, and served as the basis for comparison throughout the rest of this work. To find a suitable electrode design for the analysis, we then demonstrated the impact of areal capacity on the impedance spectra, especially with regards to the 1 mHz low frequency impedance, showing how lowering areal capacity improves probing the charge transfer kinetics and solid diffusion resistance, which especially for the latter case is sufficient around ∼0.4 mAh cm−2 or below. Rate tests showed that at such low areal capacities the electrode performance becomes independent of the electrode mass loading, once mass transport limitations become negligible and the material properties dominate.
The first step in the kinetics analysis was the electrolyte salt concentration dependent analysis. Generally, the change in kinetics with concentration are described by  with
with  which we show is true for lower electrolyte concentrations between 0.03 M and 1.5 M LiPF6. At higher salt concentrations, up to 3 M, the charge transfer resistance increases contrary to the popularly used expression for liquid electrolytes, but in line with other observations in the literature. To understand if the charge transfer resistance change is a result of a permanent destruction of the NCM 111 surface, we harvested electrodes which were cycled in a 2.5 M electrolyte, washed them, and re-measured them in a 1 M electrolyte. The electrodes regained a lower charge transfer resistance, in line with expected measurements of a 1 M electrolyte, showing that the effect is indeed a kinetic effect and not permanent and therefore needs to be incorporated into the kinetic model. The observations could also be described by a model which incorporates a solvation limit into the electrolyte, similar to the proposed theory for the solid active material. As this effect of increasing charge transfer resistance may be linked to the EC coordination of the salt,
45
our results are only valid for a LiPF6 electrolyte with a 3:7 ratio (wt:wt) of EC to EMC. The lower electrolyte concentrations (0.03 M to 2 M) showed the same activation energy of 50 kJ mol−1 for
which we show is true for lower electrolyte concentrations between 0.03 M and 1.5 M LiPF6. At higher salt concentrations, up to 3 M, the charge transfer resistance increases contrary to the popularly used expression for liquid electrolytes, but in line with other observations in the literature. To understand if the charge transfer resistance change is a result of a permanent destruction of the NCM 111 surface, we harvested electrodes which were cycled in a 2.5 M electrolyte, washed them, and re-measured them in a 1 M electrolyte. The electrodes regained a lower charge transfer resistance, in line with expected measurements of a 1 M electrolyte, showing that the effect is indeed a kinetic effect and not permanent and therefore needs to be incorporated into the kinetic model. The observations could also be described by a model which incorporates a solvation limit into the electrolyte, similar to the proposed theory for the solid active material. As this effect of increasing charge transfer resistance may be linked to the EC coordination of the salt,
45
our results are only valid for a LiPF6 electrolyte with a 3:7 ratio (wt:wt) of EC to EMC. The lower electrolyte concentrations (0.03 M to 2 M) showed the same activation energy of 50 kJ mol−1 for  while at higher salt concentrations (2.5–3 M) the activation energy for
  increased up to 65 kJ mol−1.
The SOC dependent analysis of the charge transfer kinetics, predicted as  showed U-shaped kinetics over the theoretically achievable SOC similar to the predicted values from the Newman model, but showed a significantly steeper slope. Adjusting the definition for SOC due to the practically irreversible capacity loss of the material, but incorporating the theoretically achievable maximum capacity, showed kinetics which were more closely in line with the Newman model. They exhibited symmetric kinetics with a minimum at 50% SOCadjusted, but still require further adjustment of the kinetic transfer coefficients
  from 0.5 to the, less physically defined but experimentally measured, value of 2. The diffusion resistance also follows a U-shaped trend, which, when considering the limited available SOC window of the NCM 111, leads to asymmetric kinetics of the material in practical use. The diffusion and charge transfer resistance increase for higher degrees of lithiation limits the electrode capacity during discharge, as demonstrated in rate capability lithiation and delithiation rate tests.
The measurements showed that in the case of NCM 111, the kinetic transfer coefficients for the liquid phase require an additional term for a solvation limit and behave independently of the transfer coefficients for the solid phase and thus must be treated separately, rather than using one set of parameters for both. We therefore propose an equation for i0 in the form of

with experimentally obtained values of  and
and  and
and  and
and  for the here measured system.
Acknowledgments
R. M. gratefully acknowledges funding by BMW AG. B. S. acknowledges funding by Core Research Grant of SERB (DST), Govt. of India (File no: CRG/2020/005571).
Appendix
Assuming that the Warburg resistance of the separator placed between two thin electrodes will be similar to the Warburg resistance of the same separator placed between two flat lithium foils, we can use the Li-separator-Li setup and associated equations to calculate the potential difference due to diffusion overpotential across the separator. From the diffusion overpotential, we can calculate the Warburg resistance. The Li-Seperator-Li system has the following boundary condition on each side corresponding to the faradaic reaction (i.e., at the interface between liquid electrolyte and Li electrode)

Where x is the axial coordination going from 0 to the thickness of the separator 
 is the transference number and I is the applied current. In this system, at steady state, the concentration gradient in the entire separator will be the same everywhere and can be given by (assuming that applied current is small enough so that the concentration difference across the separator is tiny hence the transport parameters will not vary substantially)

The modified Ohm's law applicable to the system is given below. 5

Here,  is electrolyte potential,
  is the effective electrolyte conductivity which is given by bulk conductivity, electrode porosity and tortuosity, TDF is the thermodynamic factor. The second term on the RHS can be modified using the concentration gradient given by A·2 as below.

While the first term is thought to give the potential drop due to limited conductivity of the electrolyte, the second term in Eq. A·3 can be used to give the potential drop due to diffusion overpotential, hence the Warburg resistance can be calculated using the second term of Eq. A·3 as below.

Using Landesfeind et al.
49
for TDF =1.5,  D = 3E−10 m2 s−1 and
  at 298 K, a 1 cm2 area of 89 μm thickness filled with electrolyte would result in a 1 Ω high frequency resistance (resulting from the electrolyte conductivity). The resulting diffusion resistance would be an additional 1.33 Ω, i.e., every 1 Ω in separator high frequency resistance results in an additional 1.33 Ω in diffusion resistance.